
Stay True to the Sound of History: Philology, Phylogenetics and Information Engineering in Musicology


Department of Information Engineering, University of Padova, via Gradenigo 6/B, 35131 Padova, Italy
*
Author to whom correspondence should be addressed.
Appl. Sci. 2018, 8(2), 226; https://doi.org/10.3390/app8020226
Submission received: 3 November 2017
/
Revised: 9 January 2018
/
Accepted: 29 January 2018
/
Published: 1 February 2018
(This article belongs to the Special Issue Sound and Music Computing)
Abstract
:This work investigates computational musicology for the study of tape music works tackling the problems concerning stemmatics. These philological problems have been analyzed with an innovative approach considering the peculiarities of audio tape recordings. The paper presents a phylogenetic reconstruction strategy that relies on digitizing the analyzed tapes and then converting each audio track into a two-dimensional spectrogram. This conversion allows adopting a set of computer vision tools to align and equalize different tracks in order to infer the most likely transformation that converts one track into another. In the presented approach, the main editing techniques, intentional and unintentional alterations and different configurations of a tape recorded are estimated in phylogeny analysis. The proposed solution presents a satisfying robustness to the adoption of the wrong reading setup together with a good reconstruction accuracy of the phylogenetic tree. The reconstructed dependencies proved to be correct or plausible in 90% of the experimental cases.
1. Introduction
The interesting field of computational musicology is given in relation to the study of tape music, which represents a particular case of recorded sound art with important implications with respect to the preservation side, as well as the musicological analysis side. Tape music consists of the (processed) fragments, samples and speed manipulation of pre-recorded sounds used in modern composition. Since the 1950s, its peculiar working method was made popular by composers of the Columbia-Princeton Electronic Music Center and, in Europe, of the Studio di Fonologia Musicale of RAI Milan [1]. This music cannot be set in conventional notation: the musical text is non-existent, incomplete, insufficiently precise and transmitted in a non-traditional format. The performance of these music works is no longer the traditional one, in which one or more musicians are used to perform a score: the composer becomes also the luthier and the performer of the completed product, recorded on magnetic tape configured as a unicum. The uniqueness of the tape music works tackles a well-known problem in the visual arts field, such as the attribution and the generation of different versions (called witnesses, in the philology field).
In order to achieve scholarly analysis of the musical works, the audio signal, stored in analogue tapes, must be digitized, along with all ancillary information (e.g., text on the box, accompanying material, etc.). The output of this process is the preservation master, the bibliographic equivalent of which is the facsimile or the diplomaticcopy [2,3,4,5,6,7].
The production of a preservation master requires competences from engineering, archivistics and philology. The engineering side of the work consists of, but is obviously not limited to, the development of ad hoc tools that provide solutions both to problems of managerial and philological-documental characters. Van Huis [8] criticizes the general inertia of archival institutions in the face of new technologies, which ignores the potential to reach users familiar with the use of a Google-like search engine and/or a peer-to-peer network (simple, but not authoritative).
This work applied computational musicology to the study of tape music works tackling the problems concerning stemmatics (or the Latin, stemmata):
- constructing the stemma codicum (recension, or the Latin recensio) starting with a set of the sources (all the different witnesses of that musical work);
- selection (or selectio), where the original source is determined by examining variants, selecting the best ones [9].
These studies often use a general-purpose audio editor in order to compare sonograms or wave forms. This paper presents an innovative approach to this problem integrating methodologies typically used in the field of forensic science.
Recent years have witnessed a significant leap forward in sound trace analysis thanks to new processing tools derived from this research field. More precisely, multimedia forensics researchers have been investigating new accurate phylogenetic reconstruction strategies to be applied on unordered sets of similar digital audio/image/video contents [10,11,12]. Such availability, which has been fostered by the recent disposal of versatile acquisition, editing and sharing tools, poses the problem of discriminating the original file, identifying the owner or reconstructing the processing history of each copy. To these purposes, forensic researchers have been borrowing some of the analysis strategies from phylogenetic biology. The underlying idea is that multimedia contents can “mutate” as organisms evolve: a digital image or an image can change over time to slightly different versions of itself, which can generate other versions, as well [13]. These different versions are referred to as near-duplicates (ND). The generation process of sets of ND images or video sequences can be well described by means of a structure called an image or video phylogeny tree (IPT or VPT), and several algorithms have been recently proposed in the literature to reconstruct it [14,15,16]. Most of the proposed solutions analyze the relations between similar contents and infer the subset of links that correctly represents the chains of dependencies and transformations. Although, in the last few years, several works have been targeting the analysis of images and video contents, little effort has been put toward audio phylogenetic approaches. To the best of our knowledge, the only algorithms proposed in the literature are represented by [12,17]. Moreover, the phylogenetic analysis problems have been extensively investigated for digital multimedia contents since online material offers the largest datasets of near-duplicate contents. The investigation of phylogenetic approaches involving audio-visual contents stored on magnetic carriers is still at its earliest stages. In the end, multimedia phylogenetic strategies have been employed for copyright infringement detection and fake material identification; their use in cultural heritage and multimedia restoration is one of the novelty aspects presented by this paper.
The authors propose in the following sections an automated approach to stemmatics, applying a phylogenetic evolutionary framework to music digital philology. Different witnesses (audio files) are analyzed by software developed by the authors and then grouped according to their shared characteristics, listed in a tree in order to derive relationships between them (Figure 1). The current paper presents a novel methodology that automatizes the creation of such a dependency tree and proves to be sufficiently robust to acquisition errors (wrong reading speed or setup). The proposed solution relies on collecting the tapes to be analyzed into a set of digital audio tracks and representing them by means of two-dimensional spectrograms. After aligning them using computer vision strategies, it is possible to infer the most likely transformation interlying between them and to characterize it via a dissimilarity metric. Such dissimilarity metrics are then used to characterize the edge weights of a complete graph where nodes correspond to the acquired audio tracks. By running a minimum spanning tree (MST) algorithm, it is possible to estimate the phylogenetic tree that links the different contents.
Experimental data show that the proposed solution permits reconstructing the underlying story of each tape with good accuracy; moreover, the reconstruction process is not affected by digitization errors such as a different reading speed, wrong equalization and filtering. The results achieved show that this methodology gives a precise answer to the questions about the reliability of audio recordings as document witnesses, clarifying the concept of fidelity to the original.
In the following, the paper is organized as follows. Section 2 overviews some of the related works in the literature, while Section 3 describes how the phylogenetic reconstruction problem can be applied to magnetic tapes. Then, the full methodology is presented in Section 4, together with the reconstruction algorithm that permits estimating the audio phylogenetic tree (APT). This strategy is then evaluated on an experimental dataset (described in Section 5), and the obtained results are reported and discussed in Section 6. Section 7 draws the final conclusions.
2. Related Works
Many scholars ([18]; for an overview, see [19]) in the musicology field tackle the problems concerning stemmatics in their study of tape music works. As briefly outlined in the Introduction, these studies often use a general-purpose audio editor and are based on the comparison of sonograms or wave forms. However, other works based on computational musicology exist: Nicola Orio and co-workers [20,21,22] presented a tool to analyze the similarities and the differences of two witnesses of a music work. A graphical representation of the alignment curve, which matches pairs of points in the two signals in a bi-dimensional representation, gives a direct view of the main differences between two witnesses: by matching individual musical events, it is possible to compare the lengths of the events, the amplitude envelopes and the two spectral representations.
On the other hand, the audio phylogenetic field has been limitedly explored. Although several phylogenetic approaches for images and videos have been recently proposed, thus far, digital audio phylogeny research is taking the firsts steps.
A first approach was proposed by Nucci et al. in [12], where the authors designed a strategy to reconstruct the processing history of a set of near-duplicate (ND) audio tracks. According to the formulation given in [23], a near-duplicate is a transformed version of an object that remains recognizable; the audio tracks in [12] were generated via trim, fade and perceptual audio coding with a closed set of parameter values. A different set of values is then used in the analysis phase to compute the dissimilarity metric between couples of tracks. The proposed solution permits obtaining a good accuracy, but requires a significant computational effort; moreover, its efficiency is limited by the assumption of knowing the set of applied transformations.
A more flexible and computationally-efficient approach was proposed in [17]; in this latter approach, audio tracks are time- and frequency-aligned by representing each audio file with a spectrogram and using image registration techniques investigated in the field of computer vision. Moreover, the set of possible transformations includes time-frequency operations, as well. By employing highly-optimized computer vision libraries, the proposed algorithm requires a significantly lower computational load while not being constrained by a closed set of transformations. Such versatility suggested adopting that approach in this work, as well. The following sections will provide further details.
3. Problem Description
Tape music is a genre of electroacoustic music in which the artwork coincides with the tape on which the audio signal is recorded [6]. In some cases, the composer did not provide a score; hence, the tape could be considered the final product of the creative process. The carrier has therefore a prominent role and must be considered in the philological analysis [18,24]. The peculiarity of this type of analogue carrier is the possibility of editing the tape with several techniques. The main ones are introduced in [25], where the described techniques vary from straight recording to superimposition. Some of the main alterations considered in this paper are presented below.
The editing consists on the physical alterations of the tape that is cut in pieces and then recomposed to obtain the desired sound or effect. Every piece is joined with the rest of the tape in a splice by using a strip of plastic coated with a thermal or pressure-sensitive adhesive called splicing tape [26]. As recommended in [27], the tape has to be cut at an angle of 45° to 60°, measured with respect to the tape edge in order to avoid electrical disturbance. Without this disturbance, it is very difficult to find the slice by analyzing the audio track, and it could only be hypothesized if the audio content suddenly changes.
In some cases, the splice does not join two pieces of magnetic tape, but one side consists of a leader-tape. It is a flexible plastic or paper strip that usually is spliced to either end of a roll of recording material [26]. In this case, the leader-tape extends the tape length in order to fasten the extremities of the tape to the hub of the flange and avoid wasting the magnetic tape that can be read entirely. In the creative process, the leader-tape is also important because it could be used inside the tape with several purposes, such as adding pauses or signaling new events or units.
Silence parts could be also obtained by erasing previous recordings. The erasing head could be used to clean the tape before recording a new audio signal. Furthermore, as described in [25], a new signal could be recorded over the old one using superimposition. The result of these techniques is the sum of the two signals. In this paper, these techniques are generally referred to as overdubbing.
All these alterations are irreversible and create new versions of the opera, which in philology are called witnesses. As outlined in the Introduction, this paper presents an innovative approach to the musicological analysis using phylogenetic techniques, typically adopted in forensics, in order to reconstruct the stemma codicum, which can be considered as an audio phylogenetic tree (APT) [17].
Nevertheless, the analysis is performed in the digital domain and not in the analogue one. This introduces a variable to the phylogenetic problem described in [17]: the digitization. An analogue tape can be read and digitized several times, creating similar digital versions of a unique document. These versions can differ from each other in the configuration of the tape recorder, in the quality of the Analog-to-Digital (A/D) converters and in the digital format on which the signal is saved. This study considers recorder configuration only, as the other options are not connected to the analogue carrier and thus not necessary in order to create a suitable model that takes into account the audio tape peculiarities.
The most important parameter to be configured in the tape recorder during the listening and the digitization process is the replay speed. Six standard speeds are used: 30 ips (76.2 cm/s), 15 ips (38.1 cm/s), 7.5 ips (19.05 cm/s), 3.75 ips (9.525 cm/s), 15/8 ips (4.76 cm/s) and 15/16 ips (2.38 cm/s) [28]. The wrong choice of this parameter implies a time stretch and a pitch change that heavily distort the signal. To be thorough, this effect was used in electroacoustic music as a technique for altering the signal on purpose [25], but this aspect goes beyond the analysis of this work.
Another important parameter to be set in the tape recorder is the equalization: a post-equalization curve is applied during the reading, in order to compensate the pre-equalization curve applied during the recording, essentially acting as the integrator to make the overall transfer function nearly flat [29]. Several standards exist, and they are commonly called using the name of the association that proposed the standard. For 30 ips, the most diffused is the standard AES derived by Audio Engineering Society, whereas for 15 ips and 7.5 ips the most used standards are CCIR and NAB, from International Radio Consultative Committee (in French) and National Association of Broadcasters, respectively [30,31,32].
Applying the wrong post-equalization curve implicates the wrong frequency response and, thus, a non-flat overall transfer function.
Furthermore, the recording may be encoded with a noise reduction system. The most common are Dolby A and Dolby SR (professional), Dolby B and Dolby C (domestic) and dbxTypes I (professional) and II (domestic) [28]. When reading the tape, the same noise reduction system must be used in order to compensate the one adopted in the recording phase. Again, the lack of compensation or the wrong system choice deeply changes the signal. In this paper, only the former problem is tackled, together with the opposite case: the use of a noise reduction system in the decoding phase when the original system was not encoded.
Considering the combination of all these configurations, it is evident how many different digitized versions of the same tape could be obtained. The approach proposed in this work handles this aspect considering all the versions of the same tape as a single node in the phylogenetic tree.
The problem could be further extended considering multiple copies recorded and digitized with different tape recorders and the possibility of finding some audio documents obtained by pieces of tape recorded by different machines (professional or not). In this case, the analogue filters and characteristics of tape recorders could lead to differences in digitized copies. The same could happen with machines that were not correctly calibrated. A further variable that could be considered in the analysis is the possibility of having different copies of the same tape and the presence of damage and/or syndrome (such as SSS [7]) that impact the digitization results, creating dissimilarities and artifacts despite the original tape being the same. This extension has been provided to better explain the overall complexity of the problem, but it goes far beyond the scope of this article, which seeks to prove the effectiveness of this new approach with respect to the problem with a simplified model that nonetheless includes the main alterations.
4. Algorithms
In this work, we propose an innovative approach to tape music phylogeny, based on the application of computer vision techniques to the time-frequency representation of audio tracks. The core idea consists of mapping the digital audio signals obtained from the tapes into bi-dimensional images. Consequently, the employment of a robust feature extraction algorithm permits gathering a set of local spectral fingerprints, which can be exploited in order to align pairs of spectrogram images. This alignment makes it possible to compare different tracks and estimate which tape editing operation (if any) interlies between them.
A similar strategy has been adopted in [33,34] to identify and retrieve different digital copies of the same audio tracks. In these cases, spectrogram-based features are used to determine whether the track matches or not. The phylogenetic approach departs from such a problem since its aim is to parameterize the similarity between two audio tracks, i.e., how much they differ. As a matter of fact, it is necessary to design a correct and effective registration algorithm for the two analyzed signals, as well as accurate equalization techniques that permit compensating the dissimilarity associated with reading/writing operations. The wrong equalization leads to noisy dissimilarity values, implying the wrong reconstruction of the dependencies.
Given a set of N audio tracks, the core idea of the proposed algorithm is to characterize the dissimilarity between each couple of digital audio tracks. This procedure yields the creation of a dissimilarity matrix , where denotes the dissimilarity between the i-th and the j-th tracks. As a consequence, dissimilarity computation is repeated for each one of the possible ordered pairs . Then, the algorithm builds a complete directed graph where nodes correspond to the analyzed set of tracks and edge weights are the computed dissimilarity values.
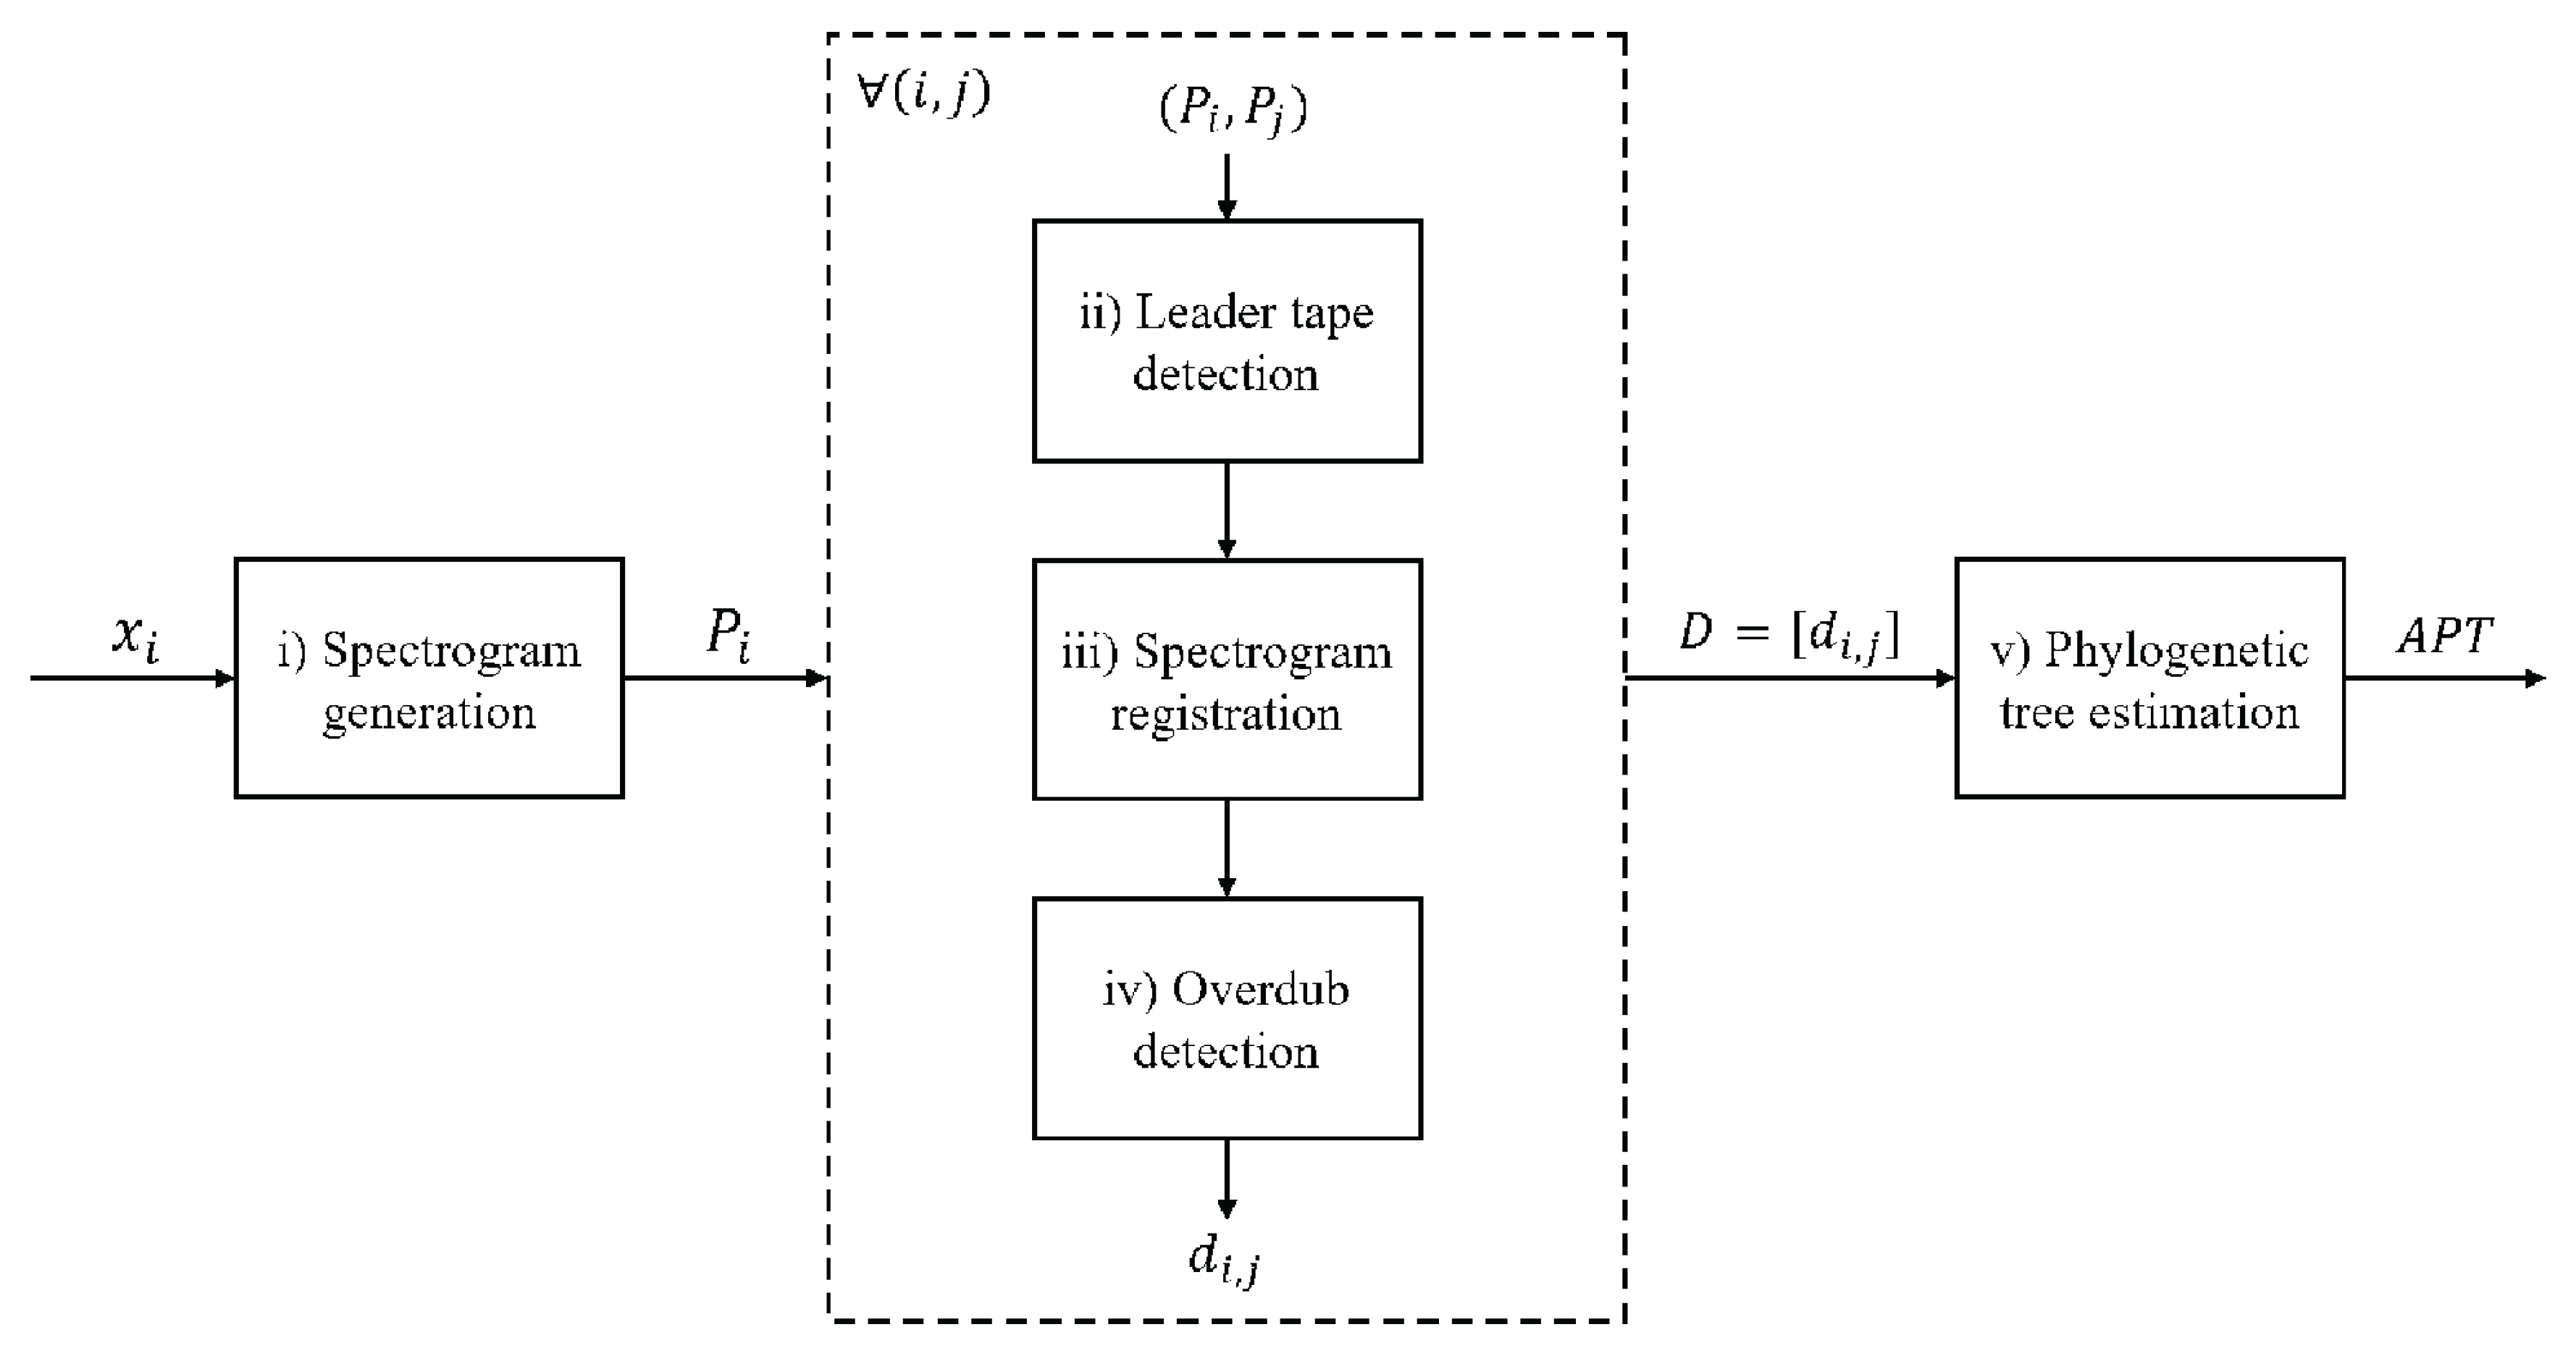
The description of the proposed strategy can be divided into the following steps or units (Figure 2): (i) pre-processing; (ii) leader-tape detection; (iii) spectrogram registration; (iv) overdub detection; (v) estimation of the phylogenetic tree.
The following paragraphs present a detailed description of each step.
4.1. Audio Pre-Processing
At first, each audio track is converted into the related spectrogram by computing the short-time Fourier transform:
where is a windowing function and L is the stride parameter. Coefficients are computed for a finite set of frequencies f and a finite set of M windows (). In our experiments, we adopted Hamming-windowed frames of 4096 samples, with an overlap rate of 0.75, and a set of linearly-spaced frequencies, ranging from 0 to 6 kHz. This latter choice allows one to reduce the computational burden (by reducing the size of images to process by a factor of four) without affecting the system performance, given that most of the spectral information is usually found at a low frequency.
By associating each spectrogram coefficient to the pixel of a grayscale image , we obtain a gray level image, where the pixel intensity is obtained by converting the value into an 8-bit integer. In order to remove part of the background noise, if , the pixel is set to zero.
From the obtained spectrogram image , a set of keypoints with the related descriptors is computed by using the speeded-up robust features (SURF) algorithm [35].
After the pre-processing step, each image pair , , , , is passed to the next modules.
4.2. Leader Tape Detection
Considering two spectrograms, , this step aims at detecting the presence of a leader-tape inserted into one of the two tapes. This detector relies on the fact that, whether or not a leader is present, there is not a single affine transformation that maps the keypoints found on onto those of . The reason is that keypoints lying in the portion of the spectrogram after a leader-tape insertion will carry an offset in their time coordinates with respect to those found on a spectrogram that does not contain such insertion.
The algorithm proceeds as follows.
- From two sets of keypoints , find a subset of matched pairs by comparing the related descriptors. Given the matched pairs , estimate the optimum geometric transform mapping onto with the RANSAC algorithm [36]. If a leader-tape is present, the set of inlier points returned by the algorithm will converge to a subset of keypoints belonging to only one of the two portions of the spectrogram separated by the leader (Figure 3).
- Define a function counting the number of keypoints detected in for each image column v (in order to avoid strong oscillations, is processed with a moving-average low-pass filter). Then, define as the number of inlier points left on after the RANSAC algorithm. In the presence of a leader insertion, distance shows an evident step that can be detected by looking for gradient peaks.
- Let be the coordinate associated with the detected step. Define the following sets:i.e., the subsets of keypoints found on the left side (L) and on the right side (R) of the spectrogram with respect to the candidate leader location. Similarly, define and .
- Perform a new geometric transform estimation, on the left and right portion of the images separately, according to the subdivision defined in (2). The estimated models come in the form of homography matrices, and , from which it is possible to extract the translation components along the v direction, and . The length of the candidate leader is then given by:If , the algorithm concludes that a leader-tape is present within the current spectrogram pair.
Finally, the algorithm tries to infer the correct phylogenetic relation that links and , namely whether was derived from by inserting a leader-tape or vice versa. This can be achieved by measuring the average spectral energy around the detected location, knowing that leader insertions are characterized by a very low-energy region in the related spectrogram. If we find a significant difference between the average energies measured in the two images (with respect to a suitable tolerance threshold), it is possible to conclude that the phylogenetic ancestor is the the one related to the highest energy content. Specifically, the algorithm distinguishes the two following cases.
If , then is assumed to be the phylogenetic ancestor. The dissimilarity matrix is updated with , indicating that a phylogenetic relation from i to j is not possible. The algorithm stops the analysis of the current image pair and switches to the next one.
Otherwise, if or , the algorithm proceeds with the next steps.
4.3. Spectrogram Registration
Spectrogram registration consists of warping towards according to the geometric transform estimated through their matched keypoints.
- If a leader-tape has been detected in , compensate it on by adding a band of black pixels centered in and with length .
- Estimate the global geometric transform H by running RANSAC on all keypoints.
- Warp towards according to H, obtaining .
- Compute the dissimilarity value as the MSE of and :where U and V are the spectrograms’ height and width in pixels.
4.4. Overdub Detection
This second detection step deals with the identification of an overdub in the analyzed tapes. It is positioned after the registration module, as it requires the spectrogram pair to be already aligned.
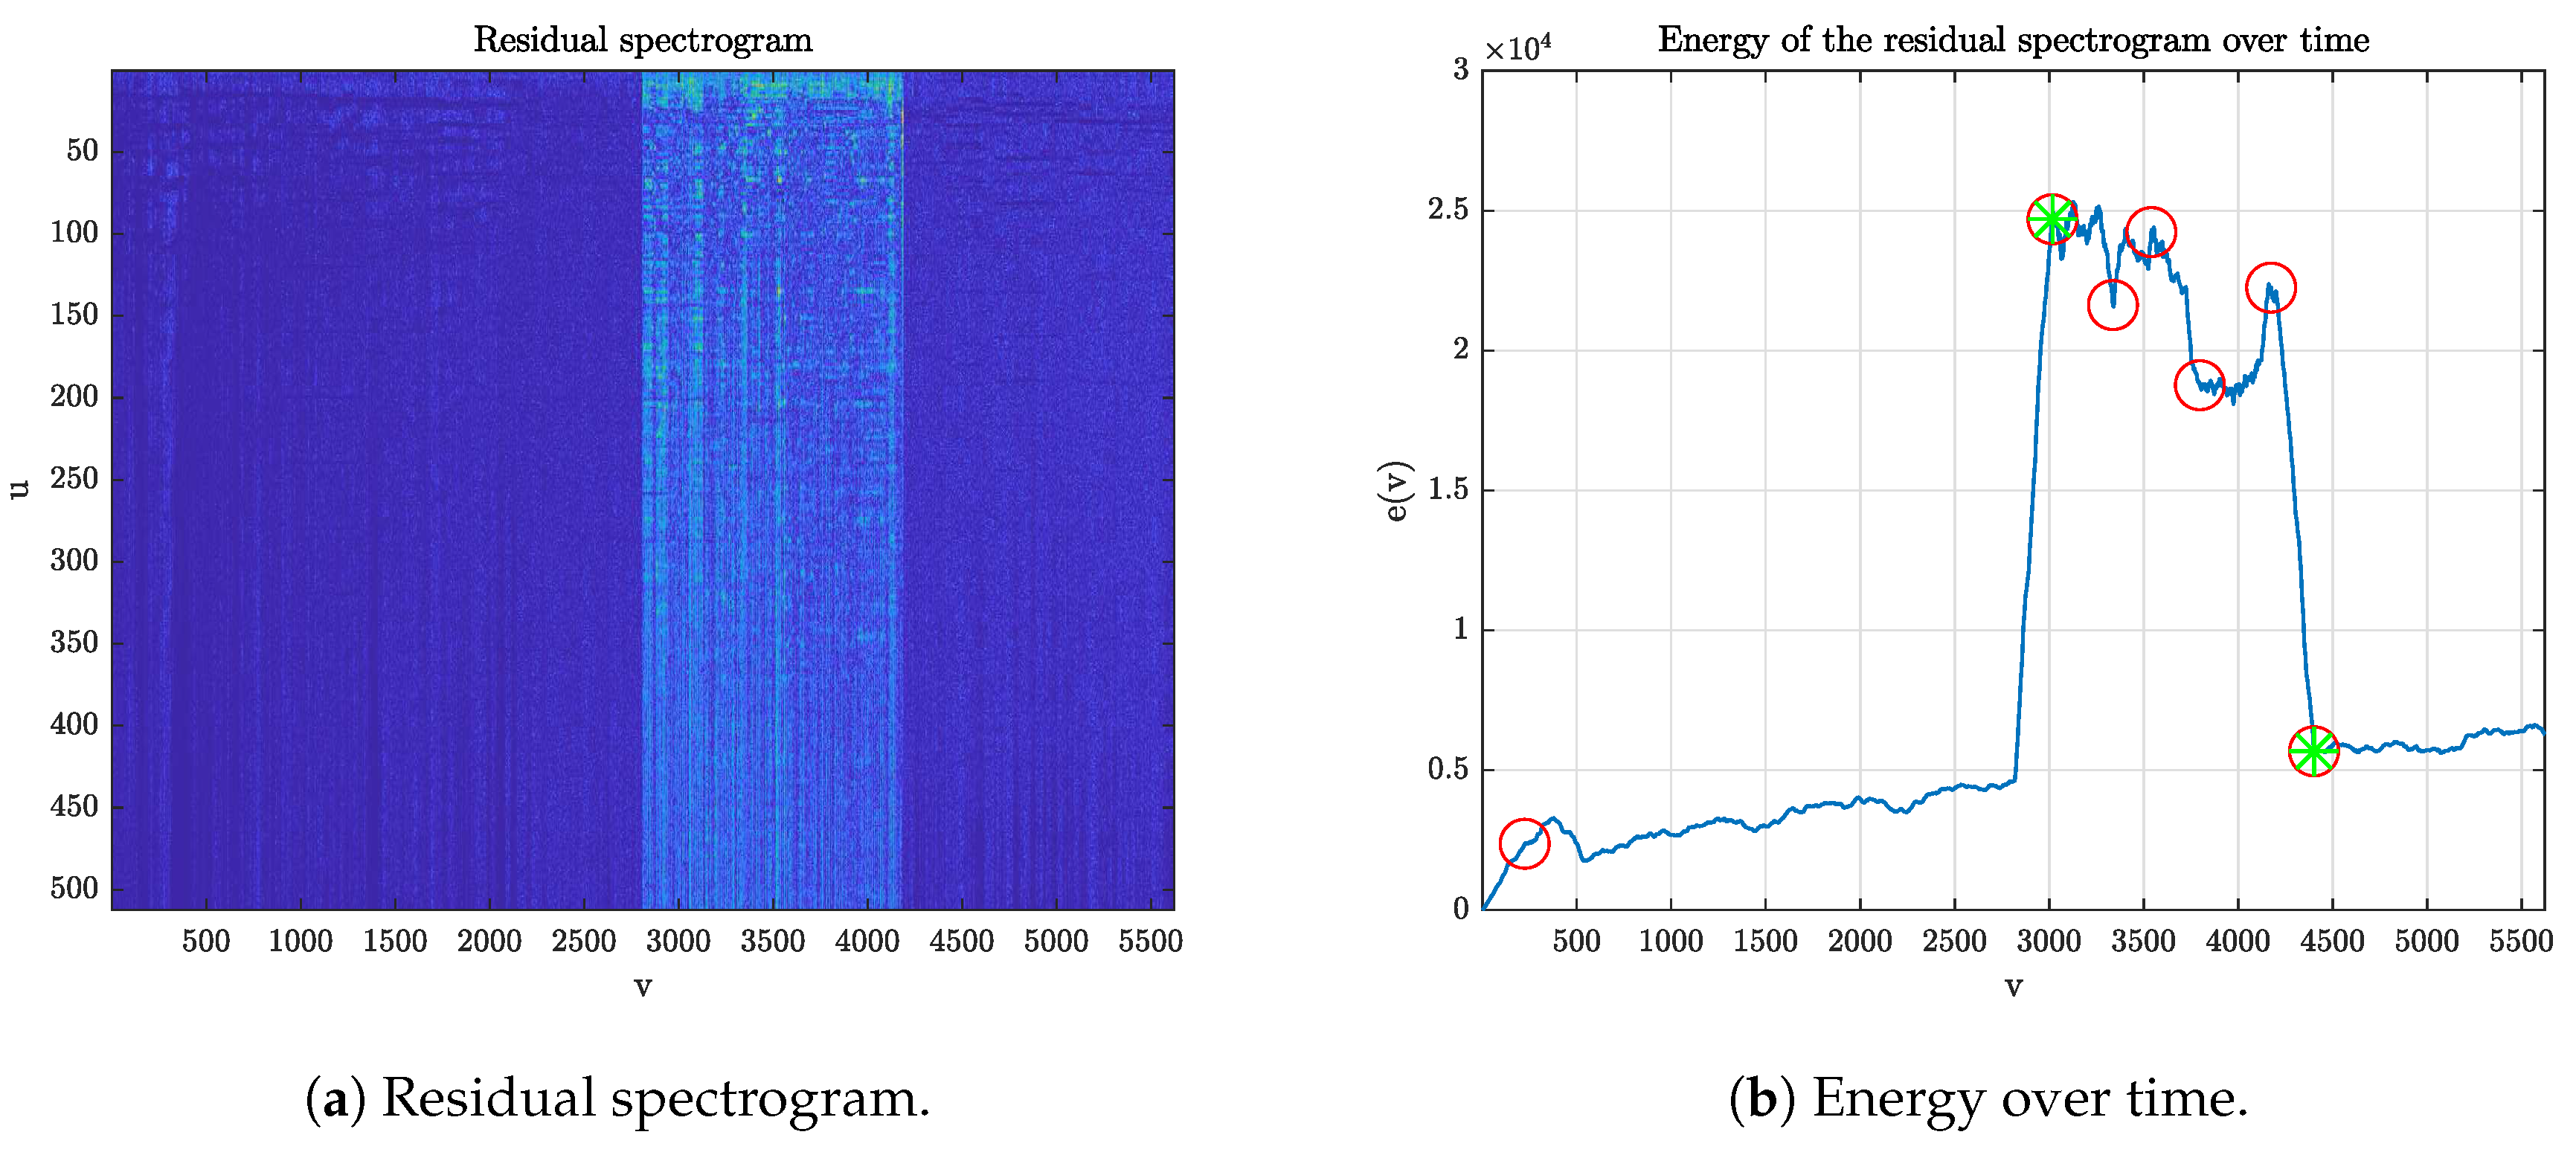
- Compute the residual spectrogram as the pixel-wise absolute difference of and (Figure 4a).
- Define the function representing the energy content of the residual spectrogram over time.
- Look for strong variations in the residual energy by computing the first derivative and applying an outlier detector (three scaled MAD from the median, where MAD denotes the median absolute deviation), obtaining a set of points (Figure 4b).
- Process the points in order to obtain the interval corresponding to the candidate overdub. The employed criterion is that of selecting the couple of points which maximizes the average energy ratio between the regions inside and outside those points.where denotes the expectation of for .Given a detected overdub spanning from to , the algorithm tries to infer the phylogenetic relation. Again, we compare energy statistics inside and outside the overdub region, but in this case, we consider and , instead of .
- Scan through the spectrogram rows . For each u, compute:which represent the discrepancies between average spectral energy inside and outside the overdubbed region, in and , for each frequency sub-band (row), u. The spectrogram presenting a higher for the majority of rows u is assumed to be the overdubbed one, i.e., the phylogenetic descendant.
In a similar way to what is done in the leader detection step, if j is chosen as the ancestor of i, the algorithm sets . Otherwise, the dissimilarity value computed in (4) is kept.
4.5. Tree Estimation
Once the dissimilarity value has been computed for every , the algorithm analyzes the resulting dissimilarity matrix D in order to estimate the phylogenetic tree.
- Starting from the matrix D, build an undirected graph with N nodes, where the i-th node is associated with the audio track and each edge exists if and only if and .
- Run a maximal clique algorithm on , obtaining .
- Compute the clique-dissimilarity matrix as:where denotes the cardinality of a clique.
- Starting from the matrix , build a complete directed graph , with K nodes, where every node is a clique of the undirected graph and each edge has a weight equal to , corresponding to the average dissimilarity between the audio tracks belonging to the p-th and the q-th cliques.
- Compute the phylogenetic tree as the minimum spanning arborescence , i.e., the directed rooted spanning tree with minimum weight.
5. Dataset
The experiment used to assess the algorithm described in the previous section is based on 10 tests, where the most significant sequences of transformations (with respect to the tape music case) were applied to a set of 10 different tracks. For each track, a set of seven audio samples was created applying different acquisition setups and different tape editings, which will be described in the following paragraphs. We have selected the most representative case study operation in the tape music field in order to provide an accurate evaluation of the proposed method. The sequence of transformations can be characterized by a phylogenetic tree where each edge corresponds to a physical editing of the tape (a cut, the insertion of leader-tape) and each node can include several recording and reading settings. In the latter case, the tape was not modified, and therefore, it cannot be considered as a child in the phylogenetic sense. In the following, we will describe both the adopted reading/writing parameters, together with the tape editing settings.
The original digital audio track was generated recording a 2-min track on a virgin magnetic tape using a professional open reel-to-reel tape recorder: Studer A810. This machine provides four recording/replay speeds: 30 ips, 15 ips, 7.5 ips and 3.75 ips. The Studer A810 provides also a switchable knob to change the equalization. Table 1 shows the time constants of the equalizations for each speed; it is possible to notice that, at 30 ips, the only standard equalization is AES, whereas for other speeds, the CCIR or NAB standards can be applied. Furthermore, at 3.75 ips, only one equalization curve is available. During the recording phase, an external noise reduction system DBXType I was used.
Table 2 shows the original tracks from which the two-minute samples were extracted and the configuration of the machine during the recording phase.
The first samples created for each tree consist of the digitization of the recorded samples, without any alteration, read with the correct parameter setting. These represent the roots for the respective trees. All the other samples differ from the roots for at least one alteration of the tape or different parameter in the configuration of the machine. The alterations tested in the experiments are:
- addition of a leader-tape within the tape;
- overdub with silence or with another track;
- addition of a splice within the tape.
The latter is obtained cutting the tape at 90° and then joining together the two sides with a splicing tape. Every alteration is chosen randomly and implicates a node in the lower levels of the tree.
Since the writing parameters are unknown to the analyst, the reading setup at the digitization must be guessed. As a matter of fact, our datasets include multiple digitizations of the same tape where the parameters were selected randomly. This choice leads to the availability of multiple digital copies of the same content, which need to be acknowledged as one and fused into one node in the reconstructed phylogenetic tree.
6. Results and Discussion
The proposed methodology was validated by considering three different metrics: (i) accuracy of the leader-tape detector; (ii) accuracy of the overdub detector; (iii) comparison of the estimated phylogenetic tree with the ground-truth.
The performance of the two detection modules are measured and presented here in terms of the probabilities of correct-detection and false-positive, as obtained from the employed dataset. Results are shown in Table 3, where denotes the correct-detection probability for alteration A and denotes the false-positive probability.
Leader-tape detection turns out to be highly reliable, with a solid 90% rate of correct-detection and no false-positives at all. Overdub detection represents a more complex problem. On the one hand, in some cases, the detector is not able to correctly identify the presence of an overdub, as its spectral fingerprint does not appear sufficiently visible with respect to the background noise or the overdub interval limits are not sufficiently sharp in the difference of the spectrograms. On the other hand, it was observed that cases might occur in which different kinds of tape alterations (e.g., presence/absence of DBX or different equalizations) may produce artifacts that might be confused with those left by an overdub (false-positive).
However, the estimation of the phylogenetic tree does not strictly require 100% accuracy of the detectors. In fact, the tree reconstruction process involves the dissimilarity matrix as a whole, which means that it is usually robust to local noise and errors, as long as the algorithm has gathered enough information.
Since the validation dataset consisted of relatively small trees, results were obtained by qualitatively inspecting the estimated structures in comparison to the ground-truth. Three possible outcomes were observed.
- In 50% of the cases, the estimated tree perfectly reproduces the ground-truth. Specifically, all the tracks sharing the same tape modifications (leader-tape and/or overdub) are collected in the same clique, and the resulting cliques are correctly ordered in the phylogeny sense.
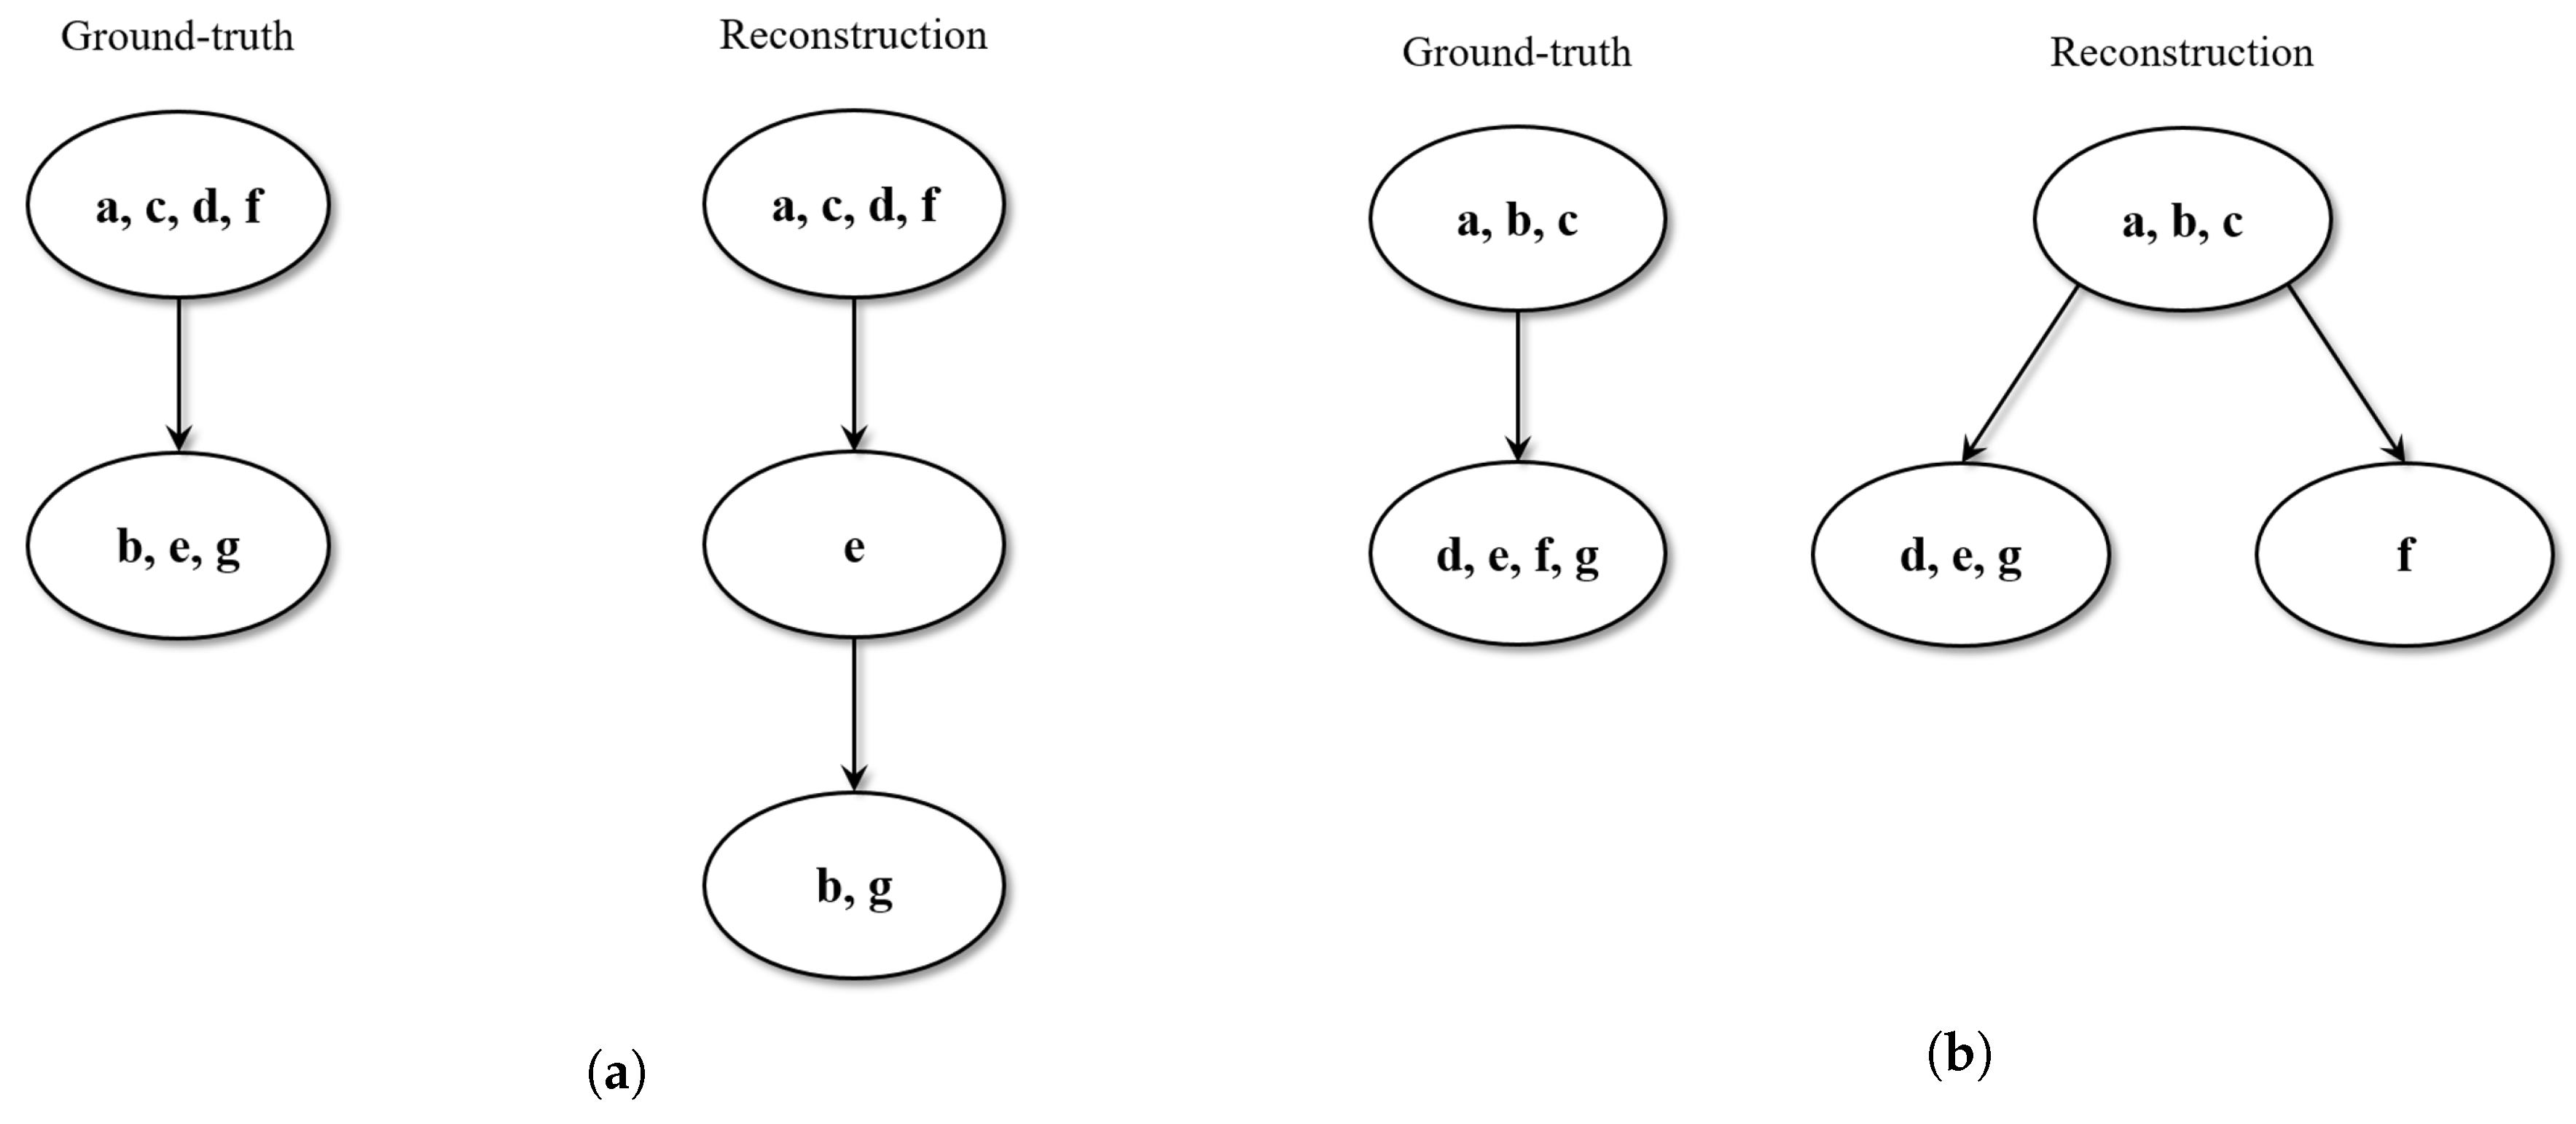
- In 40% of the cases, the estimated tree is not identical to the ground-truth, but still makes sense in phylogeny terms. For instance, in some cases, it is possible to observe that certain cliques result in being over-clustered: tracks that should belong to the same meta-node are split into more nodes, which can be siblings or in a parent-child relationship. However, the relative depths in the tree structure are maintained, and the overall phylogenetic sense is preserved. Figure 5 reports a couple of examples of this scenario.
- In 10% of the cases, the estimated tree shows some wrong phylogenetic relations (ancestor-descendant swaps) with respect to the ground-truth.
Finally, it is important to underline that this result assessment does not take into account alterations due to the addition of splices. The performed experiments, in fact, showed that these alterations are barely visible in the spectrogram images, or at least easily confused with other regular spectral features, making their detection problematic within a computer-vision framework. Therefore, ground-truth trees were re-designed by merging the clusters of nodes induced by a splice with their phylogenetic parents, and consequently, the algorithm was expected to reconstruct the trees accordingly.
7. Conclusions
Phylogenetic analysis of tape music is a new emerging branch of computational musicology, which requires new automatized and accurate tools to reconstruct the generation history of different copies of the same audio content. The paper has presented a phylogenetic reconstruction strategy, which relies on digitizing the analyzed tapes and then converting each audio track into a two-dimensional spectrogram. This conversion allows adopting a set of computer vision tools to align and equalize different tracks in order to infer the most likely transformation that converts one track into another. In the presented approach, overdubs, cuts and the insertion of a leader-tape were considered, as these are among the most likely transformations to be estimated in tape phylogeny. The proposed solution presents a satisfying robustness to the adoption of the wrong reading setup (i.e., with speed, equalization and filtering different from those adopted in the creation of the tape), together with a good reconstruction accuracy of the phylogenetic tree. The reconstructed dependencies proved to be correct or plausible (i.e., the temporal order of the audio content is respected in the estimated phylogenetic tree) in 90% of the experimental cases.
Future research work will be devoted to extending the proposed approach to a widened set of editing techniques, intentional and unintentional alterations, and configurations, as well as different tape recorders and syndromes. Moreover, the investigation activity has also highlighted the need for designing new objective evaluation metrics that permit measuring the accuracy of tree reconstruction in the tape music phylogeny context. Machine learning algorithms, such as the ones described in [40], could be used to enhance the phylogenetic algorithms. The same analysis can be applied to a more heterogeneous set of analogue physical support (including vinyl records, phonograph cylinders, etc.) with the final aim of a complete tool for musicological analysis of digitized analogue recordings.
Acknowledgments
The work has been supported by the Phylo4n6 project prot.BIRD165882/16, funded by the University of Padova, Italy.
Author Contributions
Sebastiano Verde designed the adopted software and performed the experimental setting. Niccolò Pretto prepared the experimental dataset, which was used in testing the proposed approach. Simone Milani supervised the software preparation and investigated the state-of-the-art in multimedia phylogeny. Sergio Canazza supervised the creation of the experimental dataset and investigated the state-of-the-art in tape computational musicology. All the authors contributed to the writing of the paper.
Conflicts of Interest
The authors declare no conflict of interest.
References
- Pousseur, H. Ecrits Théoriques, 1954–1967; Editions Pierre Mardaga: Sprimont, Belgium, 2004. [Google Scholar]
- Canazza, S. The digital curation of ethnic music audio archives: From preservation to restoration. Int. J. Digit. Libr. 2012, 12, 121–135. [Google Scholar] [CrossRef]
- Bressan, F.; Canazza, S. A Systemic Approach to the Preservation of Audio Documents: Methodology and Software Tools. J. Electr. Comput. Eng. 2013, 2013, 21. [Google Scholar] [CrossRef]
- Bressan, F.; Rodà, A.; Canazza, S.; Fontana, F.; Bertani, R. The Safeguard of Audio Collections: A Computer Science Based Approach to Quality Control—The Case of the Sound Archive of the Arena di Verona. Adv. Multimedia 2013, 2013, 14. [Google Scholar] [CrossRef]
- Bressan, F.; Canazza, S.; Rodá, A.; Bertani, R.; Fontana, F. Pavarotti Sings Again: A Multidisciplinary Approach to the Active Preservation of the Audio Collection at the Arena di Veronach to the Active Preservation to the Active Preservation of the Audio Collection at the Arena di Verona. J. New Music Res. 2013, 42, 364–380. [Google Scholar] [CrossRef]
- Canazza, S.; Fantozzi, C.; Pretto, N. Accessing tape music documents on mobile devices. ACM Trans. Multimedia Comput. Commun. Appl. 2015, 12, 20. [Google Scholar] [CrossRef]
- Fantozzi, C.; Bressan, F.; Pretto, N.; Canazza, S. Tape music archives: From preservation to access. Int. J. Digit. Libr. 2017, 18, 233–249. [Google Scholar] [CrossRef]
- Van Huis, E. What makes a good archive? IASA J. 2009, 24, 25–28. [Google Scholar]
- Timpanaro, S. The Genesis of Lachmann’s Method; University of Chicago Press: Chicago, IL, USA, 2005. [Google Scholar]
- Milani, S.; Fontana, M.; Bestagini, P.; Tubaro, S. Phylogenetic analysis of near-duplicate images using processing age metrics. In Proceedings of the 2016 IEEE International Conference on Acoustics, Speech and Signal Processing (ICASSP), Shanghai, China, 20–25 March 2016. [Google Scholar]
- Milani, S.; Bestagini, P.; Tubaro, S. Video phylogeny tree reconstruction using aging measures. In Proceedings of the 2017 European Signal Processing Conference (EUSIPCO 2017), Kos, Greece, 28 August–2 September 2017. [Google Scholar]
- Nucci, M.; Tagliasacchi, M.; Tubaro, S. A phylogenetic analysis of near-duplicate audio tracks. In Proceedings of the 2013 IEEE 15th International Workshop on Multimedia Signal Processing (MMSP), Pula, Italy, 30 September–2 October 2013; pp. 99–104. [Google Scholar]
- Kennedy, L.; Chang, S.F. Internet image archaeology: Automatically tracing the manipulation history of photographs on the web. In Proceedings of the ACM International Conference on Multimedia (ACM-MM), Vancouver, BC, Canada, 26–31 October 2008. [Google Scholar]
- de O. Costa, F.; Oikawa, M.A.; Dias, Z.; Goldenstein, S.; de Rocha, A.R. Image Phylogeny Forests Reconstruction. IEEE Trans. Inf. Forensics Sec. 2014, 9, 1533–1546. [Google Scholar]
- Dias, Z.; Goldenstein, S.; Rocha, A. Exploring heuristic and optimum branching algorithms for image phylogeny. J. Vis. Commun. Image Represent. 2013, 24, 1124–1134. [Google Scholar] [CrossRef]
- Melloni, A.; Bestagini, P.; Milani, S.; Tagliasacchi, M.; Rocha, A.; Tubaro, S. Image phylogeny through dissimilarity metrics fusion. In Proceedings of the European Workshop on Visual Information Processing (EUVIP), Paris, France, 10–12 December 2014. [Google Scholar]
- Verde, S.; Milani, S.; Bestagini, P.; Tubaro, S. Audio phylogenetic analysis using geometric transforms. In Proceedings of the 2017 IEEE International Workshop on Information Forensics and Security (WIFS), Rennes, France, 4–7 December 2017. [Google Scholar]
- Zattra, L. The Assembling of Stria by John Chowning: A Philological Investigation. Comput. Music J. 2007, 31, 38–64. [Google Scholar] [CrossRef]
- Sallis, F.; Bertolani, V.; Burle, J.; Zattra, L. Live-Electronic Music. Composition, Performance and Study; Routledge: London, UK, 2017. [Google Scholar]
- Orio, N.; Snidaro, L.; Canazza, S.; Foresti, G.L. Methodologies and tools for audio digital archives. Int. J. Digit. Libr. 2009, 10, 201–220. [Google Scholar] [CrossRef]
- Canazza, S.; Orio, N. Digital preservation and access of audio heritage: A case study for phonographic discs. In Proceedings of the 13th Conference on Digital Libraries, Corfu, Greece, 27 September–2 October 2009; pp. 451–454. [Google Scholar]
- Orio, N.; Zattra, L. ACAME—Analyse Comparative Automatique de la Musique Electroacoustique; Musimediane: Paris, France, 2009. [Google Scholar]
- Joly, A.; Buisson, O.; Frelicot, C. Content-Based Copy Retrieval Using Distortion-Based Probabilistic Similarity Search. IEEE Trans. Multimedia 2007, 9, 293–306. [Google Scholar] [CrossRef]
- De Benedictis, A.I. Scrittura e supporti nel Novecento: Alcune riflessioni e un esempio (Ausstrahlung di Bruno Maderna). In La Scrittura Come Rappresentazione del Pensiero Musicale; Borio, G., Ed.; ETS: Pisa, Italic, 2004; pp. 237–291. [Google Scholar]
- Dwyer, T. Composing With Tape Recorders: Musique Concrete for Beginners; Oxford University Press: London, UK, 1971. [Google Scholar]
- AES. AES Recommended Practice for Audio Preservation and Restoration—Storage and Handling—Storage of Polyester-Base Magnetic Tape; AES: New York, NY, USA, 1997; (r2012). [Google Scholar]
- Eilers, D.A. Splicing Tapes and Their Proper Application. J. Audio Eng. Soc. 1968, 16, 472–476. [Google Scholar]
- Bradley, K. IASA TC-04 Guidelines in the Production and Preservation of Digital Audio Objects: Standards, Recommended Practices, and Strategies, 2nd ed.; International Association of Sound and Audio Visual Archives: Aarhus, Denmark, 2009. [Google Scholar]
- Mallinson, J.C. Tutorial review of magnetic recording. Proc. IEEE 1976, 64, 196–208. [Google Scholar] [CrossRef]
- Camras, M. Magnetic Recording Handbook; Van Nostrand Reinhold Co.: New York, NY, USA, 1988. [Google Scholar]
- National Association of Broadcaster. Magnetic Tape Recording and Reproducing (Reel-to-Reel); National Association of Broadcasters: Washington, DC, USA, 1965. [Google Scholar]
- International Electrotechnical Commission. BS EN 60094-1:1994 BS 6288-1: 1994 IEC 94-1:1981—Magnetic Tape Sound Recording and Reproducing Systems—Part 1: Specification for General Conditions and Requirements; International Electrotechnical Commission: Geneve, Switzerland, 1981. [Google Scholar]
- Zanoni, M.; Lusardi, S.; Bestagini, P.; Canclini, A.; Sarti, A.; Tubaro, S. Robust music identification approach based on local spectrogram image descriptors. In Proceedings of the 142nd AES Convention, Berlin, Germany, 20–23 May 2017; p. 9763. [Google Scholar]
- Williams, D.; Pooransingh, A.; Saitoo, J. Efficient music identification using ORB descriptors of the spectrogram image. EURASIP J. Audio Speech Music Proc. 2017, 2017, 17. [Google Scholar] [CrossRef]
- Bay, H.; Ess, A.; Tuytelaars, T.; Gool, L.V. Speeded-up robust features. Comput. Vis. Image Underst. 2008, 110, 346–359. [Google Scholar] [CrossRef]
- Fischler, M.A.; Bolles, R.C. Random sample consensus: A paradigm for model fitting with applications to image analysis and automated cartography. Commun. ACM 1981, 24, 381–395. [Google Scholar] [CrossRef]
- Chu, Y.J.; Liu, T.H. On the shortest arborescence of a directed graph. Sci. Sin. 1965, 14, 1396–1400. [Google Scholar]
- Edmonds, J. Optimum branchings. J. Res. Natl. Bur. Stand. 1967, 71B, 233–240. [Google Scholar] [CrossRef]
- Studer. Studer A810—Operating and Service Instruction; Studer: Zurich, Switzerland, 2018. [Google Scholar]
- Micheloni, E.; Pretto, N.; Canazza, S. A step toward AI tools for quality control and musicological analysis of digitized analogue recordings: Recognition of audio tape equalizations. In Proceedings of the 11th InternationalWorkshop on Artificial Intelligence for Cultural Heritage Co-Located with the 16th International Conference of the Italian Association for Artificial Intelligence (AI*IA 2017), Bari, Italic, 14–17 November 2017. [Google Scholar]
Figure 1.
Example of near-duplicates (witnesses). In the middle of the tape (a) has been added a piece of leader-tape obtaining the modified version (b); The difference between the two versions can be clearly observed comparing the corresponding spectrograms (c,d).
Figure 1.
Example of near-duplicates (witnesses). In the middle of the tape (a) has been added a piece of leader-tape obtaining the modified version (b); The difference between the two versions can be clearly observed comparing the corresponding spectrograms (c,d).
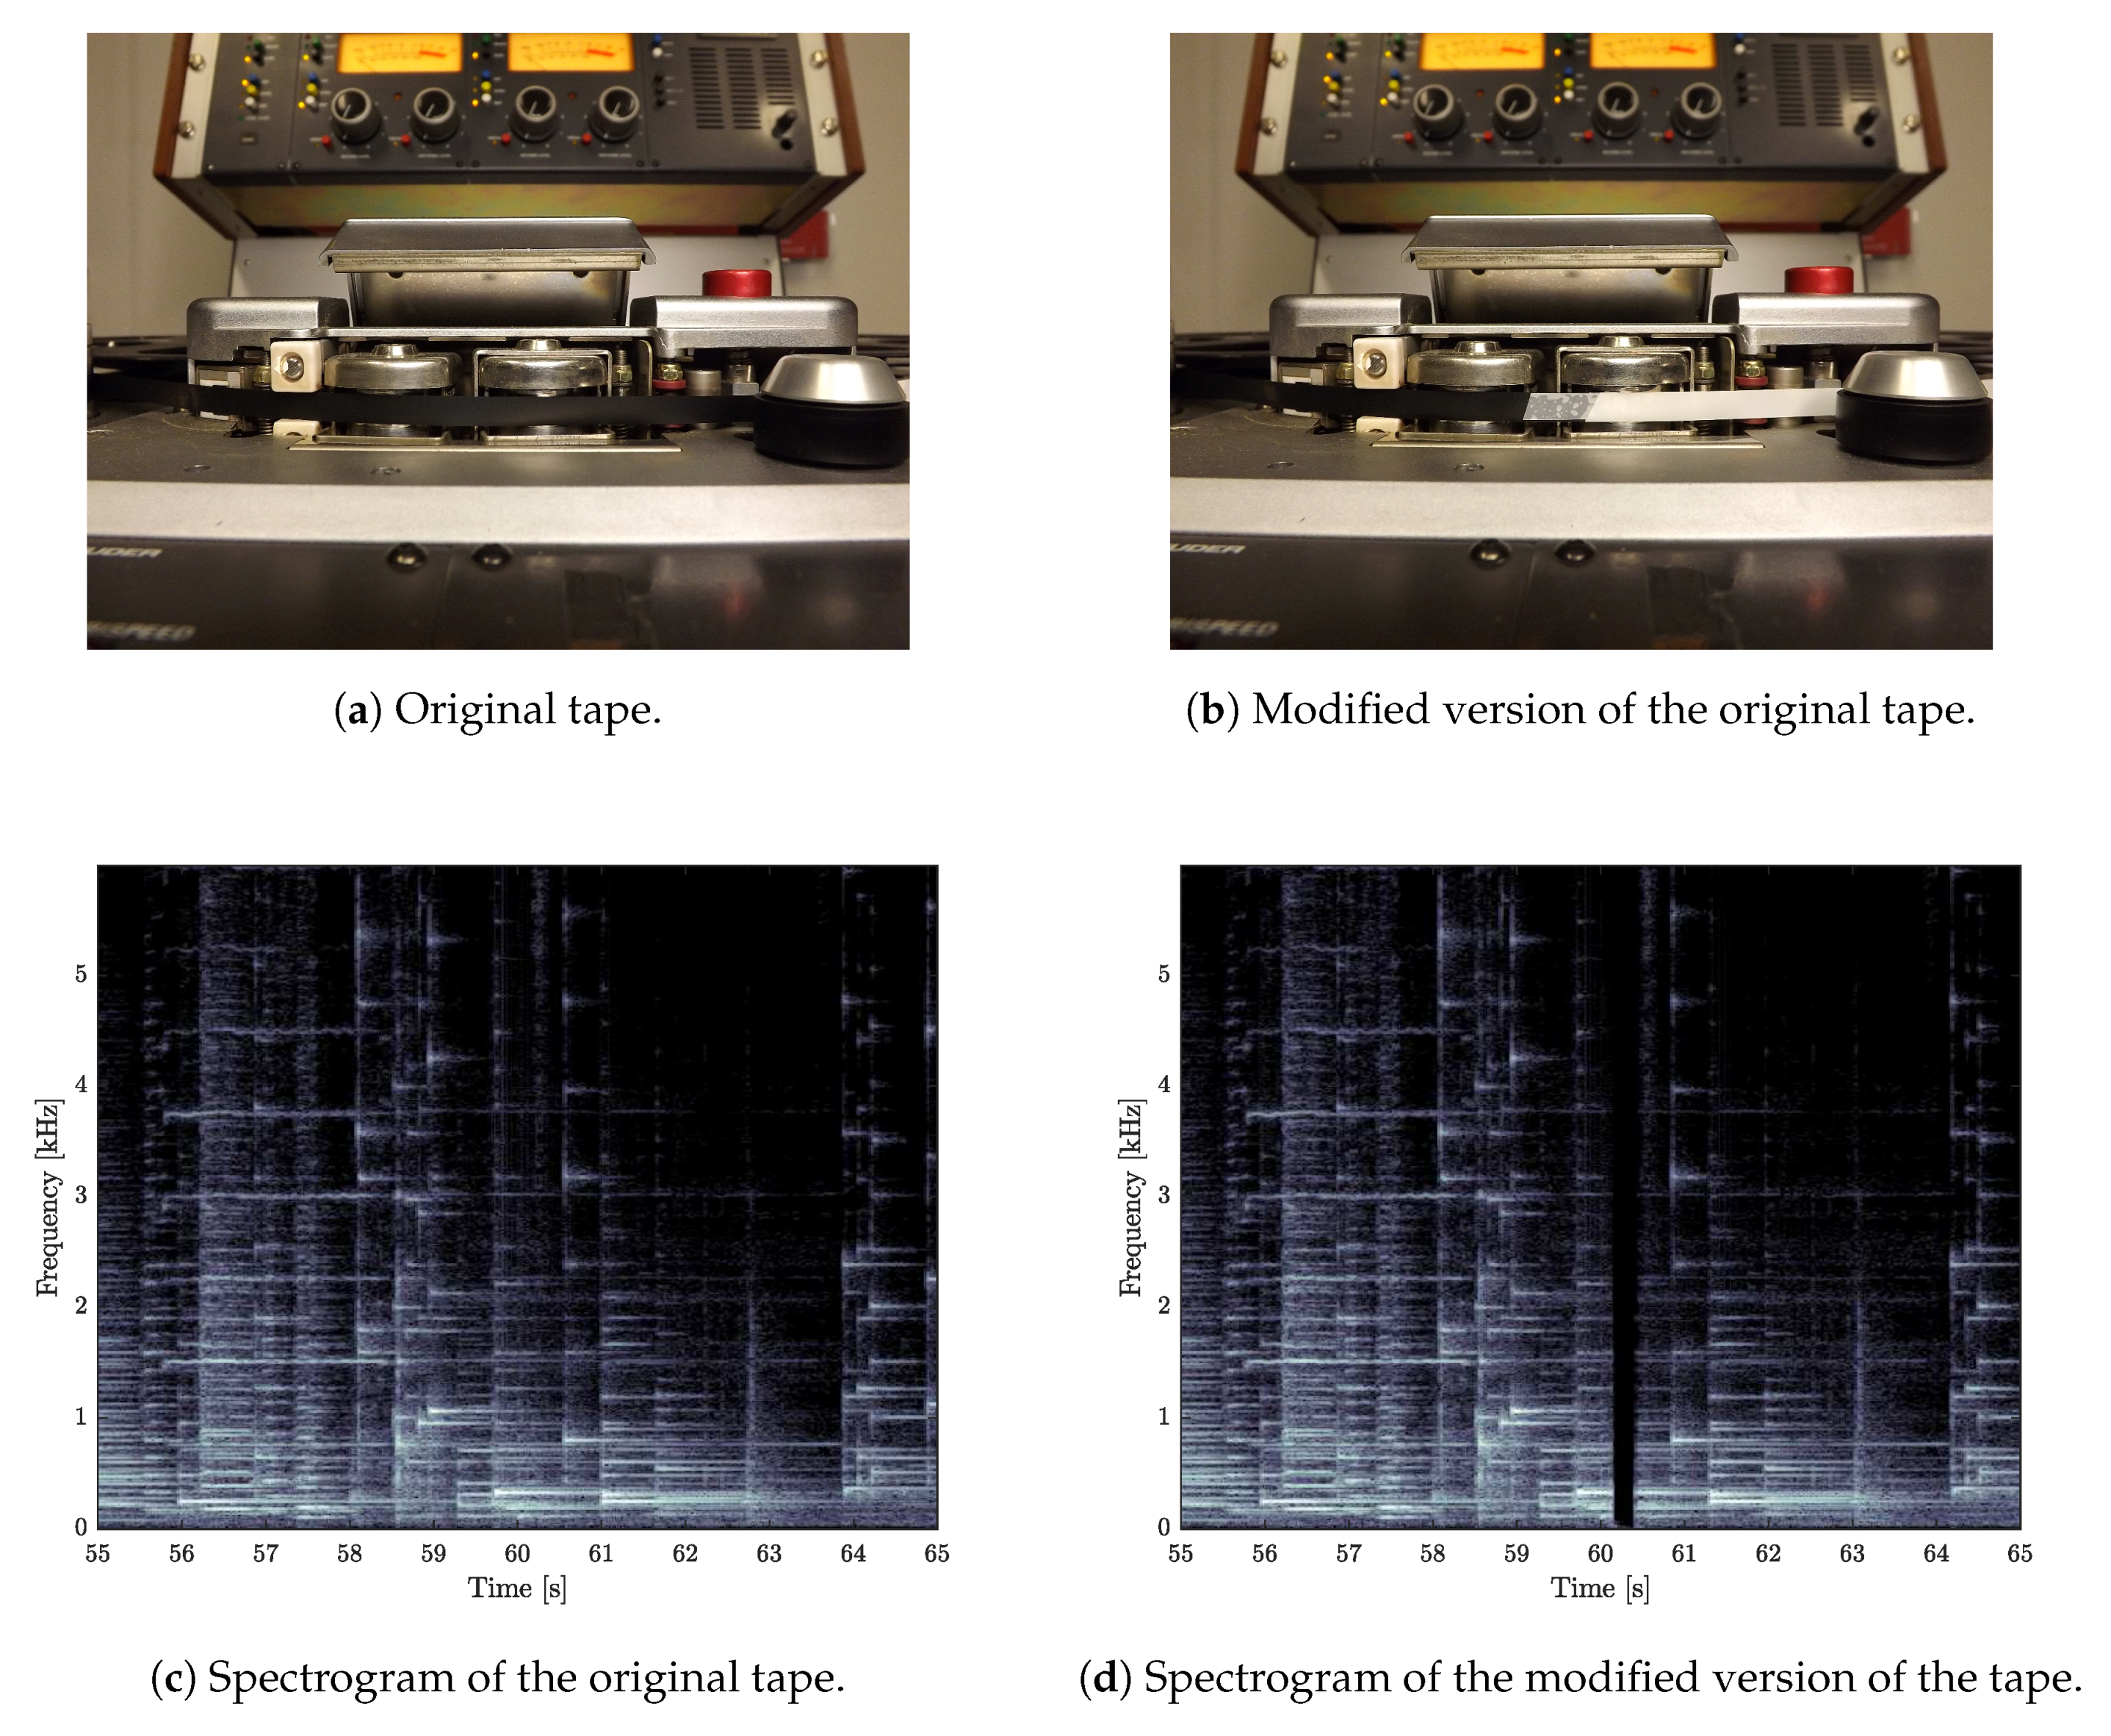
Figure 2.
Block diagram of the proposed algorithm. The input consists of the digitalized audio tracks , , and the output is the estimated audio phylogeny tree (APT).
Figure 2.
Block diagram of the proposed algorithm. The input consists of the digitalized audio tracks , , and the output is the estimated audio phylogeny tree (APT).

Figure 3.
Spectrogram image of an audio track , with green asterisks representing the detected SURF keypoints. Subfigures show the SURF keypoints (a) and inlier keypoints after RANSAC (b). Note that the remaining inlier points are located to the right of the leader-tape.
Figure 3.
Spectrogram image of an audio track , with green asterisks representing the detected SURF keypoints. Subfigures show the SURF keypoints (a) and inlier keypoints after RANSAC (b). Note that the remaining inlier points are located to the right of the leader-tape.
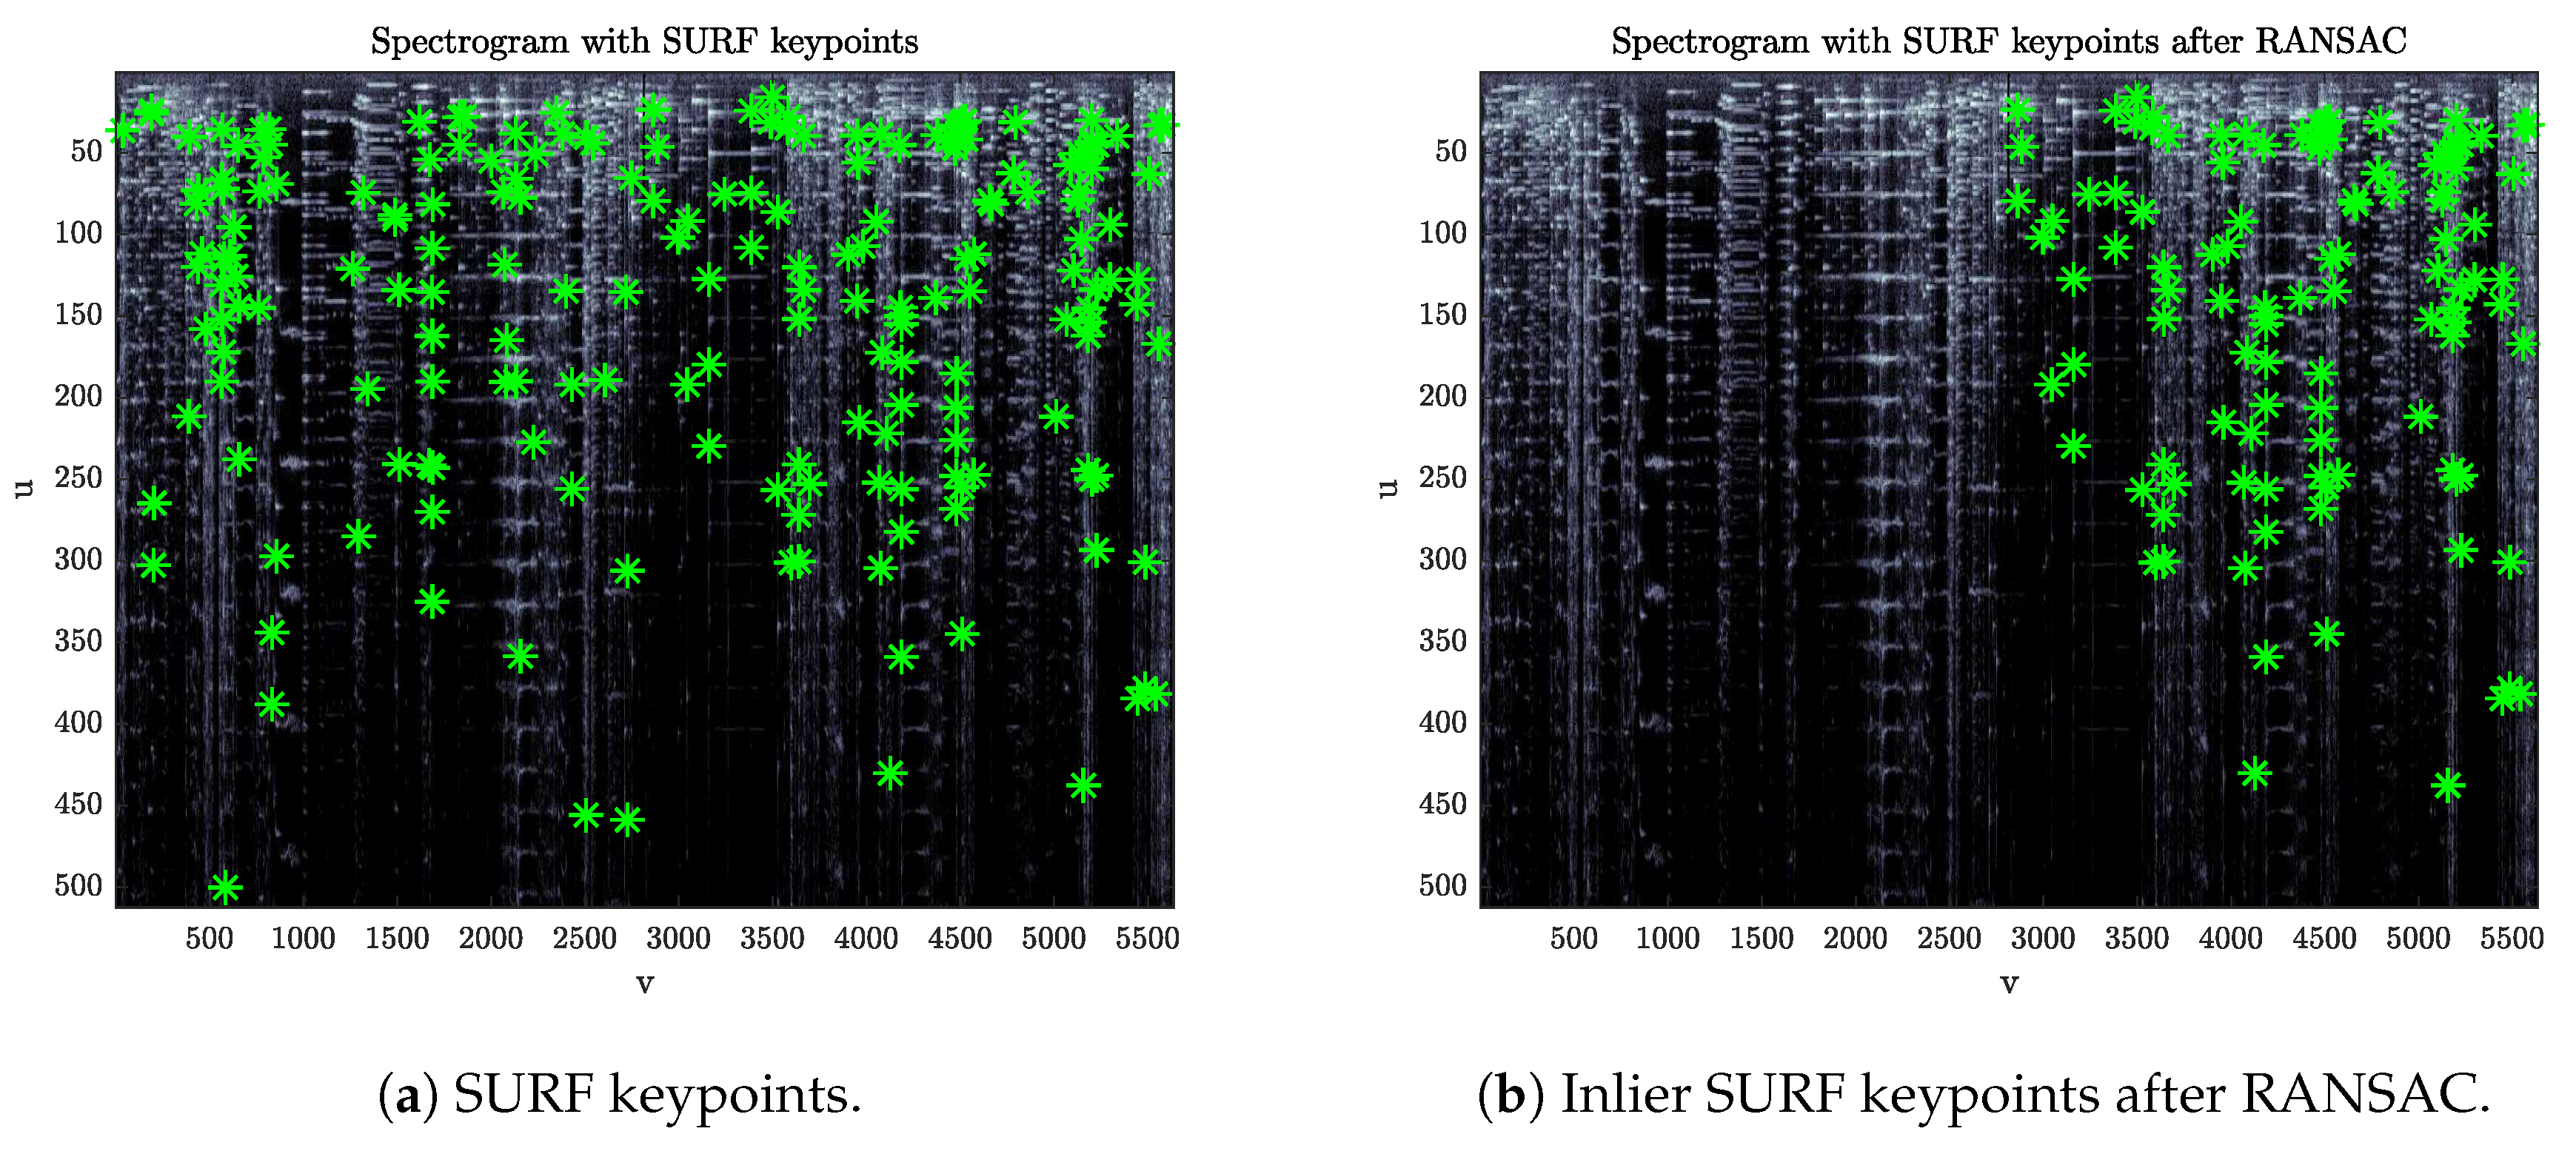
Figure 4.
Residual spectrogram and related energy-over-time associated with a track pair containing an overdub, which appears in (a) as a bright region with clean edges. The red circles in (b) represent the detected outliers , and the two points marked with green asterisks are the selected edges .
Figure 4.
Residual spectrogram and related energy-over-time associated with a track pair containing an overdub, which appears in (a) as a bright region with clean edges. The red circles in (b) represent the detected outliers , and the two points marked with green asterisks are the selected edges .

Figure 5.
Examples of tree reconstruction with over-clustering errors. Datasets consist of seven audio tracks, . In (a), cluster is split into the parent-child pair ; in (b), cluster is split into the sibling pair .
Figure 5.
Examples of tree reconstruction with over-clustering errors. Datasets consist of seven audio tracks, . In (a), cluster is split into the parent-child pair ; in (b), cluster is split into the sibling pair .

Table 1.
Equalization standards supported by the Studer A810 described by their time constants. Source: [39].
Table 1.
Equalization standards supported by the Studer A810 described by their time constants. Source: [39].
| 30 ips | 15 ips | 7.5 ips | 3.75 ips |
|---|---|---|---|
| AES: 17.5/∞ | CCIR: 35/∞ | 70/∞ | 90/3180 |
| AES: 17.5/∞ | NAB: 50/3180 | 50/3180 | 90/3180 |
Table 2.
Samples of electroacoustic music recorded on experimental tapes with the related configuration.
Table 2.
Samples of electroacoustic music recorded on experimental tapes with the related configuration.
| Samples | Recording Parameters | |||||
|---|---|---|---|---|---|---|
| # | Composer | Title | Year(s) | Speed | Equation | DBX |
| 1 | Luciano Berio | Differences | 1958–1959 | 7.5 | CCIR | yes |
| 2 | Pierre Boulez | Dialogue de l’ombre double | 1985 | 7.5 | CCIR | yes |
| 3 | Brian Ferneyhough | Mnemosyne | 1986 | 7.5 | CCIR | no |
| 4 | Brian Ferneyhough | Mnemosyne | 1986 | 15 | CCIR | yes |
| 5 | Bruno Maderna | Continuo | 1958 | 15 | CCIR | no |
| 6 | Bruno Maderna | Dimensioni II—invenzione su una voce | 1960 | 7.5 | NAB | yes |
| 7 | Bruno Maderna | Notturno | 1956 | 7.5 | NAB | no |
| 8 | Luigi Nono | ...sofferte onde serene... | 1976 | 15 | NAB | yes |
| 9 | Gruppo NPS | Interferenze II | 1965–1968 | 15 | NAB | yes |
| 10 | Gruppo NPS | Ricerca 4 | 1965–1968 | 15 | NAB | no |
Table 3.
Correct-detection and false-positive probabilities for leader-tapes and overdubs.
| Leader | Overdub | ||
|---|---|---|---|
| 90.0% | 0.0% | 75.0% | 3.3% |
© 2018 by the authors. Licensee MDPI, Basel, Switzerland. This article is an open access article distributed under the terms and conditions of the Creative Commons Attribution (CC BY) license (http://creativecommons.org/licenses/by/4.0/).
Share and Cite
MDPI and ACS Style
Verde, S.; Pretto, N.; Milani, S.; Canazza, S. Stay True to the Sound of History: Philology, Phylogenetics and Information Engineering in Musicology. Appl. Sci. 2018, 8, 226. https://doi.org/10.3390/app8020226
AMA Style
Verde S, Pretto N, Milani S, Canazza S. Stay True to the Sound of History: Philology, Phylogenetics and Information Engineering in Musicology. Applied Sciences. 2018; 8(2):226. https://doi.org/10.3390/app8020226
Chicago/Turabian StyleVerde, Sebastiano, Niccolò Pretto, Simone Milani, and Sergio Canazza. 2018. "Stay True to the Sound of History: Philology, Phylogenetics and Information Engineering in Musicology" Applied Sciences 8, no. 2: 226. https://doi.org/10.3390/app8020226
Note that from the first issue of 2016, this journal uses article numbers instead of page numbers. See further details here.