A Multi-Agent System for the Dynamic Emplacement of Electric Vehicle Charging Stations


Departamento de Sistemas Informáticos y Computación, Universitat Politècnica de València, Camino de Vera s/n, 46022 Valencia, Spain
*
Author to whom correspondence should be addressed.
†
These authors contributed equally to this work.
Appl. Sci. 2018, 8(2), 313; https://doi.org/10.3390/app8020313
Submission received: 30 December 2017
/
Revised: 2 February 2018
/
Accepted: 14 February 2018
/
Published: 23 February 2018
(This article belongs to the Special Issue Multi-Agent Systems)
Abstract
:One of the main current challenges of electric vehicles (EVs) is the creation of a reliable, accessible and comfortable charging infrastructure for citizens in order to enhance demand. In this paper, a multi-agent system (MAS) is proposed to facilitate the analysis of different placement configurations for EV charging stations. The proposed MAS integrates information from heterogeneous data sources as a starting point to characterize the areas where charging stations could potentially be placed. Through a genetic algorithm, the MAS is able to analyze a large number of possible configurations, taking into account a set of criteria to be optimized. Finally, the MAS returns a configuration with the areas of the city that are considered most appropriate for the establishment of charging stations according to the specified criteria.
1. Introduction
European governments are focused on greatly reducing the transport sector’s carbon emissions. An element that plays a key role is the electric vehicle (EV) and the expected uptake of the EV market [1]. The electric vehicle, powered in whole or in part by electricity from electricity grids, is more efficient and environmentally friendly (i.e., results in lower emissions of gases and noise) when compared to other current propulsion technologies and current vehicles. Among the modes of transportation in cities that need solutions for their migration from emitting technologies to non-polluting alternatives such as electricity, we must take into account public vehicles (i.e., buses, taxis, postal service vehicles, rental vehicles) as well as as private vehicles (i.e., cars, motorcycles, bicycles, mototaxis).
Currently, consumers can choose from an wide number of electric vehicle models that provide many environmental benefits. According to the European Environment Agency, although the number of electric vehicle sales has increased rapidly over past years, they represented just 1.2% of all new cars sold in the EU in 2015 [2].
The causes that can hinder the introduction of EV use in cities include the following: limited information and technological uncertainty (in comparison with the more familiar conventional vehicle technologies), the limitations of battery life and charging times of EVs, and the lack a charging infrastructure that covers the potential demand for the EVs [3]. The last cause is closely related to range anxiety that is considered a significant obstacle to market acceptance of EVs [4]. Range anxiety is the fear that the vehicle has insufficient range to reach the destination [5]. An option to deal with this problem is through the deployment of an efficient public charging infrastructure. However, since infrastructure development is expensive, there is a need to direct investments towards the establishment of refueling facilities in areas with maximum impact (i.e., maximum coverage at a low cost).
In this paper, the aim is to provide a multi-agent system (MAS) for the planning of efficiently located infrastructures for electric vehicle charging stations for the public and private sectors in a city. For this purpose, we present an MAS that integrates the collection of information from heterogeneous data sources and the optimization of the charging station locations using artificial intelligence algorithms. In this way, the proposed MAS allows the evaluation of a set of possible configurations of charging station locations. The MAS also considers different configurable criteria and determines which is the most advisable configuration of charging station locations.
This proposal will contribute in the research and technology transfer of new analysis systems for the strategic planning and distribution of urban elements, such as charging stations for EVs. The proposed system will make it possible to: (1) guarantee the supply of electricity for charging EVs in the city; and (2) optimize investment in infrastructures and charging stations, which results in greater sustainability.
The problem lies in where should the charging stations should be established and how many charging piles should be established in each charging station in order to provide service to as many EV users as possible.
The article is structured in the following sections. Section 2 presents previous works related to the proposal presented. Section 3 describes the main aspects of the proposed MAS and details the Emplacement Optimizer Agent, which is the core of the system. Section 4 presents a case study for the city of Valencia, and Section 5 shows some experimental results over the proposed case study. Finally, Section 6 provides some conclusions and information on future works.
2. Related Work
From the user’s point of view, there are several commercial tools related to charging stations. Most of them focus on the user orientation, trying to help them to find nearby stations or plan a route while taking into account charging needs during the journey [6,7,8,9].
From the manager’s point of view (i.e., governments, administrations, town councils, etc.), there are initiatives that try to provide support, through implementation guidelines, to the selection problem of the most appropriate placement of charging stations in a city [10,11]. A large part of the research work related to charging stations focuses on the scenario where N EVs must be charged along T units of time [12] or how to reduce the impact of EVs on the grid of the electric supply [13].
Other works are more focused on the analysis of placement configurations of charging stations (see Table 1). Some works analyze the distribution of charging stations considering vehicle travel range constraints. Shukla et al. [14] propose mathematical programming for determining the best locations for establishing alternative transportation fuel stations. The goal of this proposal was to site the refueling stations at locations that maximize the number of vehicles served, while staying within budget constraints. The proposed model is a modification of the flow interception facility location model. Nie et al. [15] present conceptual optimization model to analyze travel by EVs along a long corridor. The objective of the model is to select the charging power at each station and the number of stations needed along the corridor to meet a given level of service in such a way that the total social cost is minimized.
Other studies analyzed the distribution of electric stations in cities. Wood et al. [16] focus on the estimated number of charging stations needed to substantially increase the utility of the vehicle and how the stations can be strategically located to maximize their potential benefit to future EV owners. This approach uses travel profiles, driver behavior, vehicle performance, battery attributes, environmental conditions, and charging infrastructure to optimize the performance of the EV and the charging station.
Lacey et al. [17] present a work that focuses primarily on a tool that performs the voltage analysis needed at charging stations and not on the planning of charging stations. The tool uses Excel to allow the analysis of the effects of typical loads and the load of EV on the distribution network.
Wagner et al. [18] take into account the EV users’ travel destinations (i.e., restaurants, shops or banks). These destinations are considered as points of interest (PoIs). The authors propose a model that ranks the PoIs according to their attraction for EV users. To solve the problem of where to place a station, they propose two approaches: (1) a method based on obtaining maximum demand coverage while at the same time calculating the most optimal location of charging points; and (2) an iterative method that penalizes a PoI if it is close to an existing charging point. The main drawback is that it only uses information about the journeys of EV users.
Wei et al. [19] propose a tool that models the demand for taxis, stations, and electric taxis. The objective is to maximize the service of the electric taxi and the service of charging them using a genetic algorithm. For this purpose, the authors take into account the range that a taxi can travel, the charging time, and the capacity of the EV stations.
Li et al. [20] transform the location problem of the EV charging stations into a problem of maximum coverage in a weighted network where the weight of the arcs is the number of cars going from the origin to the destination. Its aim is to maximize demand coverage.
Dong et al. [5] determine the location and type of public charging stations using an optimization model. This model is based on a genetic algorithm that minimizes lost trips taking into account budget constraints. The authors consider a grid where grid cells are sorted by the number of trips ending in the cell. The 500 most popular destinations are selected as possible locations for public charging stations.
Sweda et al. [21] propose an agent-based decision support system to identify patterns in residential EV ownership and driving activities to enable the strategic deployment of new charging infrastructure. The proposed model incorporates road network data to permit micro-level analyses of the market for EVs. However, other factors relevant for an effective charging infrastructure such as geography as well as to demographics are not considered.
Our proposal is based on an MAS that aims to facilitate decision-making processes on the location of EV charging stations in a city. This system is based on the integration of a set of heterogeneous sources of data such as open data web portals to obtain data about traffic, populations in different places of a city, data from Google applications that provide information about the average time spent in PoIs, or social networks to collect geo-located information about users activity. All these data sources are the input of an Artificial Intelligence (AI) algorithm that estimates a near-optimal solution for the most appropriate EV charging station location according to a utility function. This functionality can be configurable by the user of the system to adapt it to specific circumstances of the city.
3. Proposal and Methodology
Several studies in the literature analyze users charging behaviors [22,23]. One of the main causes that is currently limiting EV adoption is what is called range anxiety, which, among other factors, is determined by the infrastructure of the charging stations [24]. In order to deal with this problem, it is necessary to evaluate the set of possible configurations in order to offer a distribution of charging stations that satisfies the users and enhances the use of the EV.
3.1. Multi-Agent System Design
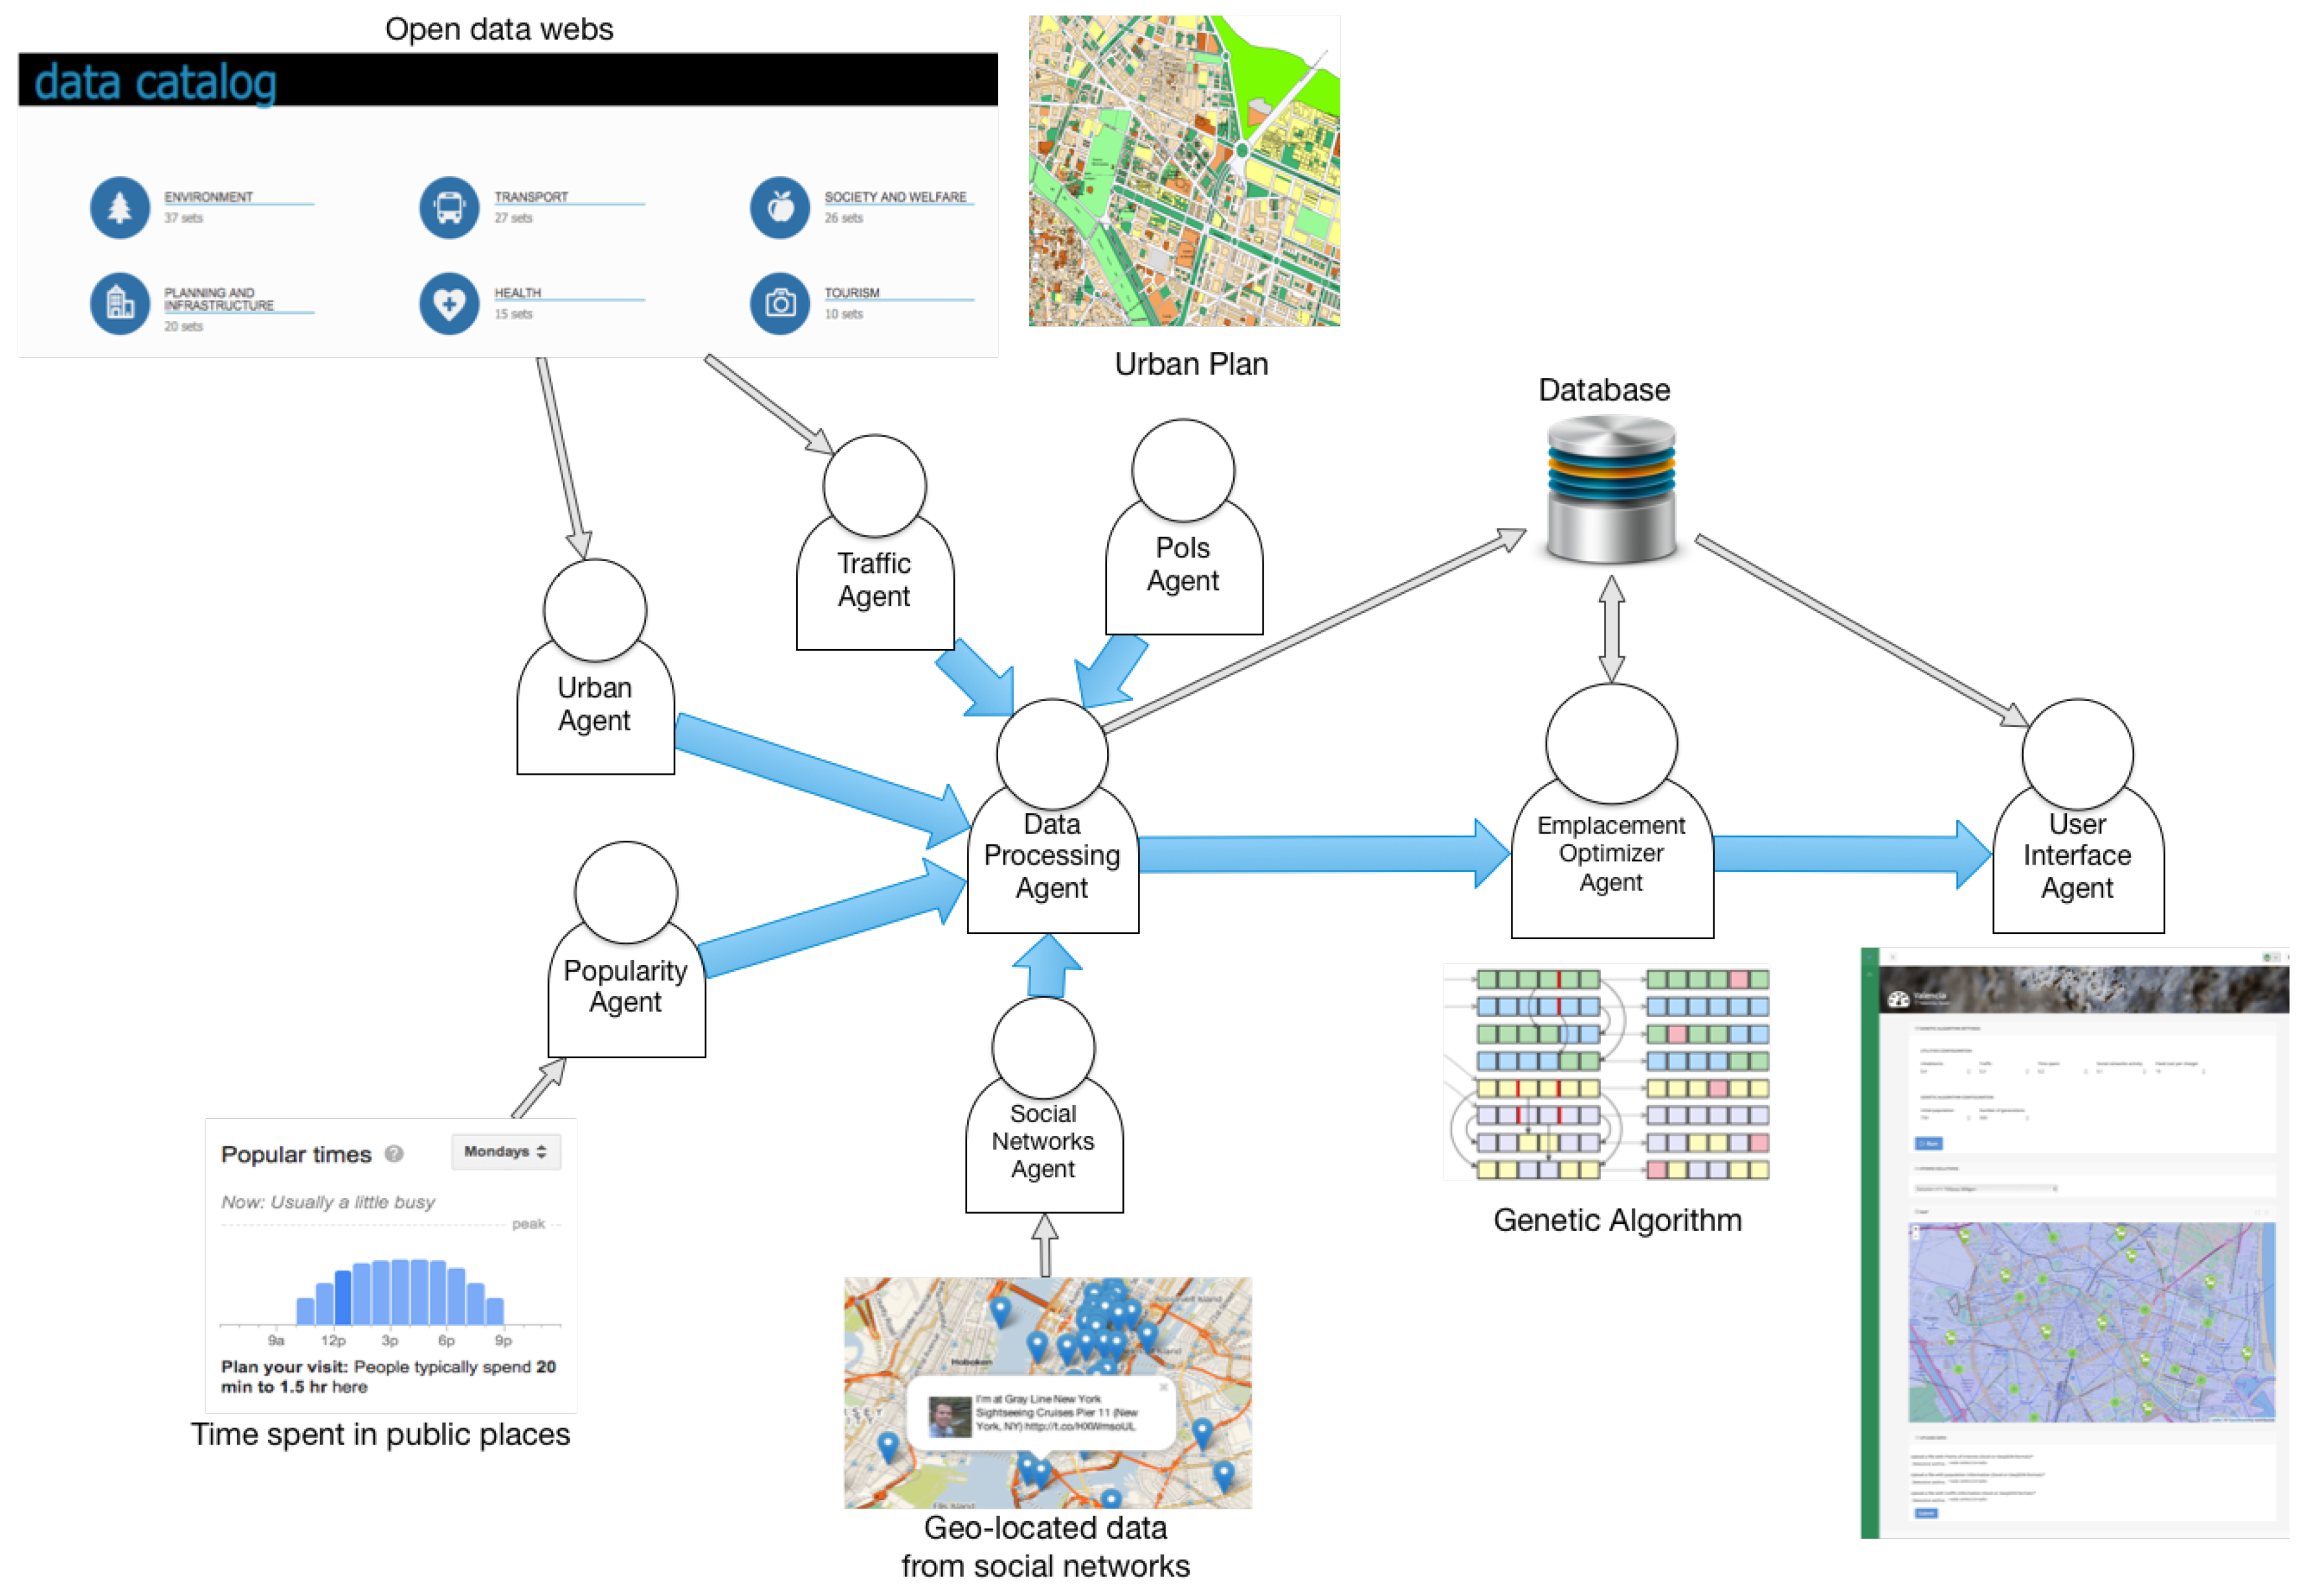
In this paper, we propose a multi-agent system (MAS) that integrates a genetic algorithm to obtain configurations for the localization of charging stations according to a utility function. The MAS is composed of a set of agents that offer services and provide flexibility, scalability, and reuse in other municipalities. The agents that participate in the MAS are the following (see Figure 1):
- The Urban Agent: This agent is responsible for obtaining information about the amount of population in the different neighborhoods or blocks of the city under study. It extracts the information from census sections of Open Data portals.
- The Traffic Agent: The agent’s responsibility is to collect traffic information. With the information collected, the agent is able to answer queries about how much traffic there is on average in a certain defined area of the city.
- The PoI Agent: The aim of the PoI Agent is to detect and classify points of interest (PoIs) for the installation of future charging stations in the city based on its urban development plan. In addition, the agent carries out a clustering process to eliminate points of interest that are too close and to define zones of influence of the point with a minimum area.
- The Popularity Agent: The task of the Popularity Agent is to determine the popularity of a point of interest based on the number of people who visit it and how much time those people spend in the area. To do this, it uses third party services, through an exhaustive search on the network, to locate this data. One example is Google’s own service, which can be used to make a reverse resolution of coordinates to entities of interest on the map. Then, based on this information, the agent uses the results of the search engine to consult the estimated time spent by visitors in that area.
- The Social Networks Agent: This agent retrieves geolocated information from social networks (Twitter, Instagram, ...) to measure the popularity of a PoI based on the amount of activity that occurs through social networks in that area.
- The Data Processing Agent: This module is in charge of aggregating all the information obtained by the previous collecting agents. The above mentioned collecting agents are each specialized in a specific type of information, while the Data Processing Agent is in charge of combining and completing all this information to send it to the next agent (the Emplacement Optimizer Agent) so that data analysis can begin. This agent could collect information from various collecting agents based on the information available in each city.
- The Emplacement Optimizer Agent: This agent applies a genetic algorithm to determine the set of points of interest which are more appropriate according to the criteria that the user wants to optimize.
- The User Interface Agent: this agent consists of a dashboard that will offer an interface for the criteria specification to be optimized, and information sources that are going to be taken into account by the Emplacement Optimizer Agent. This agent provides the visualization of the results of the Emplacement Optimizer Agent.
- The system uses also a centralized database where all the persistence is done. This way, the Data Processing Agent and the Emplacement Optimizer Agent can share the computed data and the results, which are shown in the User Interface.
The proposed MAS follows the next phases: (1) extraction of the set of points of interest (PoIs) of the city P and their characterization considering different sources of information; (2) application of the genetic algorithm according to the conditions defined by the problem to be treated; and (3) visualization of the results.
In the first phase, the PoI Agent determines the PoIs P for the location of a charge station . Initially, the agent considers public parking and garages to be PoIs. These PoIs are visited by a high number of users, usually the duration of stay is enough to charge a EV, and the power contracted in the installation is suitable for EV charging stations [25]. The consideration of these initial locations will not only increase the utilization but also increase the visibility, which might help to relieve range anxiety and promote EV acceptance. In order to be able to determine these PoIs (i.e., areas with collective car parkings and garages), we used the General Urban Development Plan and the land uses of the city. This set of PoIs was considered as a starting point for the possible locations of the charging stations.
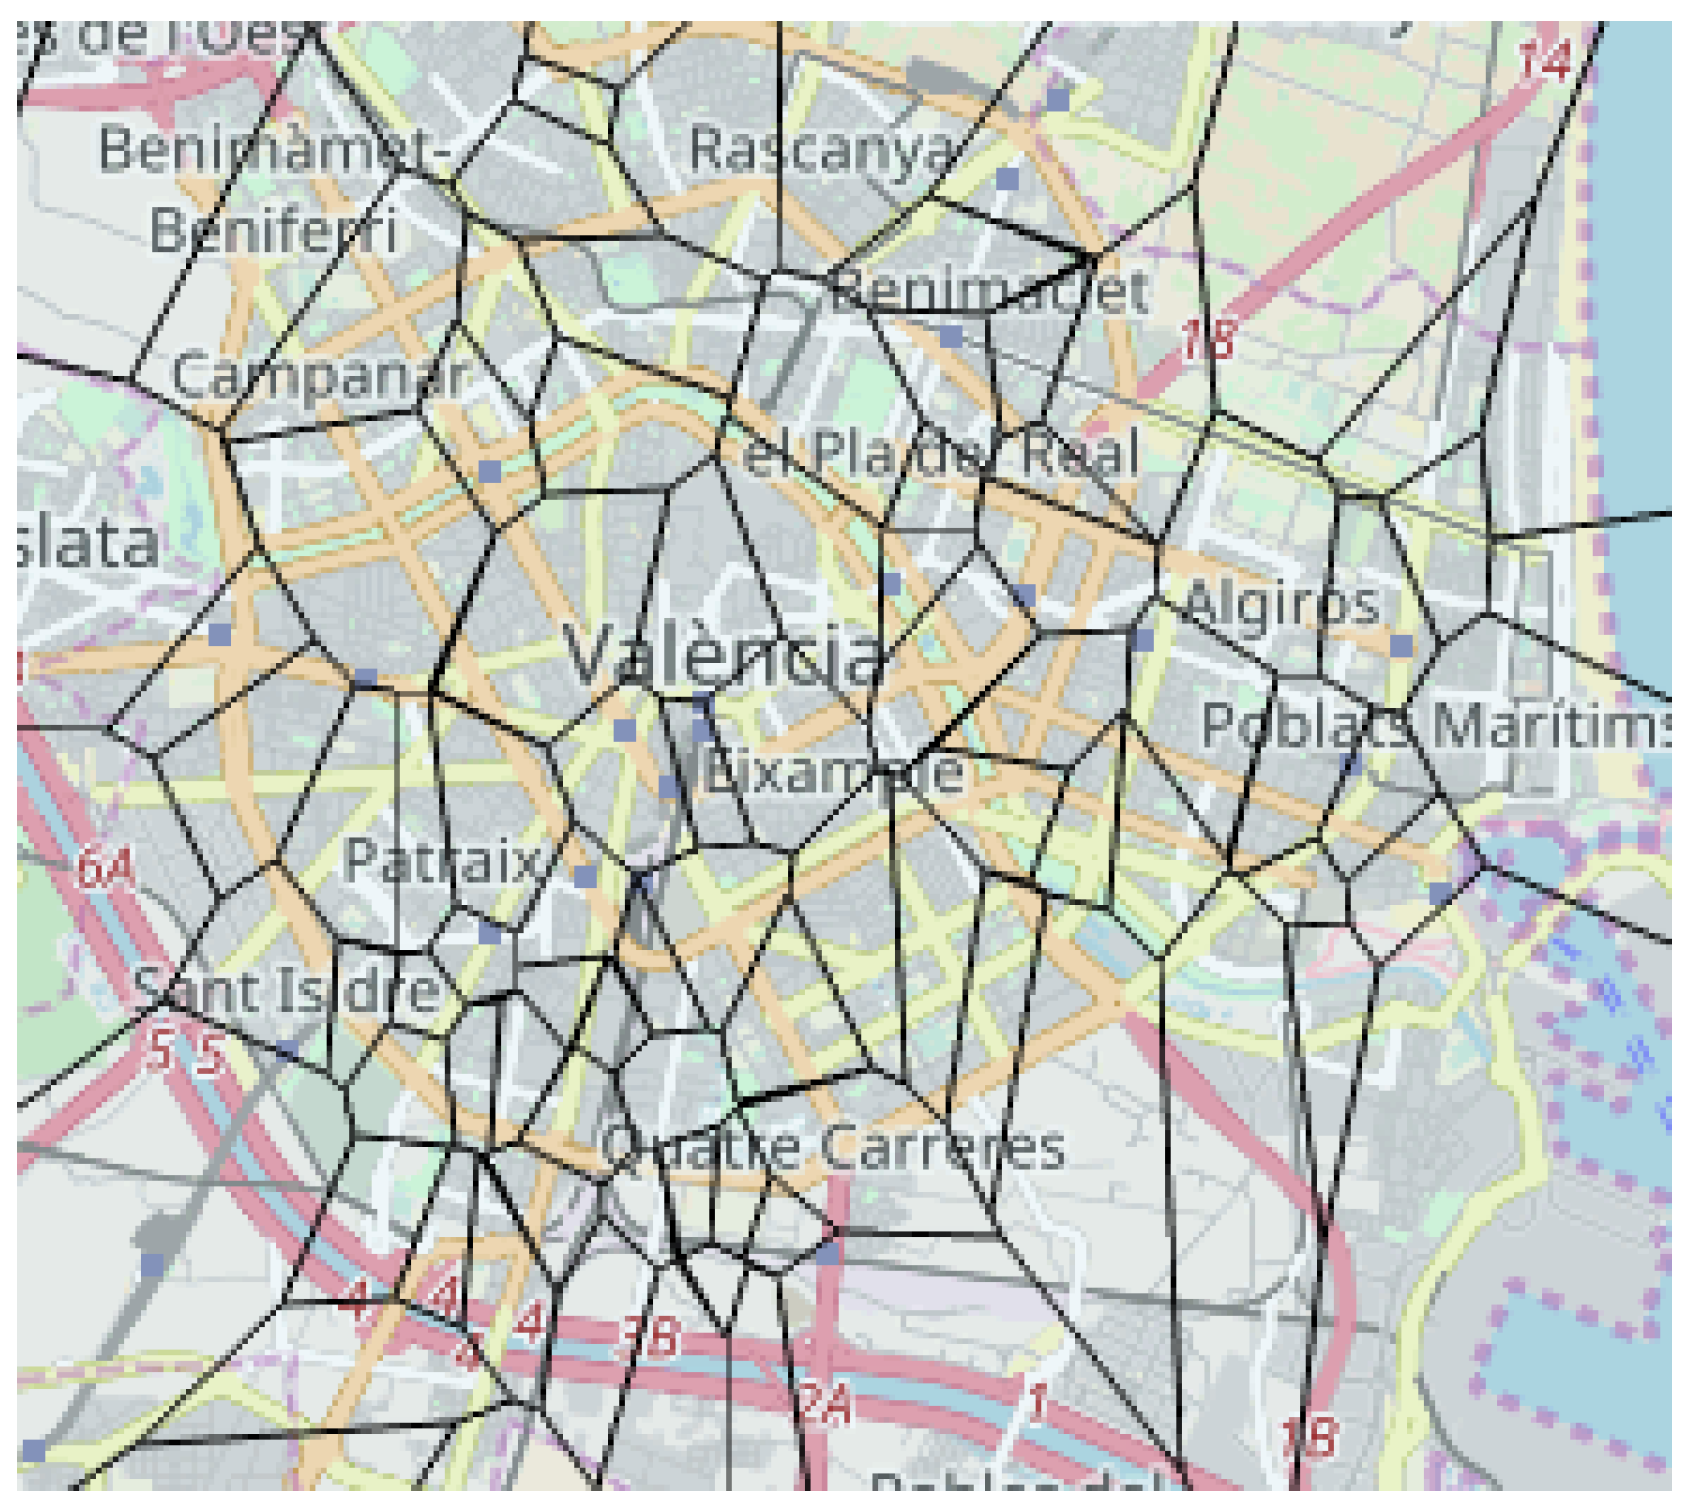
To determine the area of influence of each PoI, a Voronoi diagram was created. Some (rectangular) boundaries are defined to limit the area of the city, and then the Voronoi diagram is calculated using the PoIs. Since a Voronoi diagram divides the whole area into regions based on the distance to points in each specific subset, each of these regions or polygons represents the influence area of the corresponding PoI. This allows us to consider an area rather than a single point to provide more flexibility in locating a charging station. The polygons around the PoIs designate their area of influence.
Once the polygons containing the PoIs were identified, they were characterized from the extraction of information from different sources: geo-positioned activity in the city from social networks [26,27,28], census sections, traffic status, traffic intensity per section, existing charge stations, tourist areas, and time spent in areas where there may be collective vehicle parking (i.e., shopping malls, work areas, etc.).
In a second phase, the Emplacement Optimizer Agent takes the polygons, the information that characterizes each of them, and the constraints of the problem (e.g., the number of stations to be installed, time limit to obtain a solution, etc.), and initiates the search for solutions by means of the previously described genetic algorithm. Finally, once a configuration has been obtained, the user can visualize the location of the stations on the city map.
3.2. The Emplacement Optimizer Agent
This subsection describes the main aspects of the Emplacement Optimizer Agent which is in charge of determining the more appropriated set of locations for a set of charging stations. First, we describe how the problem has been modeled, and secondly, we describe how the best configuration is found through a genetic algorithm.
3.2.1. Problem Description
The problem consists of the location of a set of charging stations starting from a set of PoIs of the city under study. In this way, is a set of possible locations for charging stations (PoIs), and is the set of charging stations that are going to be finally deployed in the city, with values ranging from 0 to a constant value of charging stations per PoI. A PoI is characterized by a set of attributes that define it, :
- Population in the area around
- Average traffic in the area
- Average time spent by citizens in public places in the area
- Geo-located social networking activity in the area
- Cost depending on the area covered by the stations
- Cost per charging station
The goal of the application is to find a configuration of charging stations at some of the pre-defined PoIs. A configuration is composed of a set of points where one or more stations are located, . Each configuration C has a value associated which has been assigned by a utility function . This function V is a lineal combination of a set of factors that are intended to be maximized or minimized. The final goal is to determine which is the optimal configuration (or a solution close to the optimal one) for the placement of the EV charging stations . To deal with this goal we propose the use of a genetic algorithm.
3.2.2. Genetic Algorithm
Genetic algorithms consist of general algorithms of optimization and learning based on evolutionary processes present in nature. This type of algorithm gradually converges towards high-quality solutions through the application of a set of operators. Another characteristic of genetic algorithms is their ability to solve problems with near-optimal solutions in solution spaces where a brute force algorithm would take too long. In the case of searching for the best EV charging station configuration, if we had 100 potential locations (PoIs) where we could place a EV charging station and we would like to select 20, we would have to analyze possible configurations. Given this scenario, the fact of using a genetic algorithm allows us to use a heuristic dedicated to the stochastic search that reaches near optimal solutions.
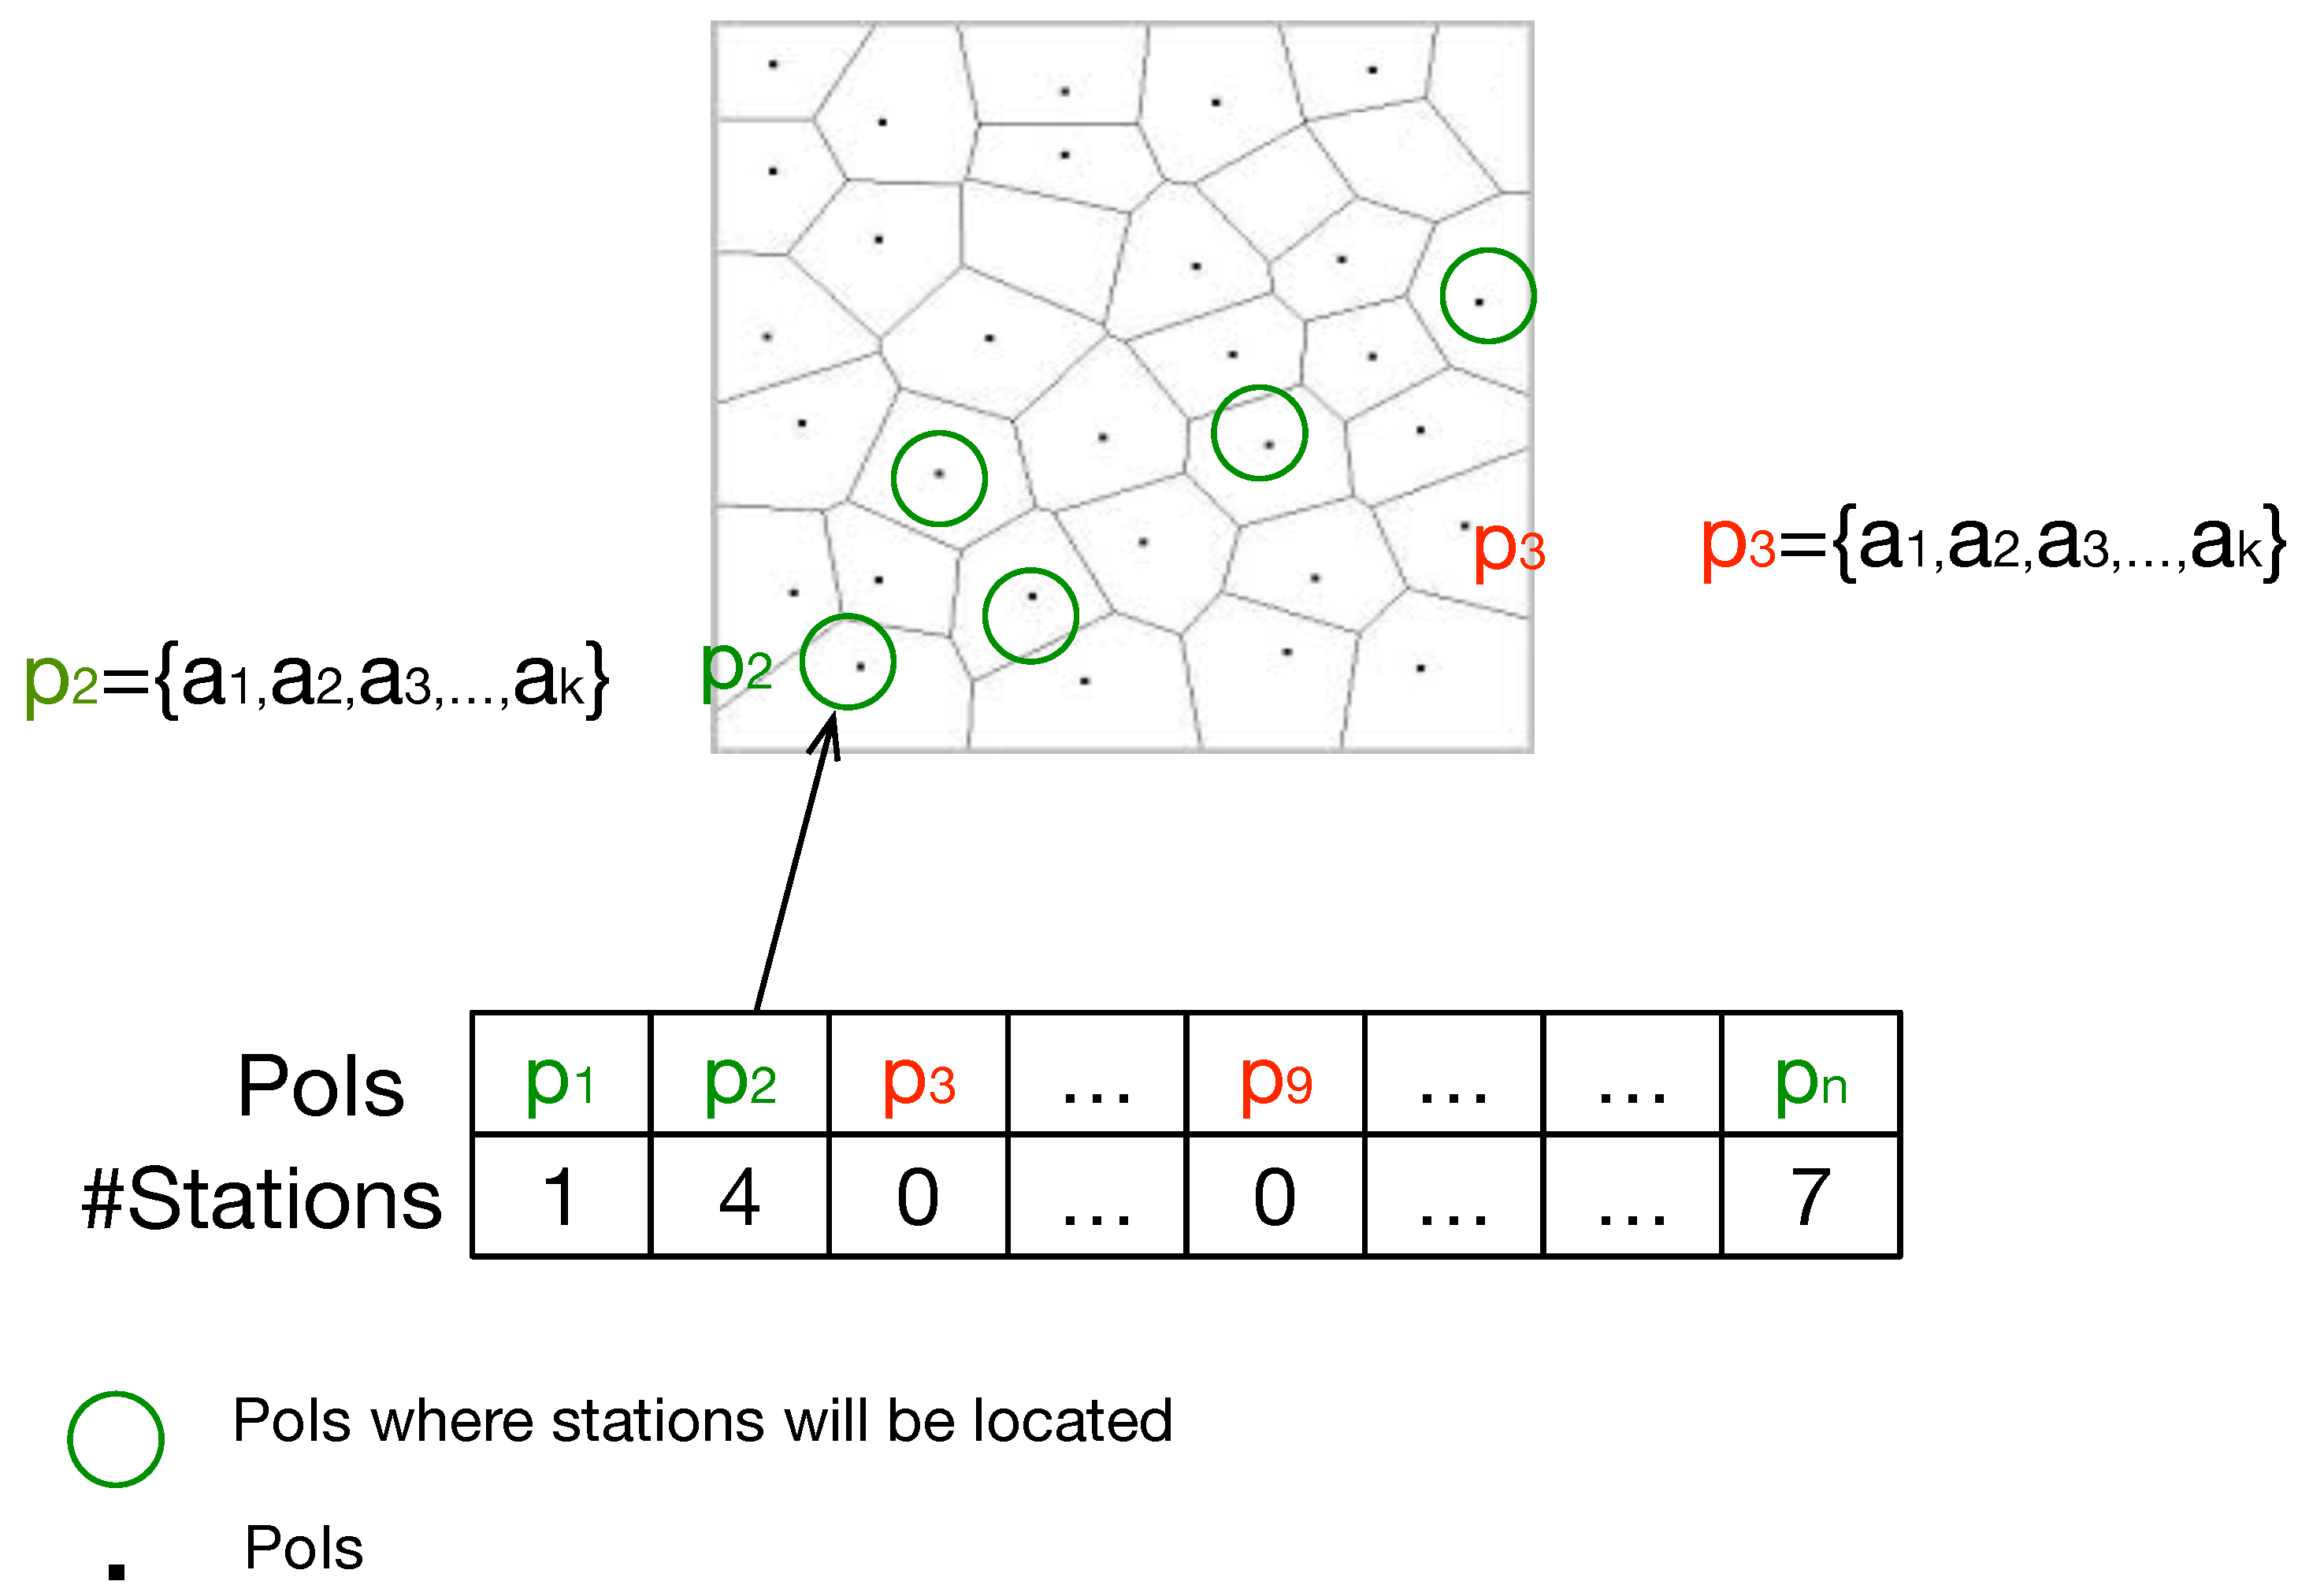
To solve the problem of the configuration of stations, we proposed a genetic algorithm that generates sets of solutions (i.e., generations), where each generation inherits the properties of the best solutions (i.e., configurations) of the previous one. Initially, the algorithm creates an initial random population of individuals N. Each individual is a solution to the problem (i.e., configuration ) (see Figure 2). In the scenario of EV charging stations, the size of the chromosome is the number of possible locations, i.e., P. The value of a gene within a chromosome indicates whether that location () will be used to locate one or more charging stations () or none.
The fitness function evaluates the quality of the solutions, that is, the quality of the individual (i.e., configurations ). In our problem, the fitness function corresponds to the usefulness of placing charging stations in the selected points. This function considers different attributes described above () balanced by weights.
Genetic operators are applied to existing individuals to generate new individuals. The proposed genetic algorithm considers the following genetic operators:
- Selection. The best individuals according to the fitness measure are selected to pass their genes to the next generation of the algorithm. This is done before applying the crossover operator. In our implementation, we used the tournament selection method, which creates several random groups of individuals, called tournaments, and selects the best one of each group.
- Crossover. Two parents are selected and a new individual child is created by combining the genes of the parents. Among the different crossover methods that exists, we used the cross uniform, which swaps genes from parents taking a uniform number of genes from them.
- Mutation. A new individual is generated by mutating some of the genes of a selected individual. This operator is used to maintain genetic diversity from different generations. Mutation is applied during evolution according to a probability which must be set low.
The proposed genetic algorithm performs as follows (see Algorithm 1). Initially, a population is randomly generated. This population consists of a set of possible configurations of EV charging stations. During each iteration (i.e., generation) of the algorithm, a randomly selected genetic operator is applied to each individual in the population. Then, the fitness value is calculated for each individual according to the equation:
where refers to the population of the area covered by the charging stations located in ; refers to the traffic generated in the area covered by the charging stations located in ; refers to the average time citizens spend in public/commercial places in the area covered by the charging stations located in ; refers to the average social activity in the area covered by the charging stations located in ; refers to the cost of locating stations in that covers the demand of that specific area; and is a constant cost per each charger () located in . The value of these parameters ranges in the interval [0, 1]. Each parameter has associated a weight value established by the user of the system. In this way, the users of the system can tune the importance of each parameter depending on the shape of the city where the stations have to be placed.
| Algorithm 1 The Genetic Algorithm |
|
Once the operators have been applied to the population of a generation, the new individuals are inserted into the new generation. The best N individuals remain in the new generation and the others are removed. The process ends when at least one of these situations occurs: (1) the number of generations exceeds a number established by the system; (2) when there are a certain number of generations where there is no individual in the new generation who has a fitness value higher than the best individual in previous generations; and (3) when the algorithm exceeds a time limit established by the system.
At the end of the process, the Emplacement Optimizer Agent sends the obtained results to the User Interface Agent.
4. Case Study: Valencia
This section describes a case study of the proposed system using data from the city of Valencia. At the European level, the European Commission has produced the White Paper on Transport [29], which sets targets for 2050 for the elimination of conventional fuel cars in cities. Although there are many initiatives and programs to implement hybrid and electric vehicles by the International Energy Agency, European Battery Manufacturers Association, and forums for global cooperation for the development and deployment of EV, there is a need to focus on the problems from the user’s point of view to define and implement solutions at the municipal level. The municipalities should incorporate strategy and development plans of infrastructures, regulations, and planning, in order to face an imminent acceleration of the deployment of EVs in cities, taking into account that technology is in continuous evolution. Therefore, one of the main challenges of the electric vehicle is to create a reliable, accessible and convenient charging infrastructure for the citizen to boost the demand of EV.
Currently, there are 76 charging points in the province of Valencia, according to [30], and 24 of these are located in the city of Valencia. The Valencia City Council has carried out various initiatives aimed at improving infrastructure to facilitate the introduction of EV. Among these initiatives, studies have been carried out for the installation of EV charging points.
Although actions have been taken to facilitate the integration of EV through charging stations, we believe it would be interesting to provide the proposed MAS that allows a global study to be carried out analyzing the different configurations of charging stations according to different criteria to be optimized. Providing good planning and distribution of charging stations could drive demand for EVs among users considering the use and/or acquisition of an EV and who ultimately do not carry it out due to lack of charging points or poorly located EVs [31].
In the first phase, the MAS determines the P potential PoIs for the location of a charge station taking into account data from the General Urban Development Plan. In particular, the points shown in Table 2 were selected. To determine the area of influence of each of the PoIs, a Voronoi diagram is created around the selected zones (see Figure 3).
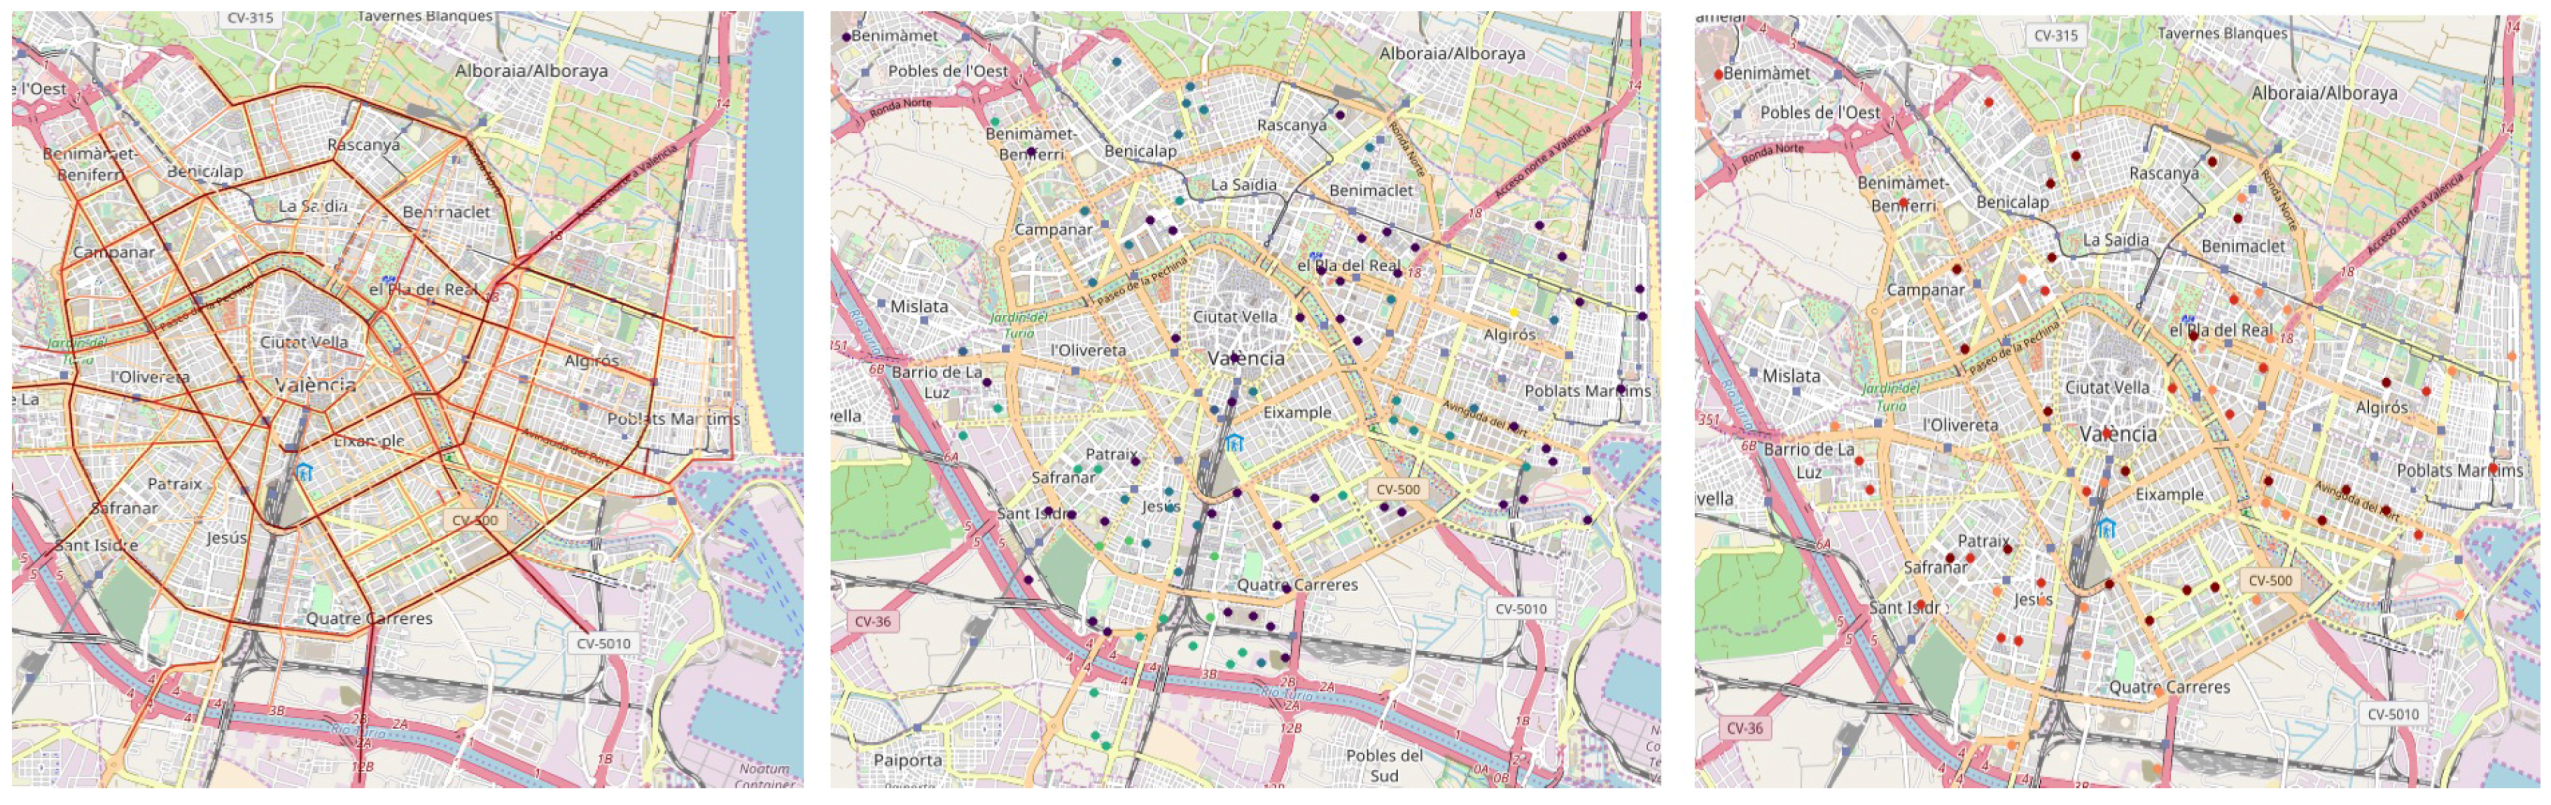
In the second phase, the MAS collects data about the city of Valencia. Specifically, the MAS collects data about traffic (see Figure 4 left), population (Figure 4 center), average time spent in commercial spaces, and geo-located social activity from social networks (Figure 4 right) for each of the polygons around a PoI. This data is collected and aggregated using the different proposed agents described in Section 3.1 and represents the input of the Emplacement Optimizer Agent that determines the solution.
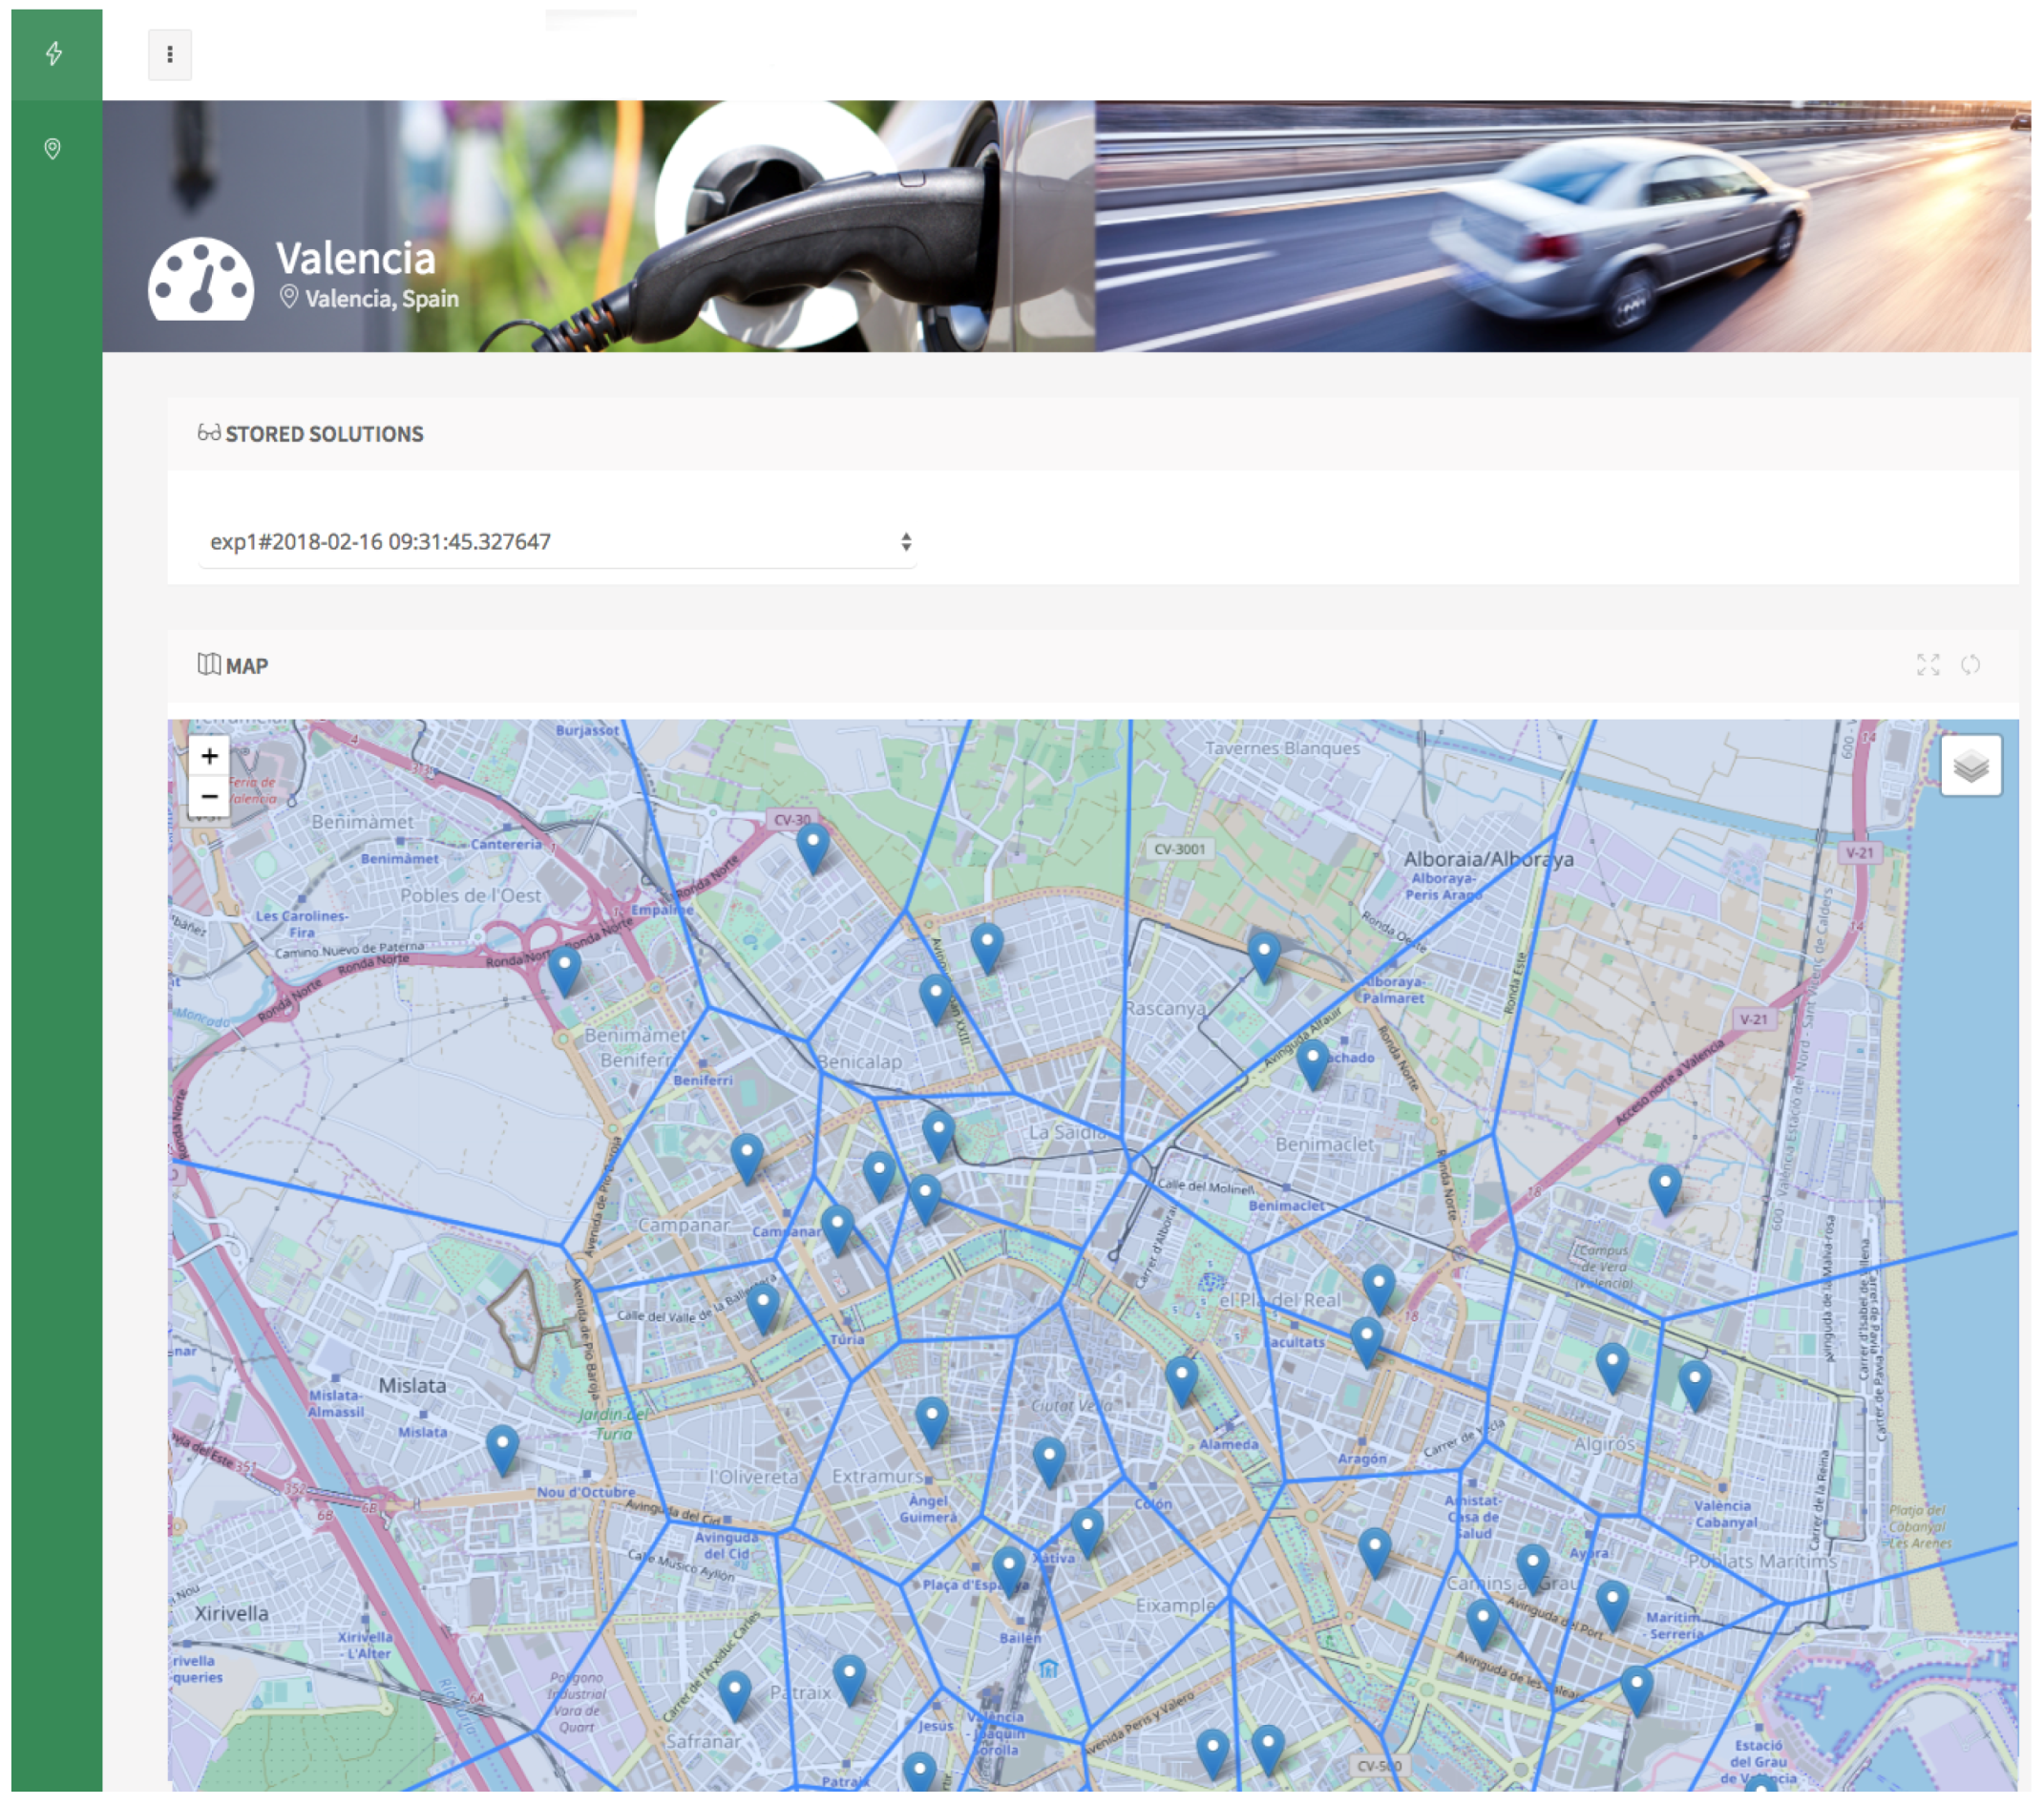
In the third phase, polygons and their characteristics represented by the extracted data are considered in order to obtain a solution by means of the Emplacement Optimizer Agent through the proposed genetic algorithm. The number of stations and the time needed to find a solution are constraints of the problem. The weights that we use to balance out the attributes of each PoI in Valencia are: for the population around the PoI; for the average traffic around the PoI; for the average time spent in public places of the area; and for the geo-located social networking activity in the area. Once the genetic algorithm finishes, the best individual (i.e., configuration of EV charging stations) in the population is provided based on the value provided by the function of fitness presented in Equation (1). An example of a solution given by the User Interface Agent in which the locations where each charge point would be located is shown in Figure 5.
5. Experimental Results
In this section, we present a series of experiments in which we analyze the behavior of the genetic algorithm that the Emplacement Optimizer Agent uses in order to find out the best parameters for our scenario. However, the entire MAS platform was used for the experiments carried out. Moreover, prior to the execution of the proposed experiments, unit tests were carried out on the entire system. These tests allowed us to validate that the system performed as expected.
Our genetic algorithm is implemented using the deap (https://github.com/DEAP/deap) library of Python. For our experiments, the PoI Agent considers a set of 103 points of interest of the city of Valencia. We assume a maximum of five chargers per PoI. Hence, depending on the final result of the genetic algorithm, for each PoI, a number of chargers between 0 and 5 will be installed.
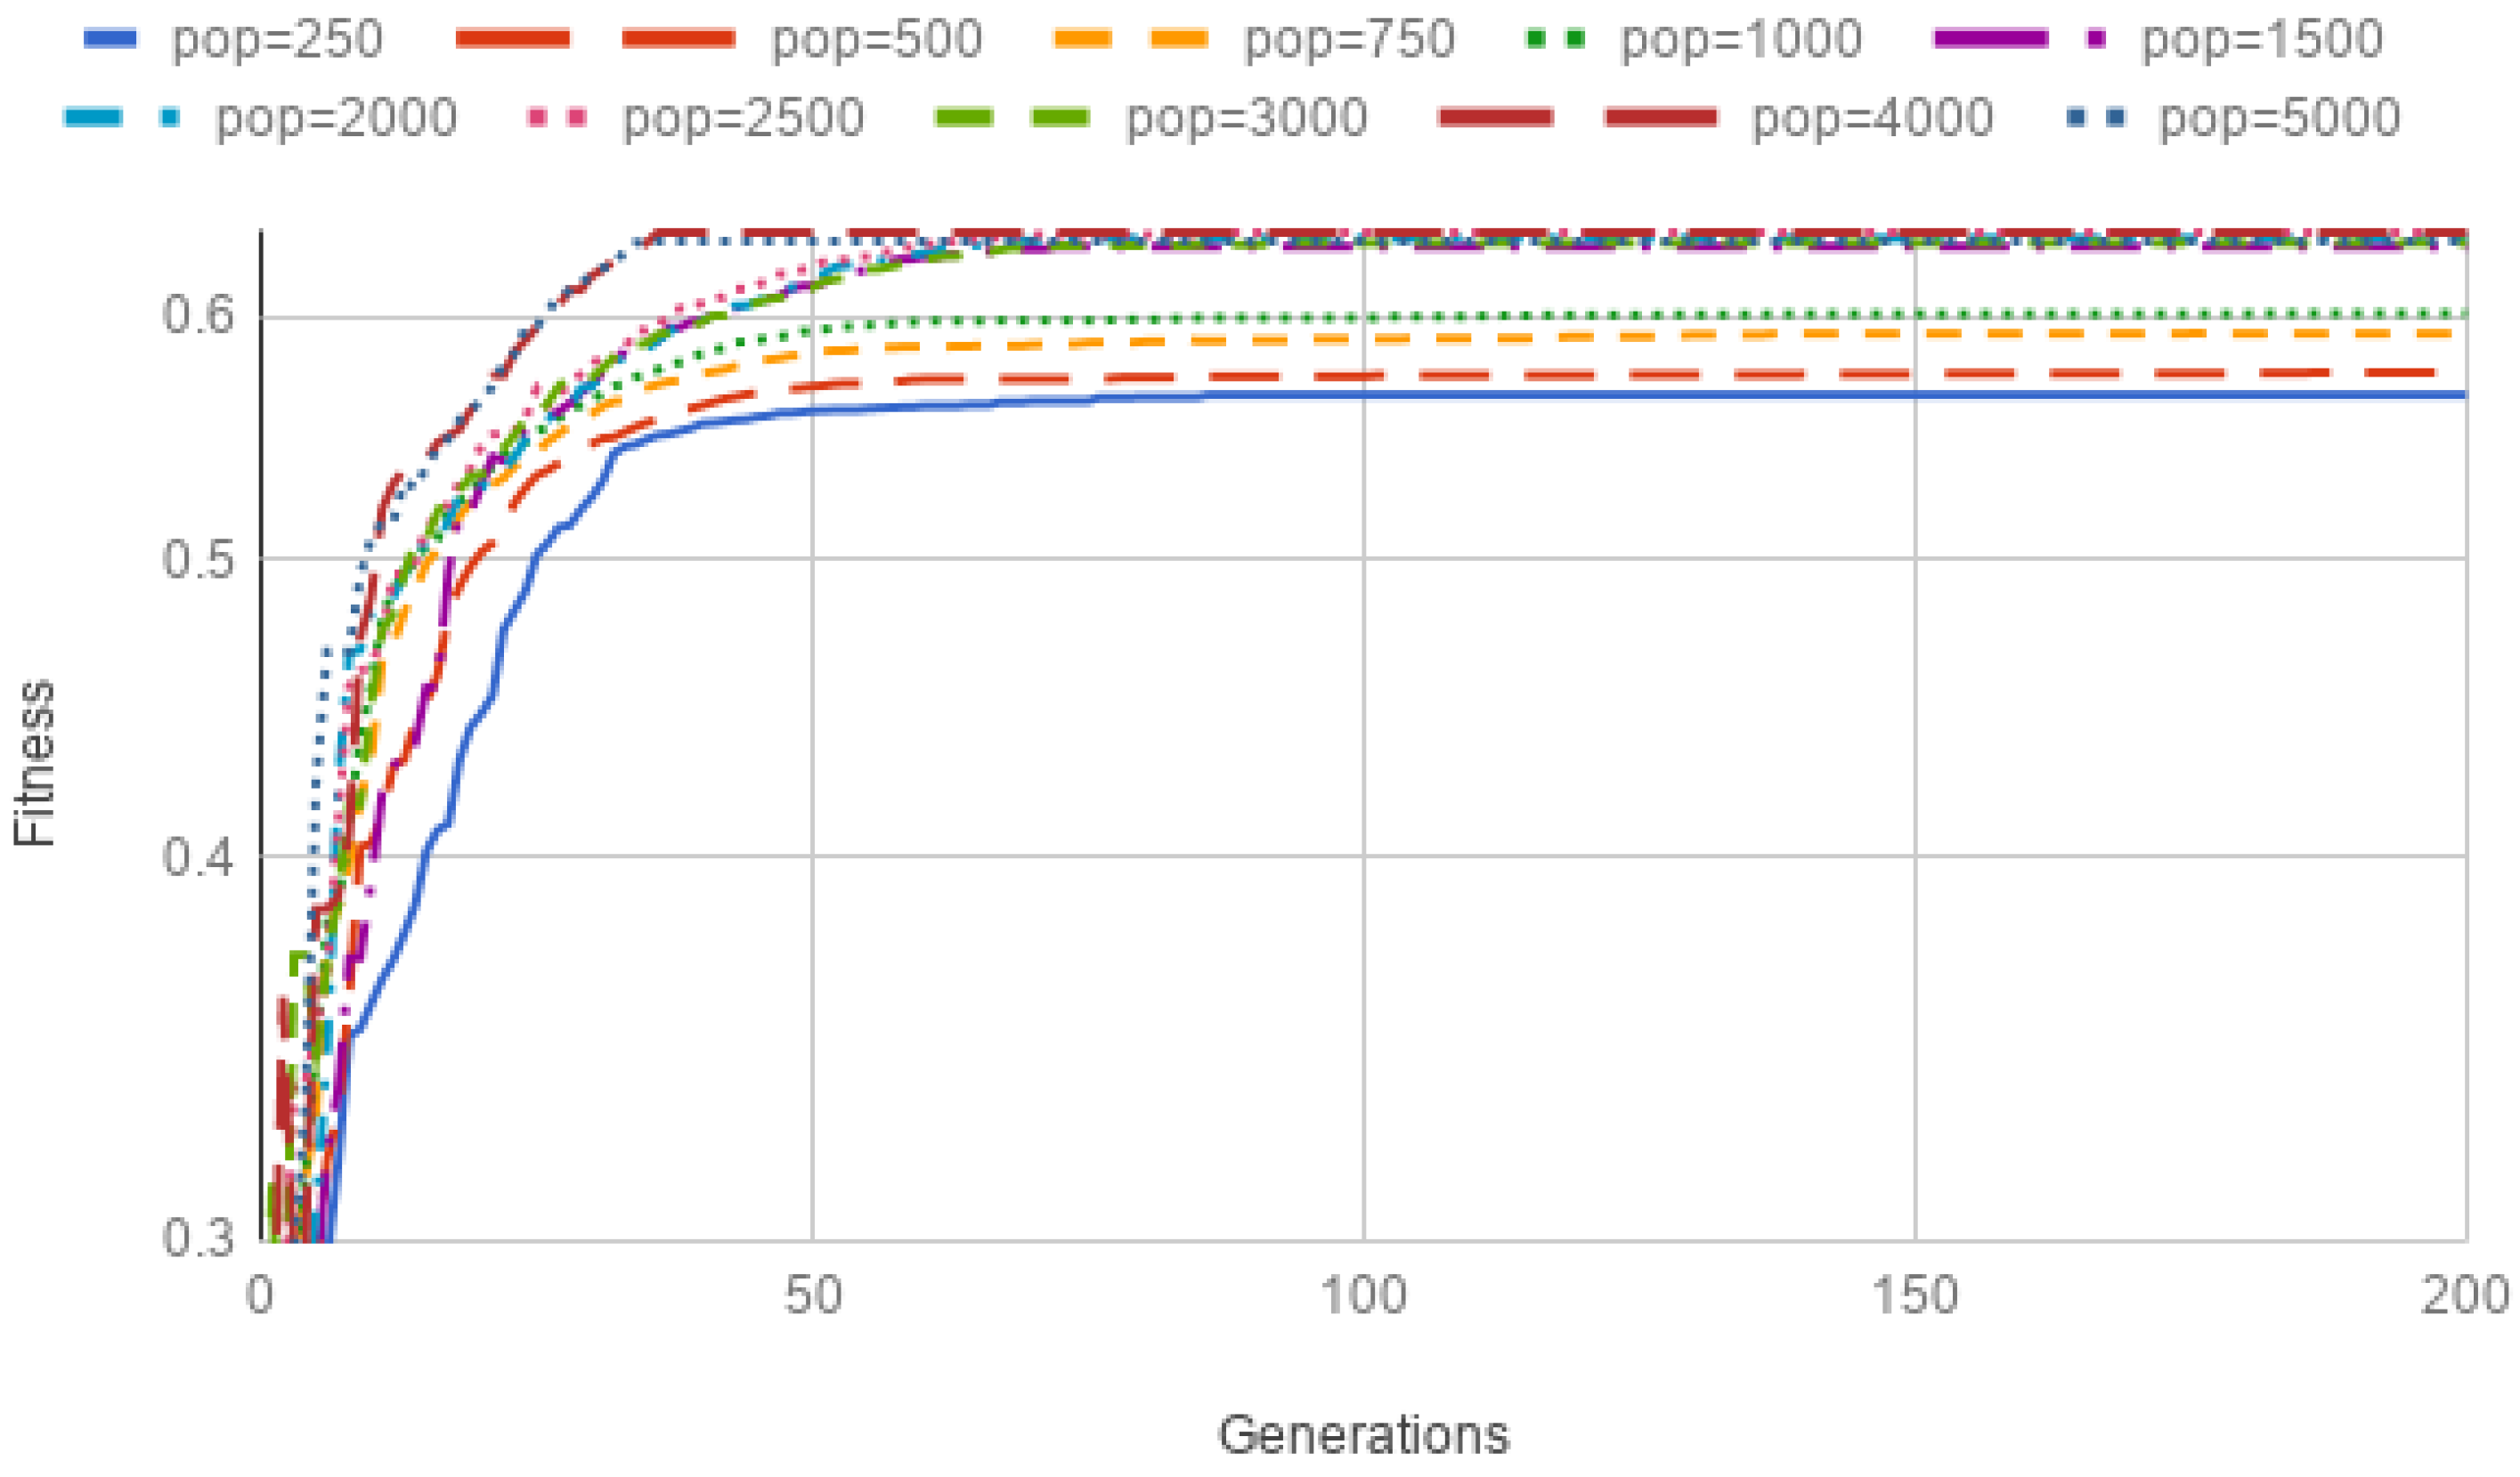
The graph of Figure 6 represents the evolution of the fitness function of the genetic algorithm with different initial populations from 0 to 200 generations. Each line is the mean of five different executions with the same corresponding parameter. The results of Figure 6 show that the more individuals in the initial population, the higher the maximum value of fitness, as it would be expected. This is caused by the fact that with more individuals it is easier to have high fitness values reached by the big population which may be rich genetically. Nevertheless, when the initial population is 1500 or more, there is no significant difference when the algorithm reaches more than 50 generations. The reason behind this is that a near-optimal solution is found if there is enough diversity in the population. Hence, there is no need for using a bigger initial population that does not contribute to finding better solutions. Therefore, it seems that in this particular scenario, an initial population of 2000 would be enough, while values of 3000 and 4000 may be considered if computation time is not a problem.
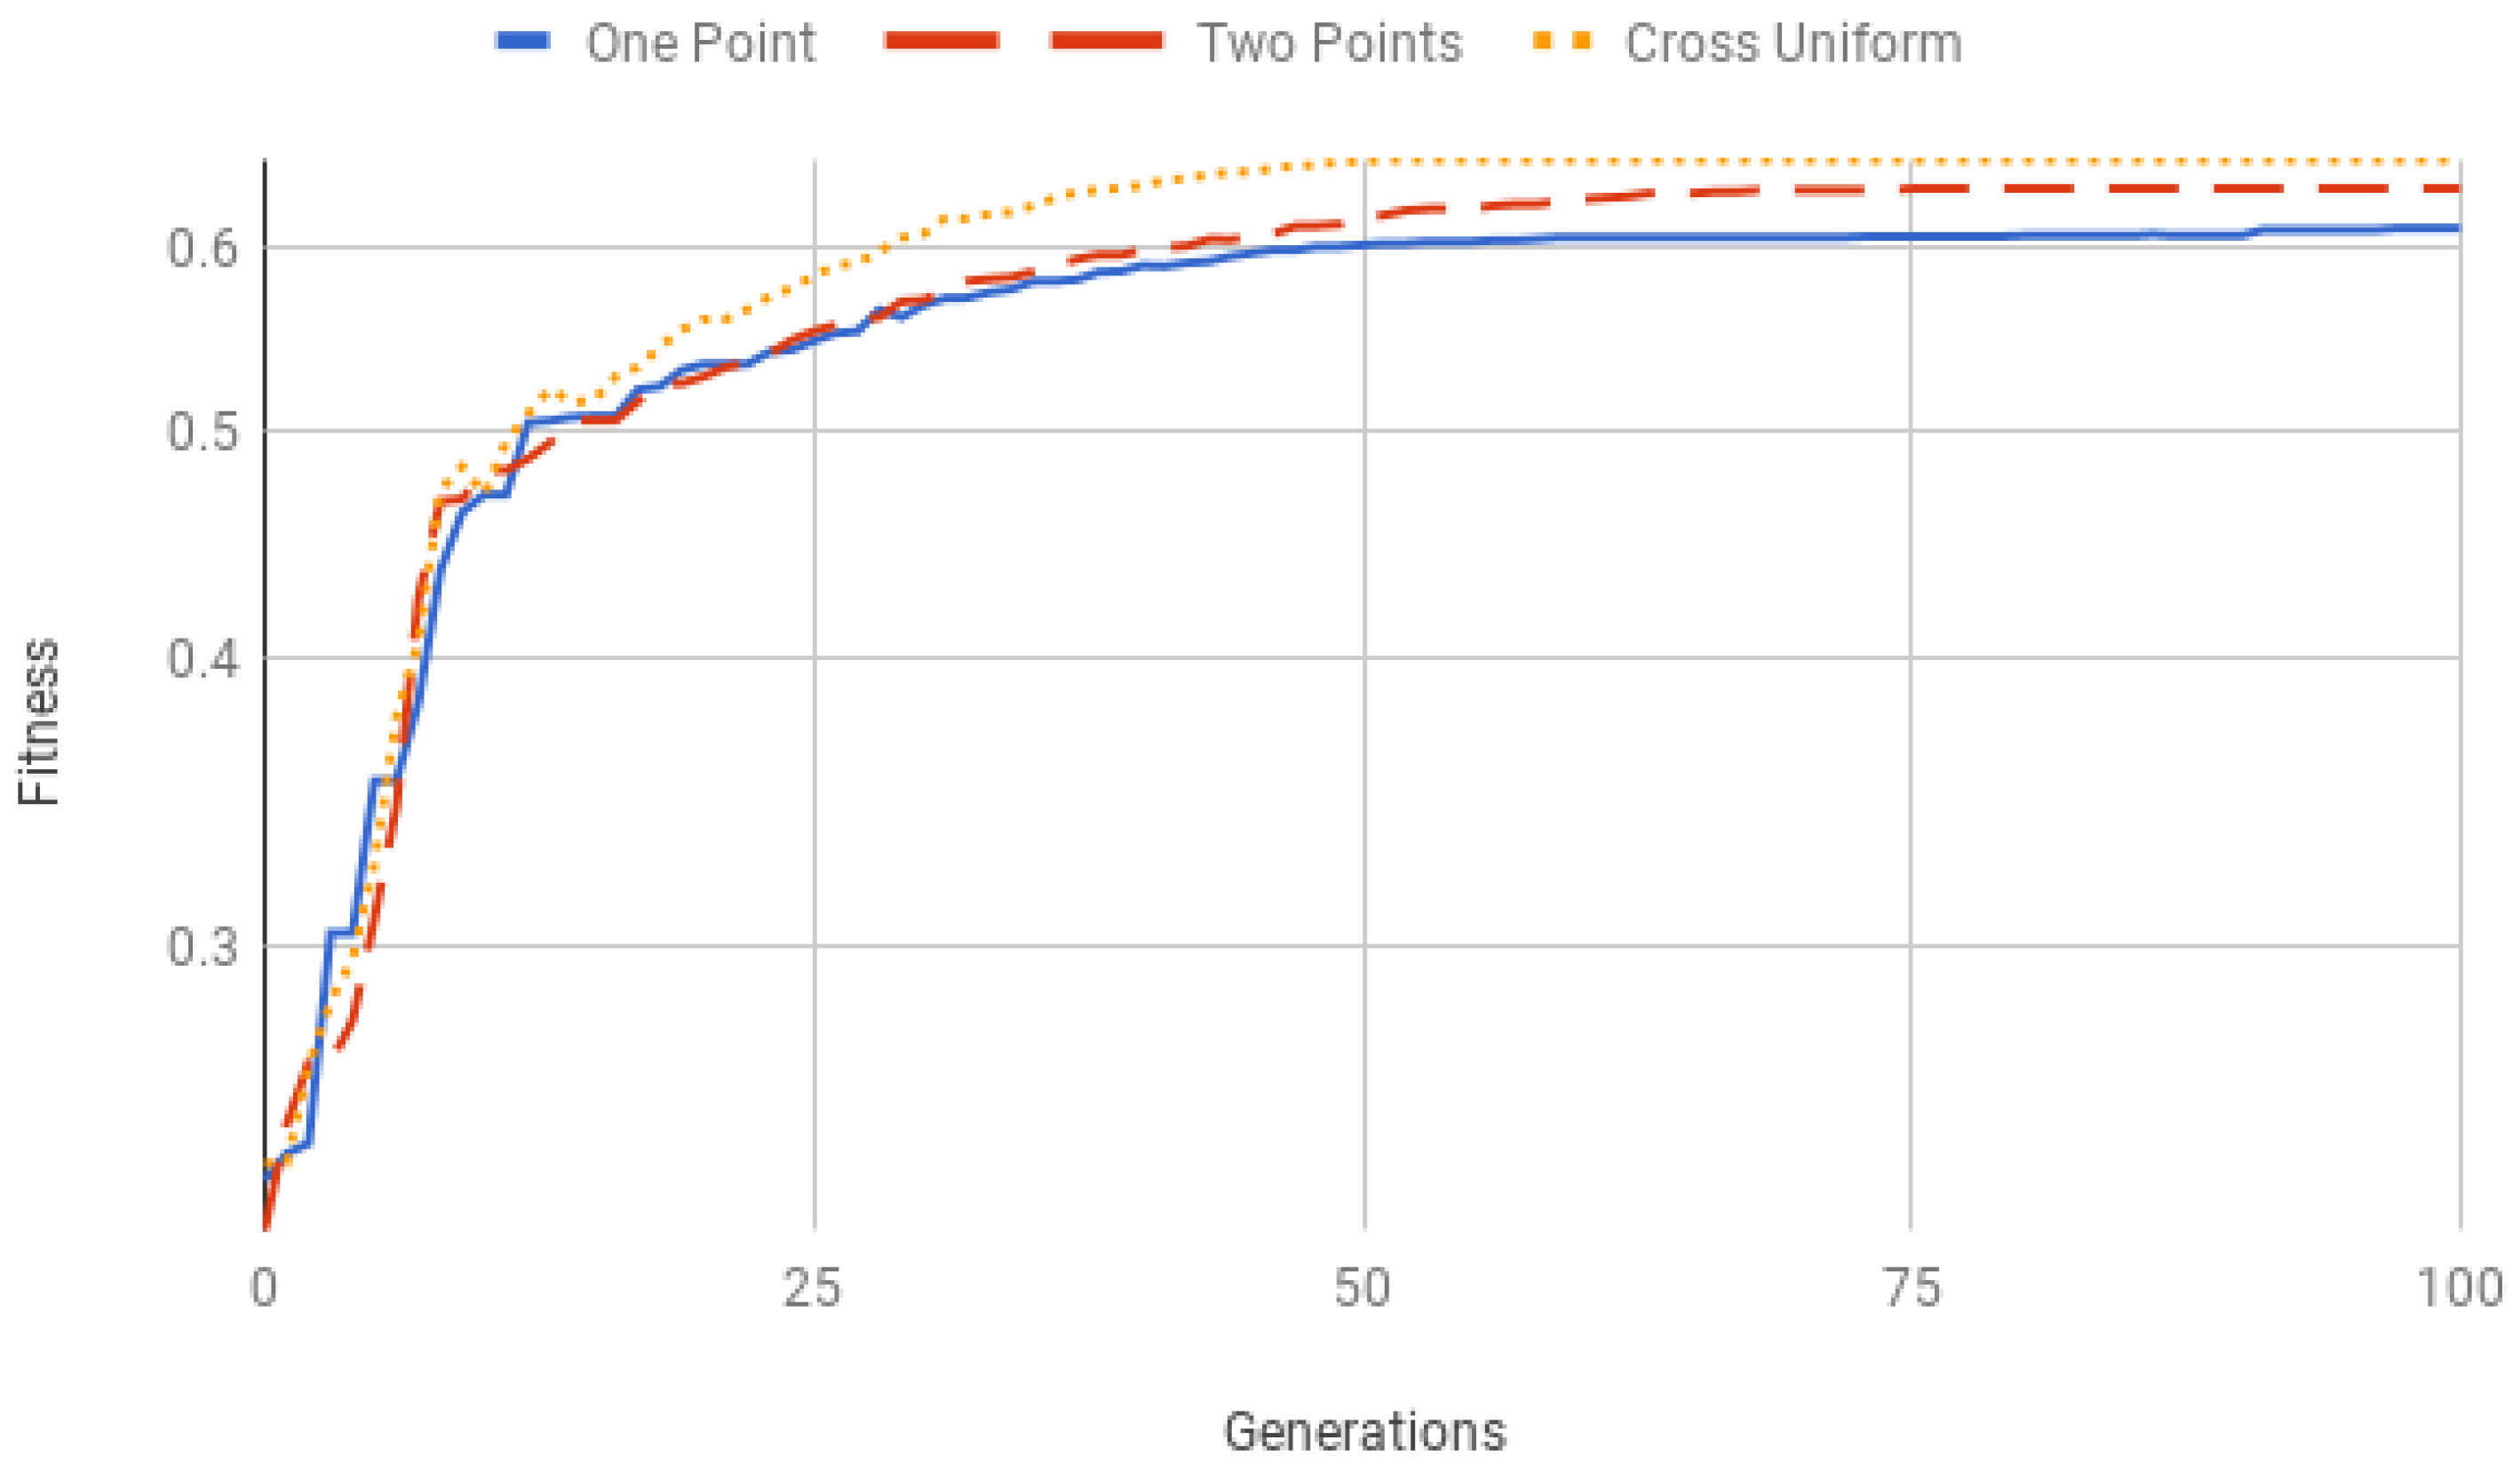
We also tested different crossover techniques of the genetic algorithm. Specifically, we tested the single point technique in which a single crossover point is selected and all data of the parents is swapped from that point; the two points technique, where two points of the chromosomes are selected and everything between these two points is swapped between the parents; and the cross uniform technique, that uses a fixed mixing ratio between the two parents and parents’ genes are swapped instead of segments of genes.
Figure 7 represents the value of fitness (the mean value of five executions) for each of the aforementioned crossover techniques with initial populations of 2000 individuals and 100 generations. The cross uniform technique has the best results in our scenario, followed by the two points technique. The reason for the better performance of the cross uniform technique is that it produces new individuals by mixing the parents at a gene level, which generates a richer population genetically. The lower performance of single point and two points techniques is caused by the crossover at segment level of genes instead of gene by gene, which yields in a lower rate of mixing of parents through different generations and greater difficulty in varying the population.
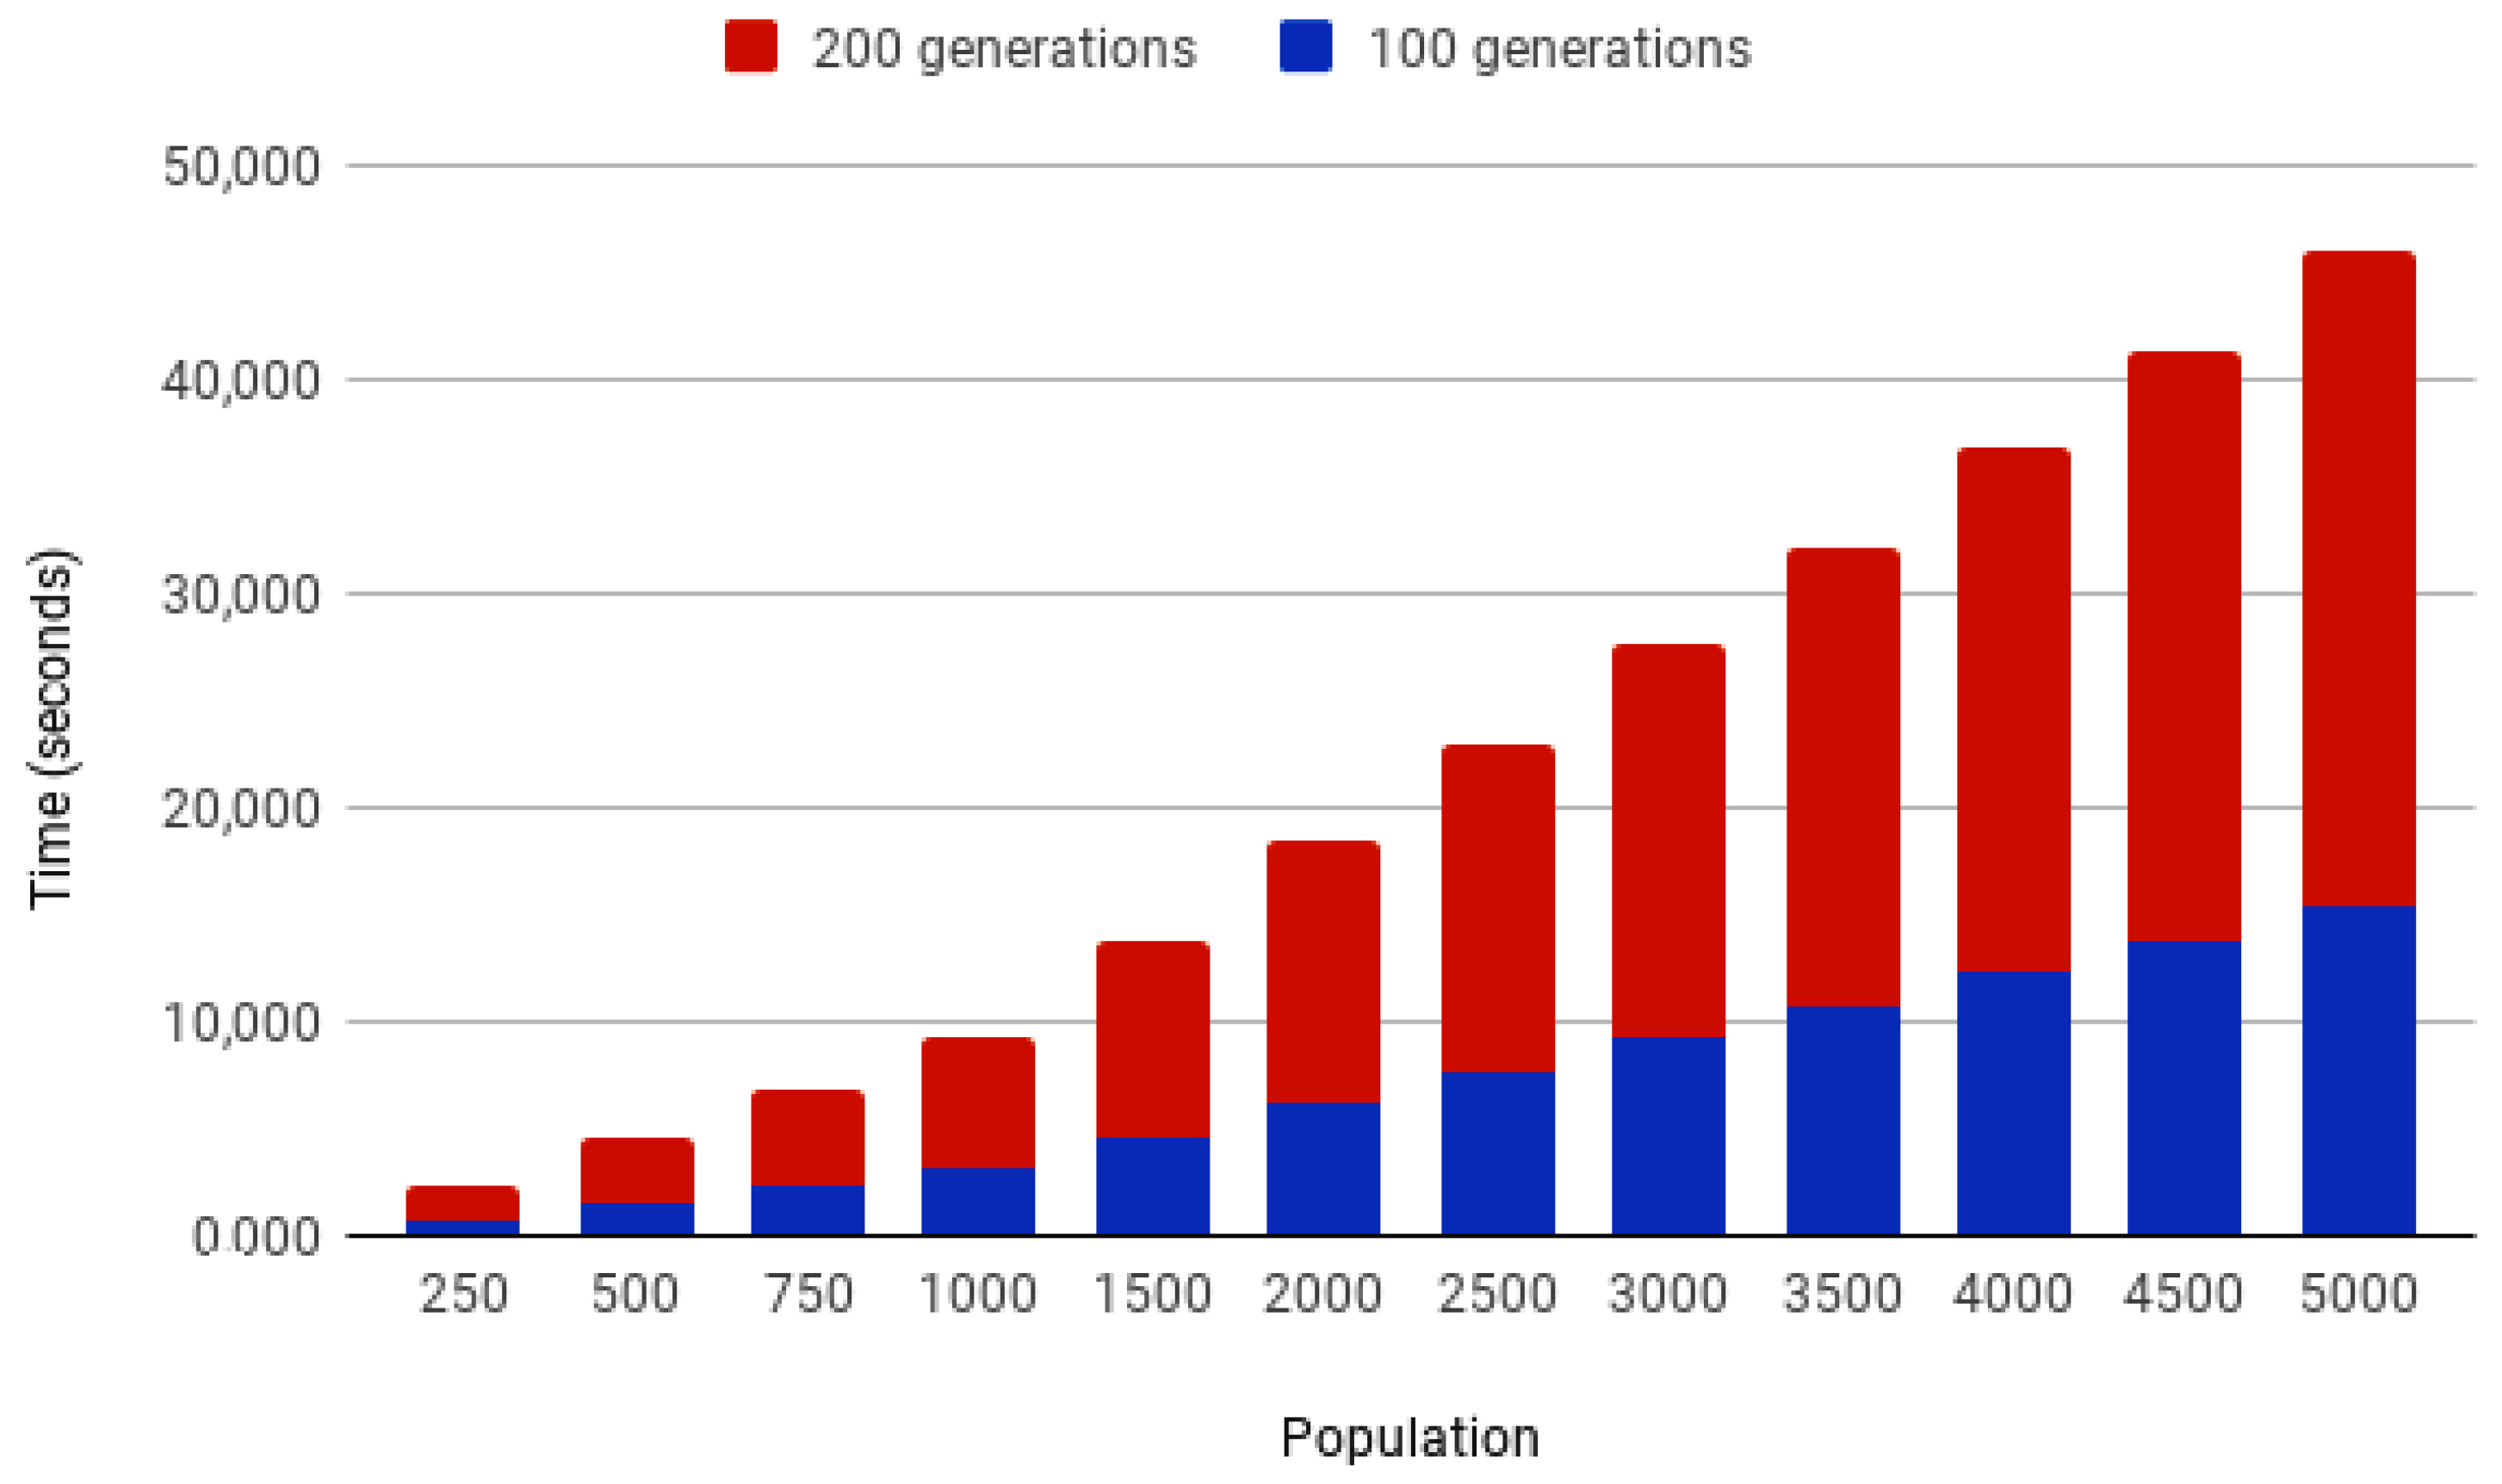
Figure 8 presents the computation time in seconds (all the tests were conducted on a single machine with an Intel Core i7-3770 CPU at 3.40 GHz and 8 GB RAM) for different initial populations of the genetic algorithm for 100 and 200 generations in our scenario. Each bar is calculated with the mean of five different executions of the genetic algorithm with the specified parameters. The computation time increases linearly with the population and generations. In this way, the computation times for 200 generations are approximately the double of the computation times for 100 generations.
Considering the complexity of this task, the computation times are tractable for initial populations around 2000 to 3000, which proved to be enough to find near-optimal solutions in the test of Figure 6. We provide a reminder here that the goal of our MAS is to find a solution to emplace charging stations in the city. Hence, computation times of the Emplacement Optimizer Agent of hours or even days can be acceptable for the users of our system.
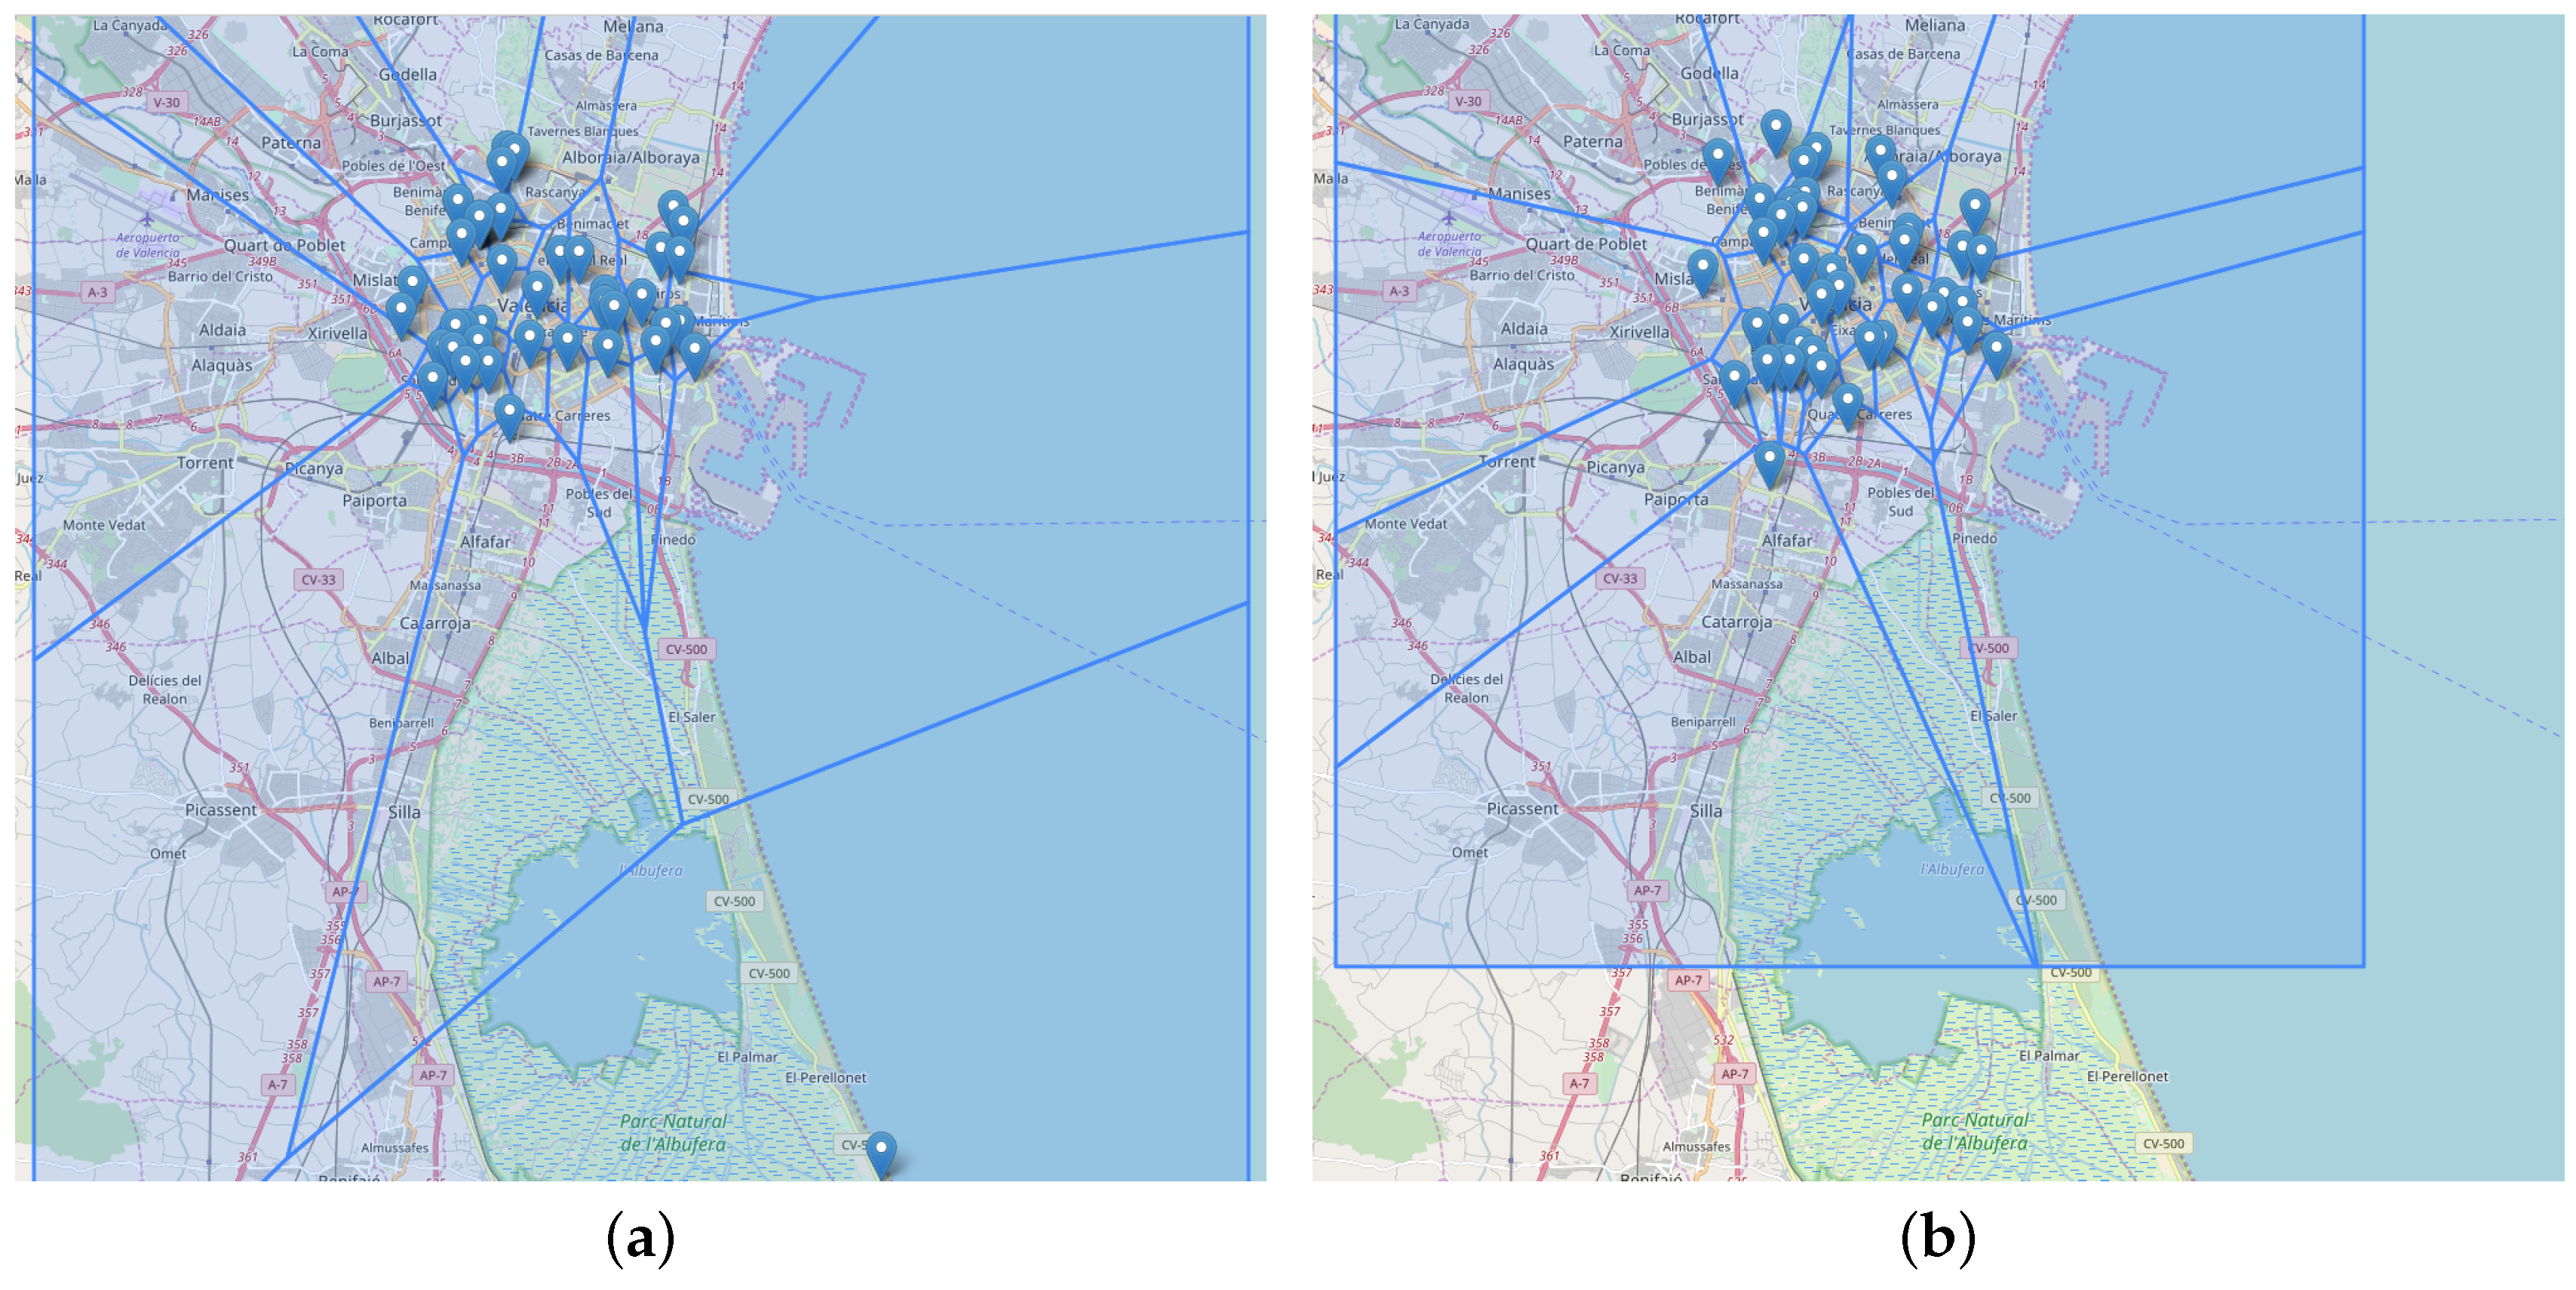
Finally, we show two specific results of the genetic algorithm for the particular case study of Valencia in order to compare solutions of different quality. Our goal is to analyze how accurate a solution with a high fitness value is compared to another with lower value. In this way, Figure 9 represents two computed solutions with our genetic algorithm. Figure 9a is a solution computed with an initial population of 250 and a fitness value of . The solution of Figure 9b is computed with an initial population of 4000 that yields a fitness value of . Both fitness values are close. However, as we showed in the analysis of Figure 6, there is a significant difference between the fitness values obtained.
The solution of Figure 9a has 40 charging stations, while the solution of Figure 9b uses 42 charging stations. In this way, both solutions are pretty similar, so the costs of implementing them would be almost the same (fixed cost by charging station is almost equal). There is a difference in the areas that covers the solution of Figure 9a, which considers bigger areas in the south of the city that will increase the cost of installing the stations. This is why solution of Figure 9b has a very similar cost even when placing more charging stations, but it better optimizes the areas covered by them. Therefore, the locations of the charging stations in both solutions also determine the quality of them. For instance, Figure 9a places a charging station in the far south of the city because there is some activity there. However, this activity is not significant enough and it would be a waste of resources to place a charging station so far out of the city because it is an area that does not need to be covered (in our scenario). The solution of Figure 9b places the charging stations more uniformly in the city, covering the full area where the main activity occurs, that is, the more populated and crowded areas. Concretely, there are several charging stations covering the center and north of the city which are not present in Figure 9a. Therefore, the solution of Figure 9b is more accurate according to the data showed in Figure 4, which explains the slightly higher fitness value that makes the solution better to implement in the particular case of Valencia.
6. Conclusions
This paper has presented a multi-agent system for which the goal is the planning of efficient placement of infrastructures for electric vehicle charging stations for public and private users in a city. The main advantages of the proposed system are the integration of information from different sources, and the modeling and location analysis of charging stations through the use of optimization techniques. The proposed solution allows us to obtain real-time data and different contexts with respect to the activity in a city. This information is relevant for detecting relevant points/areas of the city in order to place charging points. The proposed system has been implemented in the city of Valencia where different experiments have been done in order to validate the implementation. Results have shown how the genetic algorithm behaves with real input data from the city of Valencia.
In future work, the system can be extended for a more detailed analysis of the activity and mobility of people in the city. Specifically, the proposal can be applied for the detection of alternative routes to locate charging stations by the citizens, in order to facilitate accessibility between different charging stations or to identify more mobility patterns that affect the charging point infrastructure. We also plan to include information about the availability of dedicated parking spaces so as to potentially install charging points in the model.
Acknowledgments
This work was partially supported by the MINECO/FEDER TIN2015-65515-C4-1-R and MOVINDECI projects of the Spanish government.
Author Contributions
All authors contributed equally to this work.
Conflicts of Interest
The authors declare no conflict of interest. The founding sponsors had no role in the design of the study; in the collection, analyses, or interpretation of data; in the writing of the manuscript, and in the decision to publish the results.
References
- Wolfram, P.; Lutsey, N. Electric Vehicles: Literature Review of Technology Costs and Carbon Emissions; Technical Report; The International Council on Clean Transportation: Washington, DC, USA, 2016. [Google Scholar]
- Electric Vehicles in Europe; Technical Report; European Environment Agency: Copenhagen, Denmark, 2016.
- Klabjan, D.; Sweda, T. The nascent industry of electric vehicles. Wiley Encycl. Oper. Res. Manag. Sci. 2011. [Google Scholar] [CrossRef]
- Skippon, S.; Garwood, M. Responses to battery electric vehicles: UK consumer attitudes and attributions of symbolic meaning following direct experience to reduce psychological distance. Trans. Res. Part D Trans. Environ. 2011, 16, 525–531. [Google Scholar] [CrossRef]
- Dong, J.; Liu, C.; Lin, Z. Charging infrastructure planning for promoting battery electric vehicles: An activity-based approach using multiday travel data. Trans. Res. Part C Emerg. Technol. 2014, 38, 44–55. [Google Scholar] [CrossRef]
- Alternative Fueling Station Locator. 2017. Available online: http://www.afdc.energy.gov/locator/stations/ (accessed on 30 December 2017).
- How to Use the PlugShare EV Charging Station Tool. 2017. Available online: http://www.plugincars.com/how-to-use-plugshare-guide.html (accessed on 30 December 2017).
- AAA Adds EV Charging Station Locations to Mapping Tools. 2017. Available online: http://newsroom.aaa.com/2012/03/aaa-adds-ev-charging-station-locations-to-mapping-tools/ (accessed on 30 December 2017).
- Electric Vehicle Station Locator. 2017. Available online: https://www.nyserda.ny.gov/Researchers-and-Policymakers/Electric-Vehicles/Tools/Electric-Vehicle-Station-Locator (accessed on 30 December 2017).
- EV Infrastructure Corridor Development Toolkit. 2017. Available online: http://altfueltoolkit.org/ev-infrastructure-corridor-development-toolkit/ (accessed on 30 December 2017).
- Association, C.E. Planning for Electric Vehicle Charging Infrastructure: A Toolkit. 2013. Available online: https://www.zap-map.com/live/ (accessed on 30 December 2017).
- Gan, L.; Topcu, U.; Low, S.H. Optimal decentralized protocol for electric vehicle charging. IEEE Transp. Power Syst. 2013, 28, 940–951. [Google Scholar] [CrossRef]
- Ma, T.; Mohammed, O.A. Optimal charging of plug-in electric vehicles for a car-park infrastructure. IEEE Transp. Ind. Appl. 2014, 50, 2323–2330. [Google Scholar] [CrossRef]
- Shukla, A.; Pekny, J.; Venkatasubramanian, V. An optimization framework for cost effective design of refueling station infrastructure for alternative fuel vehicles. Comput. Chem. Eng. 2011, 35, 1431–1438. [Google Scholar] [CrossRef]
- Nie, Y.M.; Ghamami, M. A corridor-centric approach to planning electric vehicle charging infrastructure. Transp. Res. Part B Methodol. 2013, 57, 172–190. [Google Scholar] [CrossRef]
- Wood, E.; Neubauer, J.S.; Burton, E. Measuring the Benefits of Public Chargers and Improving Infrastructure Deployments Using Advanced Simulation Tools; Technical Repor; SAE Technical Paper; National Renewable Energy Lab. (NREL): Golden, CO, USA, 2015.
- Lacey, G.; Putrus, G.; Bentley, E.; Johnston, D.; Walker, S.; Jiang, T. A modelling tool to investigate the effect of electric vehicle charging on low voltage networks. In Proceedings of the 2013 World Electric Vehicle Symposium and Exhibition (EVS27), Barcelona, Spain, 17–20 November 2013; pp. 1–7. [Google Scholar]
- Wagner, S.; Götzinger, M.; Neumann, D. Optimal Location of Charging Stations in Smart Cities: A Points of Interest Based Approach; ICIS: Milan, Italy, 2013. [Google Scholar]
- Tu, W.; Li, Q.; Fang, Z.; Shaw, S.l.; Zhou, B.; Chang, X. Optimizing the locations of electric taxi charging stations: A spatial-temporal demand coverage approach. Transp. Res. Part C Emerg. Technol. 2016, 65, 172–189. [Google Scholar] [CrossRef]
- Li, Z.; Cui, X. Research on Location Problem of Electric Vehicle Charging Station. J. Appl. Sci. Eng. Innov. 2015, 2, 495–498. [Google Scholar]
- Sweda, T.; Klabjan, D. An agent-based decision support system for electric vehicle charging infrastructure deployment. In Proceedings of the 2011 IEEE Vehicle Power and Propulsion Conference, Chicago, IL, USA, 6–9 September 2011; pp. 1–5. [Google Scholar]
- Franke, T.; Krems, J.F. Understanding charging behaviour of electric vehicle users. Transp. Res. Part F Traffic Psychol. Behav. 2013, 21, 75–89. [Google Scholar] [CrossRef]
- Franke, T.; Günther, M.; Trantow, M.; Krems, J.F.; Vilimek, R.; Keinath, A. Examining user-range interaction in battery electric vehicles—A field study approach. In Advances in Human Aspects of Transportation Part II; AHFE Conference: Krakow, Poland, 2014; pp. 334–344. [Google Scholar]
- Needell, Z.A.; McNerney, J.; Chang, M.T.; Trancik, J.E. Potential for widespread electrification of personal vehicle travel in the United States. Nat. Energy 2016, 1, 16112. [Google Scholar] [CrossRef]
- Sedano Franco, J.; Portal García, M.; Hernández Arauzo, A.; Villar Flecha, J.R.; Puente Peinador, J.; Varela Arias, J.R. Sistema inteligente de recarga de vehículos eléctricos: Diseño y operación. Dyna 2013, 88, 644–651. [Google Scholar] [CrossRef]
- Vivanco, E.; Palanca, J.; del Val, E.; Rebollo, M.; Botti, V. Using geo-tagged sentiment to better understand social interactions. In Advances in Practical Applications of Cyber-Physical Multi-Agent Systems: The PAAMS Collection; Springer: Cham, Switzerland, 2017; pp. 369–372. [Google Scholar]
- del Val, E.; Palanca, J.; Rebollo, M. U-Tool: A Urban-Toolkit for enhancing city maps through citizens’ activity. In Advances in Practical Applications of Scalable Multi-agent Systems: The PAAMS Collection; Springer: Cham, Switzerland, 2016; pp. 243–246. [Google Scholar]
- del Val, E.; Martínez, C.; Botti, V. Analyzing users’ activity in online social networks over time through a multi-agent framework. Soft Comput. 2016, 20, 4331–4345. [Google Scholar] [CrossRef]
- Transporte, D.G.d.M. Hoja De Ruta Hacia Un Espacio único Europeo De Transporte: Por Una Política De Transportes Competitiva Y Sostenible. 2011. Available online: https://ec.europa.eu/transport/sites/transport/files/themes/strategies/doc/2011_white_paper/white-paper-illustrated-brochure_es.pdf (accessed on 30 December 2017).
- Electromaps. Electromaps: Puntos De Recarga en Valencia. 2017. Available online: https://www.electromaps.com/puntos-de-recarga/espana/valencia (accessed on 30 December 2017).
- Levante. Grezzi Anuncia Más Puntos De Recarga Para Los Coches Eléctricos. 2017. Available online: http://www.levante-emv.com/valencia/2017/04/23/grezzi-anuncia-puntos-recarga-coches/1557495.html (accessed on 30 December 2017).
Figure 1.
Modules that comprise the tool. PoIs: points of interest.

Figure 2.
The encoding of an individual.

Figure 3.
Voronoi diagram from the selected zones as potential points to locate charging stations.

Figure 4.
Maps that show the characteristics considered for each charging station.

Figure 5.
Configuration of the location of the charging stations displayed by the User Interface Agent.
Figure 5.
Configuration of the location of the charging stations displayed by the User Interface Agent.

Figure 6.
Evolution of maximum fitness values for different initial populations.

Figure 7.
Maximum fitness values for different crossover techniques with an initial population of 2000.
Figure 7.
Maximum fitness values for different crossover techniques with an initial population of 2000.

Figure 8.
Computation time of different executions of the genetic algorithm.

Figure 9.
Computed solutions by the genetic algorithm for the city of Valencia. (a) Solution with a fitness value of 0.563; (b) Solution with a fitness value of 0.639.
Figure 9.
Computed solutions by the genetic algorithm for the city of Valencia. (a) Solution with a fitness value of 0.563; (b) Solution with a fitness value of 0.639.


Table 1.
Comparison of approaches that deal with the electric vehicle (EV) charging station placement. PoI: point of interest.
Table 1.
Comparison of approaches that deal with the electric vehicle (EV) charging station placement. PoI: point of interest.
| Traffic, Frequent Routes | Social Data | Population | Time Spent in a PoI | Cost Per Station | Demand Per Station | |
|---|---|---|---|---|---|---|
| Shukla et al. | ✓ | ✓ | ||||
| Nie et al. | ✓ | ✓ | ||||
| Wood et al. | ✓ | ✓ | ✓ | |||
| Wagner et al. | ✓ | ✓ | ✓ | |||
| Wei et al. | ✓ | ✓ | ||||
| Dong et al. | ✓ | ✓ | ✓ | |||
| Li et al. | ✓ | ✓ | ✓ | ✓ | ||
| Sweda et al. | ✓ | ✓ | ||||
| Proposal | ✓ | ✓ | ✓ | ✓ | ✓ | ✓ |
Table 2.
Areas selected as potential points to locate EV charge stations.
| Charge Mode | Charge Schedule | Stay Time | Connection Property | |
|---|---|---|---|---|
| Shopping Mall | Fast charge, slow charge | Weekdays 19:00–22:00 h and weekends | 1.2 h | Public |
| Workplace | Slow charge | Weekdays 07:00–19:00 h and weekends | 9 h | Public/Private |
| Parking | Slow charge | 24 h | 2 h | Public |
| Public thoroughfare | Fast charge, slow charge | 24 h | 1–12 h | Public |
| Neighborhood community | Slow charge | 08:00–20:00 h | 12 h | Private |
| Private garage | Slow charge | 24 h | 12 h | Private |
| Refueling stations | Fast charge, battery change | 24 h | 10 min | Public |
| Vehicle fleet parking | Fast charge, slow charge, battery change | 24 h | 15 min–12 h | Private |
© 2018 by the authors. Licensee MDPI, Basel, Switzerland. This article is an open access article distributed under the terms and conditions of the Creative Commons Attribution (CC BY) license (http://creativecommons.org/licenses/by/4.0/).
Share and Cite
MDPI and ACS Style
Jordán, J.; Palanca, J.; Del Val, E.; Julian, V.; Botti, V. A Multi-Agent System for the Dynamic Emplacement of Electric Vehicle Charging Stations. Appl. Sci. 2018, 8, 313. https://doi.org/10.3390/app8020313
AMA Style
Jordán J, Palanca J, Del Val E, Julian V, Botti V. A Multi-Agent System for the Dynamic Emplacement of Electric Vehicle Charging Stations. Applied Sciences. 2018; 8(2):313. https://doi.org/10.3390/app8020313
Chicago/Turabian StyleJordán, Jaume, Javier Palanca, Elena Del Val, Vicente Julian, and Vicente Botti. 2018. "A Multi-Agent System for the Dynamic Emplacement of Electric Vehicle Charging Stations" Applied Sciences 8, no. 2: 313. https://doi.org/10.3390/app8020313
Note that from the first issue of 2016, this journal uses article numbers instead of page numbers. See further details here.