Article

Metaheuristic Algorithm for Photovoltaic Parameters: Comparative Study and Prediction with a Firefly Algorithm

1
Mathematics Informatic & Applications Team, National School of Applied Sciences, Abdelmalek Essaadi University, Tanger 1818, Morocco
2
Department of Energy, Politecnico di Milano, 20156 Milano, Italy
3
Electrical Engineering Department, University Politehnica of Bucharest, Bucharest 060042, Romania
*
Author to whom correspondence should be addressed.
Appl. Sci. 2018, 8(3), 339; https://doi.org/10.3390/app8030339
Submission received: 31 December 2017 / Revised: 15 February 2018 / Accepted: 20 February 2018 / Published: 27 February 2018
(This article belongs to the Special Issue Computational Intelligence in Photovoltaic Systems)

Abstract

:

Featured Application

The parameter identification of solar cell and photovoltaic module are used for evaluation, control and optimization of photovoltaic systems.

Abstract

In this paper, a Firefly algorithm is proposed for identification and comparative study of five, seven and eight parameters of a single and double diode solar cell and photovoltaic module under different solar irradiation and temperature. Further, a metaheuristic algorithm is proposed in order to predict the electrical parameters of three different solar cell technologies. The first is a commercial RTC mono-crystalline silicon solar cell with single and double diodes at 33 °C and 1000 W/m2. The second, is a flexible hydrogenated amorphous silicon a-Si:H solar cell single diode. The third is a commercial photovoltaic module (Photowatt-PWP 201) in which 36 polycrystalline silicon cells are connected in series, single diode, at 25 °C and 1000 W/m2 from experimental current-voltage. The proposed constrained objective function is adapted to minimize the absolute errors between experimental and predicted values of voltage and current in two zones. Finally, for performance validation, the parameters obtained through the Firefly algorithm are compared with recent research papers reporting metaheuristic optimization algorithms and analytical methods. The presented results confirm the validity and reliability of the Firefly algorithm in extracting the optimal parameters of the photovoltaic solar cell.

Graphical Abstract

1. Introduction

The use of renewable energy sources is rapidly developing, and the application of solar energy focusing on photovoltaic systems is becoming increasingly popular [1,2]. The major challenge in photovoltaics system is posed by the instability, nonlinearity and complexity of the current-voltage and power-voltage characteristics equation. The relation between photovoltaic current and voltage is both implicit and nonlinear [3,4,5,6] and it depends on several factors such as module temperature, solar radiation and its distribution, spectrum, cable losses, dust accumulation, shading and soiling [7,8]. Therefore, it is vital to produce a more accurate mathematical model that can better reveal the actual behavior and represent the relationship between current and voltage. In this context, many mathematical models have been developed in the literature to describe the electric, dynamic and thermal behavior of photovoltaic cell/module with a different level of complexity. In particular, the solar cell can be modelled as a static model for DC/DC (direct current), or as a dynamic model for DC/AC (alternating current) with capacitance and parallel dynamic resistance, with diode and photocurrent as proposed in [9,10,11]. They can be classified globally into two categories: implicit and explicit models [12,13]. The former [5,14,15,16] need iterative numerical methods to solve the nonlinear current-voltage equation. On the other hand, the latter models are based on simple analytical expressions [4,17,18,19,20,21,22]. Different physical models were compared on photovoltaic power output prediction in [23] and available models of solar cell are presented in [24]. A different photovoltaic model used for 24-hour-ahead forecasting using neural network is presented in [25], while a comparison between physical and hybrid methods is given in [26] and artificial neural network models are employed in [27]. These models differ mainly by the number of diodes, the presence or absence of a shunt resistor, and by the numerical methods used to determine the unknown parameters. Further, the two diodes model is known as the most accurate model for representing the equivalent electrical circuit. While the single diode model is the most commonly used of the two types; in the simplified four-parameter model neglecting shunt resistance by assuming it as infinite value, and in five-parameter models by maintaining the effect of the shunt resistance. The five and seven parameters models evaluate the photocurrent, the saturation current, the series and shunt resistors and the quality factor of the diode. The eight parameters model adds build-in voltage, thickness, average mobility-lifetime.
The exponential non-linearity of current-voltage equations causes many difficulties in prediction and extraction of the electric, dynamic or thermal parameters [28] while, the implicit models are not capable of determining the behavior of the photovoltaic cell/module under many effects. Furthermore, solar cell models have multi-modal objective functions and model parameters vary with operational conditions such as temperature and irradiance. The main problem is to identify the optimal parameter values such as photo-generated current, diode saturation current, series resistance, and diode quality factor. Over the years, various papers have been presented and developed different techniques to identify the optimal values of the electric parameters to describe the behavior of the characteristics. These can be categorized into analytical methods, numerical methods and metaheuristic methods. There are several analytical and numerical (generally gradient-based) methods, as described in Table 1.
Metaheuristic methods are powerful in local searches, but they tend to get trapped in locally optimal values and depend on the photovoltaic module’s manufacturer’s data such as open circuit, short circuit, and maximum power points. Since the photovoltaic cell has triple non-linearity in current-voltage, power-voltage and in intrinsic parameters, deterministic methods cannot extract parameters accurately based on current, voltage and current derivatives with respect to the voltage at short circuit current, maximum power and open circuit voltage. The derivation imposes several model restrictions such as convexity, continuity and differentiability conditions; moreover, the approximations also reduce accuracy. Due to their great potential in modern global optimization resolution for nonlinear and complex systems, the use of metaheuristic bioinspired optimization algorithms to carry out minimizing procedures has received considerable attention. Metaheuristic methods are stochastic methods inspired by various natural phenomenon, as listed in Table 2. They have been proven to be a promising alternative to deterministic methods applied to the parameter identification of solar/photovoltaic models.
However, the cited algorithms are usually trapped at local optima and they have large error values [62]. In fact, the performance of these algorithms highly depends on the settings of specific parameters, such as, for instance, the mutation probability, crossover probability, and the selection operator in the genetic algorithm, as well as the inertia weight, and social and cognitive parameters in particle swarm optimization. Therefore, researchers are still searching for powerful algorithms capable of predicting the optimal parameters of different technology under various conditions with less errors.
Metaheuristic bioinspired algorithms have been suggested for parameter extraction and have become an important part of modern optimization. Most metaheuristic algorithms are based on natural or artificial swarm intelligence. Particle swarm optimization is a good example, it mimics the swarming behavior of bees and birds [
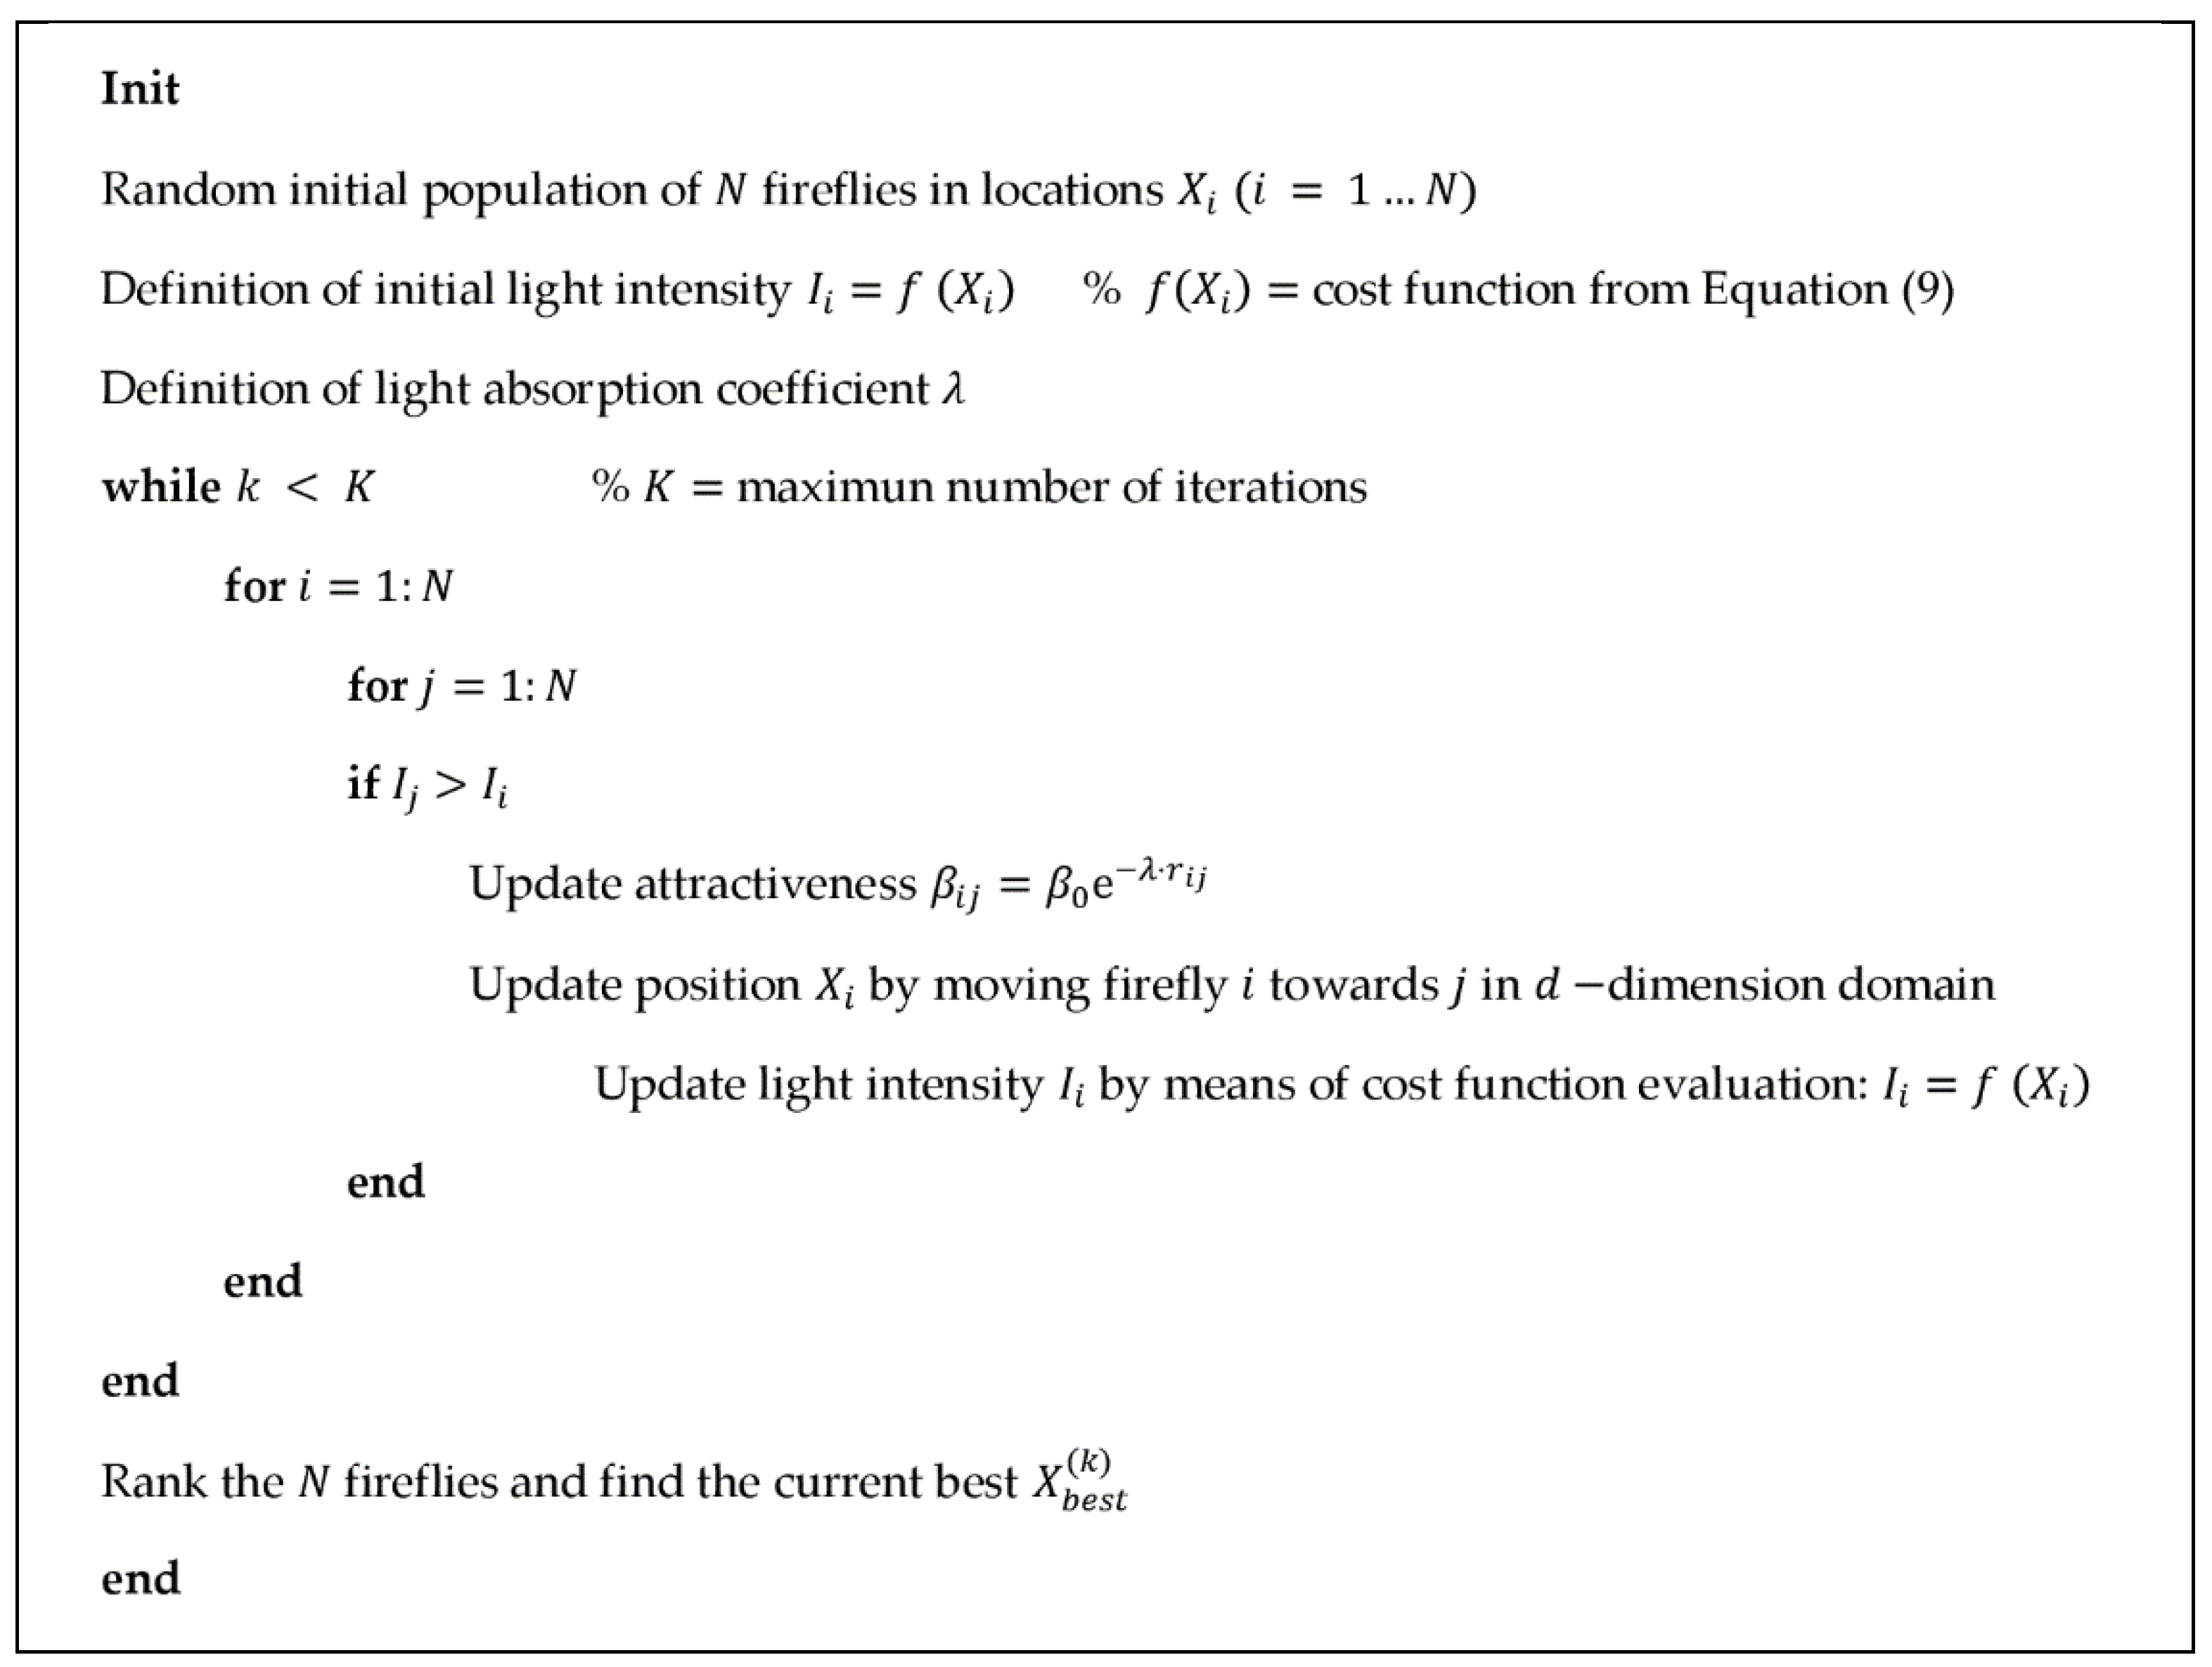
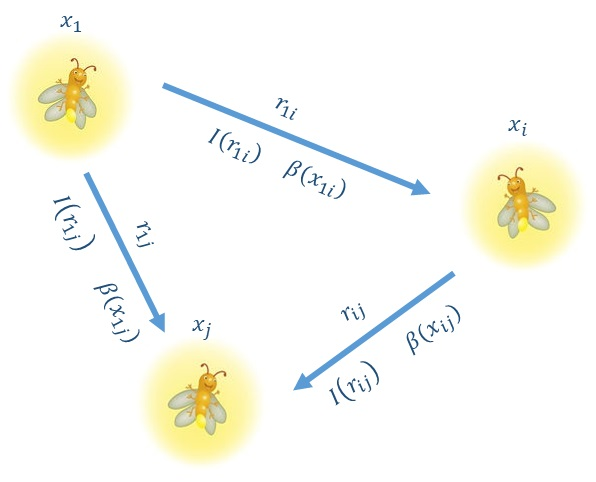
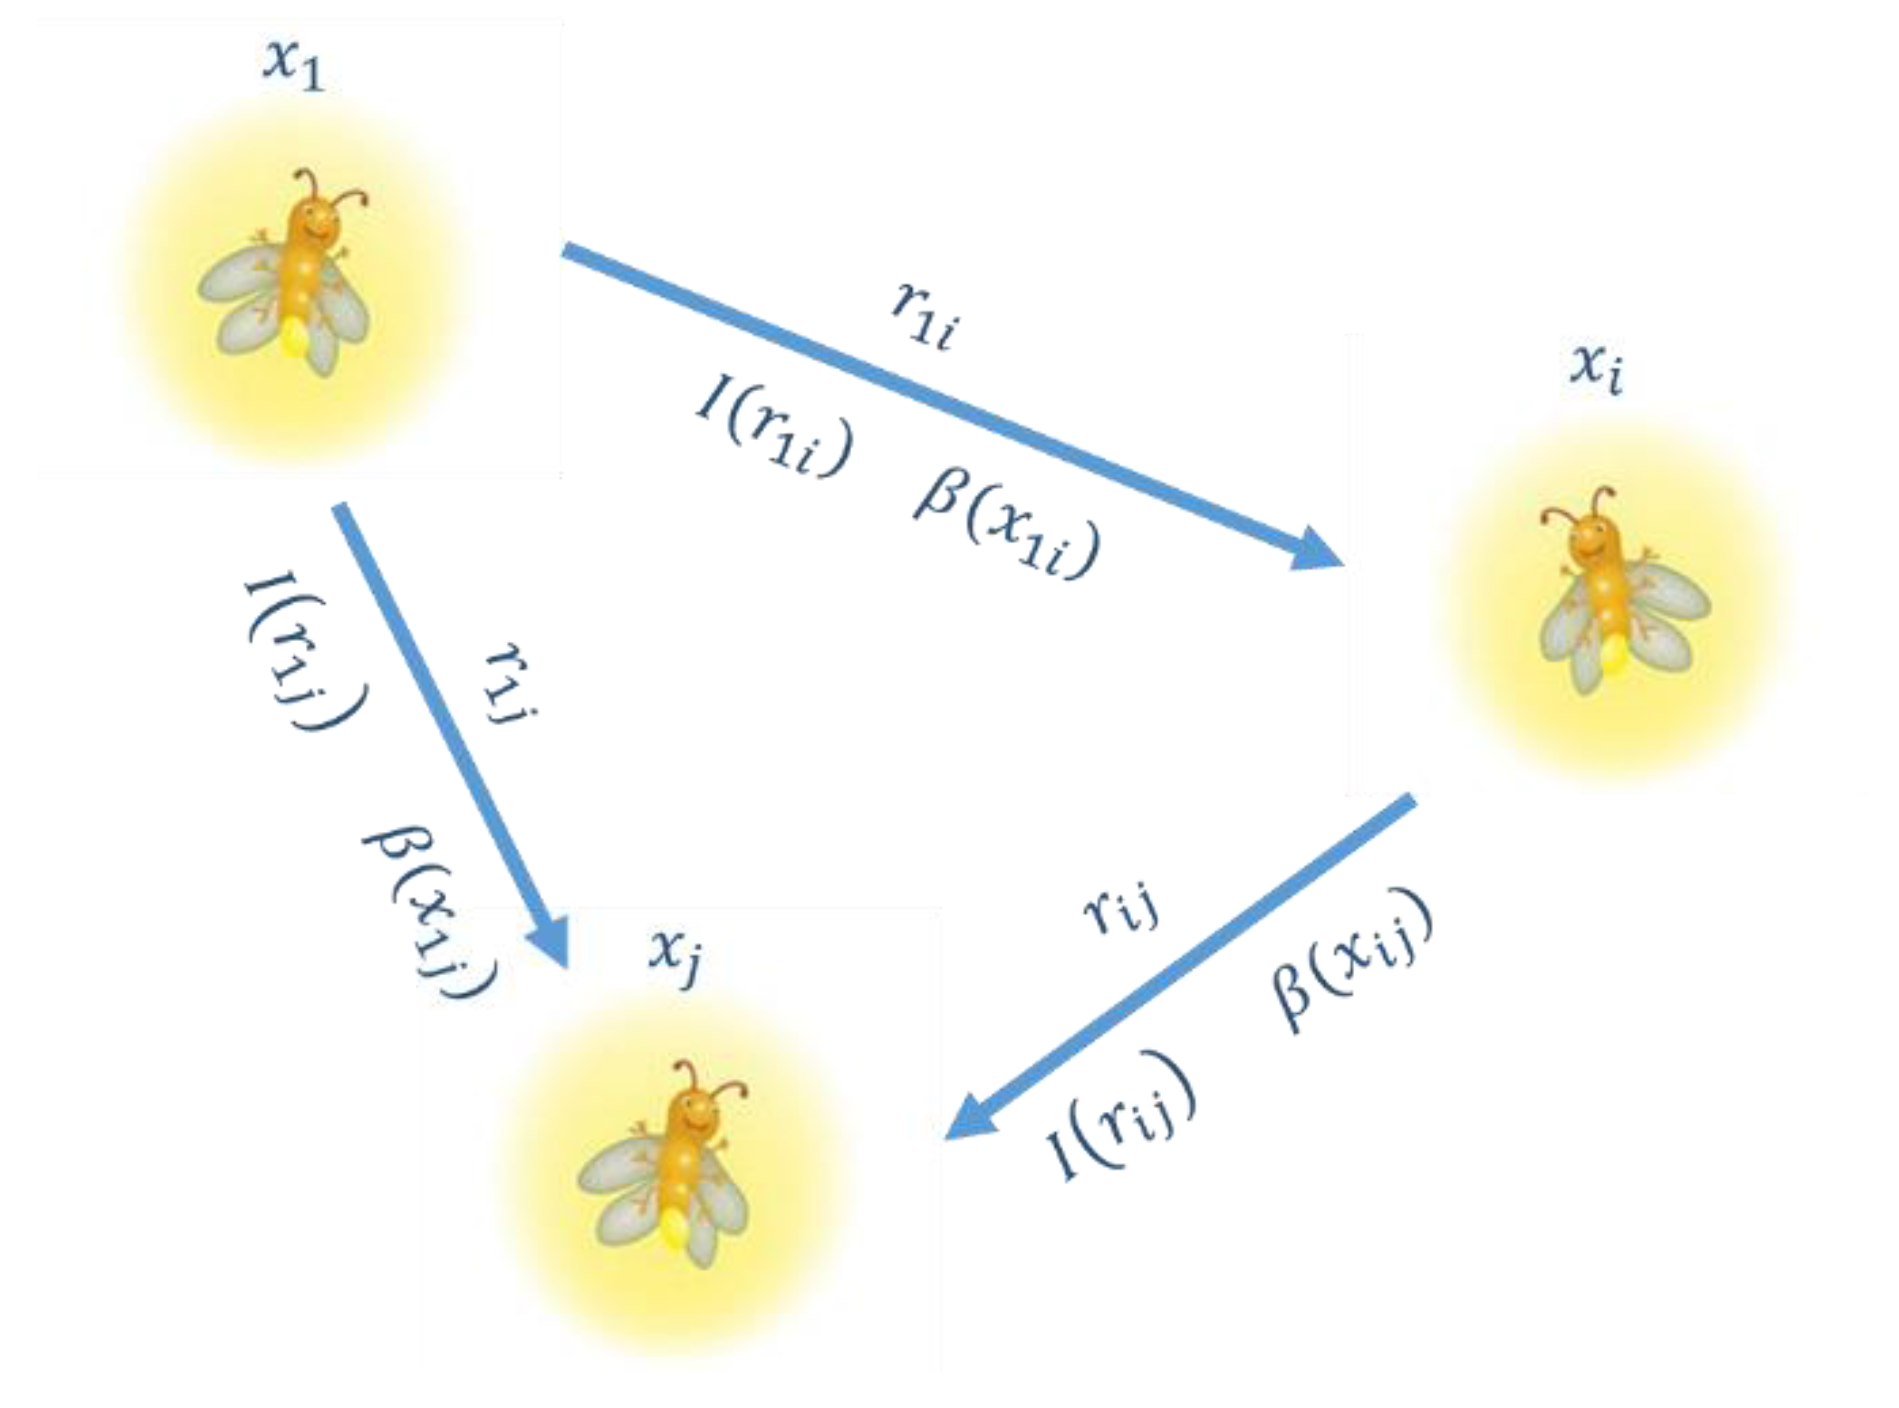
62]. Recently, a new metaheuristic search algorithm called the firefly algorithm (FA) has been proposed and developed by X. Yang [63]. The FA is a nature-inspired stochastic optimization algorithm based on the flashing patterns and behavior of swarming fireflies [64]. The FA has become an increasingly valuable tool of swarm intelligence that has been applied in almost all areas of optimization, as well as in engineering practice [65]. It uses a kind of randomization by searching for set solutions, inspired by the flashing lights of fireflies in nature. This algorithm differs from many swarm intelligence techniques [65] for these two features:
  • the first is the so-called local attraction, since the light intensity decreases with distance (the attractions of fireflies can be local or global and depend on the absorbing coefficient);
  • the second is related to the subdivision of fireflies and their regrouping into subgroups because a neighboring attraction is stronger than a long-distance attraction, and each subgroup will swarm around a local mode, making the firefly algorithm suitable for multimodal global optimization problems [66].
In [67] the authors provide a detailed background and analysis of the firefly algorithm and test it in a wide range of problems to solve multi-objective dispatch problems.
In this paper, the authors propose a comparison among bioinspired algorithms for the prediction of solar cell and photovoltaic module parameters. The goal is to minimize the multi-objective functions adapted to minimize the absolute errors between experimental and calculated current-voltage data under inequality constraint functions. Three different cases are examined as follows: single and double diode models of a commercial mono-crystalline silicon solar cell (R.T.C France company) at 33 °C, based on current-voltage experimental data recorded in [29]; (ii) flexible dual junction amorphous hydrogenated silicon a-Si:H solar cell under standard sunlight, based on data obtained in a light intensity of 1000 W/m2 and at a temperature of 300 K [54]; (iii) a Photowatt-PWP 201 photovoltaic module which 36 polycrystalline silicon cells are connected in series and the data is measured at an irradiance of 1000 W/m2, and a temperature of 25 °C [29]. To verify the performance of the proposed approach and the quality of the obtained results, statistical analyses are carried out to measure the accuracy of the calculated parameters and model suitability. The results obtained are compared with recent techniques such as the Biogeography-Based Optimization algorithm with Mutation strategies (BBO-M) [68], Levenberg-Marquardt algorithm combined with Simulated Annealing (LMSA) [47], Artificial Bee Swarm Optimization algorithm [48], Artificial Bee Colony optimization (ABC) [49], hybrid Nelder-Mead and Modified Particle Swarm Optimization (NM-MPSO) [50], Repaired Adaptive Differential Evolution (RADE) [59], Chaotic Asexual Reproduction Optimization (CARO) [69] for solar cell single and double diodes. For organic flexible hydrogenated amorphous silicon, a-Si:H solar cell will be compared with the Quasi-Newton (Q-N) method and Self-Organizing Migrating Algorithm (SOMA) [54]. The optimal parameters of Photowatt-PWP 201 are compared with the Newton-Raphson [29] Pattern Search (PS) [55], Genetic algorithm (GA) [56] and Simulated Annealing algorithm (SA) [58]. The obtained results are in accordance with experimental data, there is good agreement for most of the extracted parameters and the proposed algorithm outperformed the compared techniques.

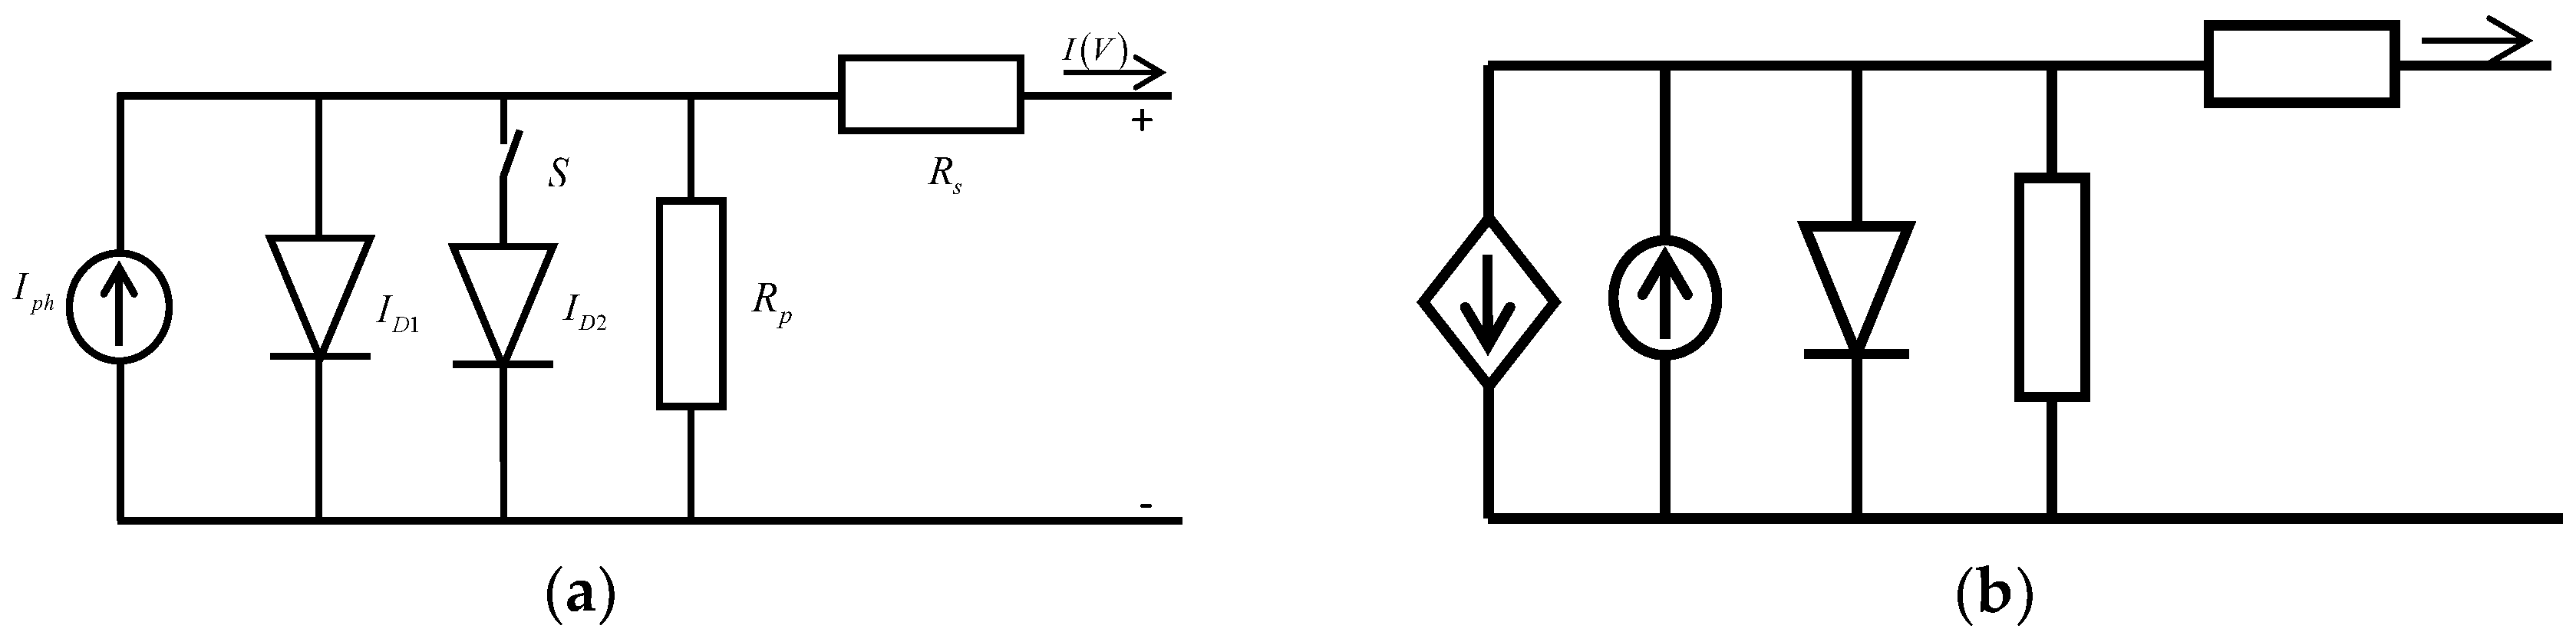
2. Presentation and Modelling of the Solar Cell

The electrical behavior of the solar cell is modelled by its outputs current versus voltage characteristic. Further, a solar cell is mathematically modelled in two common methods [24,70], single diode (SDM) and double diode (DDM), with consider parasitic phenomena by series and shunt resistances. Moreover, the flexible hydrogenated amorphous silicon a-Si:H solar cell with loss current I r e c is paralleled with the original photo-generated current source and the current sink representing the recombination current in the i-layer of a P-I-N solar cell [71,72,73,74,75]. The two models are given in Figure 1.
The current-voltage behavior of a solar cell is described according to the electrical intrinsic parameters and nonlinear implicit equation, for a given illumination and temperature.
I = I p h I S D 1 [ exp ( V + I R s a 1 V T ) 1 ] S I S D 2 [ exp ( V + I R s a 2 V T ) 1 ] V + I R s R P
where, Iph is the photocurrent, ISD1 and ISD2 are the saturation currents, a 1 and a 2 are the diffusion and recombination diode quality factors; Rs and Rp are the resistances in series and parallel, respectively, V T is the thermal voltage (which will be defined in the followings), and:
S = { S D M for O p e n = 0 S D D M for C l o s e = 1
The current-voltage characteristic of a flexible solar cell is:
I = I p h ( 1 d i 2 ( μ τ ) e f f [ V b i ( V + I R s ) ] ) I s [ exp ( ( V + I R s ) a V T ) 1 ] V + I R s R P
where, the voltage V b i represents the built-in field voltage over the i-layer, in single junction amorphous silicon solar cells, and in [76] it has been determined to be in the range 0.9 V; di represents the thickness of the i-layer, the effective µτ-product (µτ)eff represents average mobility-lifetime product for election and hole, and quantifies the quality of the active layer in terms of recombination of photo-generated carriers. The thermal voltage is V T = K T / q where K is Boltzmann’s constant, T is the cell absolute temperature in Kelvin and q is the electronic charge, a is the diode quality factor.
The photocurrent I p h describes the irradiation dependent recombination in i-layer and reduced by the recombination current, as follows:
I r e c = I p h [ ( μ τ d i 2 ) ( V b i ( V + I R s ) ) ] 1
where, Irec is the current sink and it represents the recombination current in the i-layer of a P-I-N; the current through the diode represents the diffusion process of charge carriers and the last term represents the shunt leakage current I p and is modelled as a space charge limited current [77,78].
In Equations (1) and (3), the five, seven and eight parameters which define the current versus voltage relation of solar cell and photovoltaic module, vary in accordance with solar irradiance, cell temperature and depend on reference values reported on datasheet.

3. Problem Formulation

The solar cell can be modelled by using the single diode model, double diode or multi-diode models. The objective function is defined from Equations (1) and (3), several research papers use different functions, for example, [48,49,50,59,68,69] use the root mean square error (RMSE), [47] use the sum of squared error (SSE). In [55,58] the individual absolute error (IAE) is used and [
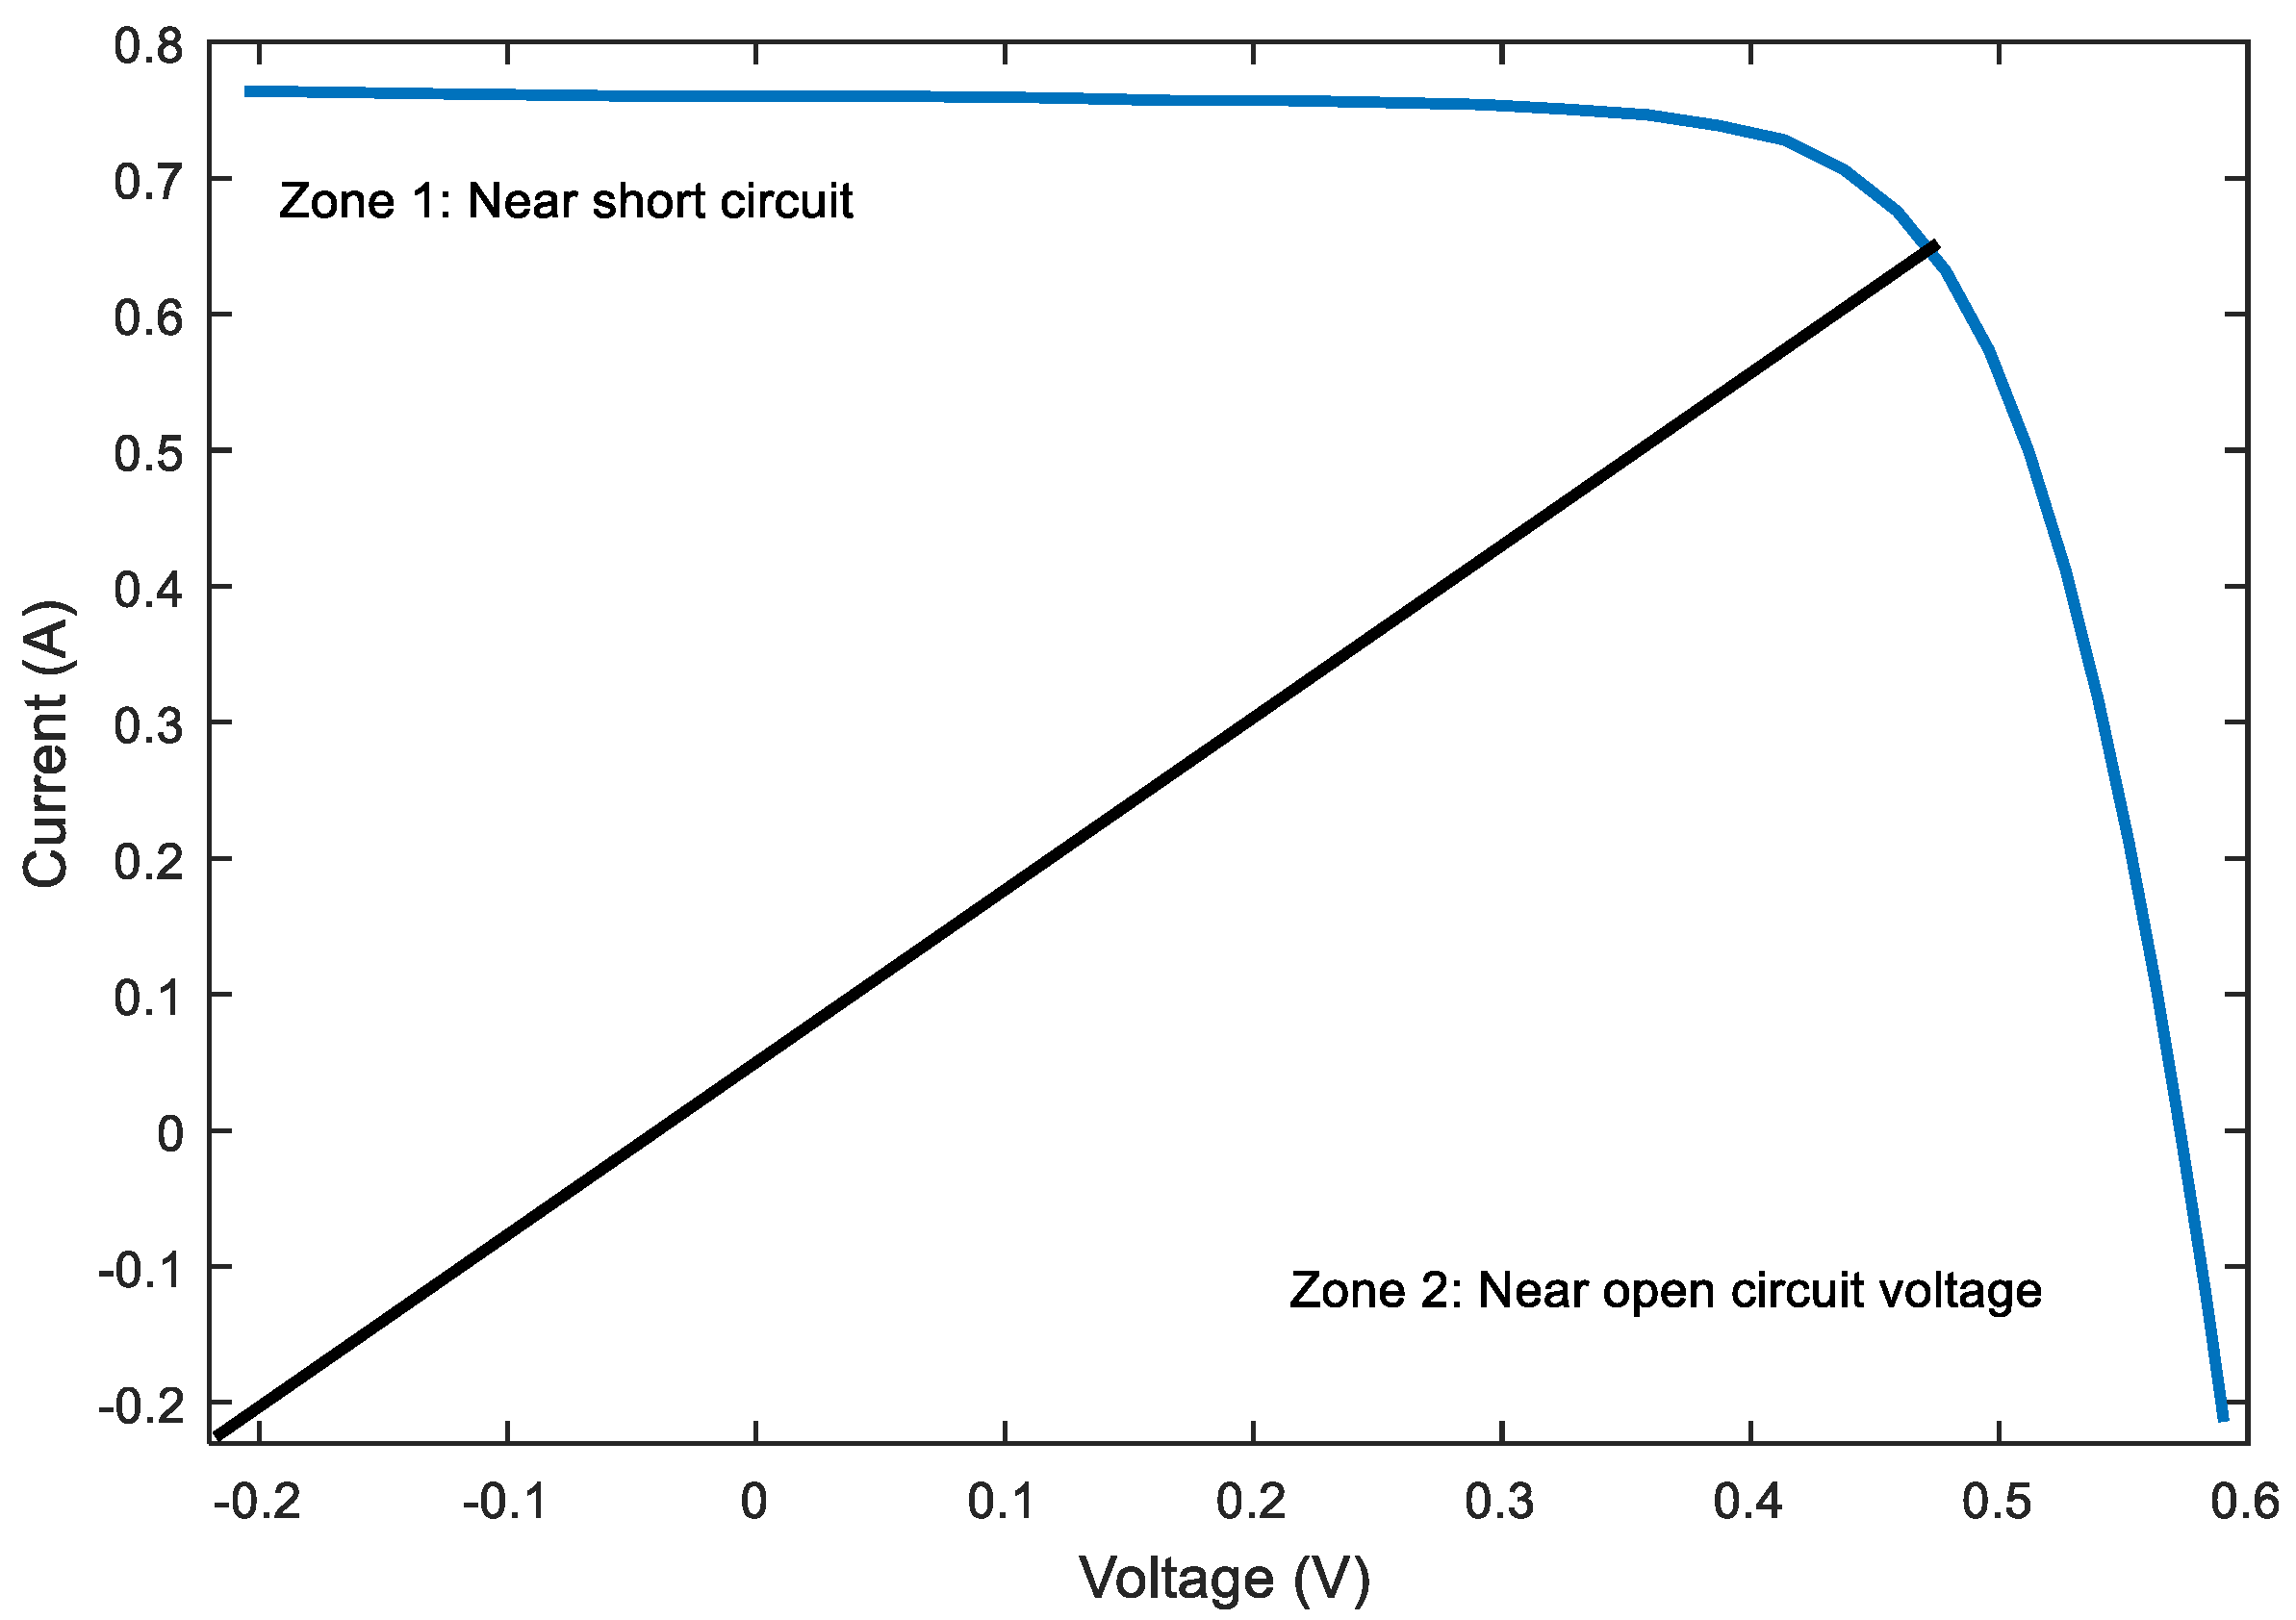
79] use the mean absolute errors (MAE). However, the objective function was used to minimize the vertical distance between the experimental points and the theoretical curve. In this paper, we use separate fitting for different regions in the current-voltage characteristics (Figure 2), because the current error is more important for small voltages due to the strongly varying slope of the curve, while the voltage error is more important for large voltages approaching an open circuit.
During the optimization process, each i -th solution is defined by a vector X i , where X is a candidate set of parameters defined as follows:
  • for a single diode: X = x 1 = [ I p h I S D a R S R P ] ;
  • for a double diode: X = x 2 = [ I p h I S D 1 I S D 2 a 1 a 2 R S R P ] ;
  • for a flexible solar cell: X = x 3 = [ I p h d i μ τ V b i R s I 0 a R s h ] .
The objective functions must be minimized with respect to the limits of parameters x1, x2 and x3. The Equations (1) and (3) is rewritten in the following homogeneous equations.
For a single and double diode:
F 1 / 2 ( V , I ) = I I p h + I S D 1 [ exp ( V + I R s a 1 V T ) 1 ] + S I S D 2 [ exp ( V + I R s a 2 V T ) 1 ] + V + I R s R P
For flexible hydrogenated amorphous silicon, a-Si:H:
G ( V , I , x 3 ) = I I p h ( 1 d i 2 ( μ τ ) e f f [ V b i ( V + I R s ) ] ) + I s [ exp ( ( V + I R s ) a V T ) 1 ] + V + I R s R P
The cost function of current error ε 1 near the short circuit (zone 1) is:
ε 1 = 1 m 1 Z o n e 1 ( I i ( V i , I i , x ) I P V _ exp i ) 2
The cost function of voltage error ε 2 is the horizontal distance between the experimental point and calculated curve; it is defined near the open circuit (zone 2) as:
ε 2 = 1 m 2 Z o n e 2 ( V i ( V i , I i , x ) V P V _ exp i ) 2
Where m is the number of experimental data, V i and I i are the i-th simulated and experimental current and voltage value, respectively. The overall objective function, i.e., the global error ε in the two zones, is the sum of current and voltage errors and is defined as:
f ( X ) = ε = ε 1 + ε 2
The objective function constraints for each model are presented in the following equations. For a single and double diode:
min ε S D min ε S D subject    to    { 0 I p h 1 0 I S D 1 × 10 7 1 a 2 0 R S 0.5 0 R P 100 subject    to    { 0 I p h 1 0 I S D 1 1 × 10 7 0 I S D 2 1 × 10 7 1 a 1 2 1 a 2 2 0 R S 0.5 0 R P 100
While, for flexible hydrogenated amorphous silicon, a-Si:H:
min ε F    subject    to    { 0 I p h 0.8 A 0 d i 4   nm 0 μ τ 5 × 10 5   cm 2 / V 0 V b i 1 V 0 I S 4 × 10 18 A 1 a 1 0 R S 0.5 Ω 0 R P 20 Ω

4. Firefly Optimization Algorithm

The Firefly algorithm is a swarm intelligence algorithm for optimization problems. It was introduced in 2009 at Cambridge University by Yang [64], and it is inspired by the flashing patterns and behavior of tropical fireflies at night, and it is flexible and easy to implement. The Firefly algorithm is a bio-inspired metaheuristic algorithm and a random optimization, which is capable of converging to a global solution of an optimization problem. It uses the following three idealized rules [63,64,65,66,67]:
  • No sex distinctions, i.e., fireflies are attracted to other fireflies regardless of their sex.
  • The degree of the attractiveness of a firefly is proportional to its brightness, thus for any two flashing fireflies, the less bright one will move towards the brighter one; the more brightness, the less the distance between two fireflies. If there is no brighter firefly, it will move randomly.
  • The brightness of a firefly is determined by the value of the objective function.
The basic rules of this algorithm were designed to primarily solve continuous problems. To design the Firefly algorithm properly, two critical issues need to be defined: the attractiveness and the variation of the light intensity.

4.1. Attractiveness

In the Firefly algorithm, the variation of the light intensity and the formulation of the attractiveness play a vital role. The intensity of light or brightness I ( r i j ) is inversely proportional to the square of the distance r i j [64,66] and the relative brightness of each firefly is expressed in the following Gaussian form:
I ( r i j ) = I 0 e λ r i j 2
where, I ( r i j ) is the light intensity at a distance r i j , I 0 is the maximum brightness (the absolute brightness at the source point r i j = 0 ) which is related to the objective function value. The higher value of the objective function is the higher I 0 is and λ is the light absorption coefficient, which is set to reflect that brightness increases gradually with the increase in distance and the absorption of the medium r i j is the Euclidean distance between firefly i and firefly j. The attractiveness of each firefly [56] is expressed in the form
β ( r i j ) = β 0 e λ r i j 2
where, β 0 is the maximum attractiveness (the attractiveness at r i j = 0 , the largest value of the firefly to attract another, is typically set to 1). However, computationally, computing 1 / ( 1 + λ r i j 2 ) is easier than e λ r i j 2 [64] and the intensity can be written as:
I ( r i j ) = I 0 1 + λ r i j 2
Similarly, the attractiveness of a firefly can be approximated as follows:
β ( r i j ) = β 0 1 + λ r i j 2

4.2. Distance and movement

We suppose a firefly located at x i = ( x 1 i , x 2 i x k i ) is brighter than another firefly located at x j = ( x 1 j , x 2 j x k j ) , the firefly located at x i will move towards x j . The distance between any two fireflies i and j at x i and x j is the Euclidean distance given by [64,66] as follows:
r i j = | x i x j | = k d ( x i , k x j , k ) 2
where, d is the dimension, x i , k is the k-th component of the spatial coordinate x i of i -th firefly the movement of a firefly i is attracted to another more attractive firefly j and the update location is determined by
x i + 1 = x i + β 0 e λ r i j 2 ( x j x i ) + α ( r a n d 1 2 )
The first term is the current position of a firefly [66], the second term is used for considering a firefly’s attractiveness to light intensity seen by adjacent fireflies and the third term is used for the random movement of a firefly in case there are not any brighter ones. The coefficient α is a randomization parameter determined by the problem of interest, while rand is a random-number drawn from a Gaussian distribution or uniform distribution at time t, if β 0 = 0 , it becomes a simple random walk. In the implementation of the algorithm we will use β 0 = 0 , α = 0.25 and the attractiveness or absorption coefficient λ = 1 which guarantees a quick convergence of the algorithm to the optimal solution. The concept of the firefly-based algorithm is presented in Figure 3. Moreover, Figure 4 shows the here considered implementation of FA for the specific problem and cost function given in Equation (9), as defined in Section 3.

5. Results, Discussions and Comparison

In order to evaluate the efficiency of the Firefly algorithm in the estimation of the solar cell, the photovoltaic module and the array parameter extraction, the results are compared with analytical methods, numerical methods and metaheuristic algorithm to validate the effectiveness of the algorithm. In order, to compare it with other algorithms, a benchmark commercial solar cell and benchmark photovoltaic module are selected in single diode, double diode and photovoltaic module models are considered. The study test cases are designated as follows:
  • Test scenario 1: Apply to commercial solar cell for both single diode and double model under standard irradiance level with relevant example comparisons to other methods.
  • Test scenario 2: Apply to a flexible hydrogenated amorphous silicon a-Si:H photovoltaic cell using single diode module.
  • Test scenario 3: Apply to a commercial photovoltaic array using the single diode model, with 36 solar cells connected in series.
The current-voltage measurements are collected from [29,54] and have been widely used by different papers to test electric circuit models, modelling or translate the current versus voltage and technique for parameter extraction. Furthermore, statistical analyses are carried out to measure the accuracy of the estimated parameters and model suitability.

5.1. Case 1: Single and Double Diode Model (RTC France Company)

The proposed algorithm is applied first to extract the electrical intrinsic parameters values for single and double diode models of a 57-mm-diameter commercial (RTC France) silicon solar cell under 1000 W/m2 at 33 °C. The extracted parameters are compared with those found by: Biogeography-Based Optimization algorithm with Mutation strategies (BBO-M) [68], Levenberg-Marquardt algorithm combined with Simulated Annealing (LMSA) [47], Artificial Bee Swarm Optimization algorithm [48], Artificial Bee Colony optimization (ABC) [49], hybrid Nelder-Mead and Modified Particle Swarm Optimization (NM-MPSO) [50], Repaired Adaptive Differential Evolution (RADE) [59], Chaotic Asexual Reproduction Optimization (CARO) [69], and the results for each model are reported in Table 3 and Table 4.
To confirm the accuracy of the extracted optimal values found by the Firefly algorithm, the calculated currents for the single and double diode model by optimized parameters are summarized in Table 5 and Table 6 compared with individual absolute error (IAE).
I A E = | I measured I estimated |
Furthermore, to understand the quality of the curve fit between Firefly algorithm values and experimental data, the results are compared to other algorithms. The compared statistical analysis for each model is presented in Table 7 and Table 8. The compared statistical criteria indicates that the Firefly algorithm ranks the overall lowest values for relative error (RE), median absolute error (MAE), residual sum of squares (SSE), and root mean square error (RMSE). The statistical errors are used to show the performance with the definitions as follows:
R E = I measured I estimated I measured
M A E = i = 1 m | I estimated I measured | m
S S E = i = 1 m ( I measured I estimated ) 2
R M S E = 1 m i = 1 m ( I measured I estimated ) 2
From Table 7 and 
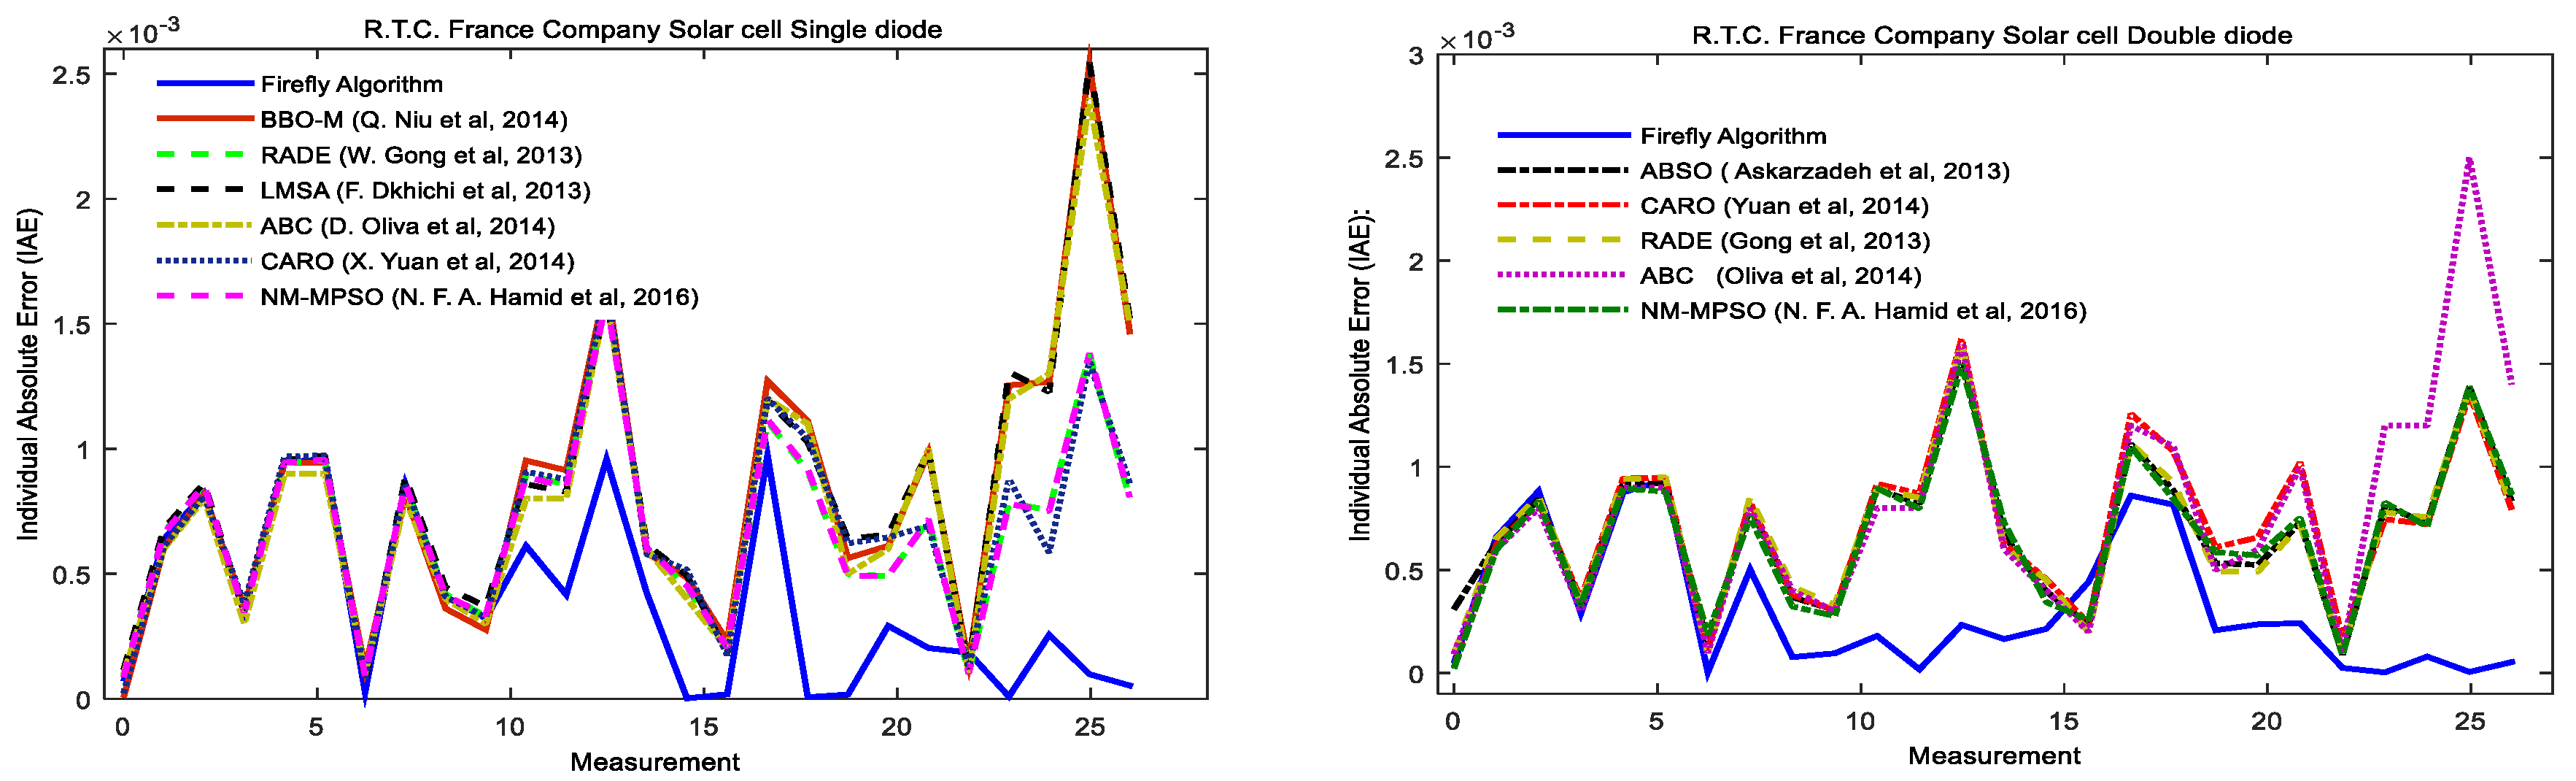
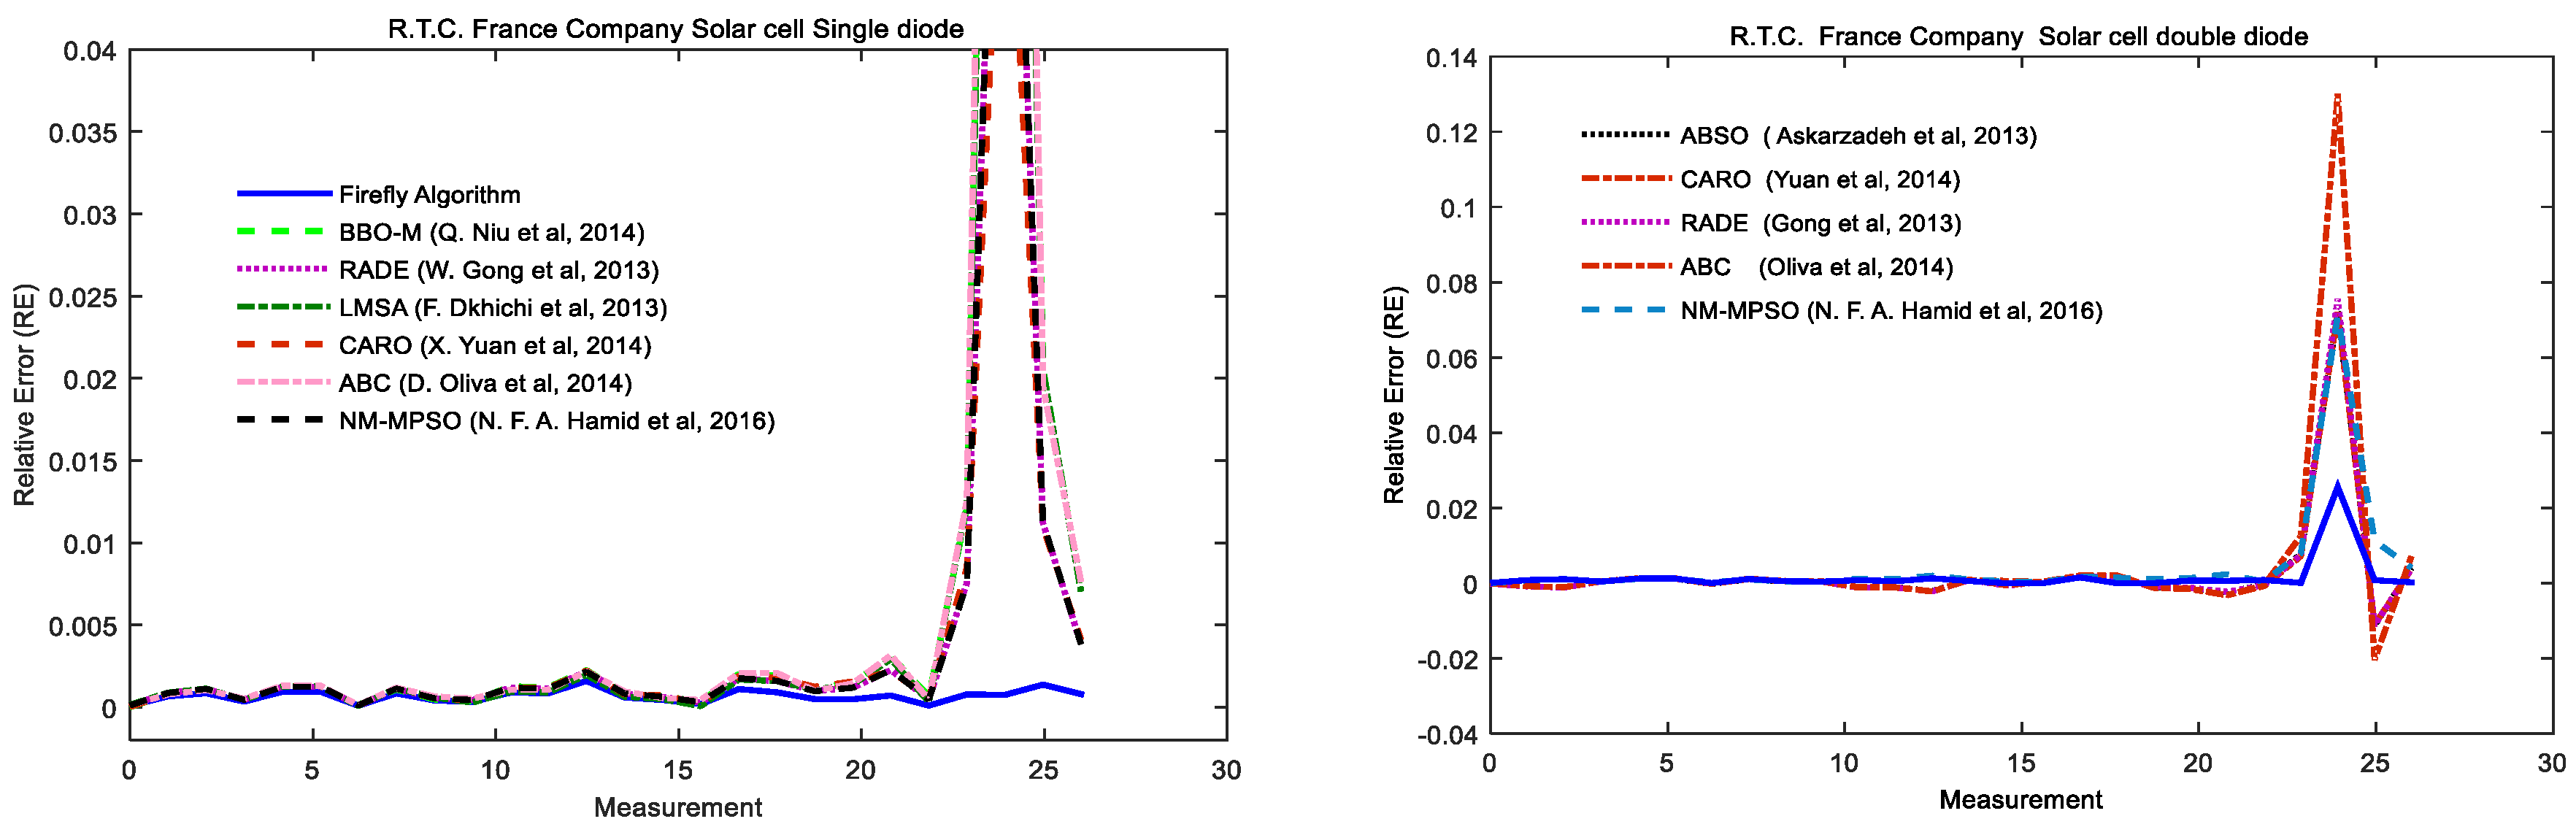
Table 8, we observe that the five and seven electrical parameters identified by the Firefly algorithm are close and more accurate than those found by all other compared algorithms. The performance of the proposed algorithm provides the lowest values for the statistical criteria, IAE, RMSE, SSE and MAE when compared to the other methods. Therefore, the Firefly algorithm is ranked first in achieving the lowest IAE, RMSE, SSE and MAE, while the Repaired Adaptive Differential Evolution algorithm and hybrid Nelder-Mead and Modified Particle Swarm Optimization (NM-MPSO) are ranked second and third, respectively. Therefore, the optimal parameters identified by the proposed Firefly Algorithm are very accurate because they are close to the real parameters of the system. The individual absolute error (IAE) and the relative error RE for each measurement using optimal values founded by the Firefly algorithm are illustrated in Figure 5 and Figure 6, respectively. The Firefly algorithm performs better than the reported methods.
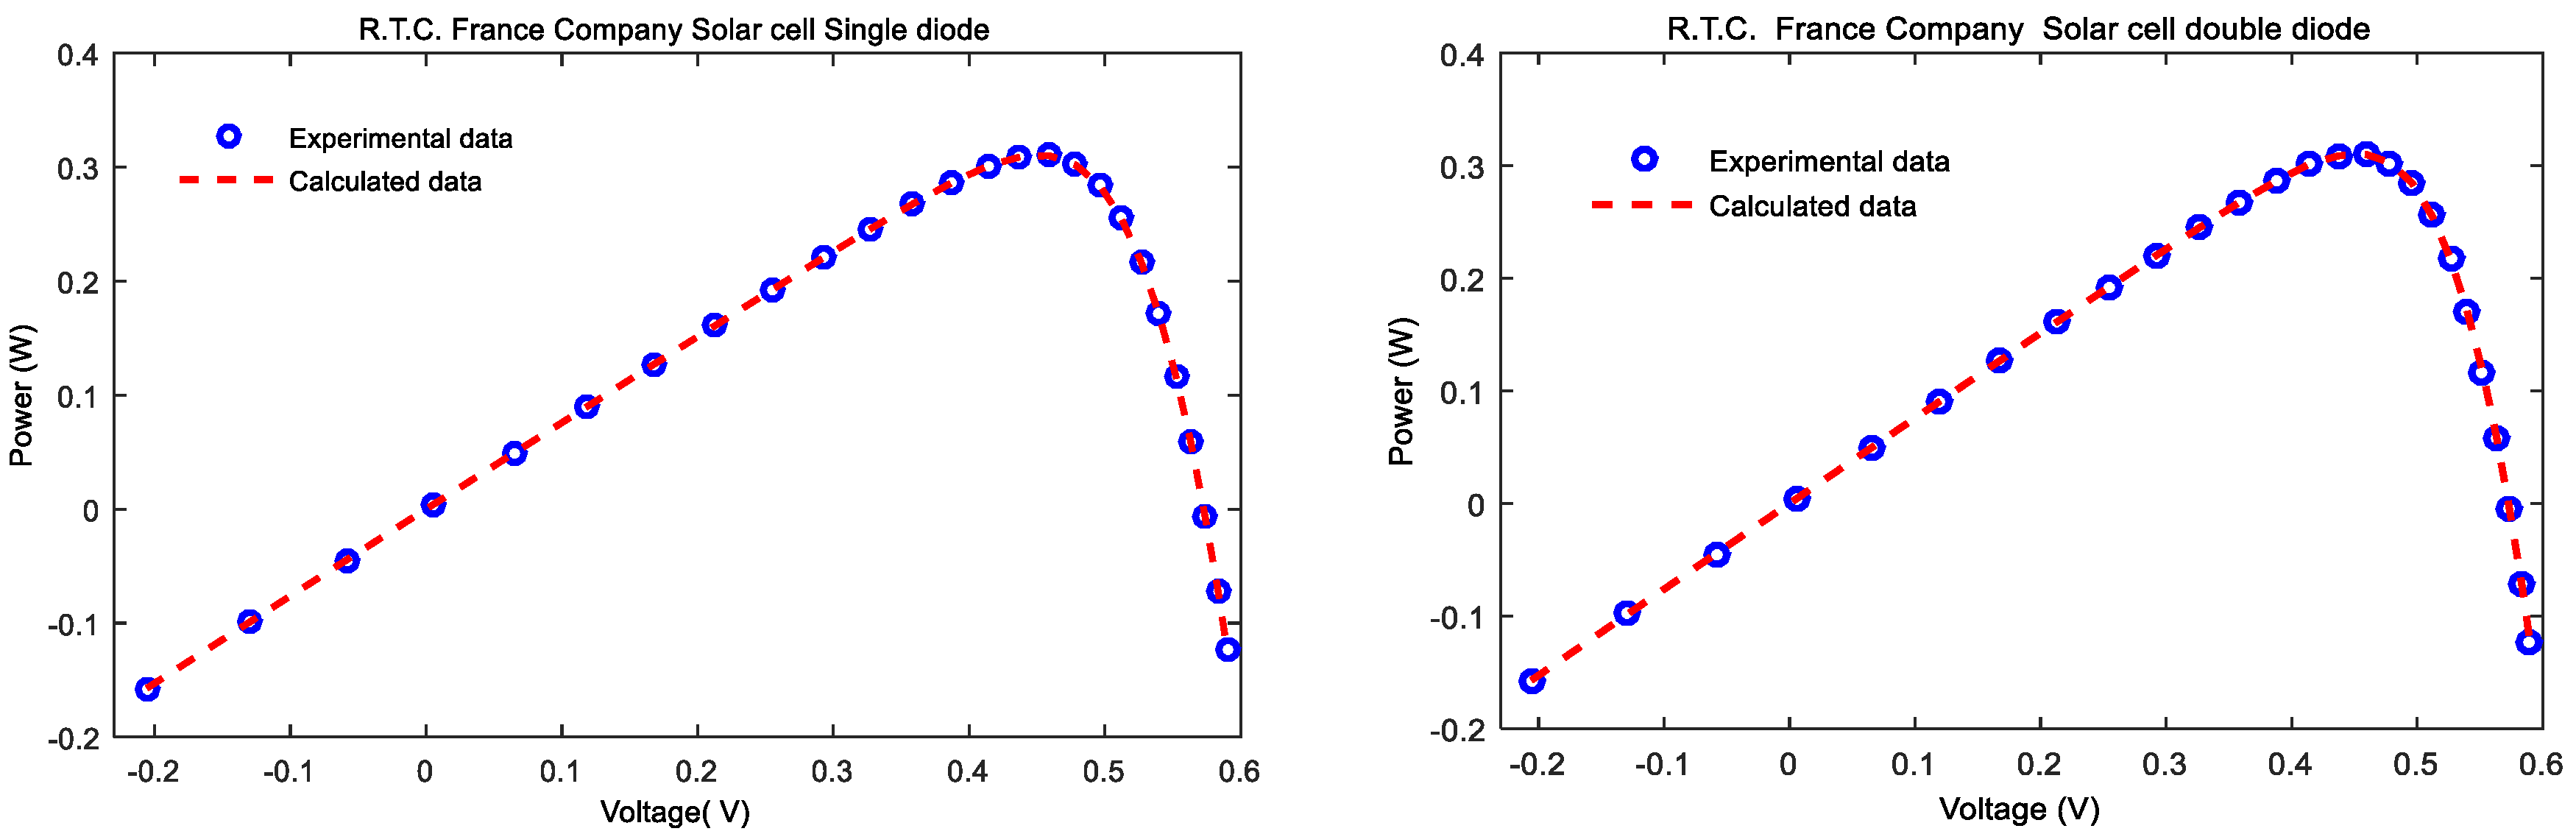
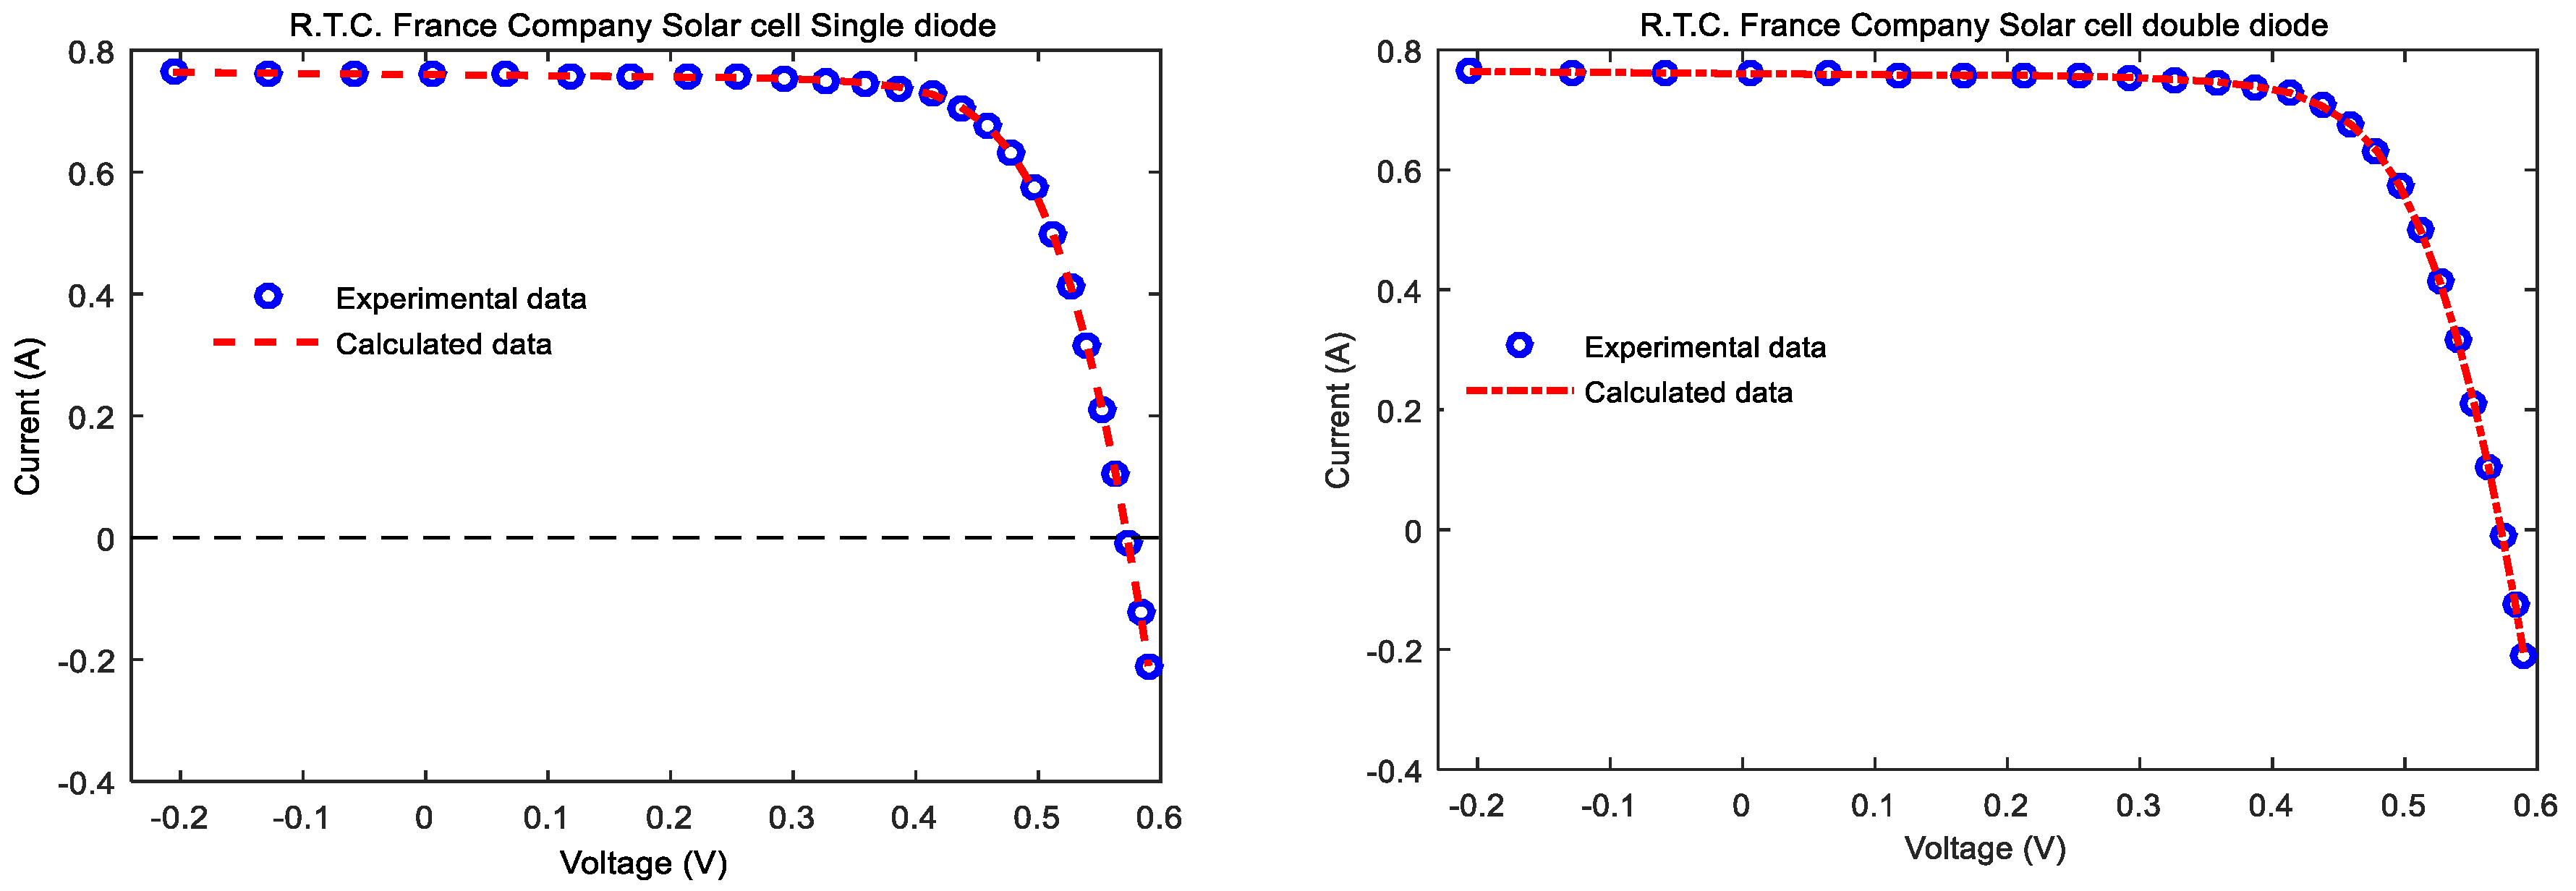
The current-voltage and power-voltage characteristics resulting from extracted parameters by the Firefly algorithm along with experimental data are compared to estimated data to investigate the quality of the identified parameters. This is illustrated in Figure 7 and Figure 8. The two figures show the reconstructed single diode model is in good agreement with experimental data and are very close to each other.
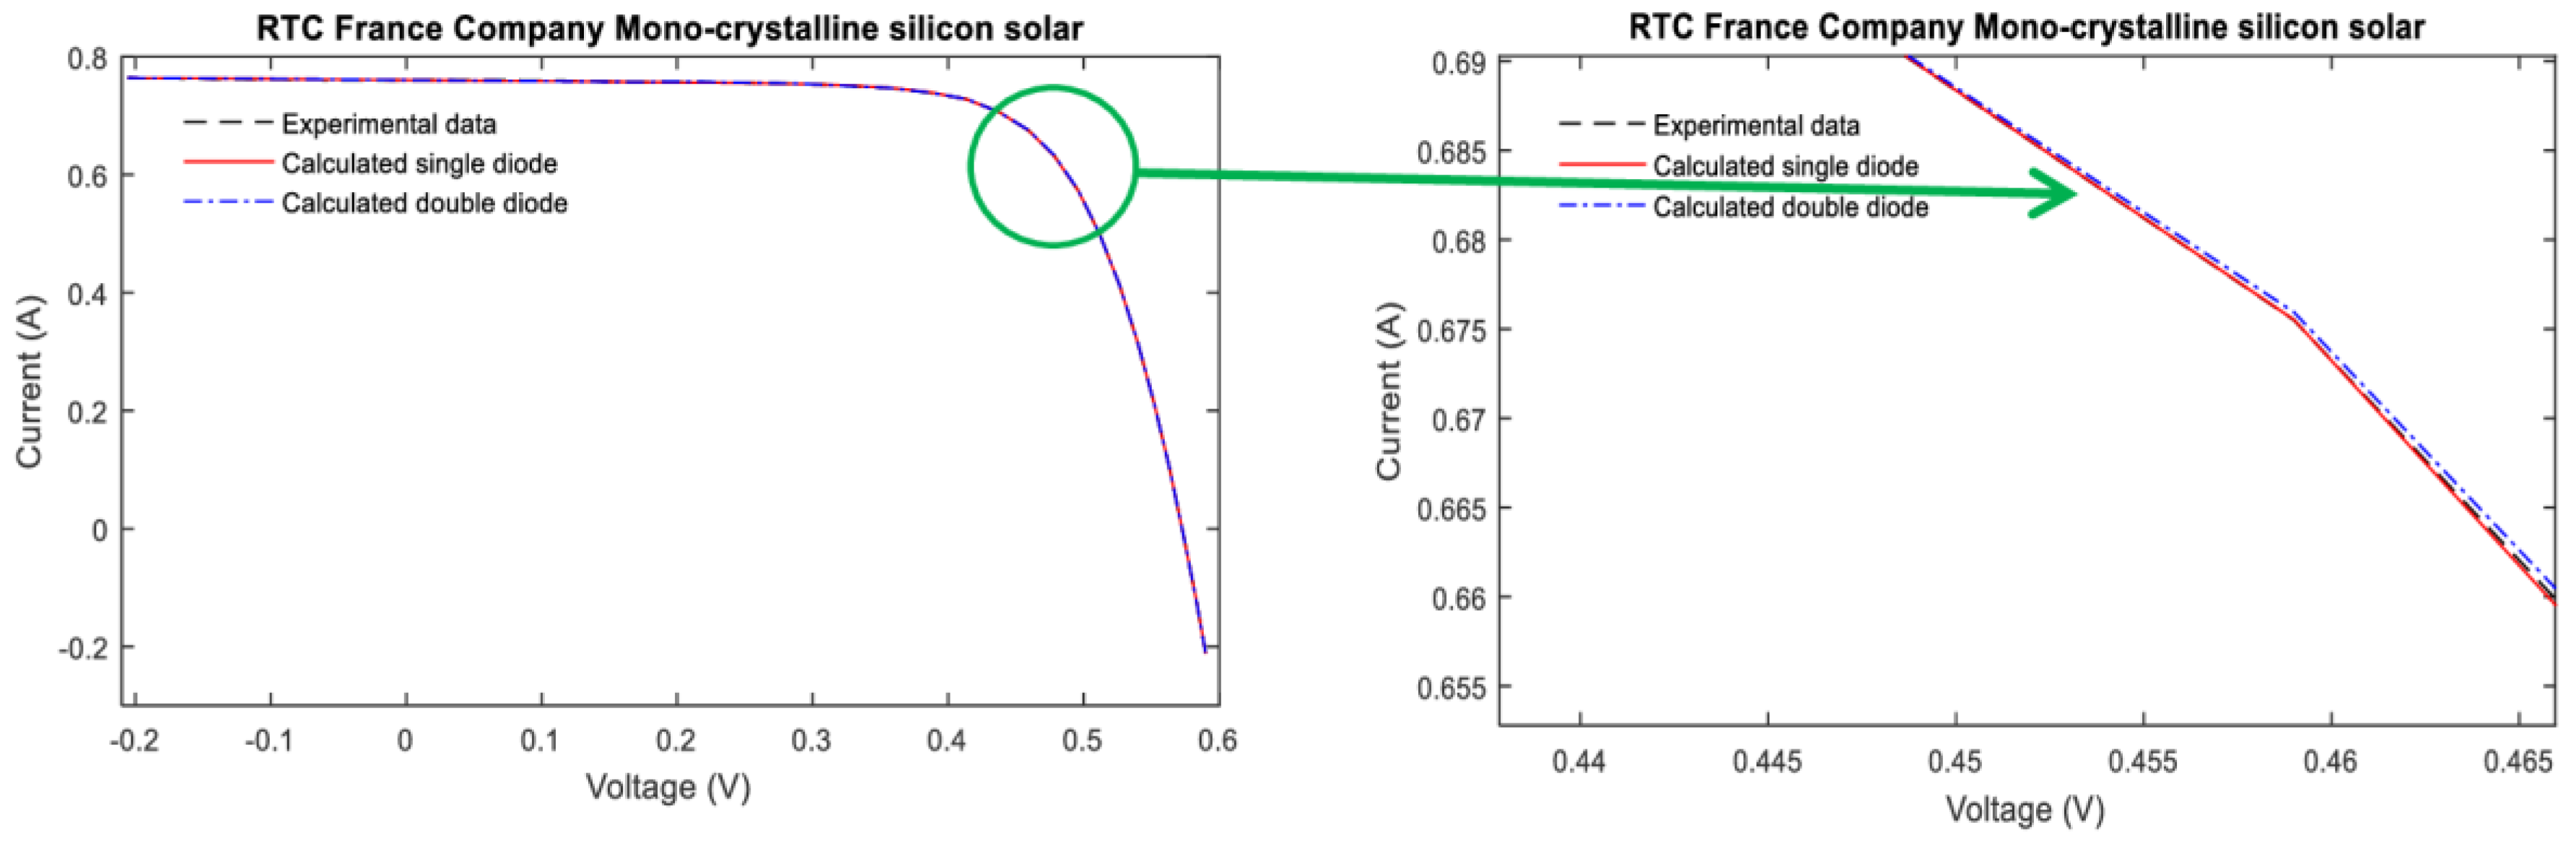
Figure 9 shows the compared extracted current-voltage characteristics of the mono-crystalline for single and double diode, RTC France Company. The calculated current by extracted parameters compared with the Firefly algorithm show good performance with the experimental data for single and double diode.

5.2. Case 2: Organic Flexible Hydrogenated Amorphous Silicon a-Si:H Solar Cell

The Firefly algorithm, based on a parameter estimation method is used to extract the eight optimal parameters of flexible dual junction amorphous silicon solar cell under standard sunlight, based on data obtained in light intensity of 1000 W/m2 and at a temperature of 300 K. The experimental data are used from [48]; only the open circuit voltage Voc and short circuit current Isc are obtained. Moreover, the optimal parameters are compared with several other techniques based on the same experimental data. The extracted optimal parameters by Firefly algorithm have been reported in Table 9, compared with the Quasi-Newton method and Self-Organizing Migrating Algorithm. Since it is difficult to extract the flexible amorphous silicon solar cell circuit model parameters and the research is still comparatively rare, the Quasi-Newton (Q-N) method and Self-Organizing Migrating Algorithm (SOMA) [48] have been chosen for comparison because in [29,48] they were demonstrated to provide good results for parameter extractions.
To verify and validate the performance of the quality of the results, statistical analyses were carried out to measure the accuracy of the estimated parameters. The estimated current values are compared to experimental current by means of the following statistical errors: the individual absolute error (IAE), Standard deviation (SD), residual sum of squares (SSE), the root mean square error (RMSE) and the mean bias error (MBE) of the solar cell for each measurement, respectively. The statistical errors are used to compare term by term, the difference between estimated and experimental electric current. Generally, the lower these parameters, the more the efficiency of the model. Table 10 presents the current calculated for the Firefly algorithm and the individual absolute error, Table 11 summarizes the statistical errors for each measurement using the optimal values of x found by the Quasi-Newton method and Self-Organizing Migrating algorithm [48] compared with Firefly algorithm.
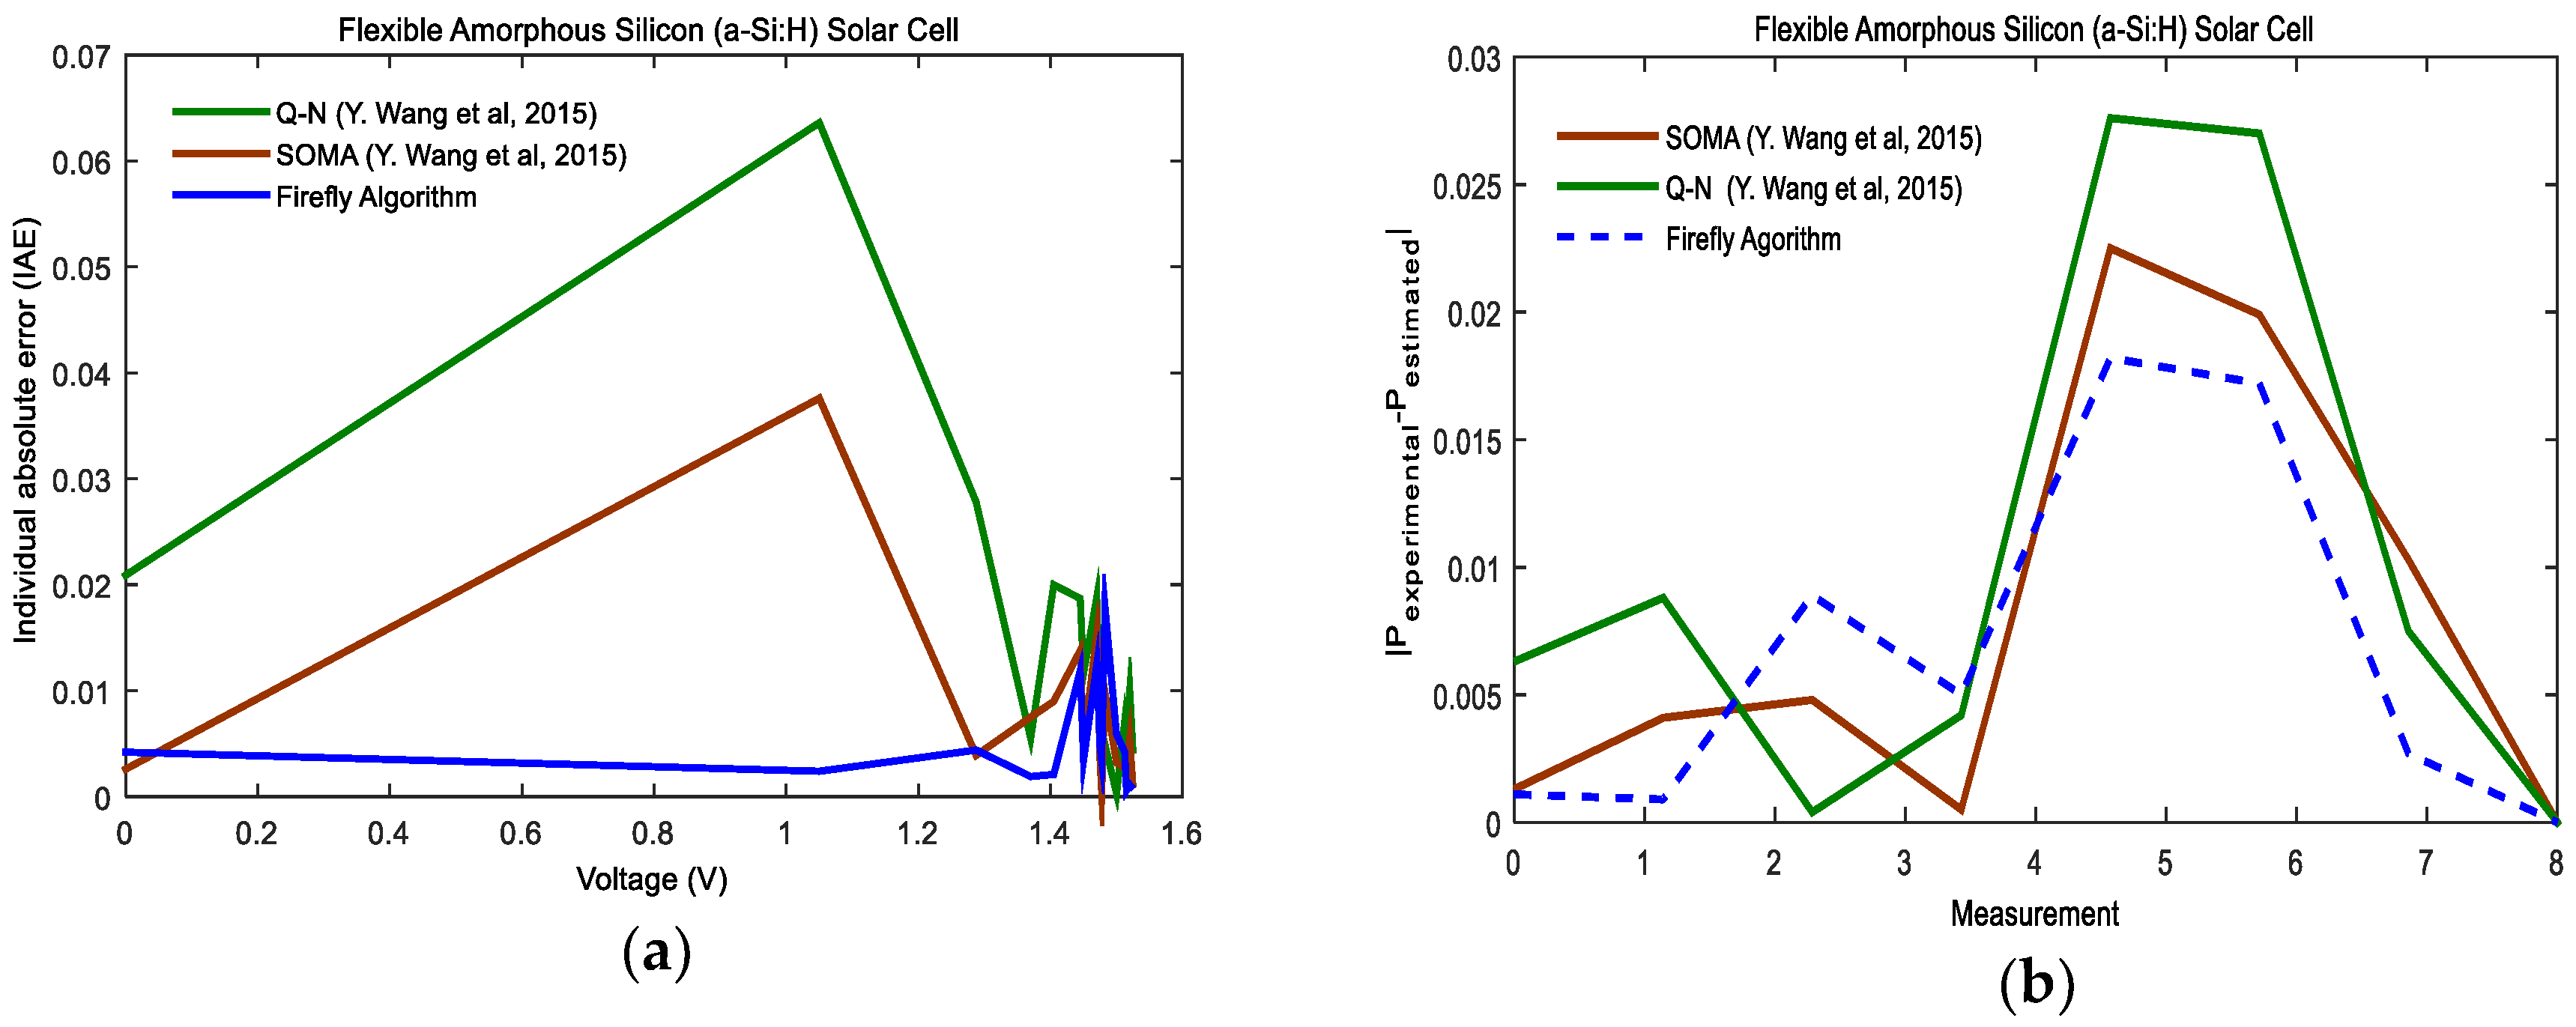
Figure 10 presents the compared individual absolute error of each measurement used for current and power of optimal value x found by Firefly algorithm compared with the Quasi-Newton method and Self-Organizing Migrating Algorithm. From Figure 10, Table 10 and Table 11 we know that the Firefly algorithm and Self-Organizing Migration Algorithm have the lowest SD, RMSE, SSE and MBE values among these three compared methods. Furthermore, the Firefly algorithm has better performance than the Quasi-Newton method and Self-Organizing Migration presented in [48].
In order to illustrate the quality of the extracted optimal values x3 found by the Firefly algorithm, the extracted values of I p h , d i , μ τ , V b i , R s , I 0 , a and R s h 
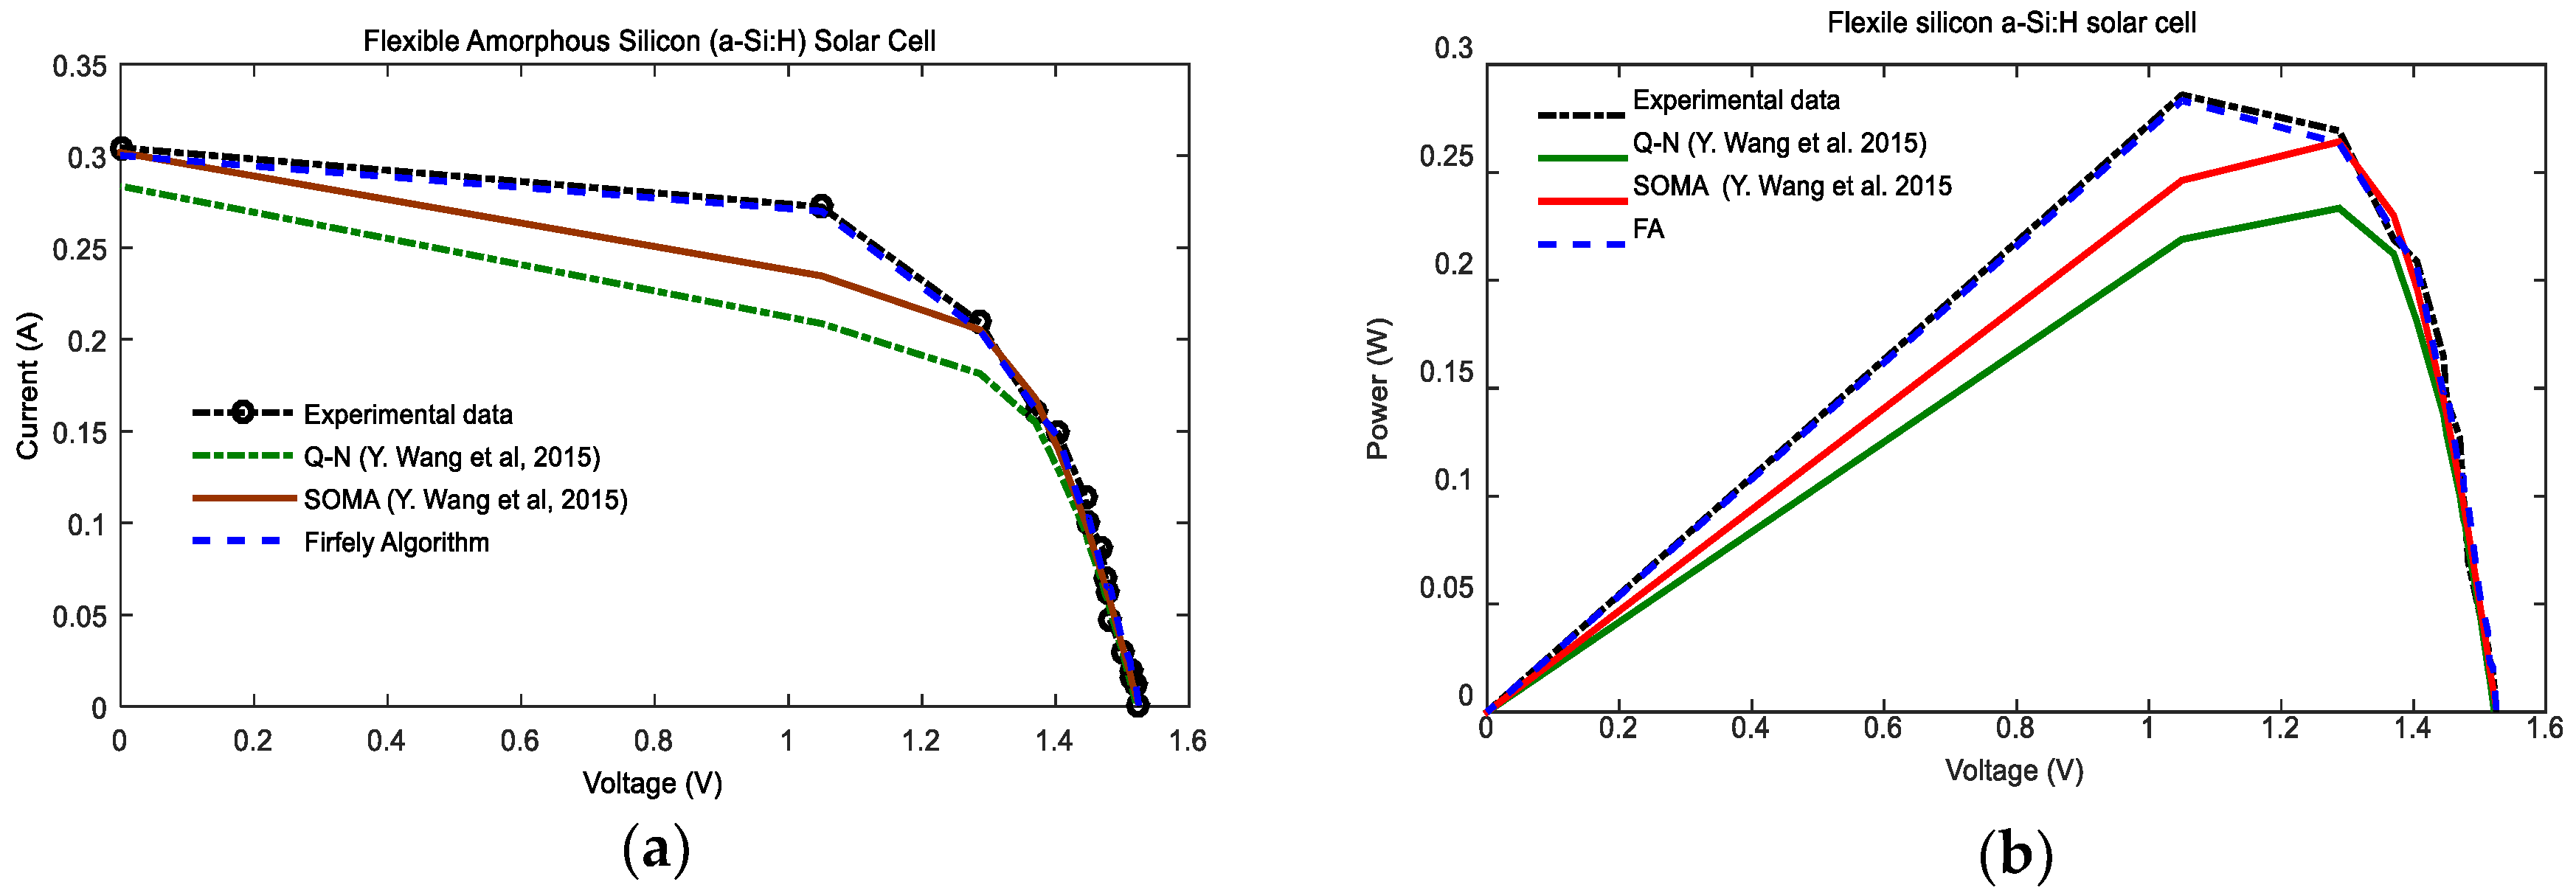
are put into Equation (3), then the current-voltage and power-voltage characteristics of this model is reconstructed with 16 pairs of current-voltage. The current-voltage and power-voltage characteristics resulting from the extracted parameters by Firefly algorithm along with experimental data have been illustrated in Figure 11. The Figures show the reconstructed model is in good agreement with the experimental data.
The comparative statistical error used in this paper compare the difference between estimated and experimental electric parameters, term by term. The mean bias error (MBE) provides information on the overestimation or underestimation of the solar cell performance. Therefore, the obtained results are more accurate than those found by Q-N and SOMA, can better reveal the actual behavior of solar cells and the model is efficient. Generally, the lower these parameters are, the more the model is efficient.

5.3. Case 3: Commercial Silicon Photovoltaic Module Photowatt-PWP 201

The prototype of the Photowatt-PWP 201 photovoltaic module has six solar panels, two are connected in series and three photovoltaic panels are connected in parallel. The measured voltage and current are taken under 25 °C and 1000 W/m2. In this case, 26-pair current-voltage measured values are the same as [29], which are derived from 36 polycrystalline silicon cells which are connected in series. The extracted optimal parameters values for the photovoltaic module by Firefly algorithm have been reported in Table 12. Moreover, the optimal parameters are compared with several other techniques: Newton-Raphson [29] Pattern Search (PS) [55], Genetic Algorithm (GA) [56] and Simulated Annealing algorithm (SA) [58] based on the same experimental data. The purpose of comparison is to validate the accuracy of the Firefly algorithm in the parameter extraction process with a short time of convergence.
The quality of the results in the extracted parameters are used to calculate the theoretical current values and compared to experimental measurements as show in Table 13.
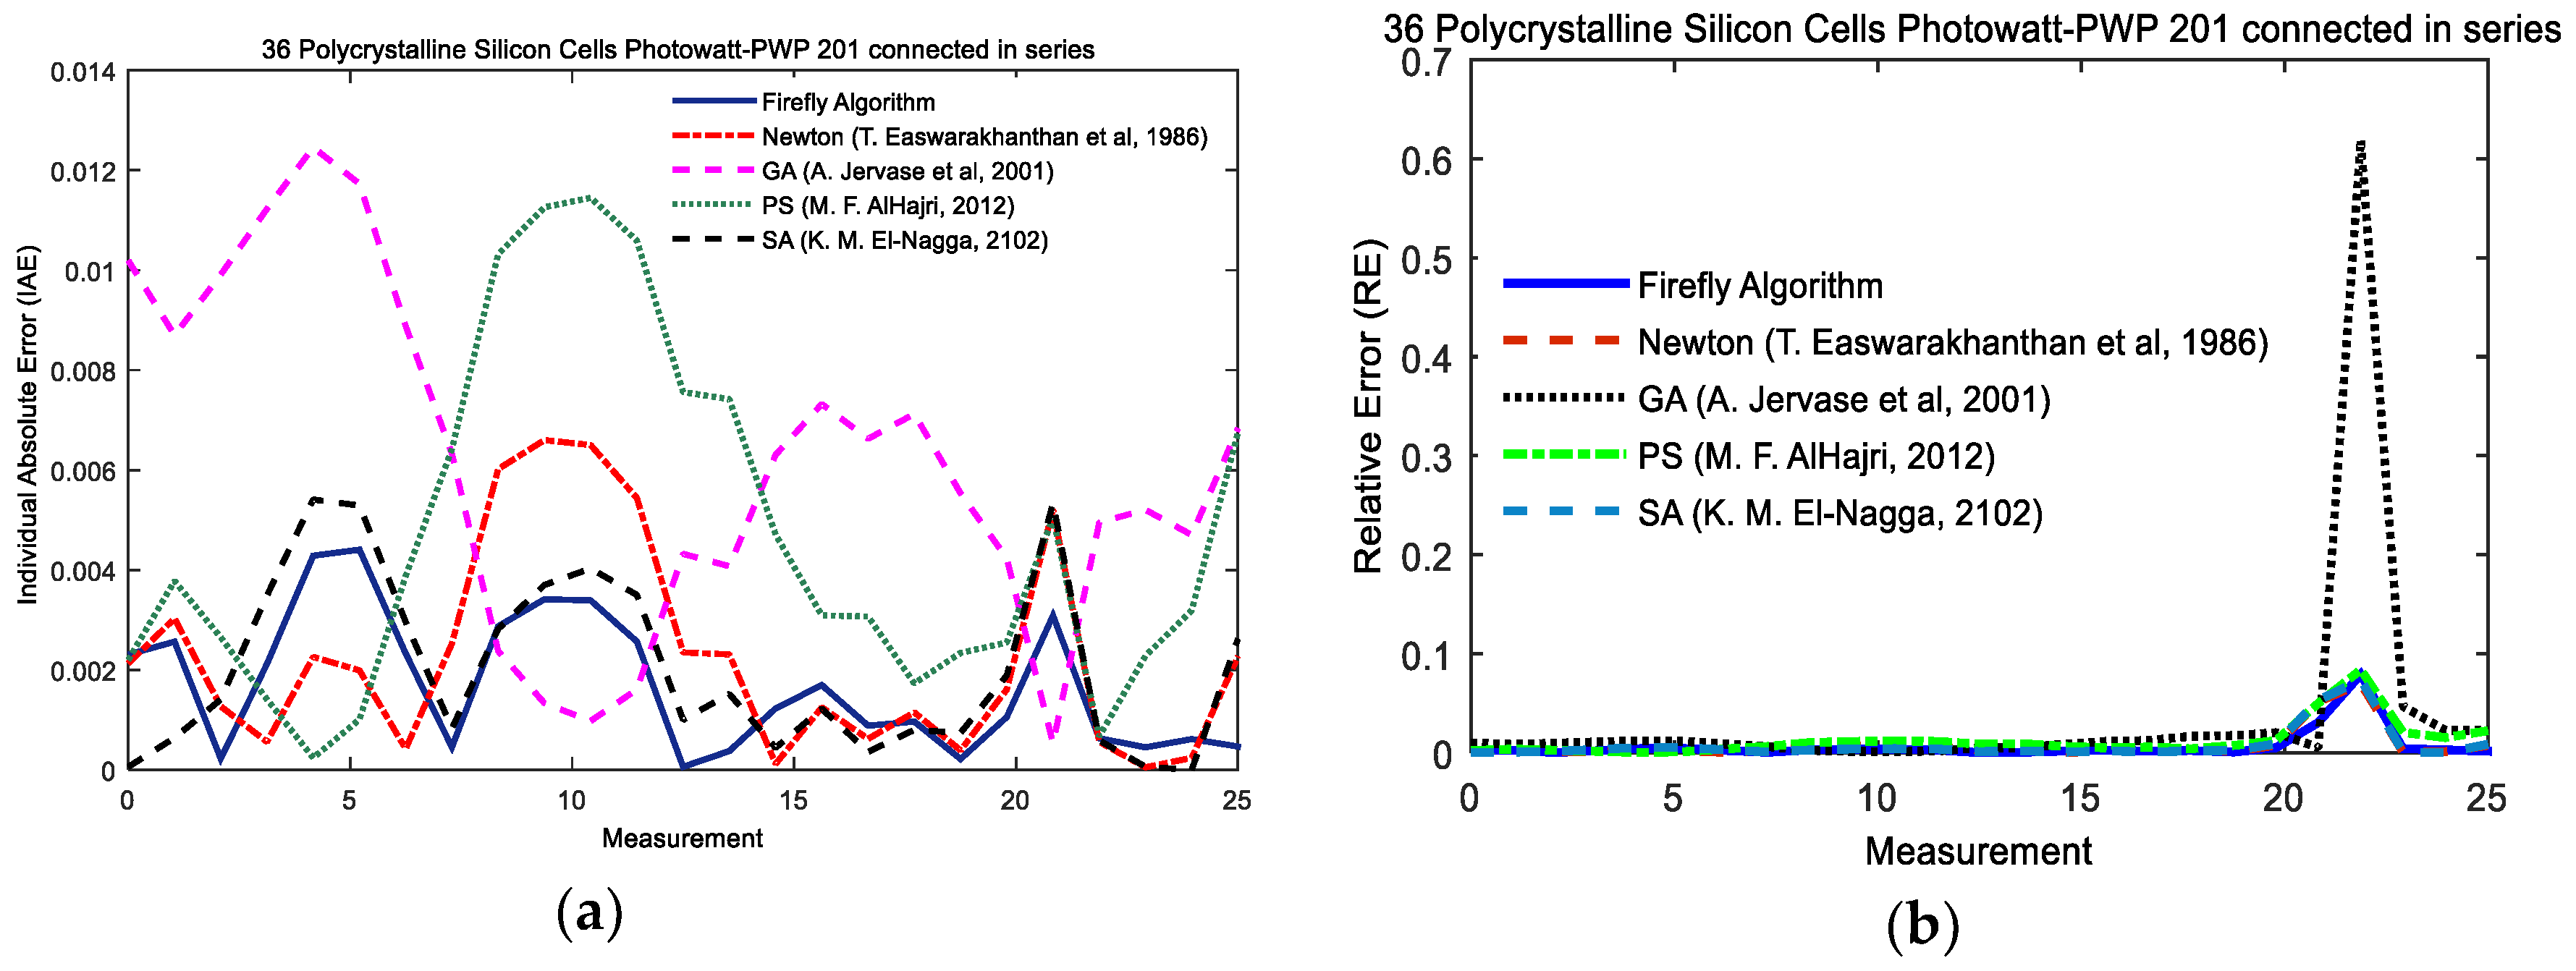
The optimal value of the following statistical errors: individual absolute error (IAE), relative error (RE), root means square error (RMSE) and residual sum of squares (SSE), for each measurement using the Firefly algorithm and other parameter extraction techniques are given in Table 14.
Table 14 proves that the Firefly algorithm has the lowest IAE, RMSE, SSE and MAE compared to other parameter extraction techniques such as, Newton-Raphson, Pattern Search (PS), Genetic Algorithm (GA) and Simulated Annealing algorithm (SA), since the Firefly algorithm found the minimum value of statistical analysis in parameter extraction for the photovoltaic module.
The comparison between Newton-Raphson, Pattern Search (PS), Genetic Algorithm (GA) and Simulated Annealing algorithm (SA) and the proposed algorithm, with the optimal value of IAE for each measurement, is illustrated in Figure 12. This Figure shows that the FA algorithm has better performance than the other parameter extraction algorithms. The total IAE values for each measurement is also calculated and listed in Table 14. The total IAE value shown in Table 14 highlights that the FA has the lowest total IAE compared to other algorithms for the photovoltaic module. Table 14 and Figure 12 indicate that FA outperforms the compared algorithms for this parameter extraction problem.
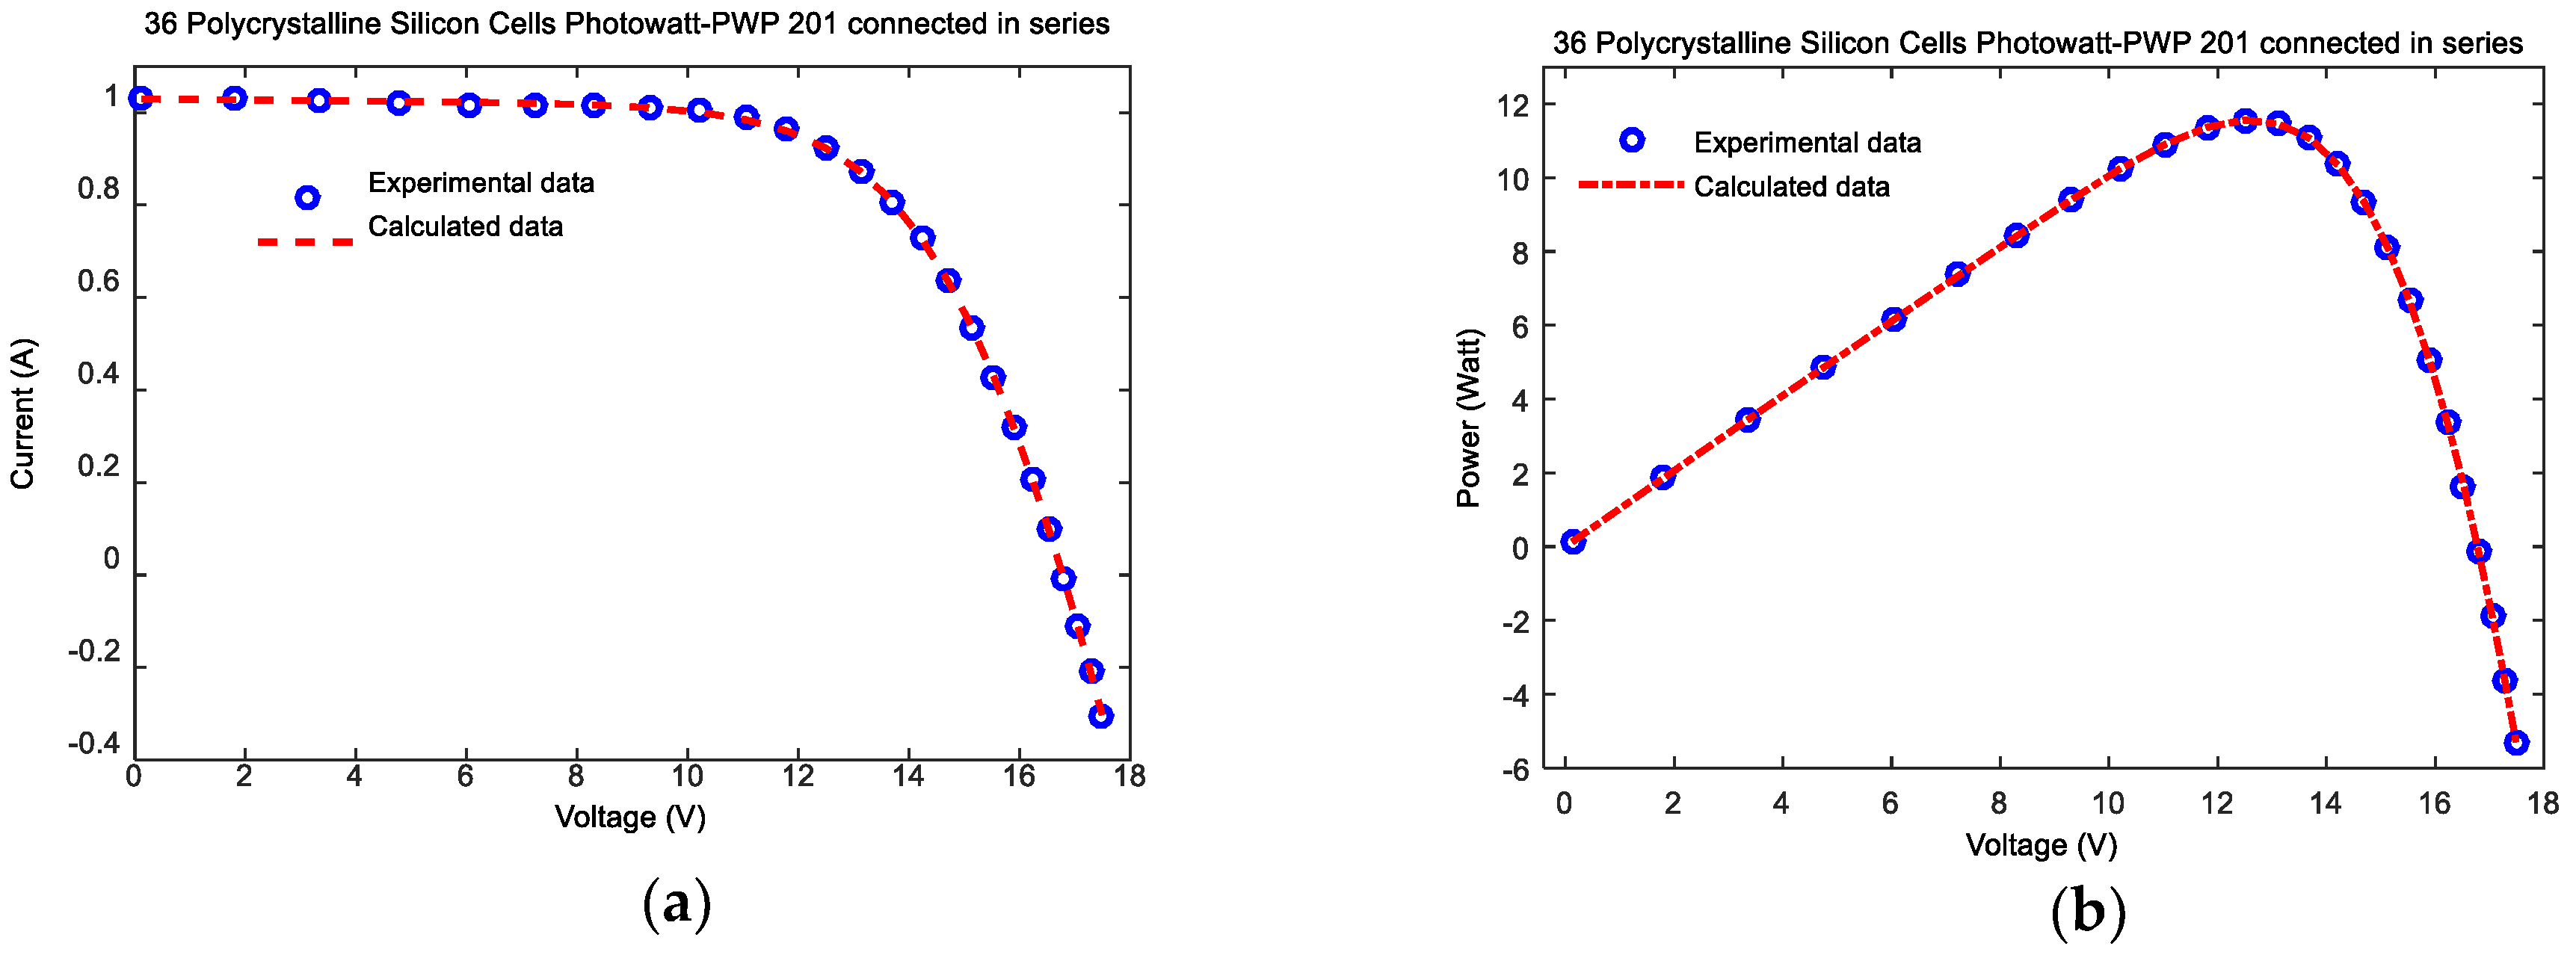
In order to validate the optimal values I p h , I 0 , a , R s and R p extracted by the Firefly algorithm, they are substituted into Equation (1) to reconstruct the current-voltage and power-voltage of the photovoltaic module. Figure 13 illustrates the current-voltage characteristics of the optimal values extracted by FA along with the experimental data. From the results, it can be observed that the values extracted by FA for the considered photovoltaic module fit the experimental data very well.
From these two cases for the solar cell, the single diode and double diode models, the Firefly algorithm showed the lowest statistical criteria: IAE, RMSE, SSE and MAE values among the compared techniques. We observed that the proposed algorithm is able to extract the intrinsic electrical parameters at the entire range of irradiance and temperature and performance, as compared to other recent techniques.

6. Conclusions

The paper presents the application of the Firefly algorithm in order to provide an accurate model of solar cells, single and double, and photovoltaic modules. The data required for testing the effectiveness of the Firefly algorithm optimization technique is based on the results in previous literature, experimental data and the nonlinear function of solar cell/photovoltaic characteristics. From the results and the statistical analyses, it can be observed that the proposed Firefly algorithm achieves the least root mean square error (RMSE), residual sum of squares (SSE) and mean absolute error (MAE) comparing the estimated and experimental data. Furthermore, the reproduction of current-voltage characteristics predicted using the parameters extracted by the Firefly algorithm are very close to those based on the experimental data. Moreover, the Firefly algorithm can extract the optimal parameters at all ranges of irradiance and temperature, especially at low irradiance.

Author Contributions

In this research activity, all of the authors were involved in the data analysis and preprocessing phase, the simulation, the results analysis and discussion, and the manuscript’s preparation. All of the authors have approved the submitted manuscript. All the authors equally contributed to the writing of the paper.

Conflicts of Interest

The authors declare no conflict of interest.

References

  1. Sen, S.; Ganguly, S. Opportunities, barriers and issues with renewable energy development a discussion. Renew. Sustain. Energy Rev. 2017, 69, 1170–1181. [Google Scholar] [CrossRef]
  2. Tran, T.T.D.; Smith, A.D. Evaluation of renewable energy technologies and their potential for technical integration and cost-effective use within the U.S. energy sector. Renew. Sustain. Energy Rev. 2017, 80, 1372–1388. [Google Scholar] [CrossRef]
  3. Karatepe, E.; Boztepe, M.; Çolak, M. Development of a suitable model for characterizing photovoltaic arrays with shaded solar cells. Sol. Energy 2007, 81, 977–992. [Google Scholar] [CrossRef]
  4. Fathabadi, H. Novel neural-analytical method for determining silicon/plastic solar cells and modules characteristics. Energy Convers. Manag. 2013, 76, 253–259. [Google Scholar] [CrossRef]
  5. Mares, O.; Paulescu, M.; Badescu, V. A simple but accurate procedure for solving the five-parameter model. Energy Convers. Manag. 2015, 105, 139–148. [Google Scholar] [CrossRef]
  6. Pelap, F.B.; Dongo, P.D.; Kapim, A.D. Optimization of the characteristics of the PV cells using nonlinear electronic components. Sustain. Energy Technol. Assess. 2016, 16, 84–92. [Google Scholar]
  7. Maghami, M.R.; Hizam, H.; Gomes, C.; Radzi, M.A.; Rezadad, M.I.; Hajighorbani, S. Power loss due to soiling on solar panel: A review. Renew. Sustain. Energy Rev. 2016, 59, 1307–1316. [Google Scholar] [CrossRef]
  8. Fouad, M.M.; Shihata, L.A.; Morgan, E.I. An integrated review of factors influencing the performance of photovoltaic panels. Renew. Sustain. Energy Rev. 2017, 80, 1499–1511. [Google Scholar] [CrossRef]
  9. Abidi, M.; Jabrallah, S.B.; Corriou, J.P. Optimization of the dynamic behavior of a solar distillation cell by Model Predictive Control. Desalination 2011, 279, 315–324. [Google Scholar]
  10. Cotfas, D.T.; Cotfas, P.A.; Kaplanis, S. Methods and techniques to determine the dynamic parameters of solar cells: Review. Renew. Sustain. Energy Rev. 2016, 61, 213–221. [Google Scholar] [CrossRef]
  11. Nemnes, G.A.; Besleaga, C.; Tomulescu, A.G.; Pintilie, I.; Pintilie, L.; Torfason, K.; Manolescu, A. Dynamic electrical behavior of halide perovskite based solar cells. Sol. Energy Mater. Sol. Cells 2017, 159, 197–203. [Google Scholar] [CrossRef]
  12. Pavan, A.M.; Mellit, A.; Lughi, V. Explicit empirical model for general photovoltaic devices: Experimental validation at maximum power point. Sol. Energy 2014, 101, 105–116. [Google Scholar] [CrossRef]
  13. Boutana, N.; Mellit, A.; Lughi, V.; Pavan, A.M. Assessment of implicit and explicit models for different photovoltaic modules technologies. Energy 2017, 122, 128–143. [Google Scholar] [CrossRef]
  14. De Soto, W.; Klein, S.A.; Beckman, W.A. Improvement and validation of a model for photovoltaic array performance. Sol. Energy 2006, 80, 78–88. [Google Scholar] [CrossRef]
  15. Brano, V.L.; Orioli, A.; Ciulla, G.; di Gangi, A. An improved five-parameter model for photovoltaic modules. Sol. Energy Mater. Sol. Cells 2010, 94, 1358–1370. [Google Scholar] [CrossRef]
  16. Ding, K.; Zhang, J.; Bian, X.; Xu, J. A simplified model for photovoltaic modules based on improved translation equations. Sol. Energy 2014, 101, 40–52. [Google Scholar] [CrossRef]
  17. Karmalkar, S.; Haneefa, S. A Physically Based Explicit J–V Model of a Solar Cell for Simple Design Calculations. IEEE Electron Device Lett. 2008, 29, 449–451. [Google Scholar] [CrossRef]
  18. Das, A.K. An explicit J–V model of a solar cell for simple fill factor calculation. Sol. Energy 2011, 85, 1906–1909. [Google Scholar] [CrossRef]
  19. Das, A.K. Analytical derivation of explicit J–V model of a solar cell from physics based implicit model. Sol. Energy 2012, 86, 26–30. [Google Scholar] [CrossRef]
  20. Lun, S.; Wang, S.; Yang, G.; Guo, T. A new explicit double-diode modeling method based on Lambert W-function for photovoltaic arrays. Sol. Energy 2015, 116, 69–82. [Google Scholar] [CrossRef]
  21. Boutana, N.; Mellit, A.; Haddad, S.; Rabhi, A.; Pavan, A.M. An explicit I-V model for photovoltaic module technologies. Energy Convers. Manag. 2017, 138, 400–412. [Google Scholar] [CrossRef]
  22. Dehghanzadeh, A.; Farahani, G.; Maboodi, M. A novel approximate explicit double-diode model of solar cells for use in simulation studies. Renew. Energy 2017, 103, 468–477. [Google Scholar] [CrossRef]
  23. Dolara, A.; Leva, S.; Manzolini, G. Comparison of different physical models for PV power output prediction. Sol. Energy 2015, 119, 83–99. [Google Scholar] [CrossRef] [Green Version]
  24. Hasan, M.A.; Parida, S.K. An overview of solar photovoltaic panel modeling based on analytical and experimental viewpoint. Renew. Sustain. Energy Rev. 2016, 60, 75–83. [Google Scholar] [CrossRef]
  25. Leva, S.; Dolara, A.; Grimaccia, F.; Mussetta, M.; Ogliari, E. Analysis and validation of 24 hours ahead neural network forecasting of photovoltaic output power. Math. Comput. Simul. 2017, 131, 88–100. [Google Scholar] [CrossRef] [Green Version]
  26. Ogliari, E.; Dolara, A.; Manzolini, G.; Leva, S. Physical and hybrid methods comparison for the day ahead PV output power forecast. Renew. Energy 2017, 113, 11–21. [Google Scholar] [CrossRef]
  27. Grimaccia, F.; Leva, S.; Mussetta, M.; Ogliari, E. ANN Sizing Procedure for the Day-Ahead Output Power Forecast of a PV Plant. Appl. Sci. 2017, 7, 622. [Google Scholar] [CrossRef]
  28. Chen, Y.; Wang, X.; Li, D.; Hong, R.; Shen, H. Parameters extraction from commercial solar cells I–V characteristics and shunt analysis. Appl. Energy 2011, 88, 2239–2244. [Google Scholar] [CrossRef]
  29. Easwarakhanthan, T.; Bottin, J.; Bouhouch, I.; Boutrit, C. Nonlinear Minimization Algorithm for Determining the Solar Cell Parameters with Microcomputers. Int. J. Sol. Energy 1986, 4, 1–12. [Google Scholar] [CrossRef]
  30. Chan, D.S.H.; Phillips, J.R.; Phang, J.C.H. A comparative study of extraction methods for solar cell model parameters. Solid-State Electron. 1986, 29, 329–337. [Google Scholar] [CrossRef]
  31. Ortiz-Conde, A.; Sánchez, F.J.G.; Muci, J. New method to extract the model parameters of solar cells from the explicit analytic solutions of their illuminated I–V characteristics. Sol. Energy Mater. Sol. Cells 2006, 90, 352–361. [Google Scholar] [CrossRef]
  32. Nassar-eddine, I.; Obbadi, A.; Errami, Y.; el fajri, A.; Agunaou, M. Parameter estimation of photovoltaic modules using iterative method and the Lambert W function: A comparative study. Energy Convers. Manag. 2016, 119, 37–48. [Google Scholar] [CrossRef]
  33. Gao, X.; Cui, Y.; Hu, J.; Xu, G.; Yu, Y. Lambert W-function based exact representation for double diode model of solar cells: Comparison on fitness and parameter extraction. Energy Convers. Manag. 2016, 127, 443–460. [Google Scholar] [CrossRef]
  34. Peng, L.; Sun, Y.; Meng, Z. An improved model and parameters extraction for photovoltaic cells using only three state points at standard test condition. J. Power Sources 2014, 248, 621–631. [Google Scholar] [CrossRef]
  35. Cubas, J.; Pindado, S.; de Manuel, C. Explicit Expressions for Solar Panel Equivalent Circuit Parameters Based on Analytical Formulation and the Lambert W-Function. Energies 2014, 7, 4098–4115. [Google Scholar] [CrossRef]
  36. Lim, L.H.I.; Ye, Z.; Ye, J.; Yang, D.; Du, H. A Linear Identification of Diode Models from Single I-V Characteristics of PV Panels. IEEE Trans. Ind. Electron. 2015, 62, 4181–4193. [Google Scholar] [CrossRef]
  37. Lim, L.H.I.; Ye, Z.; Ye, J.; Yang, D.; Du, H. A linear method to extract diode model parameters of solar panels from a single I–V curve. Renew. Energy 2015, 76, 135–142. [Google Scholar] [CrossRef]
  38. Tsuno, Y.; Hishikawa, Y.; Kurokawa, K. Modeling of the I–V curves of the PV modules using linear interpolation/extrapolation. Sol. Energy Mater. Sol. Cells 2009, 93, 1070–1073. [Google Scholar] [CrossRef]
  39. Lun, S.; Guo, T.; Du, C. A new explicit I–V model of a silicon solar cell based on Chebyshev Polynomials. Sol. Energy 2015, 119, 179–194. [Google Scholar] [CrossRef]
  40. Lun, S.; Du, C.; Guo, T.; Wang, S.; Sang, J.; Li, J. A new explicit I–V model of a solar cell based on Taylor’s series expansion. Sol. Energy 2013, 94, 221–232. [Google Scholar] [CrossRef]
  41. Lun, S.; Du, C.; Yang, G.; Wang, S.; Guo, T.; Sang, J.; Li, J. An explicit approximate I–V characteristic model of a solar cell based on padé approximants. Sol. Energy 2013, 92, 147–159. [Google Scholar] [CrossRef]
  42. Lun, S.; Du, C.; Sang, J.; Guo, T.; Wang, S.; Yang, G. An improved explicit I–V model of a solar cell based on symbolic function and manufacturer’s datasheet. Sol. Energy 2014, 110, 603–614. [Google Scholar] [CrossRef]
  43. Louzazni, M.; Aroudam, E.H. An analytical mathematical modeling to extract the parameters of solar cell from implicit equation to explicit form. Appl. Sol. Energy 2015, 51, 165–171. [Google Scholar] [CrossRef]
  44. Zhang, Y.; Gao, S.; Gu, T. Prediction of I-V characteristics for a PV panel by combining single diode model and explicit analytical model. Sol. Energy 2017, 144, 349–355. [Google Scholar] [CrossRef]
  45. Pindado, S.; Cubas, J. Simple mathematical approach to solar cell/panel behavior based on datasheet information. Renew. Energy 2017, 103, 729–738. [Google Scholar] [CrossRef]
  46. Tong, N.T.; Pora, W. A parameter extraction technique exploiting intrinsic properties of solar cells. Appl. Energy 2016, 176, 104–115. [Google Scholar] [CrossRef]
  47. Dkhichi, F.; Oukarfi, B.; Fakkar, A.; Belbounaguia, N. Parameter identification of solar cell model using Levenberg–Marquardt algorithm combined with simulated annealing. Sol. Energy 2014, 110, 781–788. [Google Scholar] [CrossRef]
  48. Askarzadeh, A.; Rezazadeh, A. Artificial bee swarm optimization algorithm for parameters identification of solar cell models. Appl. Energy 2013, 102, 943–949. [Google Scholar] [CrossRef]
  49. Oliva, D.; Cuevas, E.; Pajares, G. Parameter identification of solar cells using artificial bee colony optimization. Energy 2014, 72, 93–102. [Google Scholar] [CrossRef]
  50. Hamid, N.F.A.; Rahim, N.A.; Selvaraj, J. Solar cell parameters identification using hybrid Nelder-Mead and modified particle swarm optimization. J. Renew. Sustain. Energy 2016, 8, 015502. [Google Scholar] [CrossRef]
  51. Louzazni, M.; Crãciunescu, A.; Dumitrache, A. Identification of Solar Cell Parameters with Firefly Algorithm. In Proceedings of the 2015 Second International Conference on Mathematics and Computers in Sciences and in Industry (MCSI), Sliema, Malta, 17–19 August 2015; pp. 7–12. [Google Scholar]
  52. Louzazni, M.; Khouya, A.; Amechnoue, K.; Crăciunescu, A.; Mussetta, M. Comparative prediction of single and double diode parameters for solar cell models with firefly algorithm. In Proceedings of the 2017 10th International Symposium on Advanced Topics in Electrical Engineering (ATEE), Bucharest, Romania, 23–25 March 2017; pp. 860–865. [Google Scholar]
  53. Louzazni, M.; Khouya, A.; Amechnoue, K. A firefly algorithm approach for determining the parameters characteristics of solar cell. Leonardo Electron. J. Pract. Technol. 2017, 31, 235–250. [Google Scholar]
  54. Wang, Y.; Xi, J.; Han, N.; Xie, J. Modeling method research of flexible amorphous silicon solar cell. Appl. Sol. Energy 2015, 51, 41–46. [Google Scholar] [CrossRef]
  55. AlHajri, M.F.; El-Naggar, K.M.; AlRashidi, M.R.; Al-Othman, A.K. Optimal extraction of solar cell parameters using pattern search. Renew. Energy 2012, 44, 238–245. [Google Scholar] [CrossRef]
  56. Jervase, J.A.; Bourdoucen, H.; Al-Lawati, A. Solar cell parameter extraction using genetic algorithms. Meas. Sci. Technol. 2001, 12, 1922. [Google Scholar] [CrossRef]
  57. Zagrouba, M.; Sellami, A.; Bouaïcha, M.; Ksouri, M. Identification of PV solar cells and modules parameters using the genetic algorithms: Application to maximum power extraction. Sol. Energy 2010, 84, 860–866. [Google Scholar] [CrossRef]
  58. El-Naggar, K.M.; AlRashidi, M.R.; AlHajri, M.F.; Al-Othman, A.K. Simulated Annealing algorithm for photovoltaic parameters identification. Sol. Energy 2012, 86, 266–274. [Google Scholar] [CrossRef]
  59. Gong, W.; Cai, Z. Parameter extraction of solar cell models using repaired adaptive differential evolution. Sol. Energy 2013, 94, 209–220. [Google Scholar] [CrossRef]
  60. Ye, M.; Wang, X.; Xu, Y. Parameter extraction of solar cells using particle swarm optimization. J. Appl. Phys. 2009, 105, 094502. [Google Scholar] [CrossRef]
  61. Askarzadeh, A.; Coelho, L.d.S. Determination of photovoltaic modules parameters at different operating conditions using a novel bird mating optimizer approach. Energy Convers. Manag. 2015, 89, 608–614. [Google Scholar] [CrossRef]
  62. Wang, L.; Huang, C. A novel Elite Opposition-based Jaya algorithm for parameter estimation of photovoltaic cell models. Opt. Int. J. Light Electron Opt. 2018, 155, 351–356. [Google Scholar] [CrossRef]
  63. Yang, X.-S. Multiobjective firefly algorithm for continuous optimization. Eng. Comput. 2013, 29, 175–184. [Google Scholar] [CrossRef]
  64. Yang, X.-S. Nature-Inspired Metaheuristic Algorithms; Luniver Press: Frome, UK, 2010. [Google Scholar]
  65. Yang, X.-S.; He, X.-S. Why the Firefly Algorithm Works? In Nature-Inspired Algorithms and Applied Optimization; Springer: Cham, Switzerland, 2018; pp. 245–259. [Google Scholar]
  66. Yang, X.-S. Engineering Optimization: An Introduction with Metaheuristic Applications; Wiley: Hoboken, NJ, USA, 2010. [Google Scholar]
  67. Fister, I.; Fister, I.; Yang, X.-S.; Brest, J. A comprehensive review of firefly algorithms. Swarm Evol. Comput. 2013, 13, 34–46. [Google Scholar] [CrossRef]
  68. Niu, Q.; Zhang, L.; Li, K. A biogeography-based optimization algorithm with mutation strategies for model parameter estimation of solar and fuel cells. Energy Convers. Manag. 2014, 86, 1173–1185. [Google Scholar] [CrossRef]
  69. Yuan, X.; He, Y.; Liu, L. Parameter extraction of solar cell models using chaotic asexual reproduction optimization. Neural Comput. Appl. 2015, 26, 1227–1239. [Google Scholar] [CrossRef]
  70. Soon, J.J.; Low, K.S. Optimizing Photovoltaic Model for Different Cell Technologies Using a Generalized Multidimension Diode Model. IEEE Trans. Ind. Electron. 2015, 62, 6371–6380. [Google Scholar] [CrossRef]
  71. Merten, J.; Asensi, J.M.; Voz, C.; Shah, A.V.; Platz, R.; Andreu, J. Improved equivalent circuit and analytical model for amorphous silicon solar cells and modules. IEEE Trans. Electron Devices 1998, 45, 423–429. [Google Scholar] [CrossRef] [Green Version]
  72. Hubin, J.; Shah, A.V. Effect of the recombination function on the collection in a p-i-n solar cell. Philos. Mag. Part B 1995, 72, 589–599. [Google Scholar] [CrossRef]
  73. Voswinckel, S.; Wesselak, V.; Lustermann, B. Behaviour of amorphous silicon solar modules: A parameter study. Sol. Energy 2013, 92, 206–213. [Google Scholar] [CrossRef]
  74. Merten, J.; Andreu, J. Clear separation of seasonal effects on the performance of amorphous silicon solar modules by outdoor I/V-measurements. Sol. Energy Mater. Sol. Cells 1998, 52, 11–25. [Google Scholar] [CrossRef]
  75. Shah, A.V.; Sculati-Meillaud, F.; Berényi, Z.J.; Ghahfarokhi, O.M.; Kumar, R. Diagnostics of thin-film silicon solar cells and solar panels/modules with variable intensity measurements (VIM). Sol. Energy Mater. Sol. Cells 2011, 95, 398–403. [Google Scholar] [CrossRef]
  76. Nonomura, S.; Okamoto, H.; Hamakawa, Y. Determination of the Built-in Potential in a-Si Solar Cells by Means of Electroabsorption Method. Jpn. J. Appl. Phys. 1982, 21, L464–L466. [Google Scholar] [CrossRef]
  77. Dongaonkar, S.; Karthik, Y.; Wang, D.; Frei, M.; Mahapatra, S.; Alam, M.A. On the Nature of Shunt Leakage in Amorphous Silicon p-i-n Solar Cells. IEEE Electron Device Lett. 2010, 31, 1266–1268. [Google Scholar] [CrossRef]
  78. Dongaonkar, S.; Servaites, J.D.; Ford, G.M.; Loser, S.; Moore, J.; Gelfand, R.M.; Mohseni, H.; Hillhouse, H.W.; Agrawal, R.; Ratner, M.A.; et al. Universality of non-Ohmic shunt leakage in thin-film solar cells. J. Appl. Phys. 2010, 108, 124509. [Google Scholar] [CrossRef]
  79. El-Fergany, A. Efficient Tool to Characterize Photovoltaic Generating Systems Using Mine Blast Algorithm. Electr. Power Compon. Syst. 2015, 43, 890–901. [Google Scholar] [CrossRef]
Figure 1. Equivalent circuit solar cell model: (a) single and double diode, (b) flexible hydrogenated amorphous silicon a-Si:H.
Applsci 08 00339 g001
Figure 2. The characteristic current-voltage division in two zones.
Applsci 08 00339 g002
Figure 3. A conceptual view of the firefly algorithm relationships, including locations x , distance r , brightness I ( r ) , and attractiveness β ( r ) .
Applsci 08 00339 g003
Figure 4. A pseudocode for the considered firefly algorithm implementation.
Applsci 08 00339 g004
Figure 5. Individual absolute error (IAE) plots for single and double diode for Mono-crystalline silicon solar cell, RTC France Company.
Applsci 08 00339 g005
Figure 6. Relative Error (RE) plots for single and double diode for Mono-crystalline silicon solar cell, RTC France Company.
Applsci 08 00339 g006
Figure 7. Experimental current-voltage data compared with estimated data of the ono-crystalline silicon solar cell single diode, RTC France Company.
Applsci 08 00339 g007
Figure 8. Experimental power-voltage data compared with estimated data of the mono-crystalline silicon solar cell single double diode, RTC France Company.
Applsci 08 00339 g008
Figure 9. Compared experimental current-voltage and power-voltage of the mono-crystalline single diode silicon solar cell, RTC France Company.
Applsci 08 00339 g009
Figure 10. Individual absolute error compared to, (a) I-V and (b) P-V for each current measurement by different algorithms.
Applsci 08 00339 g010
Figure 11. Comparison between, (a) I-V and (b) P-V characteristics resulting from the experimental data, Q-N, Soma and FA.
Applsci 08 00339 g011
Figure 12. Comparison between, (a) IAE and (b) RE using the extracted parameters by FA and Newton-Raphson, PS, GA and SA for photovoltaic module Photowatt-PWP 201.
Applsci 08 00339 g012
Figure 13. Comparison of (a) I-V and (b) P-V curve between experimentally recorded data for photovoltaic module Photowatt-PWP 201 and the estimated results by FA.
Applsci 08 00339 g013
Table 1. A list of analytical and numerical methods employed in the literature.
Optimization MethodReference
Least squares and Newton-Raphson method[29]
Iterative curve fitting[30]
Lambert W-functions[20,31,32,33,34,35]
Integral-based linear least square identification method[36,37]
Linear interpolation/extrapolation[38]
Chebyshev polynomials[39]
Taylor’s series expansion[40]
Padé approximants[41]
Symbolic function[42]
Analytical mathematical method[43,44,45]
Simple methods based on measured points[46]
Table 2. A list of metaheuristic methods employed in the literature.
Metaheuristic MethodsReference
Levenberg-Marquardt algorithm combined with Simulated Annealing[47]
Artificial Bee Swarm[48]
Artificial Bee Colony[49]
Hybrid Nelder-Mead and Modified Particle Swarm[50]
Firefly Algorithm[51,52,53]
Self-Organizing Migrating Algorithm[54]
Pattern Search[55]
Genetic Algorithm[56,57]
Simulated Annealing algorithm[58]
Repaired Adaptive Differential Evolution[59]
Particle Swarm Optimization[60]
Bird Mating Optimization approach[61]
Table 3. Comparison of various parameter identification techniques for single diode model (RTC France Company). FA: Firefly Algorithm; BBO-M: Biogeography-Based Optimization with Mutation strategies; RADE: Repaired Adaptive Differential Evolution; LMSA: Levenberg-Marquardt algorithm combined with Simulated Annealing; CARO: Chaotic Asexual Reproduction Optimization; ABC: Artificial Bee Colony optimization; NM-MPSO: hybrid Nelder-Mead and Modified Particle Swarm Optimization.
ApproachesParameter
I p h   ( A ) I 0   ( μ A ) a R s ( Ω ) R p ( Ω )
FA0.760697120.43244111.452456660.0334105953.40180803
BBO-M0.760780.318741.479840.0364253.36227
RADE0.7607760.3230211.4811840.03637753.718526
LMSA0.760780.318491.479760.0364353.32644
CARO0.760790.317241.481680.0364453.0893
ABC0.76080.32511.48170.036453.6433
NM-MPSO0.760780.323061.481200.0363853.7222
Table 4. Comparison of various parameter identification techniques for a double diode model (RTC France Company).
ApproachesParameter
I p h   ( A ) I 01   ( μ A ) I 02   ( μ A ) a 1 a 2 R s ( Ω ) R p ( Ω )
FA0.7608200.5911260.2453841.02461.36440.03663955.049
RADE0.7607810.2259740.7493471.4510172.00000.03674055.485443
CARO0.760750.293150.090981.473381.773210.0364154.3967
ABSO0.760780.267130.381911.465121.981520.0365754.6219
ABC0.76080.04070.28741.44951.48850.036453.7804
NM-MPSO0.760780.224760.755241.450541.999980.0367555.5296
Table 5. Calculated current and compared IAE for single diode (RTC France Company).
Item V E x p   ( V ) I E x p   ( A ) I Calculated   ( A ) FA (A)Individual Absolute Error (IAE)
RADEBBO-MNM-MPSO
1−0.20570.76400.764071437.1420 × 10−59.5590 × 10−56.0000 × 10−68.7000 × 10⁻⁵
2−0.12910.76200.762637906.3789 × 10−46.6611 × 10−46.0400 × 10−46.6200 × 10⁻⁴
3−0.05880.76050.761322138.2213 × 10−48.5473 × 10−48.1700 × 10−48.5400 × 10⁻⁴
40.00570.76050.760153473.4652 × 10−43.5034 × 10−43.6400 × 10−43.4600 × 10⁻⁴
50.06460.76000.759054349.4565 × 10−49.4298 × 10−49.4600 × 10−49.4500 × 10⁻⁴
60.11850.75900.758040999.5900 × 10−49.5528 × 10−49.4300 × 10−49.5700 × 10⁻⁴
70.16780.75700.757026422.6419 × 10−59.5100 × 10−51.2000 × 10−49.1000 × 10⁻⁵
80.21320.75700.756141548.5846 × 10−48.4950 × 10−48.1700 × 10−48.5800 × 10⁻⁴
90.25450.75550.755091074.0892 × 10−44.1823 × 10−43.6100 × 10−44.1300 × 10⁻⁴
100.29240.75400.753678083.2191 × 10−43.2967 × 10−42.7600 × 10−43.3600 × 10⁻⁴
110.32690.75050.751111806.1180 × 10−48.9542 × 10−49.5300 × 10−48.8800 × 10⁻⁴
120.35850.74650.746916574.1656 × 10−48.5737 × 10−49.1400 × 10−48.4800 × 10⁻⁴
130.38730.73850.739458499.5848 × 10−41.6042 × 10−31.6680 × 10−31.5960 × 10⁻³
140.41370.72800.727576924.2308 × 10−45.9912 × 10−45.8300 × 10−46.0400 × 10⁻⁴
150.43730.70650.706501971.9700 × 10−64.4631 × 10−44.8500 × 10−44.5200 × 10⁻⁴
160.45900.67550.675518091.8089 × 10−51.9600 × 10−42.3000 × 10−42.0600 × 10⁻⁴
170.47840.63200.631025889.7411 × 10−41.1090 × 10−31.2710 × 10−31.1170 × 10⁻³
180.49600.57300.573006276.2700 × 10−69.1027 × 10−41.1120 × 10−39.2000 × 10⁻⁴
190.51190.49900.498982811.7190 × 10−54.9902 × 10−45.6300 × 10−44.9000 × 10⁻⁴
200.52650.41300.412708392.9160 × 10−44.9030 × 10−46.1200 × 10−44.9200 × 10⁻⁴
210.53980.31650.316296742.0325 × 10−47.1532 × 10−49.8500 × 10−47.1800 × 10⁻⁴
220.55210.21200.212184951.8495 × 10−41.0468 × 10−41.4200 × 10−41.0200 × 10⁻⁴
230.56330.10350.103508978.9700 × 10−67.8397 × 10−41.2540 × 10−37.7900 × 10⁻⁴
240.5736−0.0100−0.010256072.5607 × 10−47.5437 × 10−41.2680 × 10−37.5100 × 10⁻⁴
250.5833−0.1230−0.123098419.8410 × 10−51.3775 × 10−32.5370 × 10−31.3810 × 10⁻³
260.5900−0.2100−0.210053165.3159 × 10−58.0320 × 10−41.4690 × 10−38.0700 × 10⁻⁴
Table 6. Calculated current and compared IAE for double diode (RTC France Company).
Item V E x p   ( V ) I E x p   ( A ) I Calculated   ( A ) Individual Absolute Error (IAE)
FARADENM-MPSO
1−0.20570.76400.764048004.7990 × 10−59.2680 × 10−52.3000 × 10−5
2−0.12910.76200.762658386.5837 × 10−46.5394 × 10−45.9800 × 10−4
3−0.05880.76050.761381918.8191 × 10−48.5755 × 10−48.3200 × 10−4
40.00570.76050.760208762.9123 × 10−43.3747 × 10−43.3000 × 10−4
50.06460.76000.759123298.7671 × 10−49.4000 × 10−48.9500 × 10−4
60.11850.75900.758062459.3754 × 10−49.4935 × 10−48.8000 × 10−4
70.16780.75700.757004114.1100 × 10−69.6350 × 10−51.8700 × 10−4
80.21320.75700.757502015.0201 × 10−48.5535 × 10−47.5700 × 10−4
90.25450.75550.755577547.7540 × 10−54.1885 × 10−43.2300 × 10−4
100.29240.75400.754095959.5950 × 10−53.3126 × 10−42.7700 × 10−4
110.32690.75050.750319321.8060 × 10−48.9511 × 10−48.9600 × 10−4
120.35850.74650.746518181.8185 × 10−58.4939 × 10−47.9800 × 10−4
130.38730.73850.738733792.3370 × 10−41.6021 × 10−31.4950 × 10−3
140.41370.72800.728165391.6540 × 10−46.1216 × 10−47.2900 × 10−4
150.43730.70650.706285572.1442 × 10−44.5162 × 10−43.4400 × 10−4
160.45900.67550.675942424.4242 × 10−41.9888 × 10−42.5900 × 10−4
170.47840.63200.632860498.6045 × 10−41.1123 × 10−31.0990 × 10−3
180.49600.57300.573816898.1689 × 10−49.2523 × 10−48.4500 × 10−4
190.51190.49900.498792142.0785 × 10−44.9417 × 10−45.8600 × 10−4
200.52650.41300.412763552.3644 × 10−44.9125 × 10−45.7100 × 10−4
210.53980.31650.316742122.4212 × 10−47.1918 × 10−47.5300 × 10−4
220.55210.21200.212025192.5196 × 10−51.0831 × 10−48.8000 × 10−5
230.56330.10350.103503593.5935 × 10−67.7968 × 10−48.2700 × 10−4
240.5736−01000−0.010490214.9021 × 10−47.5539 × 10−47.1100 × 10−4
250.5833−0.1230−0.123005885.8808 × 10−61.3767 × 10−31.3880 × 10−3
260.5900−0.2100−0.210053625.3621 × 10−58.0501 × 10−48.6500 × 10−4
Table 7. Statistical result for single diode model (RTC France Company).
ItemFABBO-MRADELMSACAROABCNM-MPSO
Total IAE9.92230 × 10−321.3000 × 10−317.7036 × 10−321.5104 × 10−318.1550 × 10−320.5000 × 10−317.700 × 10⁻³
RMSE5.138165 × 10−49.8634 × 10−49.8602 × 10−49.8640 × 10−49.86650 × 10−49.86200 × 10−49.8602 × 10−4
SSE5.723673 × 10−62.52997 × 10−51.5625 × 10−52.5297 × 10−51.65385 × 10−525.7000 × 10−615.6295 × 10⁻⁶
MAE3.81630 × 10−48.1923 × 10−46.8090 × 10−48.2732 × 10−46.98260 × 10−47.8846 × 10−46.8077 × 10−4
IAE: Individual Absolut Error, RMSE: Root Mean Square Error, SSE: Sum of Squares Error, MAE: Mean Absolute Error.
Table 8. Statistical result for double diode model (RTC France Company).
ItemFARADECAROABSOABCNM-MPSO
Total IAE8.570300 × 10−317.7093 × 10−369.330 × 10−317.768 × 10−320.3929 × 10−317.356 × 10⁻³
RMSE4.548499 × 10−69.82480 × 10−49.8260 × 10−49.8344 × 10−49.8610 × 10−49.8250 × 10⁻⁴
SSE5.379100 × 10−615.6338 × 10−616.9587 × 10−615.3457 × 10−625.600 × 10−614.9455 × 10⁻⁶
MAE3.2963 × 10−417.7093 × 10−369.330 × 10−317.768 × 10−320.3929 × 10−36.6754 × 10−4
Table 9. Comparison among different parameter extraction of flexile silicon a-Si:H solar cell.
Algorithm I p h   ( μ A ) d   ( m ) μ τ e f f   ( c m 2 V ) V b i   ( V ) R s ( Ω ) I 0   ( A ) a R s h ( Ω )
FA0.31675.8065 × 10−83.3306 × 10−50.98950.42423.0691 × 10−14213.4978
Q-N0.30435.8065 × 10−84.8812 × 10−50.97590.42423.0691 × 10−141.999811.9138
SOMA0.31814.9743 × 10−83.3277 × 10−50.99630.47063.0783 × 10−141.993113.9288
Table 10. Comparison between the calculate results of flexile silicon a-Si:H solar cell.
Experiment CurrentFAQ-NSOMA
Current (A)IAECurrent (A)IAECurrent (A)IAE
07.3656 × 10−47.3656 × 10−40.00410.00418.6804 × 10−48.6804 × 10⁻⁴
0.01580.01526.0 × 10−40.01000.00580.01310.0027
0.03020.03610.00590.03050.00030.03340.0032
0.06190.06530.00340.05910.00280.06230.0004
0.08680.07440.01240.06800.01880.07150.0153
0.11420.10230.01190.09550.01870.10040.0138
0.16040.16230.00190.15490.00550.16790.0075
0.30440.30020.00420.28350.02090.30180.0026
Table 11. Performance indexes of flexile silicon a-Si:H solar cell.
Statistical ErrorsFAQ-NSOMA
Standard deviation (SD)4.925 × 10−38.46 × 10−37.86 × 10⁻³
Root mean square error (RMSE)6.1634 × 10−312.3924 × 10−37.9529 × 10−3
Residual sum of squares (SSE)3.6384 × 10−41.2286 × 10−35.0604 × 10⁻⁴
Mean bias error (MBE)6.62401 × 10−31.2424 × 10−27.4912 × 10⁻³
Table 12. Optimal parameter values identified by FA for Photowatt-PWP 201 polycrystalline photovoltaic module single diode compared with other methods.
ItemFANewton-RaphsonPSGASANM-MPSO
I p h ( A ) 1.03061.03181.03131.04411.03311.0305
I 0 ( μ A ) 3.48023.28753.17563.43603.66423.6817
a 48.655148.450048.288948.586248.821148.8598
R s ( Ω ) 1.20141.20571.20531.19681.19891.1944
R s h ( Ω ) 971.1396555.5556714.2857555.5556833.3333983.9970
Table 13. Measured and calculated current of photovoltaic module Photowatt-PWP 201 at 25 different working conditions compared with SA and PS.
Item V E x p   ( V ) I E x p   ( A ) I Calculated   ( A ) Individual Absolute Error
FASAPS
10.12481.03151.029192092.30790 × 10−36.0000 × 10−52.2000 × 10−3
21.80931.03001.027435252.56480 × 10−36.4000 × 10−43.7800 × 10−3
33.35111.02601.025775552.24450 × 10−41.4100 × 10−32.6500 × 10−3
44.76221.02201.024121392.12140 × 10−33.4900 × 10−31.4100 × 10−3
56.05381.01801.022286094.28610 × 10−35.4100 × 10−32.4000 × 10−4
67.23641.01551.019906404.40640 × 10−35.2900 × 10−31.0100 × 10−3
78.31891.01401.016326792.32680 × 10−32.9600 × 10−33.8800 × 10−3
89.30971.01001.010454364.54360 × 10−4830.00 × 10−66.4200 × 10⁻³
910.21631.00351.000627572.87240 × 10−32.8200 × 10−310.320 × 10⁻³
1011.04490.98800.984585503.41450 × 10−33.7000 × 10−311.260 × 10⁻³
1111.80180.96300.959608663.39130 × 10−34.0300 × 10−311.450 × 10⁻³
1212.49290.92550.922933412.56660 × 10−33.5000 × 10−310.590 × 10⁻³
1313.12310.87250.872439976.00000 × 10−51.0000 × 10−37.5600 × 10−3
1413.69830.80750.807123593.76410 × 10−41.5200 × 10−37.4200 × 10−3
1514.22210.72650.727729521.22950 × 10−34.4000 × 10−44.7100 × 10−3
1614.69950.63450.636195181.69520 × 10−31.2200 × 10−33.0900 × 10−3
1715.13460.53450.535383768.83760 × 10−43.6000 × 10−43.0700 × 10−3
1815.53110.42750.428465609.65600 × 10−48.0000 × 10−41.7300 × 10−3
1915.89290.31850.318283802.16190 × 10−47.4000 × 10−42.3400 × 10−3
2016.22290.20850.207442191.05780 × 10−31.8900 × 10−32.5500 × 10−3
2116.52410.10100.097913343.08670 × 10−35.3400 × 10−35.0500 × 10−3
2216.7987−0.008−0.008632336.32300 × 10−45.9000 × 10−46.7000 × 10−4
2317.0499−0.111−0.111450284.50280 × 10−46.0000 × 10−52.2800 × 10−3
2417.2793−0.209−0.209615356.15350 × 10−400000000003.1900 × 10−3
2517.4885−0.303−0.302533524.66470 × 10−42.6200 × 10−36.7500 × 10−3
Table 14. Comparison of performance indexes for photovoltaic module Photowatt-PWP 201.
ItemFANewton-RaphsonPSGASA
Total IAE42.6725 × 10−356.8800 × 10−3115.610 × 10−3153.479 × 10−350.710 × 10⁻³
RMSE2.1540 × 10−3780.500 × 10−311.8000 × 10−36.9828 × 10−32.700 × 10⁻³
SSE1.1600 × 10−42.3249 × 10−48.1725 × 10−41.2190 × 10−31.7703 × 10−4
MAE1.7069 × 10−32.2752 × 10−34.6244 × 10−36.1392 × 10−32.0284 × 10−3

