Using a Combination of Spectral and Textural Data to Measure Water-Holding Capacity in Fresh Chicken Breast Fillets


1
College of Engineering, China Agricultural University, Beijing 100083, China
2
Quality & Safety Assessment Research Unit, U.S. National Poultry Research Center, USDA-ARS, 950 College Station Rd., Athens, GA 30605, USA
3
Multidisciplinary Initiative Center, Institute of High Energy Physics, Chinese Academy of Sciences, Beijing 100049, China
*
Authors to whom correspondence should be addressed.
Appl. Sci. 2018, 8(3), 343; https://doi.org/10.3390/app8030343
Submission received: 24 January 2018
/
Revised: 19 February 2018
/
Accepted: 22 February 2018
/
Published: 28 February 2018
(This article belongs to the Special Issue Hyperspectral Chemical Imaging for Food Authentication)
Abstract
:The aim here was to explore the potential of visible and near-infrared (Vis/NIR) hyperspectral imaging (400–1000 nm) to classify fresh chicken breast fillets into different water-holding capacity (WHC) groups. Initially, the extracted spectra and image textural features, as well as the mixed data of the two, were used to develop partial least square-discriminant analysis (PLS-DA) classification models. Smoothing, a first derivative process, and principle component analysis (PCA) were carried out sequentially on the mean spectra of all samples to deal with baseline offsets and identify outlier data. Six samples located outside the confidence ellipses of 95% confidence level in the score plot were defined as outliers. A PLS-DA model based on the outlier-free spectra provided a correct classification rate (CCR) value of 78% in the prediction set. Then, seven optimal wavelengths selected using a successive projections algorithm (SPA) were used to develop a simplified PLS-DA model that obtained a slightly reduced CCR with a value of 73%. Moreover, the gray-level co-occurrence matrix (GLCM) was implemented on the first principle component image (with 98.13% of variance) of the hyperspectral image to extract textural features (contrast, correlation, energy, and homogeneity). The CCR of the model developed using textural variables was less optimistic with a value of 59%. Compared to results of models based on spectral or textural data individually, the performance of the model based on the mixed data of optimal spectral and textural features was the best with an improved CCR of 86%. The results showed that the spectral and textural data of hyperspectral images together can be integrated in order to measure and classify the WHC of fresh chicken breast fillets.
1. Introduction
In recent years, the consumption of poultry meat has increased continually and reached high levels worldwide [1]. Meanwhile, high-quality and safe chicken meat and meat products are expected. Water-holding capacity (WHC), which refers to the ability of muscle to retain water, is the result of early postmortem biochemical and biophysical changes occurring in muscle tissues [2]. The WHC of fresh chicken meat is important because it influences the retention of vitamins, mineral salts, and water [3]. From an economic point of view, as the meat is sold by weight, poor WHC will lead to high drip loss and a reduction in meat weight [3,4]. Furthermore, poor WHC will cause a large amount of dripping water that appears as a red liquid and remains in the package, leading to unsatisfactory consumer acceptability [5]. There are many techniques that have been used to predict WHC, such as drip loss, filter paper tests, cooking loss, and centrifuge force [6,7,8,9,10]. Unfortunately, most of these methods tend to be time-consuming, laborious, and destructive, making them unsuitable for industry online inspection [11]. Therefore, new, fast, non-destructive, accurate, and efficient analytical methods are needed.
Hyperspectral imaging (HSI), first introduced in the 1980s and originating from remote sensing applications, contains aspects of imaging and spectroscopy [12]. HSI has found vast applications in recent years, since it can provide both external characteristics (e.g., shape, color, size, and texture) and internal properties (e.g., chemical compositions and component distribution) of the sample [13]. In the application of food quality and safety assessment, HSI has been successfully used for chilling injury detection of citrus fruit [14], distribution measurements of texture profile analysis and color in fish [15,16], melamine detection in milk powders [17], tenderness and WHC prediction in beef [5,18], fecal material inspection in poultry carcass [19], etc. However, most of these applications have only used spectral information, without considering the performance of spatial information, which is also important in food quality evaluation [20,21]. As compared to common spectroscopic techniques and machine vision imaging, one of the advantages of HSI is that it can provide both spectral and spatial information at the same time. To fully seek the advantages of HSI, some researchers [21,22,23,24] have investigated the fusion of spectral and textural data to improve the accuracy of model prediction and classification. For example, in order to improve the detection accuracy of soluble solids content of apples, spectral and textural features extracted from hyperspectral reflectance images were integrated to build combined partial least square (CPLS) regression models [21]. The prediction results showed that the CPLS model based on the integration of spectra and correlational features, compared to spectral data used alone, obtained improved results. In the study to predict pH values of salted pork [22], spectral, textural, and integrated data were used to develop partial least squares regression (PLSR) models, separately. The coefficient of determination (R2p) of 0.794 for the model based on data fusion was superior to the results for models based on spectral data (R2p = 0.783) or textural data (R2p = 0.593) alone. These results indicated that integration of spectral and textural data could be an alternative way to improve the accuracy of calibration models.
Therefore, the goal of this research was to investigate the potential of HSI for differentiation fresh chicken breast fillets with high WHC or low-WHC. The specific objectives were to (1) extract spectral data from a region of interest (ROI) in hyperspectral images of chicken breast fillets acquired in the range of 400–1000 nm; (2) identify optical wavelengths from the whole spectra that are most correlated to the WHC classification; (3) extract textural features from the first principal component (PC) image by gray-level co-occurrence matrix (GLCM); (4) combine optimal spectra with textural data by feature level fusion; and (5) develop partial least square-discriminant analysis (PLS-DA) classification models based on the spectral data, textural data, and a mixture of optimal spectra and textural data.
2. Materials and Methods
2.1. Samples Preparation
A total of 115 boneless, skinless chicken breast fillets were collected on 4 separate trial days from a commercial poultry processing plant in Athens, GA, USA. Fillet samples were selected from the deboning line at 1.5 h postmortem and transferred to the laboratory in coolers on ice. Once arrived at the laboratory (nearly 20 min), fillets were trimmed to remove visible fat and connective tissue. The left chicken breast part was used to collect hyperspectral image and the right breast part was used to measure WHC of the sample [10].
2.2. Measurement of WHC and Sample Classification
In this research, WHC was measured as drip loss (DL) according to Honikel [7] with some minor modifications. A 40 g sample was removed from the central portion of breast fillet by using a coring device. The sample was weighed and then stored at 4 °C in a covered plastic container [10]. After 2 days of storage, the sample was reweighed to calculate weight loss, separately. DL was determined as the weight loss percentage of the initial sample weight. Then, according to the measured DL values, the criteria (threshold of 0.75%) of Bowker [10] previously used to classify high-WHC and low-WHC fillets, were adjusted according to the samples and adopted in this research. Therefore, samples with DL < 0.95% were defined as high-WHC fillets and samples with DL > 0.95% were defined as low-WHC fillets.
2.3. Image Acquisition and Correction
Each breast fillet was imaged individually in the reflectance mode using the line-scan pushbroom HSI system. The system in the Vis/NIR range consisted of a 12 bit CCD camera (SensiCam QE, PCO-TECH Inc., Romulus, MI, USA), a spectrograph (ImSpector V10E with 30 μm slit, Specim-Spectral Imaging Ltd., Oulu, Finland), a C-mount objective lens (APO-Xenoplan 1.8/35 mm, Schneider Optics, Hauppauge, NY, USA) with motion control (Newark, CA, USA), two Tungsten halogen lamps that illuminated samples at 45° from left and right sides, a custom sample holder, and a computer [25]. The exposure time of the camera was set to 24 ms. The breast fillet sample was placed on the translation stage to acquire its hyperspectral image. Based on the configuration of this system, a 2-dimensional image containing the spectral dimension and one spatial dimension was acquired during each line scan. When the whole sample passed through the field of view, a three-dimension hypercube with dimensions of 688 (pixels) × 500 (lines) × 520 (wavelengths) was acquired. Only wavelengths within the range of 400–1000 nm (total 473 bands) were retained for further spectral analysis, due to low signal-to-noise ratio (SNR) beyond this range of the spectrum.
To minimize the influences of illumination and sensor sensitivity, two extra images named dark and white reference image were acquired before sample image acquisition [26]. The standard white reference image was obtained by acquiring the spectral image of a 75% reflectance Spectralon® target (SRT-75–050, Labsphere, North Sutton, NH, USA), and the dark reference image was obtained by recording the spectral image when the camera lens was completely covered by its opaque cap [27]. The calibrated image () was calculated using Equation (1).
where Im is the measured raw value, Ir is the reference value on the surface of the 75% reflectance panel, and Id is the measured dark current (~0% reflectance).
2.4. Spectral Data Extraction and Pre-Processing
After image acquisition and calibration, a square region with a side length of 170 pixels located at the image center area without specular reflection was selected as a region of interest (ROI). Both spectral and textural features were obtained from ROI. To acquire spectrum of a sample, spectral data of all pixels within ROI were obtained and averaged to generate only one mean spectrum. By repeating the same procedure with all samples, a spectral matrix of 115 samples × 473 wavelengths was generated. The processes of ROI selection and spectral data acquisition were carried out using the software ENVI 5.1 (ITT Visual Information Solutions, Boulder, CO, USA).
In this study, a Savitzky-Golay (S-G) smoothing filter (second-order polynomial and 25-point convolution interval) and a first derivative were firstly adopted to deal with baseline offsets of the spectra [28]. Other pre-processing methods, namely the SG smoothing filter, the standard normal variate (SNV), the multiplicative scatter correction (MSC), the first and second derivative, and the combination of S-G smoothing and second derivative, were tested, separately. However, raw spectra and spectra treated by these pre-processing techniques did not improve the accuracy of model compared to the spectra treated by S-G smoothing followed by the first derivative. PCA was then used on the pre-treated spectra to carry out explanatory analysis about spectral variation between samples with high WHC or low WHC. Specifically, in order to determine outliers, confidence ellipses with confidence level of 95% were calculated on the score plot of the first two PCs carrying most of the variance changes. According to previous studies [29,30], data projected outside confidence ellipses could be defined as potential outliers. Therefore, in this research, spectra located outside the confidence ellipses of both high-WHC and low-WHC groups were defined as outlier data and removed before classification model development.
Moreover, the high spectral resolution inevitably leads to a large amount of data and variable redundancy and makes the analysis of a spectral matrix time-consuming. To overcome these problems, many techniques are available, such as optimal wavelengths selection, which is a commonly used procedure to reduce the dimension of hyperspectral data and to develop a simplified model. The successive projections algorithm (SPA) is one of the most commonly used wavelength selection algorithms. In order to solve collinearity problems, SPA selects subsets of wavelengths whose information content is minimally redundant by employing a simple projection operation in a vector space [31]. Therefore, SPA was applied to select optimal wavelengths for differentiation between high-WHC and low-WHC samples in this study. The algorithm was implemented using the toolbox in MATLAB R2014b (The Math Works, Inc., Natick, MA, USA). In addition, a graphical user interface for SPA, whose detailed description was presented in [32], can be obtained at https://www-ele-ita-br.vpn.cau.edu.cn/~kawakami/spa/.
2.5. Textural Feature Extraction
Texture is an important image feature, which represents the spatial arrangement of the grey levels of the pixels [33]. Extracted texture data from all spectral images will result in a redundancy dataset, which is not conducive to the subsequent analysis [34]. Therefore, a principle component analysis (PCA) was firstly carried out to select informative characteristic images that contained most of the variation among samples. In this study, only the first principle component (PC) score image (with 98.13% of variance) was used to calculate textural data. Four textural features, namely contrast, correlation, energy, and homogeneity, were extracted from ROIs using the gray level co-occurrence matrix (GLCM) analysis method. The GLCM provides a number of second-order statistics that can be used to describe the gray level relationships within a neighborhood around a certain pixel [35,36,37]. Generally, contrast measures local variations in the image, and higher values indicate larger partial variations [38]. Correlation is a measure of image linearity among pixels. Therefore, an image with large regions of similar intensities will have a high correlation value [36]. Energy expresses the uniformity of element intensity distribution, i.e., the repetition of pixel pairs. Finally, homogeneity is used to express the closeness of element distribution in the GLCM to its diagonal.
There is no standard reference in the selection of distances and angles between pixels, for example, Mendoza et al. [39] chose a distance of 1 pixel and a texture average of four angles (0°, 45°, 90°, and 135°) in the classification of potato chips, Huang et al. [38] calculated the abovementioned four features at distances from 1 to 10 pixels, which were then averaged for only one value at each angle (0°, 45°, 90°, and 135°) for the detection of total viable count in pork, and Ma et al. [37] used five distances from 1 to 5 pixels and four directions (0°, 45°, 90°, and 135°) in the prediction of heme and non-heme iron content in pork sausages. Thus, five distances from 1 to 5 pixels and four directions (0°, 45°, 90°, and 135°) were chosen in this research to calculate textural variables. The texture data resulting from five distances were averaged into one value in each direction (0°, 45°, 90°, and 135°). Therefore, a total 16 textural variables (four angles of each textural feature) were obtained from the first PC score image. The textural feature values were calculated using MATLAB R2014b according to the following equations:
where is the number of gray levels in the quantized image, is the (i,j)-th entry in the normalized co-occurrence matrix (each entry in the co-occurrence matrix is divided by the total number of possible pairs), and , , , and are the means and standard deviations of the sums of rows and columns, respectively, in the normalized co-occurrence matrix [40].
2.6. Combination of Spectral and Textural Data
Data fusion is a process dealing with data from two or more data sources to achieve improved information by using a certain algorithm. This process can be performed at three different processing levels: pixel level fusion, feature level fusion, and decision level fusion [41]. Pixel level fusion is the lowest processing level that merges the original data directly, but this method requires a large amount of calculations; feature level fusion requires the extraction of feature variables recognized from multiple data sources and fuses for further assessment using statistical approaches; decision level fusion is a method that integrates the extracted data by applying predefined decision rules [22,41]. To avoid immense data calculation and potential information losses, feature level fusion was applied to integrate spectral and textural data in this study. The vector of combined features from each sample was built by placing the extracted spectral data and texture data consecutively one after another. A potential problem with this preprocessing method is that parameters with large values may have the hidden trouble of reducing the predicting power of smaller value parameters, which may be very important for the measured samples. Therefore, a classical normalization was carried out to overcome this drawback of feature-level data fusion by using the following equation:
where is the normalized parameter for sample i, is the original parameter for sample i, and is the mean value. Data fusion treated by mean normalization was used to develop classification models.
2.7. Development of Classification Models
A supervised classification algorithm of partial least square-discriminant analysis (PLS-DA) was applied to build models to classify chicken breast samples into high-WHC and low-WHC groups. PLS-DA, also referred to as discriminate PLS in the literature, calculates the probability of each sample belonging to each class. This classification method is based on a PLS approach that extracts a set of latent variables (LVs) that explain the sources of variation in the dependent variable X correlated to the response variable Y [42]. Briefly, PLS-DA is a particular case of PLS regression, where Y is a set of binary variables (e.g., 0 or 1) representing the categories of categorical variable on X [43,44]. One of the advantages of PLS-DA is its applicability in cases where the number of variables is much larger than samples [45], such as spectral analysis.
In this study, 2/3 samples from both high-WHC and low-WHC groups were selected randomly as the calibration set to build classification models, and the remaining samples were selected as the prediction set. Leave-one-out cross validation (LOOCV) was applied to find the optimal number of LVs and to estimate the predictive performance of the developed model. The LVs were selected where the error rate of the cross-validation set was the lowest. Established models were evaluated by the correct classification rate (CCR) of the calibration, cross-validation and prediction sets, which is calculated by the following equation:
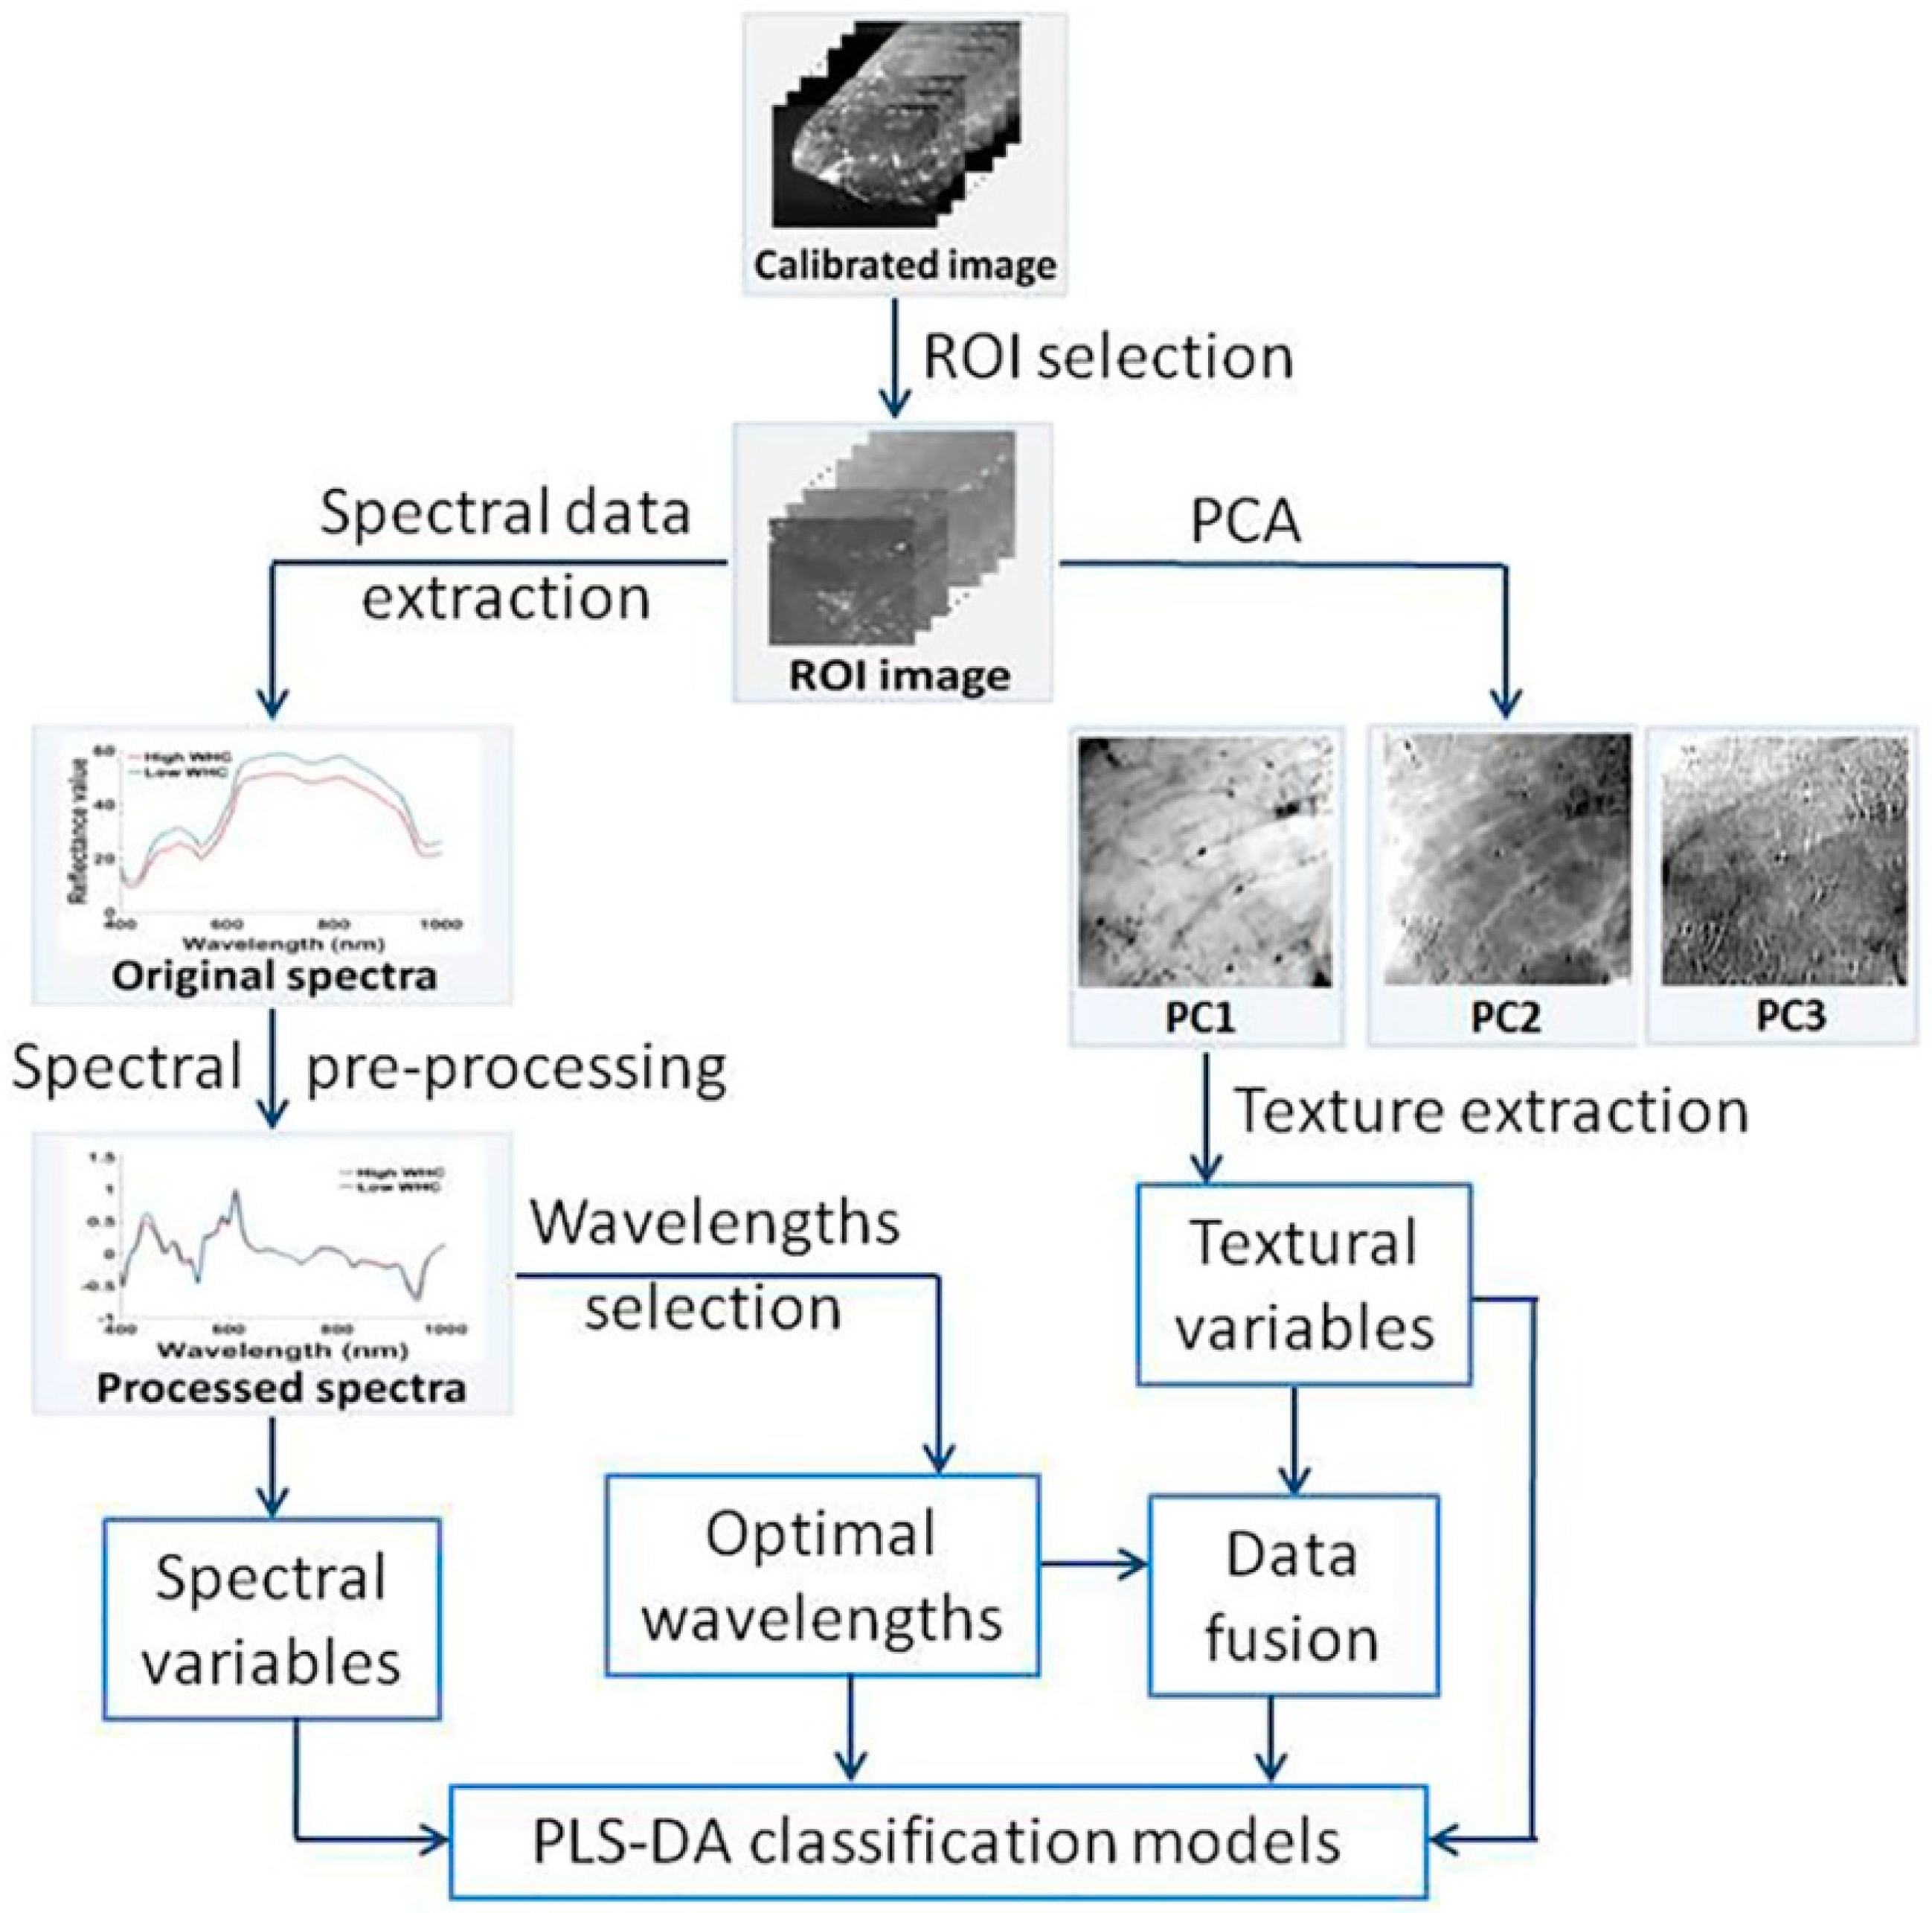
where N1 is the number of correctly classified samples, and N2 is the total number of samples in the corresponding calibration, cross-validation and prediction sets. A good model should have higher CCR values in the calibration, cross-validation and prediction sets, and small differences among them. In this work, models were individually developed using the full spectra of all wavelengths, the multi-spectra of optimal wavelengths, textural variables, as well as the mixed data from multi-spectral and textural variables. Figure 1 shows the flowchart of the main steps involved in the whole analysis procedure.
3. Results and Discussion
3.1. Spectral Features and Pre-Processing
The mean spectra of high-WHC and low-WHC samples are shown in Figure 2a, respectively. Samples with high WHC and low WHC had similar spectral trends. Nevertheless, obvious differences of the amplitudes variations can be identified, the spectrum reflectance values of samples with low WHC tended to be higher than those with high WHC. Chicken breast fillets with high values of L* were more reflective to light and showed higher reflectance values. This result can be explained by the conclusion reported in previous articles that the value of meat lightness (L*) was negatively correlated with WHC, suggesting that the paler the color, the lower the WHC [9,46].
Before model development, PCA was applied to the pre-processed spectra to obtain an overview of spectral distribution of different samples and to identify spectral outlier data. The first five principal components (PCs) explained over 98% of the variation among samples. Two confidence ellipses were calculated on the score plot of the first two PCs (accounted for 75.2% of the total variation), as shown in Figure 2b. The confidence level of these two confidence ellipses was set to 95%, which meant that we are 95% confident that data located inside the ellipse belonged to the corresponding group [30]. Therefore, six samples located outside confidence ellipses in the figure were removed. Finally, the number of samples retained for the high-WHC group was 51, and that for the low-WHC group was 58. Furthermore, it can be found that there was an intersection of spectra for high-WHC and low-WHC fillets; nevertheless, the spectra of high-WHC samples tended to locate in the negative side of PC1, while spectra of low-WHC samples tended to locate in the positive side of PC1. Figure 2 indicates that samples with different physicochemical properties (e.g., WHC) had distinguishable spectral features.
3.2. Statistics of Measured Drip Loss Values
The min, max, mean, and standard deviation (SD) of drip loss (DL) values for high-WHC and low-WHC samples, after the elimination of outlier data, are shown in Table 1. For samples with high WHC, values of DL ranged from 0.03 to 0.94 with a mean value of 0.57 and the SD of 0.22. For samples with low WHC, the DL values were as low as 0.97 and as high as 5.90 with mean and SD values of 2.22 and 1.16, respectively. These results showed that there were wide variations of DL values between high-WHC and low-WHC samples, which are important for building robust and accurate models [11].
3.3. Modeling Based on Spectral Data
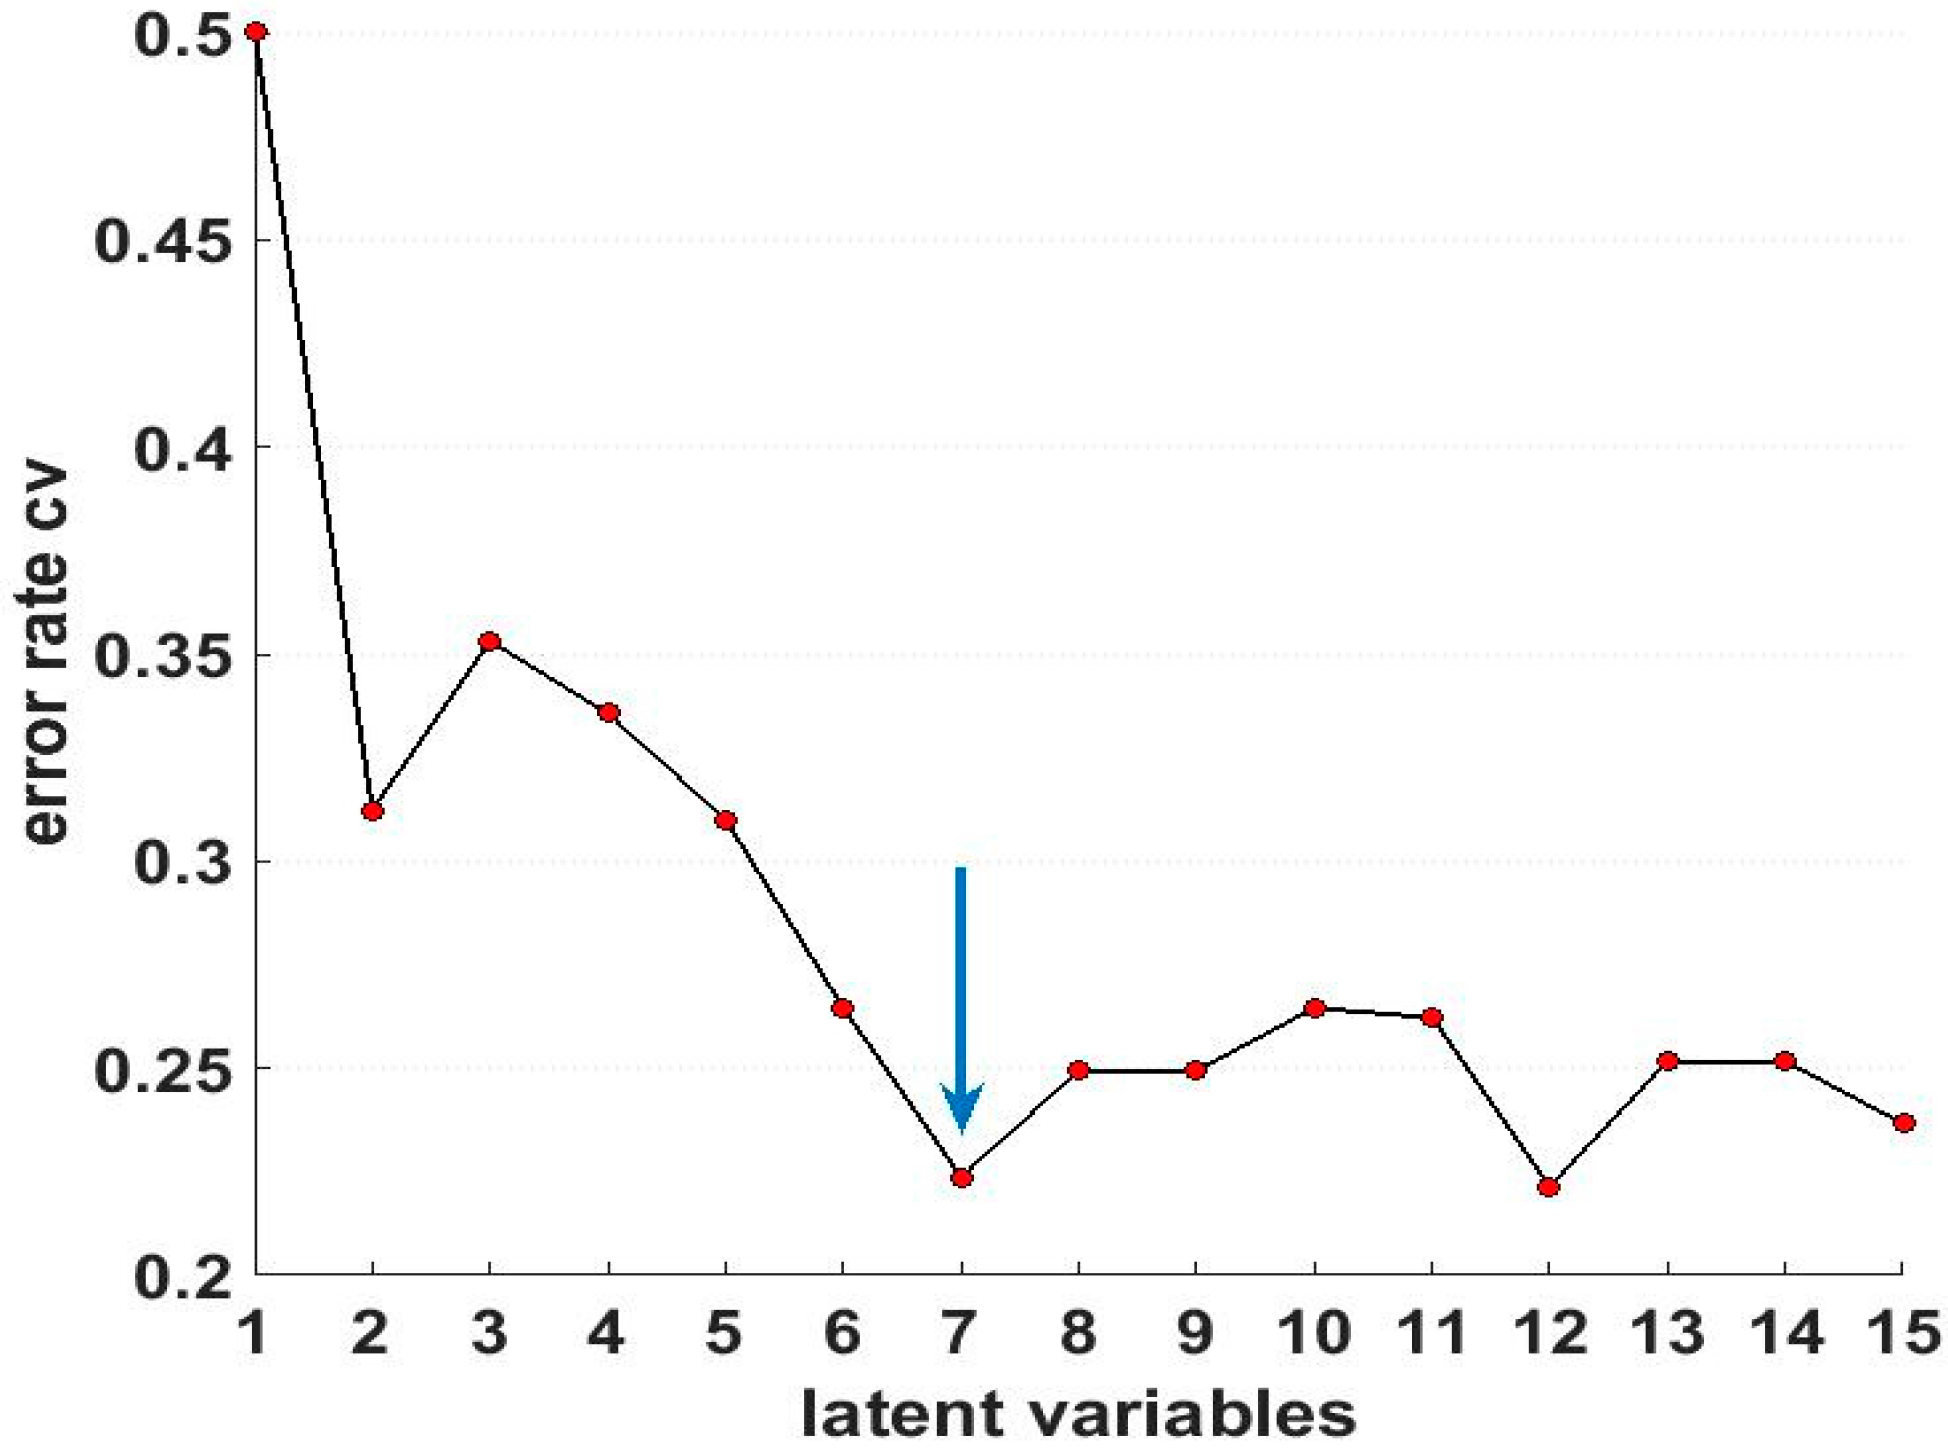
Full spectral data and the corresponding DL values were used to develop PLS-DA classification models. The ideal number of latent variables (LVs) of the PLS-DA classification model was determined at the lowest value of error rate of cross validation. As an example shown in Figure 3, seven LVs were retained to build the full-wavelength model. As shown in Table 2, the correct classification rate (CCR) of calibration, cross-validation, and prediction sets were 85%, 78%, and 78%, respectively. According to conclusions reported in previous researches [5,20], selecting optimal or informative wavelengths from full wavelengths is an effective way to reduce computational complexity of image processing and to simplify the classification model, and may obtain an equal or better result compared to the full wavelengths in modeling. In this study, eight wavelengths (441, 469, 506, 566, 596, 617, 939, and 999 nm) were selected using SPA. However, only the first seven wavelengths were adopted to develop the simplified classification model. Spectral data of 999 nm was removed from the optimal multi-spectrum subset due to the low signal-to-noise ratio of the data at the edge of the spectral range. Compared to models based on full wavelengths, models based on seven selected wavelengths showed slightly poorer performances for the classification. The CCR of calibration, cross-validation, and prediction sets were reduced to 76%, 72%, and 73%, respectively. However, the number of wavelengths involved in modeling reduced from 472 to 7, accounting for only 1.2% of all wavelengths, indicating that the first derivative processed spectra can be used to select optimal wavelengths to build simplified classification models in this research.
3.4. Modeling Based on Texture Data
To select the most informative characteristic images that explain most of the variation among samples, PCA was firstly carried out on the original hyperspectral images. The first two PC images explained 98.13% and 1.41% of the variance, respectively. Therefore, 16 textural variables were obtained from the calculated GLCM of the first PC score image. These textural variables were used as dependent variables to develop a new classification model. As shown in Table 2, compared to models based on full wavelengths and optimal wavelengths, the model based on textural features had much a lower CCR for the calibration set, the cross-validation set, and the prediction set, with values of 64%, 53%, and 59%, respectively. This may be because, compared to the external characteristics explained by the textural data, internal features explained by the spectra will contain more information about the chemical composition and internal structure of the tested samples. When developing models to classify samples into different WHC groups in this study, spectral data made a greater contribution than textural features.
3.5. Modeling Based on Data Fusion
Moreover, the spectra of selected optimal wavelengths were used to fuse with textural data to build new PLS-DA models. As shown in Table 2, the model based on data fusion obtained the best performances with an improved CCR of 90%, 83%, and 86% for the calibration set, the cross-validation set, and the prediction set, respectively. The reason may be that the data fusion of the spectral and textural data can explain more information that correlated to the drip loss values of chicken breast fillets. Therefore, integrating textural data with the spectra data of the selected optimal wavelengths can be considered in the measurement and classification of the WHC of fresh chicken breast fillets.
4. Conclusions
A hyperspectral imaging system in the Vis/NIR region of 400–1000 nm was adopted to explore the potential of combination of spectral and textural data for classifying samples with different WHC. PLS-DA classification models were built to relate spectra, textures, or the fusion of the two to the corresponding drip loss values of the samples, respectively. The correct classification rate (CCR) of the prediction set for the model based on the spectra of seven informative wavelengths (441, 469, 506, 566, 596, 617, and 939 nm) was 73%, slightly lower than that of the model based on spectra of the full-band with a value of 78%. However, selecting optimal wavelengths reduced model complexity to a large extent and may also serve as practical industrial applications. The CCR for the prediction set of the model developed using textural variables was less optimistic with only a low value of 59%. Moreover, a new PLS-DA model was built using the combined data of spectra of the selected wavelengths and 16 textural variables. Compared to models developed from spectral or textural data individually, a model based on the fusion of this data showed the highest classification accuracy with a value of 86% for the prediction set. These results indicated that integrating spectral and textural data together could be an effective way to divide chicken breast fillets into high or low WHC groups. However, further studies should be carried out to explore more data to improve classification accuracy.
Acknowledgments
This research was supported by the National Natural Science Foundation of China (No. 31772062). We really appreciate the three anonymous reviewers for their so many efforts and time to get this manuscript done. We will also pay tribute to them for the dedicated and responsible attitude, as well as the professional academic level.
Author Contributions
Seung-Chul Yoon and Hong Zhuang conceived and designed the experiments; Seung-Chul Yoon and Hong Zhuang performed the experiments; Beibei Jia and Wei Wang analyzed the data; Beibei Jia, Wei Wang, and Yu-Feng Li wrote the paper.
Conflicts of Interest
The authors declare no conflict of interest.
References
- Barbin, D.F.; Kaminishikawahara, C.M.; Soares, A.L.; Mizubuti, I.Y.; Grespan, M.; Shimokomaki, M.; Hirooka, E.Y. Prediction of chicken quality attributes by near infrared spectroscopy. Food Chem. 2015, 168, 554–560. [Google Scholar] [CrossRef] [PubMed]
- Kapper, C.; Walukonis, C.J.; Scheffler, T.L.; Scheffler, J.M.; Don, C.; Morgan, M.T.; Gerrard, D.E. Moisture absorption early postmortem predicts ultimate drip loss in fresh pork. Meat Sci. 2014, 96, 971–976. [Google Scholar] [CrossRef] [PubMed]
- Kamruzzaman, M.; Elmasry, G.; Sun, D.W.; Allen, P. Prediction of some quality attributes of lamb meat using near-infrared hyperspectral imaging and multivariate analysis. Anal. Chim. Acta 2012, 714, 57–67. [Google Scholar] [CrossRef] [PubMed]
- Micklander, E.; Bertram, H.C.; Marno, H.; Bak, L.S.; Andersen, H.J.; Engelsen, S.B.; Nørgaard, L. Early post-mortem discrimination of water-holding capacity in pig longissimus muscle using new ultrasound method. LWT-Food Sci. Technol. 2005, 38, 437–445. [Google Scholar] [CrossRef]
- Elmasry, G.; Sun, D.W.; Allen, P. Non-destructive determination of water-holding capacity in fresh beef by using nir hyperspectral imaging. Food Res. Int. 2011, 44, 2624–2633. [Google Scholar] [CrossRef]
- Zhang, M.; Mittal, G.S.; Barbut, S. Effects of test conditions on the water holding capacity of meat by a centrifugal method. LWT-Food Sci. Technol. 1995, 28, 50–55. [Google Scholar] [CrossRef]
- Honikel, K.O. Reference methods for the assessment of physical characteristics of meat. Meat Sci. 1998, 49, 447–457. [Google Scholar] [CrossRef]
- Brondum, J.; Munck, L.; Henckel, P.; Karlsson, A.; Tornberg, E.; Engelsen, S.B. Prediction of water-holding capacity and composition of porcine meat by comparative spectroscopy. Meat Sci. 2000, 55, 177–185. [Google Scholar] [CrossRef]
- Wilhelm, A.E.; Maganhini, M.B.; Hernández-Blazquez, F.J.; Ida, E.I.; Shimokomaki, M. Protease activity and the ultrastructure of broiler chicken PSE (pale, soft, exudative) meat. Food Chem. 2010, 119, 1201–1204. [Google Scholar] [CrossRef]
- Bowker, B.; Hawkins, S.; Zhuang, H. Measurement of water-holding capacity in raw and freeze-dried broiler breast meat with visible and near-infrared spectroscopy. Poult. Sci. 2014, 93, 1834–1841. [Google Scholar] [CrossRef] [PubMed]
- Wu, D.; Sun, D.W. Application of visible and near infrared hyperspectral imaging for non-invasively measuring distribution of water-holding capacity in salmon flesh. Talanta 2013, 116, 266–276. [Google Scholar] [CrossRef] [PubMed]
- Goetz, A.F.H.; Vane, G.; Solomon, J.E.; Rock, B.N. Imaging spectrometry for earth remote sensing. Science 1985, 228, 1147–1153. [Google Scholar] [CrossRef] [PubMed]
- Senthilkumar, T.; Jayas, D.S.; White, N.D.G. Detection of different stages of fungal infection in stored canola using near-infrared hyperspectral imaging. J. Stored Prod. Res. 2015, 63, 80–88. [Google Scholar] [CrossRef]
- Menesatti, P.; Urbani, G.; Lanza, G. Spectral imaging Vis-NIR system to forecast the chilling injury onset on citrus fruits. Acta Hortic. 2005, 682, 1347–1354. [Google Scholar] [CrossRef]
- Wu, D.; Sun, D.W.; He, Y. Application of long-wave near infrared hyperspectral imaging for measurement of color distribution in salmon fillet. Innov. Food Sci. Emerg. Technol. 2012, 16, 361–372. [Google Scholar] [CrossRef]
- Wu, D.; Sun, D.W.; He, Y. Novel non-invasive distribution measurement of texture profile analysis (TPA) in salmon fillet by using visible and near infrared hyperspectral imaging. Food Chem. 2014, 145, 417–426. [Google Scholar] [CrossRef] [PubMed]
- Lim, J.; Kim, G.; Mo, C.; Kim, M.S.; Chao, K.; Qin, J.; Cho, B.K. Detection of melamine in milk powders using near-infrared hyperspectral imaging combined with regression coefficient of partial least square regression model. Talanta 2016, 151, 183–191. [Google Scholar] [CrossRef] [PubMed]
- Govindarajankonda, N.; Laurenm, G.; Jeyamkondan, S.; Chrisr, C.; Ashok, S.; Georgee, M. Visible/near-infrared hyperspectral imaging for beef tenderness prediction. Comput. Electron. Agric. 2008, 64, 225–233. [Google Scholar]
- Yoon, S.C.; Park, B.; Lawrence, K.C.; Windham, W.R.; Heitschmidt, G.W. Line-scan hyperspectral imaging system for real-time inspection of poultry carcasses with fecal material and ingesta. Comput. Electron. Agric. 2011, 79, 159–168. [Google Scholar] [CrossRef]
- Xiong, Z.; Sun, D.W.; Pu, H.; Zhu, Z.; Luo, M. Combination of spectra and texture data of hyperspectral imaging for differentiating between free-range and broiler chicken meats. LWT-Food Sci. Technol. 2015, 60, 649–655. [Google Scholar] [CrossRef]
- Fan, S.; Zhang, B.; Li, J.; Liu, C.; Huang, W.; Tian, X. Prediction of soluble solids content of apple using the combination of spectra and textural features of hyperspectral reflectance imaging data. Postharvest Biol. Technol. 2016, 121, 51–61. [Google Scholar] [CrossRef]
- Liu, D.; Pu, H.; Sun, D.W.; Wang, L.; Zeng, X.A. Combination of spectra and texture data of hyperspectral imaging for prediction of pH in salted meat. Food Chem. 2014, 160, 330–337. [Google Scholar] [CrossRef] [PubMed]
- Pu, H.; Sun, D.W.; Ma, J.; Cheng, J.H. Classification of fresh and frozen-thawed pork muscles using visible and near infrared hyperspectral imaging and textural analysis. Meat Sci. 2015, 99, 81–88. [Google Scholar] [CrossRef] [PubMed]
- Yang, D.; He, D.; Lu, A.; Ren, D.; Wang, J. Combination of spectral and textural information of hyperspectral imaging for the prediction of the moisture content and storage time of cooked beef. Infrared Phys. Technol. 2017, 83, 206–216. [Google Scholar] [CrossRef]
- Yoon, S.C.; Lawrence, K.C.; Park, B. Automatic counting and classification of bacterial colonies using hyperspectral imaging. Food Bioprocess Technol. 2015, 8, 2047–2065. [Google Scholar] [CrossRef]
- Feng, Y.Z.; Sun, D.W. Application of hyperspectral imaging in food safety inspection and control: A review. Crit. Rev. Food Sci. Nutr. 2012, 52, 1039–1058. [Google Scholar] [CrossRef] [PubMed]
- Jia, B.; Yoon, S.C.; Zhuang, H.; Wang, W.; Li, C. Prediction of ph of fresh chicken breast fillets by VNIR hyperspectral imaging. J. Food Eng. 2017, 208, 57–65. [Google Scholar] [CrossRef]
- Dai, Q.; Sun, D.W.; Cheng, J.; Pu, H.; Zeng, X.; Xiong, Z. Recent Advances in De-Noising Methods and Their Applications in Hyperspectral Image Processing for the Food Industry. Compr. Rev. Food Sci. Food Saf. 2015, 13, 891–905. [Google Scholar] [CrossRef]
- Oquendo, E.R.F.; Clemente, J.B.; Malinao, J.A.; Adorna, H.N. Characterizing classes of potential outliers through traffic data set data signature 2D nMDS projection. 2017. Philipp. Inf. Technol. J. 2011, 4, 37–42. [Google Scholar]
- Salido, J.A. Outlier identification using nonmetric multidimensional scaling of yeast cell cycle phase using gene expression data. In Proceedings of the International MultiConference of Engineers and Computer Scientists, Hong Kong, China, 16–18 March 2016. [Google Scholar]
- Araújo, M.C.U.; Saldanha, T.C.B.; Galvão, R.K.H.; Yoneyama, T.; Chame, H.C.; Visani, V. The successive projections algorithm for variable selection in spectroscopic multicomponent analysis. Chemom. Intell. Lab. Syst. 2001, 57, 65–73. [Google Scholar] [CrossRef]
- Paiva, H.M. A graphical user interface for variable selection employing the successive projections algorithm. Chemom. Intell. Lab. Syst. 2012, 118, 260–266. [Google Scholar] [CrossRef]
- Kavdir, I.; Guyer, D.E. Comparison of artificial neural networks and statistical classifiers in apple sorting using textural features. Biosyst. Eng. 2004, 89, 331–344. [Google Scholar] [CrossRef]
- Zhu, H.; Chu, B.; Chu, Z.; Fei, L.; Jiang, L.; Yong, H. Hyperspectral imaging for presymptomatic detection of tobacco disease with successive projections algorithm and machine-learning classifiers. Sci. Rep. 2017, 7, 4125. [Google Scholar] [CrossRef] [PubMed]
- Kruizinga, P.; Petkov, N. Nonlinear operator for oriented texture. IEEE Trans. Signal Process. 1999, 8, 1395–1407. [Google Scholar] [CrossRef] [PubMed]
- Park, B.; Kise, M.; Windham, W.R.; Lawrence, K.C.; Yoon, S.C. Textural analysis of hyperspectral images for improving contaminant detection accuracy. Sens. Instrum. Food Qual. Saf. 2008, 2, 208–214. [Google Scholar] [CrossRef]
- Ma, F.; Qin, H.; Shi, K.; Zhou, C.; Chen, C.; Hu, X.; Zheng, L. Feasibility of combining spectra with texture data of multispectral imaging to predict heme and non-heme iron contents in pork sausages. Food Chem. 2016, 190, 142–149. [Google Scholar] [CrossRef] [PubMed]
- Huang, L.; Zhao, J.; Chen, Q.; Zhang, Y. Rapid detection of total viable count (TVC) in pork meat by hyperspectral imaging. Food Res. Int. 2013, 54, 821–828. [Google Scholar] [CrossRef]
- Mendoza, F.; Dejmek, P.; Aguilera, J.M. Colour and image texture analysis in classification of commercial potato chips. Food Res. Int. 2007, 40, 1146–1154. [Google Scholar] [CrossRef]
- Haralick, R.M.; Shanmugam, K.; Dinstein, I. Texture features for image classification. IEEE Trans. Syst. Man Cybern. 1973, SMC-3, 610–621. [Google Scholar] [CrossRef]
- Pohl, C.; Genderen, J.L.V. Review article multisensor image fusion in remote sensing: Concepts, methods and applications. Int. J. Remote Sens. 1998, 19, 823–854. [Google Scholar] [CrossRef]
- Barker, W.; Rayens, W. Partial least squares for discrimination. J. Chemom. 2003, 17, 166–173. [Google Scholar] [CrossRef]
- Pérez-Enciso, M.; Tenenhaus, M. Prediction of clinical outcome with microarray data: A partial least squares discriminant analysis (PLS-DA) approach. Hum. Genet. 2003, 112, 581–592. [Google Scholar] [PubMed]
- Kamruzzaman, M.; Barbin, D.; Elmasry, G.; Sun, D.W.; Allen, P. Potential of hyperspectral imaging and pattern recognition for categorization and authentication of red meat. Innov. Food Sci. Emerg. Technol. 2012, 16, 316–325. [Google Scholar] [CrossRef]
- Peerapattana, J.; Shinzawa, H.; Otsuka, K.; Hattori, Y.; Otsuka, M. Partial least square discriminant analysis of mangosteen pericarp powder by near infrared spectroscopy. J. Near Infrared Spectrosc. 2013, 21, 195–202. [Google Scholar] [CrossRef]
- Barbut, S. Problem of pale soft exudative meat in broiler chickens. Br. Poult. Sci. 1997, 38, 355–358. [Google Scholar] [CrossRef] [PubMed]
Figure 1.
Main steps involved in the measurement and classification of WHC of fresh chicken breast.

Figure 2.
Spectral features of chicken breast fillets: (a) mean original spectra of high-WHC and low-WHC samples, (b) scatter plot of PCA with confidence ellipses (95% confidence level) for samples of high WHC and low WHC.
Figure 2.
Spectral features of chicken breast fillets: (a) mean original spectra of high-WHC and low-WHC samples, (b) scatter plot of PCA with confidence ellipses (95% confidence level) for samples of high WHC and low WHC.
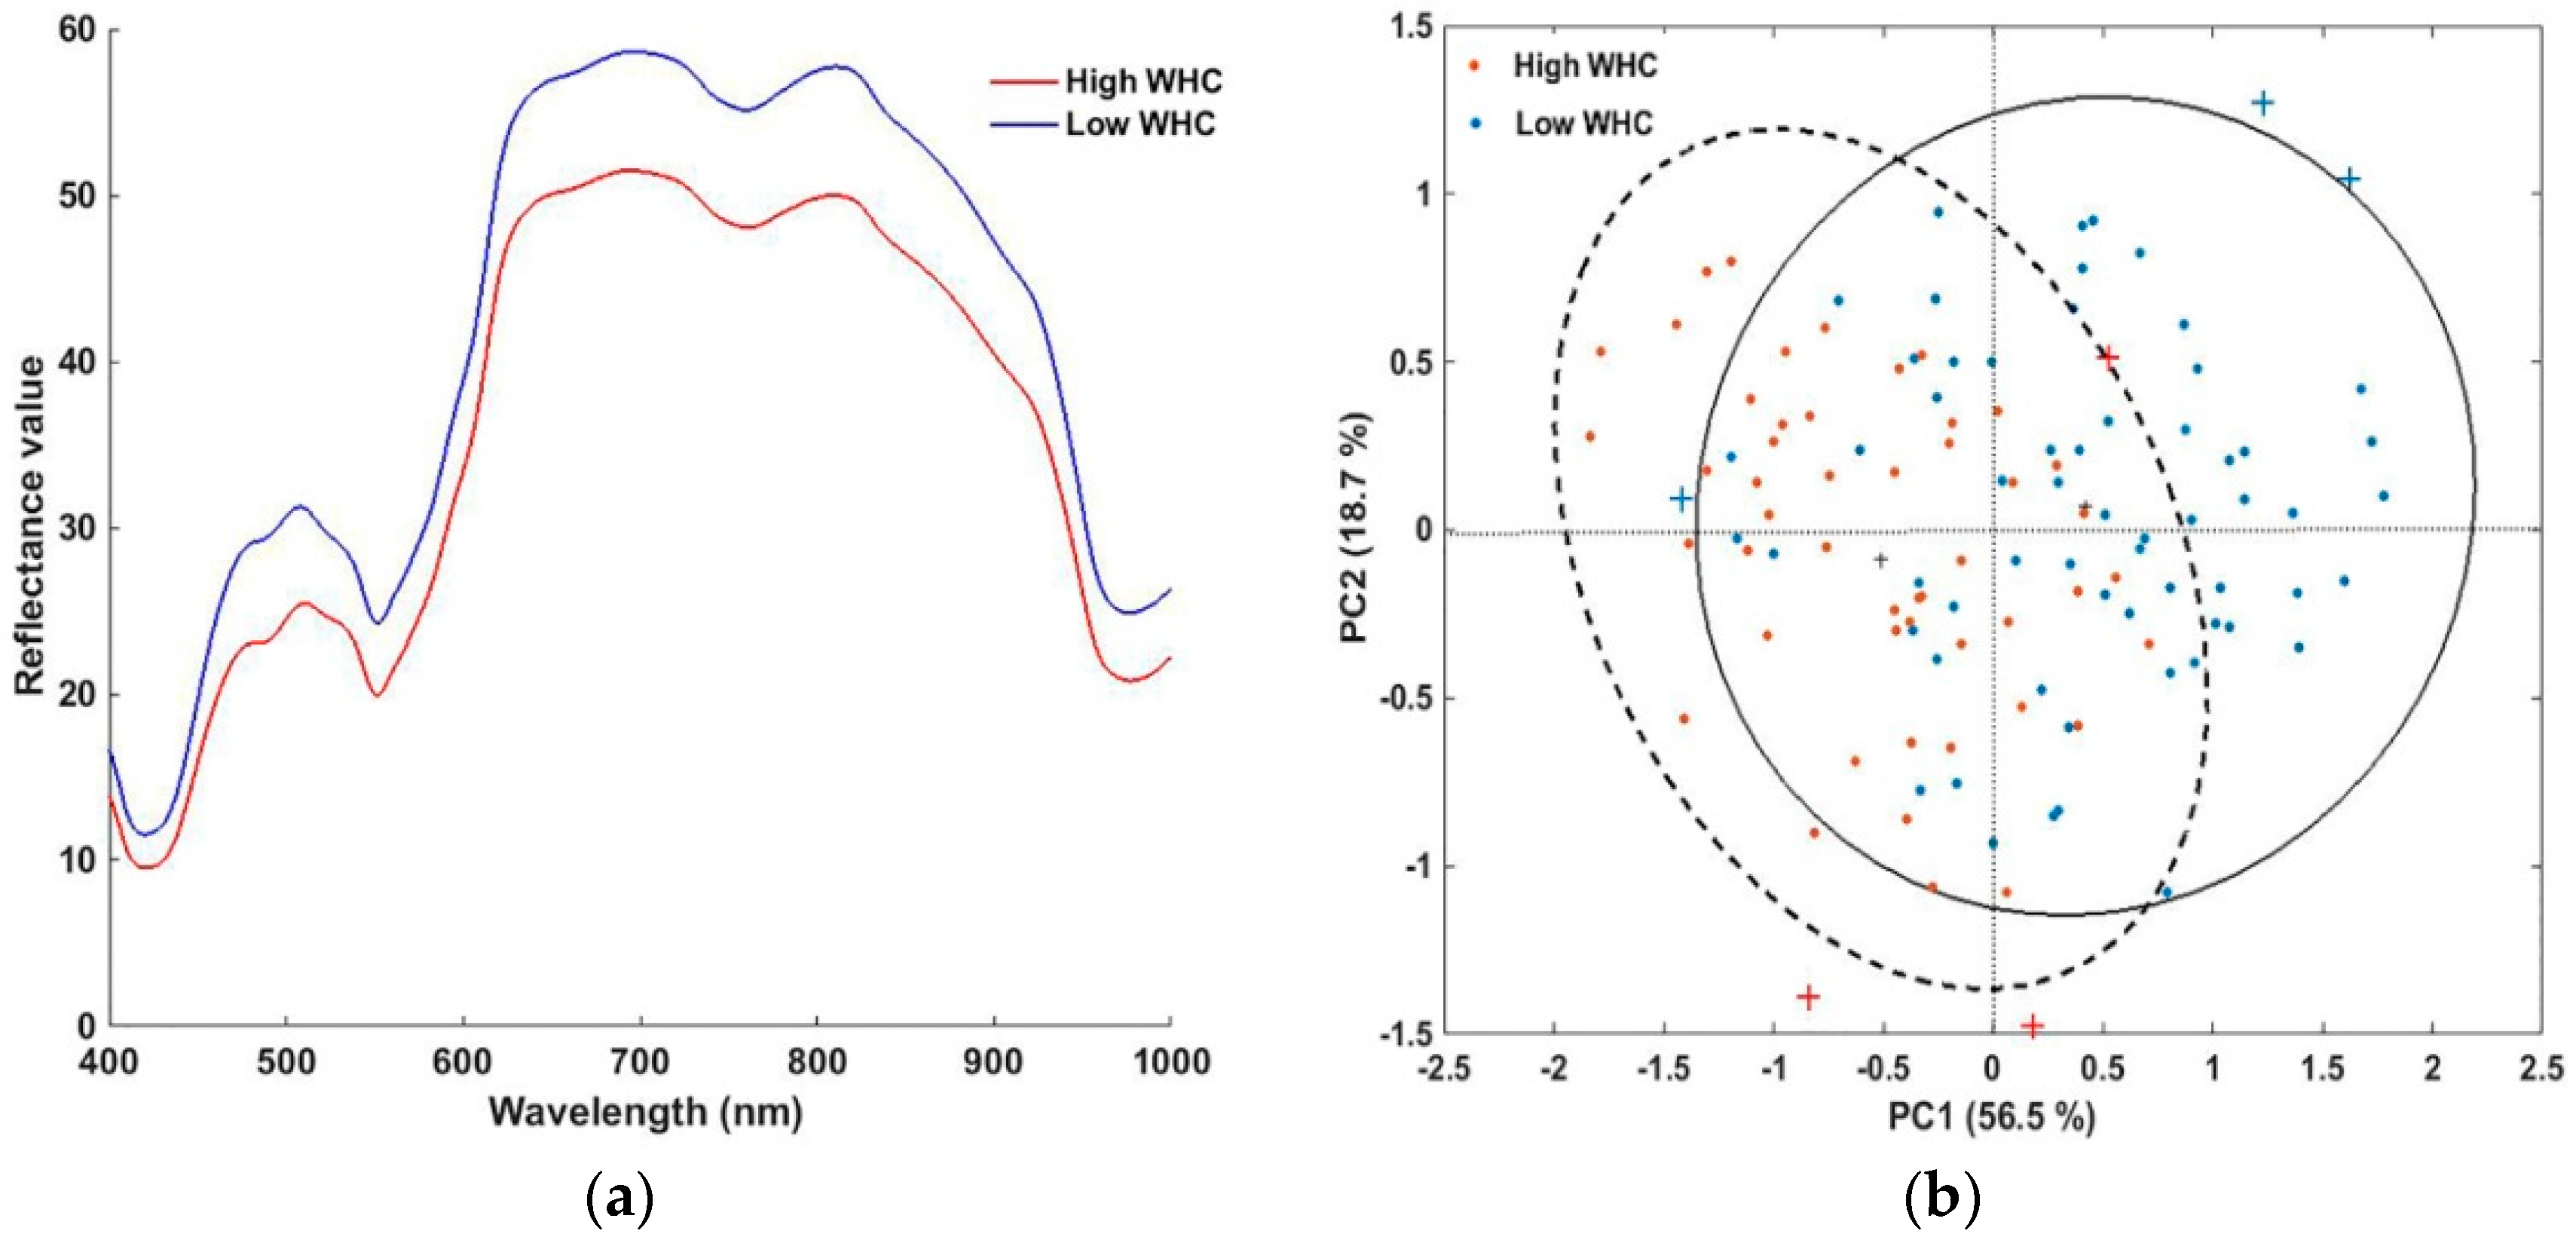
Figure 3.
The error rate of cross-validation set of partial least square-discriminant analysis (PLS-DA) model based on full wavelengths.
Figure 3.
The error rate of cross-validation set of partial least square-discriminant analysis (PLS-DA) model based on full wavelengths.

Table 1.
Measured drip loss values of chicken breast fillets.
| Parameters | Min | Max | Mean | SD |
|---|---|---|---|---|
| High WHC | 0.03 | 0.94 | 0.57 | 0.22 |
| Low WHC | 0.97 | 5.90 | 2.22 | 1.16 |
Table 2.
CCR (%) for the calibration set, cross-validation set, and prediction set of different models.
Table 2.
CCR (%) for the calibration set, cross-validation set, and prediction set of different models.
| Features | Variable Numbers | Latent Variables | CCR (%) | ||
|---|---|---|---|---|---|
| Calibration | Cross Validation | Prediction | |||
| Full spectra | 472 | 7 | 85 | 78 | 78 |
| Optimal spectra | 7 | 6 | 76 | 72 | 73 |
| Texture data | 16 | 5 | 64 | 53 | 59 |
| Data fusion | 23 | 8 | 90 | 83 | 86 |
© 2018 by the authors. Licensee MDPI, Basel, Switzerland. This article is an open access article distributed under the terms and conditions of the Creative Commons Attribution (CC BY) license (http://creativecommons.org/licenses/by/4.0/).
Share and Cite
MDPI and ACS Style
Jia, B.; Wang, W.; Yoon, S.-C.; Zhuang, H.; Li, Y.-F. Using a Combination of Spectral and Textural Data to Measure Water-Holding Capacity in Fresh Chicken Breast Fillets. Appl. Sci. 2018, 8, 343. https://doi.org/10.3390/app8030343
AMA Style
Jia B, Wang W, Yoon S-C, Zhuang H, Li Y-F. Using a Combination of Spectral and Textural Data to Measure Water-Holding Capacity in Fresh Chicken Breast Fillets. Applied Sciences. 2018; 8(3):343. https://doi.org/10.3390/app8030343
Chicago/Turabian StyleJia, Beibei, Wei Wang, Seung-Chul Yoon, Hong Zhuang, and Yu-Feng Li. 2018. "Using a Combination of Spectral and Textural Data to Measure Water-Holding Capacity in Fresh Chicken Breast Fillets" Applied Sciences 8, no. 3: 343. https://doi.org/10.3390/app8030343
Note that from the first issue of 2016, this journal uses article numbers instead of page numbers. See further details here.