Effects of Shot-Peening and Stress Ratio on the Fatigue Crack Propagation of AL 7475-T7351 Specimens
by
 , ,
, ,
Natália Ferreira
1, 
Pedro V. Antunes
1,*,
José A. M. Ferreira
1,
José D. M. Costa
1 and
Carlos Capela
1,2 1
Department of Mechanical Engineering, Centre for Mechanical Engineering, Materials and Processes (CEMMPRE), University of Coimbra, Rua Luís Reis Santos, Coimbra 3030-788, Portugal
2
Department of Mechanical Engineering, Instituto Politécnico de Leiria, ESTG, Morro do Lena—Alto Vieiro, Leiria 2400-901, Portugal
*
Author to whom correspondence should be addressed.
Appl. Sci. 2018, 8(3), 375; https://doi.org/10.3390/app8030375
Submission received: 23 January 2018
/
Revised: 24 February 2018
/
Accepted: 28 February 2018
/
Published: 5 March 2018
(This article belongs to the Special Issue Mechanical Behaviour of Aluminium Alloys)
Abstract
:Featured Application
7475-T7351 aluminum alloy are widely used for structural components in aerospace applications.
Abstract
Shot peening is an attractive technique for fatigue enhanced performance of metallic components, because it increases fatigue crack initiation life prevention and retards early crack growth. Engineering design based on fatigue crack propagation predictions applying the principles of fracture mechanics is commonly used in aluminum structures for aerospace engineering. The main purpose of present work was to analyze the effect of shot peening on the fatigue crack propagation of the 7475 aluminum alloy, under both constant amplitude loading and periodical overload blocks. The tests were performed on 4 and 8 mm thickness specimens with stress ratios of 0.05 and 0.4. The analysis of the shot-peened surface showed a small increase of the micro-hardness values due to the plastic deformations imposed by shot peening. The surface peening beneficial effect on fatigue crack growth is very limited; its main effect is more noticeable near the threshold. The specimen’s thickness only has marginal influence on the crack propagation, in opposite to the stress ratio. Periodic overload blocks of 300 cycles promotes a reduction of the fatigue crack growth rate for both intervals of 7500 and 15,000 cycles.
1. Introduction
High-strength aluminum alloys are widely used in aerospace applications due to the high strength-to-weight ratio, good corrosion resistance and high toughness combined with good formability and weldability. High-strength aluminum alloys are broadly employed in aerospace applications owing to the high strength-to-weight ratio, excellent corrosion resistance and great toughness associated with good weldability capabilities and formability. On the other hand, one of the main issues for the contemporary aircraft industry is to ensure simultaneously reliability, high durability, minimum weight and economic efficiency of transport aircraft. To obtain such crafted aircraft characteristics, it is necessary to design structures which ensure high damage tolerance. The approach to engineering design based on the assumption that flaws can exist in any structure and cracks propagate in service, is commonly used in aerospace engineering. Therefore, the prediction of crack growth rates based on the application of fracture mechanics theory is an important aspect of a structural damage tolerant assessment.
Many metal components, such as turbines blades, used in aerospace and power industries are subjected to dynamic mechanical loading, leading to the initiation of fatigue cracks. One way to reduce the risk of fatigue crack initiation is to introduce compressive stresses in the region of higher stresses concentration, for example by shot peening. At the industrial level, this is a well-established surface treatment technology, despite generating a meaningful rougher surface and therefore surface defects [1]. Considering that most fatigue cracks initiate at the surface, the conditioning of the surface to resist crack initiation and earlier crack growth is a convenient method to enhance fatigue performance. The indentation of each impact, in shot peening process, produces local plastic deformation given rise to a field of surface compressive stresses. Studies by many researchers have shown a positive shot peening effect [2,3,4], resulting from the introduction of residual compressive stresses in the subsurface layers of material. Depending on the peened material, there is an Almen intensity for which the optimum fatigue strength is achieved, corresponding to a certain balance between residual compressive stress field and surface roughness damage.
Paris’s law, which relates fatigue crack growth rate (da/dN) and stress intensity range (ΔK) is the prime approach adopted for characterizing fatigue crack propagation in engineering structures. Fatigue crack growth of the aluminum alloys in the Paris’s law regime is affected by microstructure [5,6,7] and by the crack closure induced by plasticity, oxidation and surface roughness, especially near threshold regime. Paris law characterizes the rate of crack advance per cycle: da/dN = CΔKm. The rate of crack advance per cycle is related to the stress intensity factor range ΔK. C and m are constants that depend on the material, environment and stress ratio. Crack closure is considered a very good approach to explain the influence of mean stress on the fatigue crack growth rate [6,8]. Bergner and Zouhar [6] showed that crack growth rates of various aluminum alloys varied by a factor of about 20 for some ΔK values, suggesting that the main factor to explain that discrepancies was the crack closure effect and the environment. Fatigue cracks tends to grow into a material region which has experienced large plastic strains due to its location in the crack tip plastic zone. Typically, this material is deformed beyond its elastic domain in the direction normal to the crack flanks. The trace of the plastic deformation produced is left in the crack’s path. It acts in the same way to an additional wedge stick between flanks, thus pre-straining them and partly protecting the crack tip from the action of posterior loads. This phenomenon is called plasticity induced crack closure and tends to decrease the effective stress intensity range thereby resulting in slower crack propagation rates [8].
In compact tension (CT) specimens, the crack progresses more rapidly in center than at the surface conducting to a crack tunneling effect, due to the prevailing tri-axial state of stress at the center, promoting plain strain in contrast with plain stress at surface. Striation spacing between beach marks on fatigue crack surfaces is also affected by shot and laser peening effect. Zhou et al. [9] have observed a decrease in striation spacing with increase in the number of laser peening impacts for Ti6Al4V specimens’. For the same alloy, Pant et al. [10] studied the effect of shot peening and laser peening on the fatigue crack propagation and compared with the untreated one with respect to the striation spacing; this was done using R = 0.1 and R = 0.7. Both peening surfaces presented a reduction on the striation spacing when compared to the untreated specimens.
Overloads can lead to significant interaction effects on crack propagation, as has been reported in many studies [11,12,13,14,15,16,17,18,19,20,21,22]. Crack growth retardation can be explained by many mechanisms, including models based on crack closure, residual stresses, crack tip blunting, strain hardening, reversed yielding and crack branching. The residual plastic deformation effect leads to compressive stresses in the wake of the crack and raises the crack opening load on subsequent crack growth (crack closure), becoming the most important phenomena for what concerns the explanation for the variation of characteristic features of post-overload transients [19,20,21,22,23]. Donald and Paris [23] observed for 6061-T6 and 2024-T3 aluminum alloys that closure measurements produced good data correlation between distinct stress ratio crack growths obtained in tests with increasingly K conditions. However, in the near-threshold regime with crack growth data obtained by the K-decreasing method, measured opening loads were excessive. This discrepancy was justified by Paris et al. [24], who suggested the “partial closure model”. Borrego et al. [25] concluded that crack closure explained the bias of stress ratio on the fatigue crack growth rate for the 6082-T6 aluminum alloy and the influence of several load parameters for overloads interactions if the partial crack closure model is included in the analyses.
The present work analyzes the effect of shot peening, specimen thickness and stress ratio on the fatigue crack propagation of 7475 aluminum alloy with T7351 heat treatment. T7351 provides an aged material abler to resist to stress-corrosion, the heat-treatment produces stress-relieved by control stretching and after artificially overaged to achieve the best stress corrosion resistance. A more extensive analysis of the crack growth following periodical tensile overloads blocks is also evaluated.
2. Materials and Experimental Procedures
2.1. Materials and Samples
This research was conducted using the 7475 aluminum alloy with a T7351 heat treatment. These alloys are widely used in aeronautical applications where the combination of high strength, fracture toughness, good fatigue crack propagation and corrosion resistance are required. The chemical composition is shown in Table 1. The material bars from which the specimens were produced had following the dimensions in mm: 4000 × 1000 × 250. According to the material manufacturer, the ultimate tensile stress and yield stress are σUTS = 490 MPa and σYS = 414 MPa, respectively.
To study the surface shot peening effect on crack propagation, two CT specimen batches were prepared: one with shot peening (SP) and another without shot peening but with the lateral surfaces mechanically polished (MP).
MP specimens were polished to ensure a good visualization of crack propagation. Manual grinding was done with a LaboPol-5—Struers A/S, DK-2750, machine passing progressively the grinding papers 240, 320, 600, 1000 and 2500. After specimen grinding, diamond paste of 3 µm and 1 µm were used to give the specimens a mirrored surface aspect.
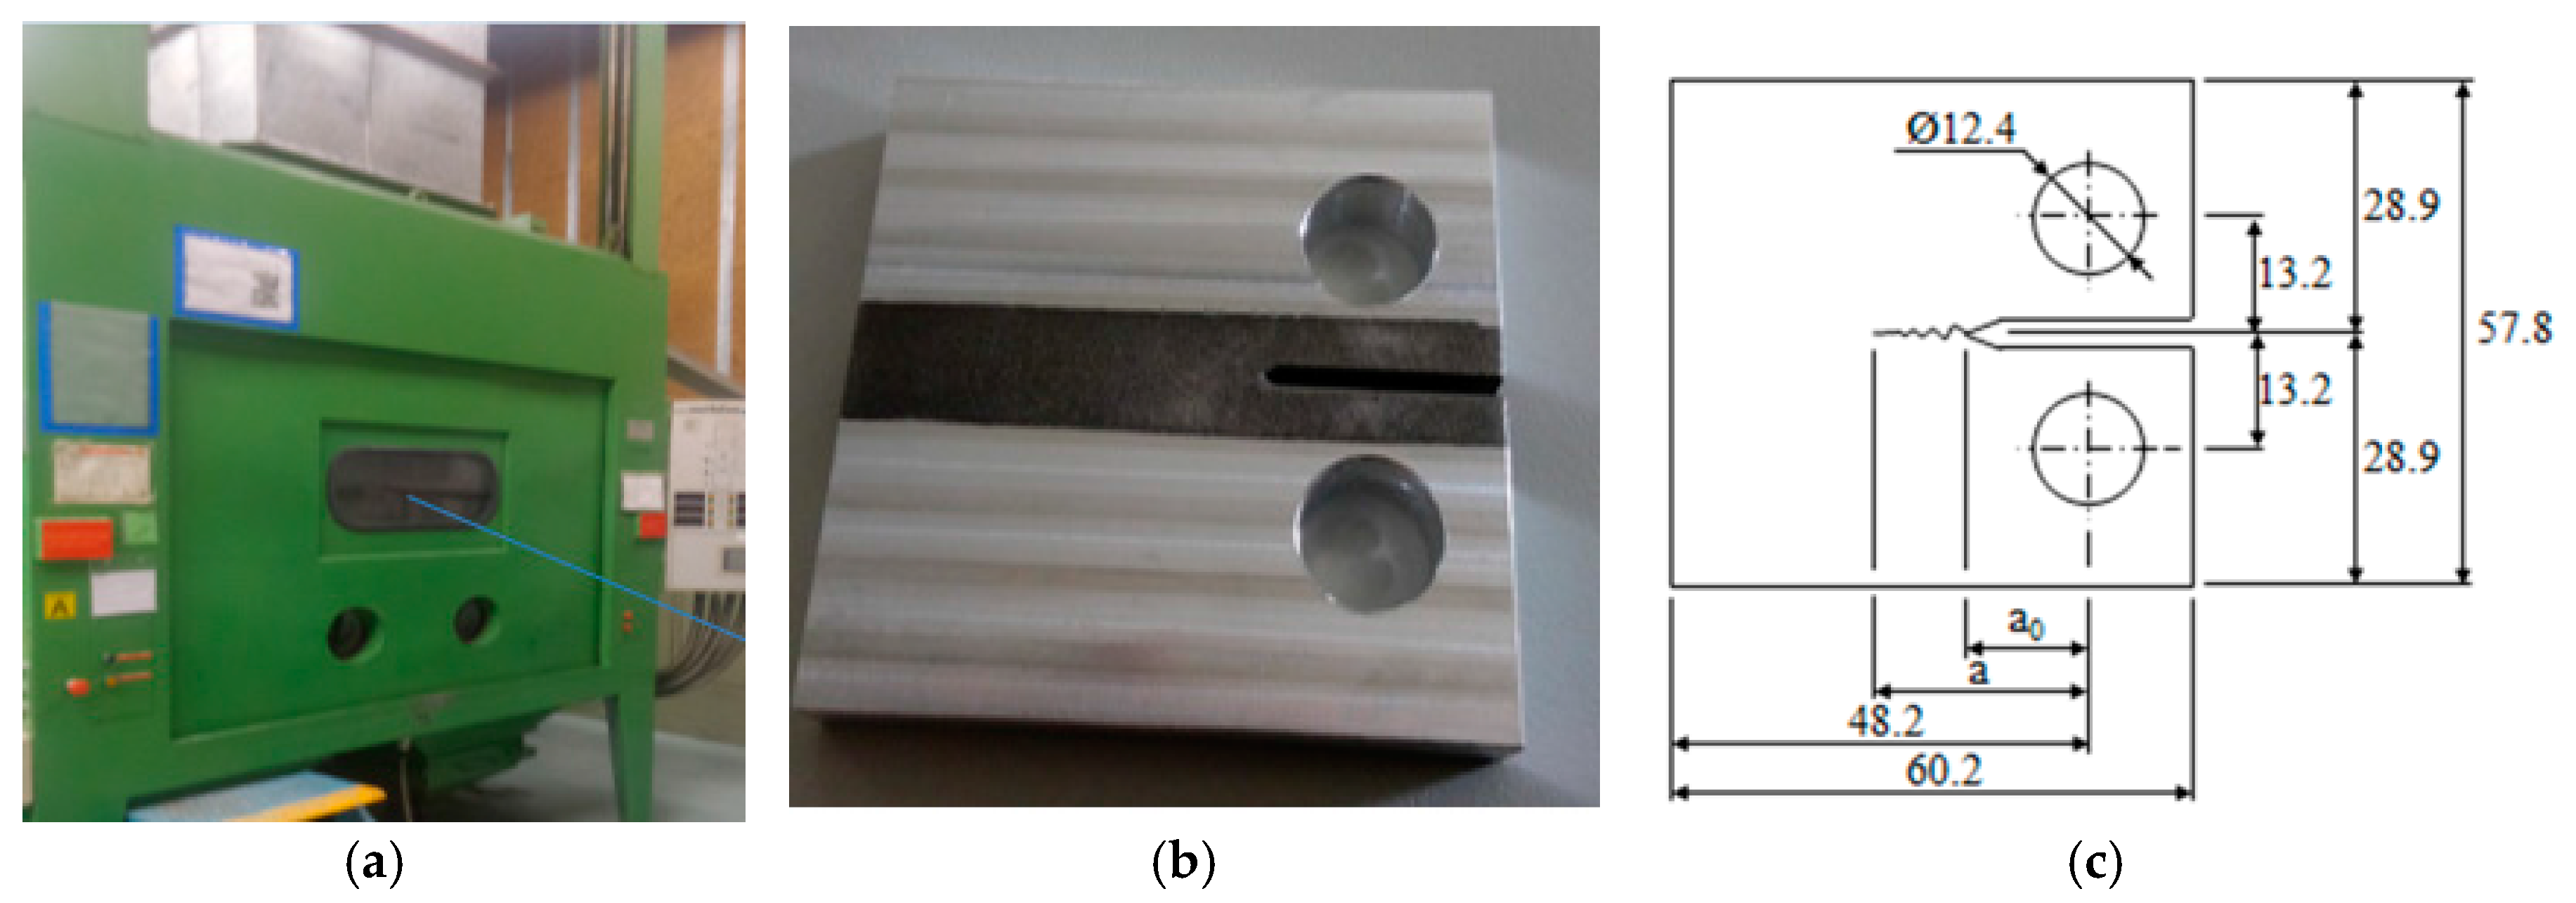
Shot peening was done at OGMA Indústria Aeronáutica de Portugal S.A. Company (Alverca do Ribatejo, Portugal) with a large experience in producing components and aeronautics repair. Both sides of the specimen were subjected to a manual shot peening process, using a SURFATEC machine, asshown in Figure 1a, and an Almen strip type A, according to SAE J443 standard [26]. Coverage assessment was done by the surface visual inspection, using a 10× magnifying lens. One hundred-percent coverage was achieved when this analysis showed a completely attained surface by particles. The beads used in current study were of the type S170 with 0.43 mm diameter and Almen type A with intensity 0.20 A (mm), according SAE AMS2430 standard [27] for aluminum alloys. Figure 1b shows one sample after the shot-peening process.
The studies of fatigue crack propagation were performed using the standard Compact Tension (CT) specimen with the geometry shown in Figure 1c, according with ASTM E647 standard [28]. For each batch of specimens, two different thickness (B) were manufactured: 4 mm and 8 mm. The specimens were machined in the longitudinal transverse (LT) direction from laminated plates. The loading specimen’s direction coincides with bars lamination direction (Figure 1b,c). For each test condition, three specimens were used.
The surface roughness was evaluated according to DIN EN ISO 4288 standard [29] using a Surftest SJ-500 Mitutoyo, surface roughness measuring system. The evaluated parameters for each superficial treatment were: roughness average Ra, root mean square (RMS) roughness Rq and mean roughness depth Rz. Table 2 summarizes the roughness parameters showing an increasing of more than 300% in the three roughness parameters for the peened surfaces.
To analyze the material microstructure, some samples of the specimens were selected to observe their cross section. The specimen’s surface was gradually polished with several silicon carbide papers. The papers’ granulometry ranged from high to low. Afterwards, 1 μm diameter diamond particles were used until specimen’s surface became mirror-like. Surfaces were then etched with Keller reagent (2.5% HNO3, 1.5% HCl, 1% HF, and 95% H2O (volume) (Coventry, UK)) and taken micrographs using an optical microscope Leica DM 4000 M LED (Wetzlar, Alemanha). Figure 2 shows typical micrographs indicating that base material microstructure (Figure 2a) with elongated grains in the rolling direction. The plane selected to take micrograph was normal to the loading direction to demonstrate the shot-peening effect. Around the shot peened surface (Figure 2b), an increasing of grain deformation and roughness was observed.
Surface Vickers hardness tests were performed according to ASTM C1327-15 [30] using a Struers Duramin micro-hardness tester with 0.5 N load for 15 s. Micro-hardness measurements were done in the cross-section of the sample at 0.3 mm from the surface, and spaced out 0.5 mm, for both specimen types, MP and SP. The average values obtained from twenty measurements were: HV0.05 = 157 for MP surfaces and HV0.05 = 167 for SP surfaces. Therefore, shot peening surface hardness increased is more than 6%.
Residual stresses were measured, in-depth and on the longitudinal surface. Residual stresses analysis was performed by X-ray diffraction using a Proto iXRD equipment. Lattice deformations of the {222} diffraction planes were measured using Cr-Kα X-ray radiation, with 22° ψ angles, in the range ±42°, an acquisition time of 30 s by peak and ±2° oscillations in ψ. For the analyzed material, and considering the radiation used, the average penetration depth of the X-rays was about 11 μm. Measurements were made for all studied treatments at four points along the surface of one specimen: one point for each longitudinal surface and one point for each notch surface in the central position. The analysis of the in-depth evolution of the residual stresses in the longitudinal surface was performed by X-Ray diffraction after successive layer removal by electro polishing.
2.2. Fatigue Tests
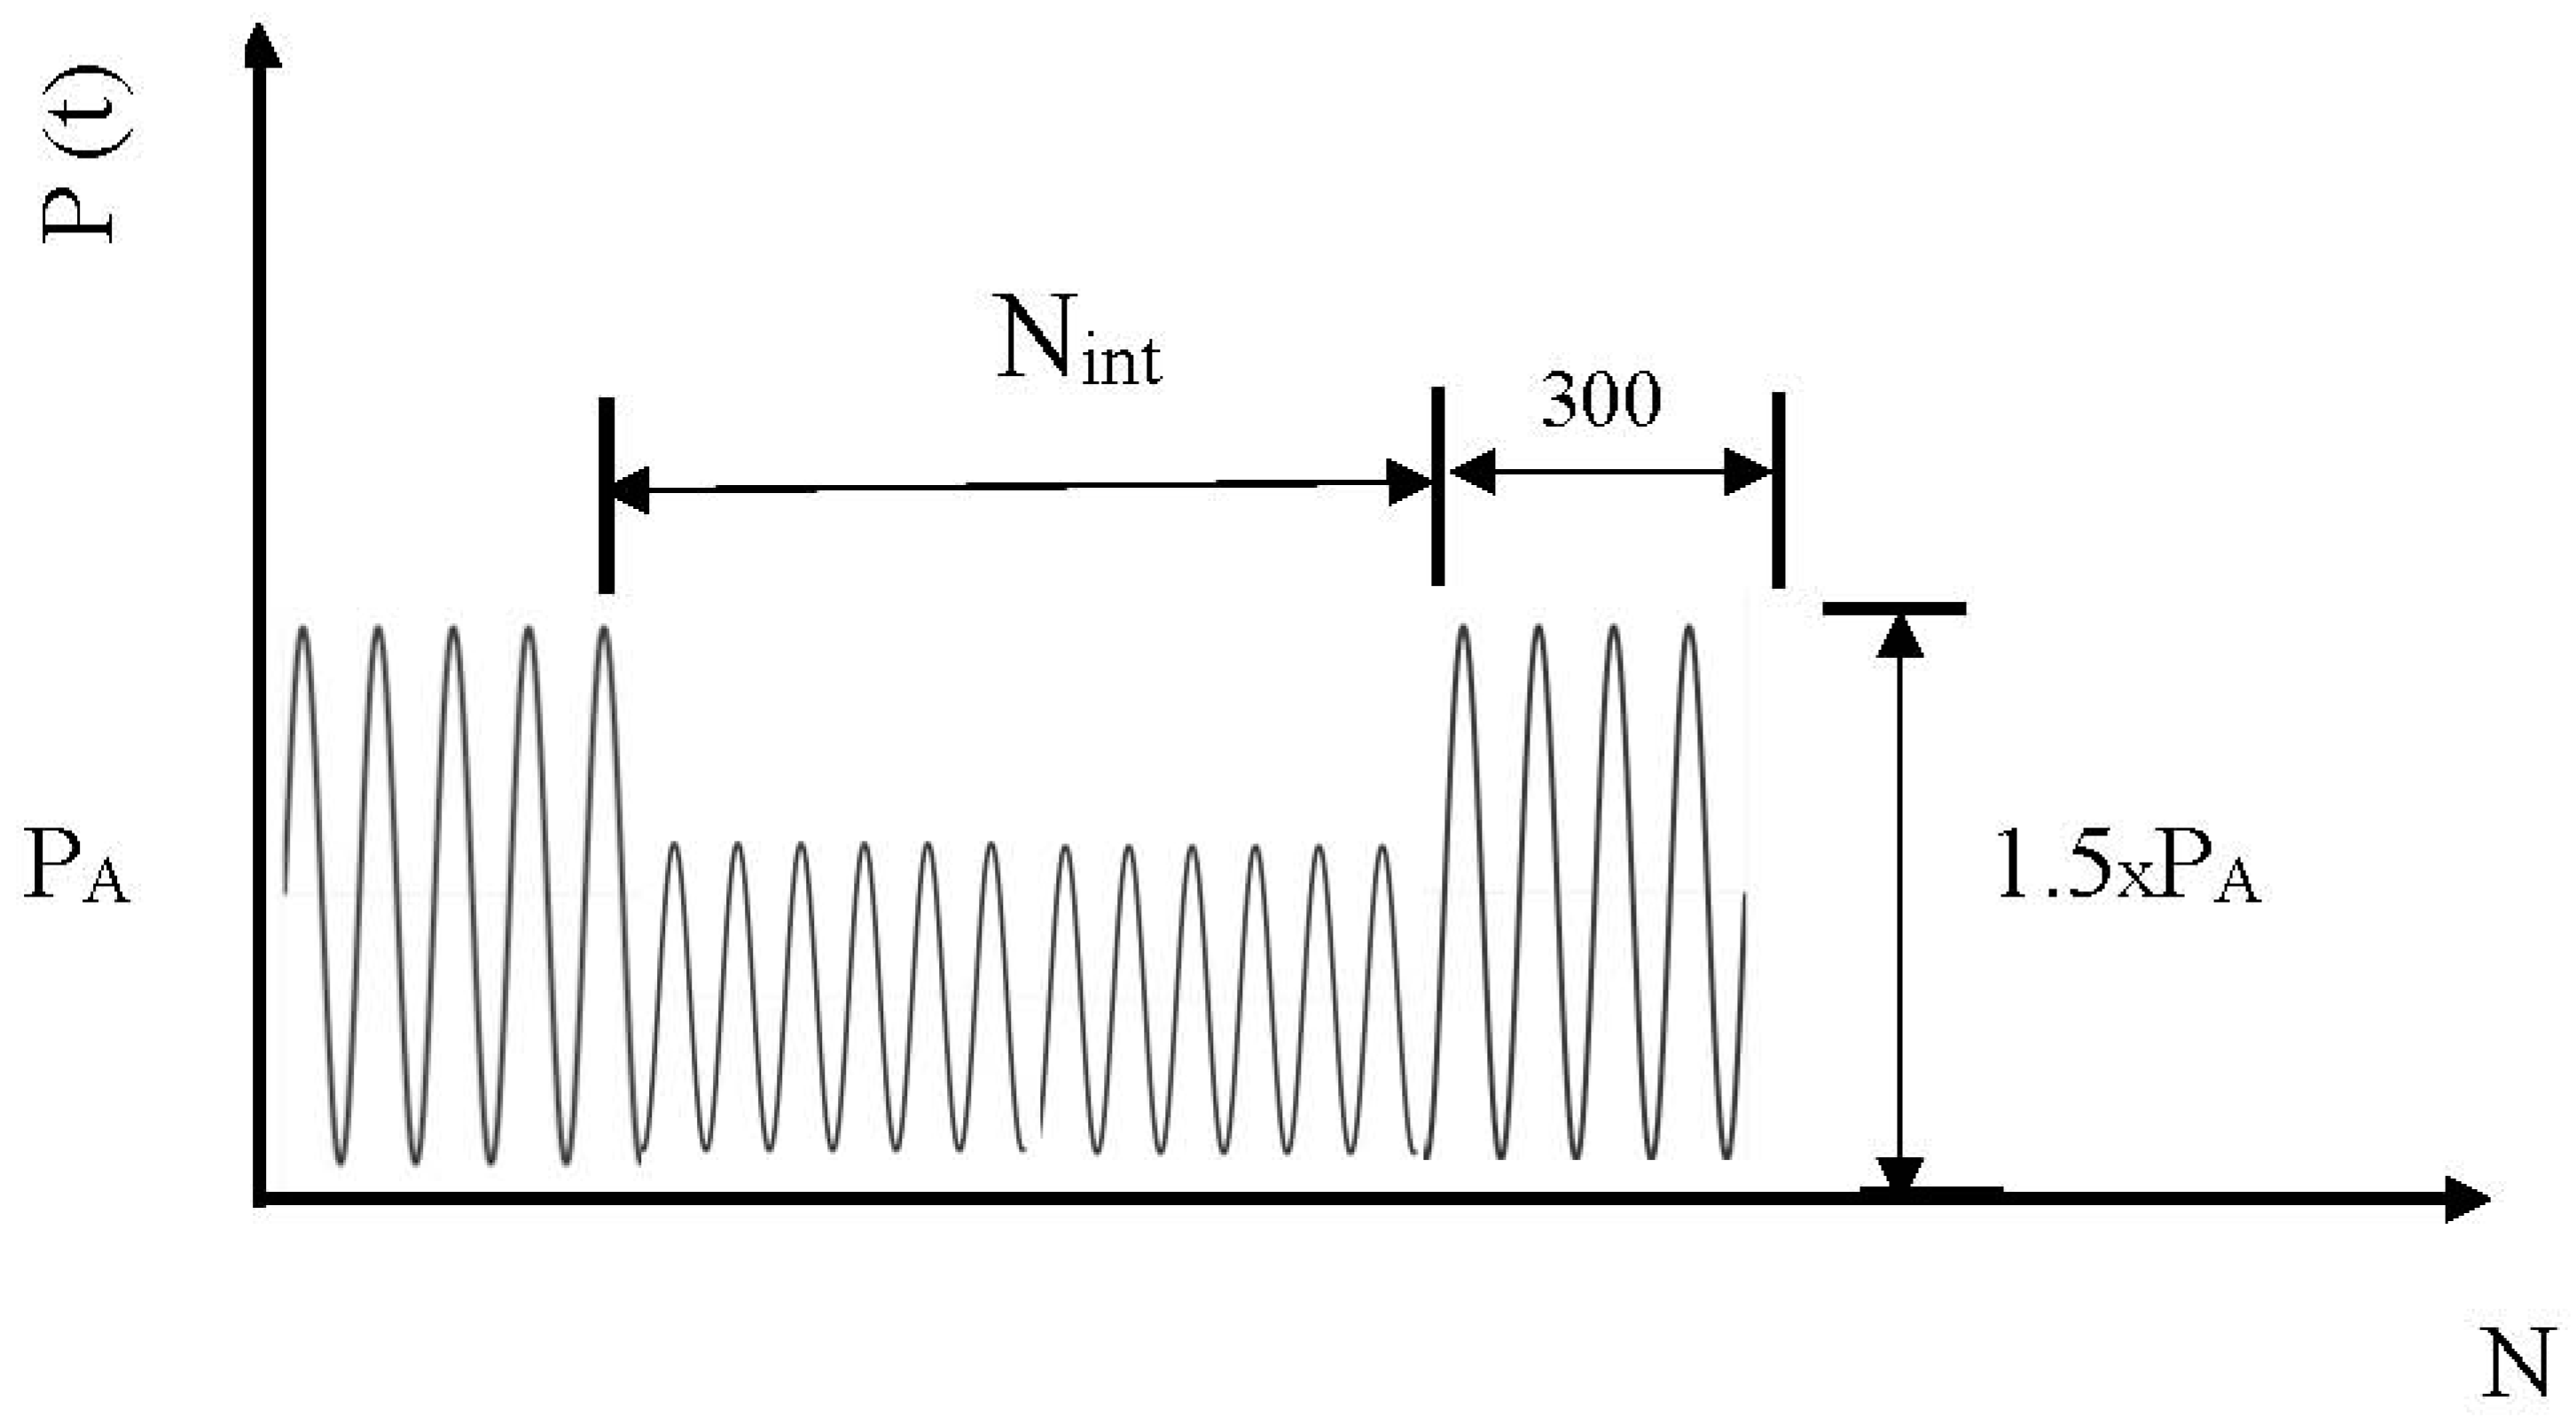
Fatigue crack propagation tests were carried out, in agreement with ASTM E647 standard [28], using 4 and 8 mm thick compact specimens (CT). The tests were performed under load control at room temperature using a 100 kN capacity servo-hydraulic Instron 1341, with a frequency within the range 15–20 Hz and stress ratios of R = 0.05 and 0.4. The specimen’s geometry and dimensions are shown in Figure 1c. For both specimens’ batches two types of tests were conducted: constant amplitude loading tests with the stress ratios R = 0.05 and 0.4 and variable amplitude loading tests in which periodic overload blocks of 300 cycles are applied with intervals of Nint cycles, as shown schematically in Figure 3. The main purpose of these tests is to obtain the a-N and da/dN curves as a function of the stress intensity factor range ΔK to analyze the effects of the shot peening, specimen thickness and stress ratio.
For the surface polished specimens, the surface crack length was measured using a travelling microscope (45×) with 10 µm accuracy. Crack growth rates under constant amplitude loading were determined by the incremental polynomial method using five consecutive points [28]. For the surface peened specimens, the crack length was obtained by using experimental calibration curves based on the compliance variation, previously obtained with the polished specimen’s tests, considering the compliance (C) definition and ratio of displacement to load increment (Equation (1)).
where u and P are the axial grip displacement and the load, respectively, which were monitored during the test. From the non-peened specimen tests with constant amplitude loading, it was monitored a set of data for C calculation and the correspondent values of the crack length. The collected data are plotted in Figure 4, in terms of the crack length (a in mm) versus the compliance, and fitted by Equations (2) and (3) for specimens with 8 mm and 4 mm thickness, respectively, both with a 0.99 correlation factor. Equations (2) and (3) were afterwards used for the evaluation of the crack length in the tests with peened specimens and in the periodical overloading block tests.
3. Results and Discussion
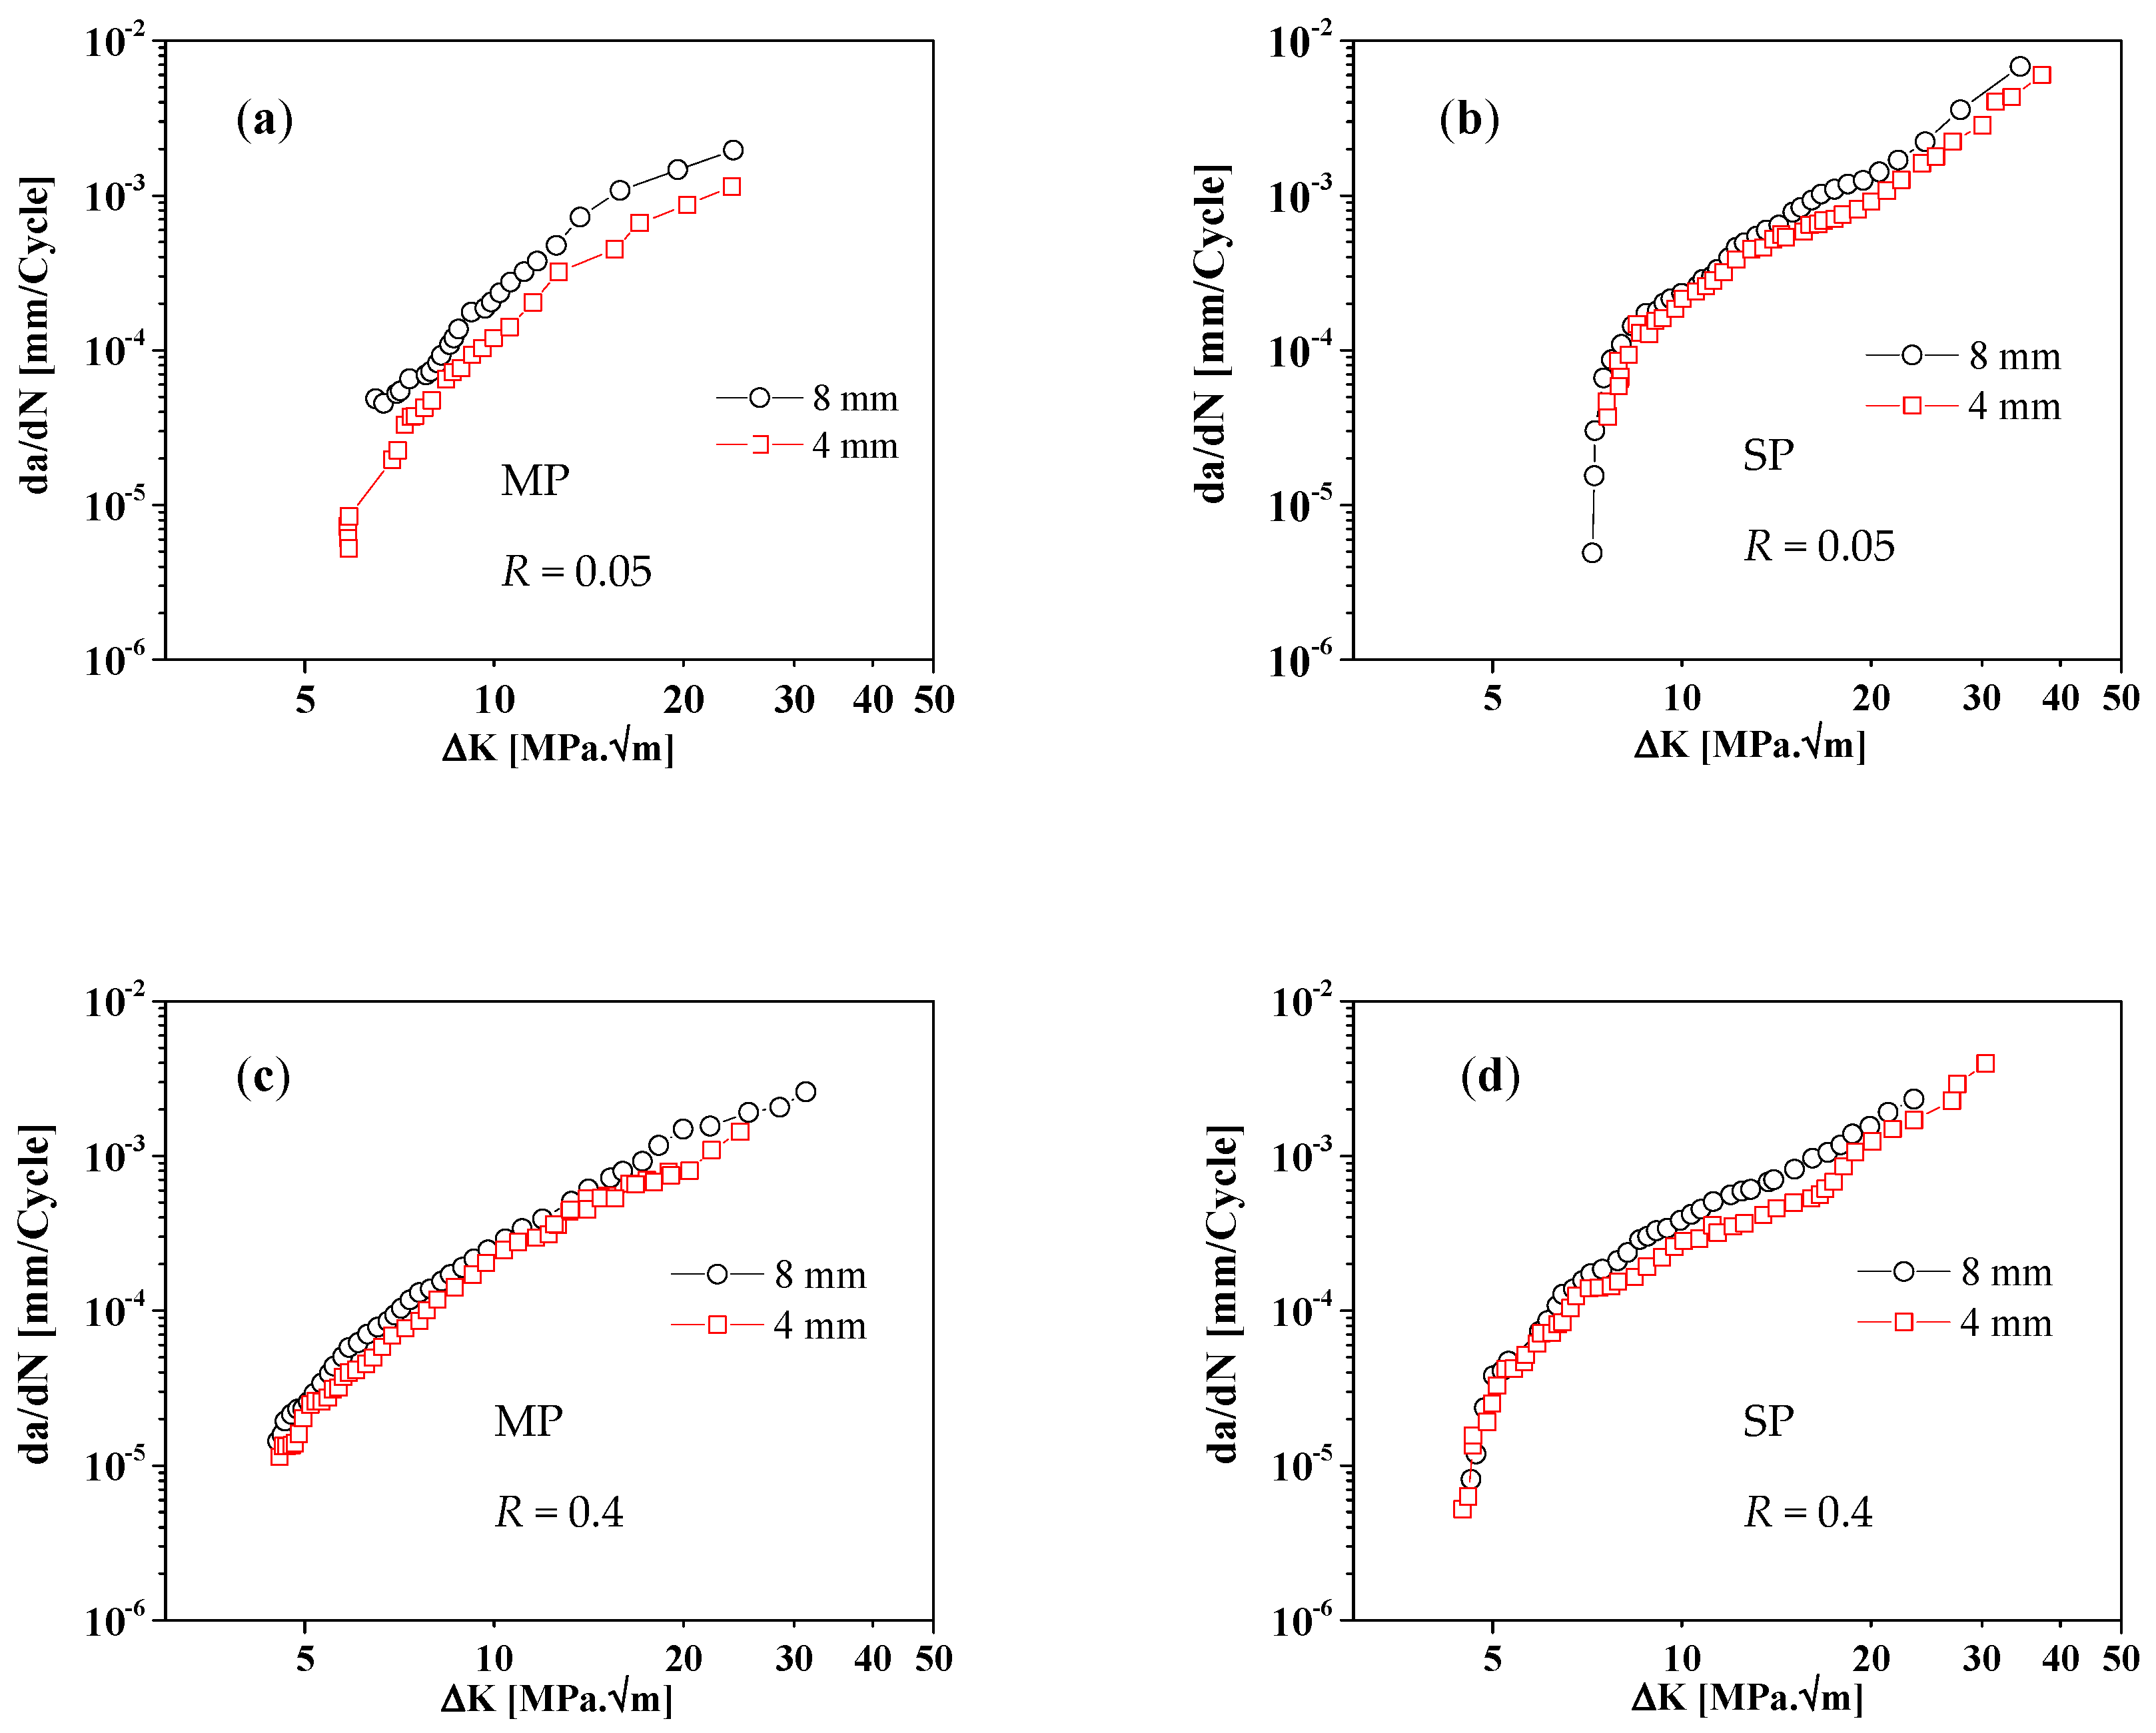
Figure 5 and Figure 6 highlight the effects of the specimen’s thickness and surface peening on the crack propagation curves, respectively. Figure 5a–d shows the influence of the thickness on the da/dN-∆K curves. It is well known [31] that the thickness influence on the fatigue crack propagation is related both to the microstructure and stress state. In the present study, specimens were machined from the same thickness bars, so there is no microstructure change between 4 and 8 mm thickness specimens. Therefore, the effect of thickness is only caused by changes in stress distribution along cross section and consequent variation on crack closure level [31]. The analysis of Figure 5 shows a reduced thickness effect on da/dN for both surface treatments (MP and SP specimens), including in the near-threshold region. The higher thickness specimens have higher da/dN for the same ∆K values in all conditions analyzed in Figure 5. It is also possible to notice that, for R = 0.05, the increase in da/dN is higher with increasing ∆K. Specimen’s thickness effect is more noticeable for lower R-values and MP samples. As expected, independently of the surface treatment, the thicker specimens have higher crack growth rates over all the ∆K range analyzed.
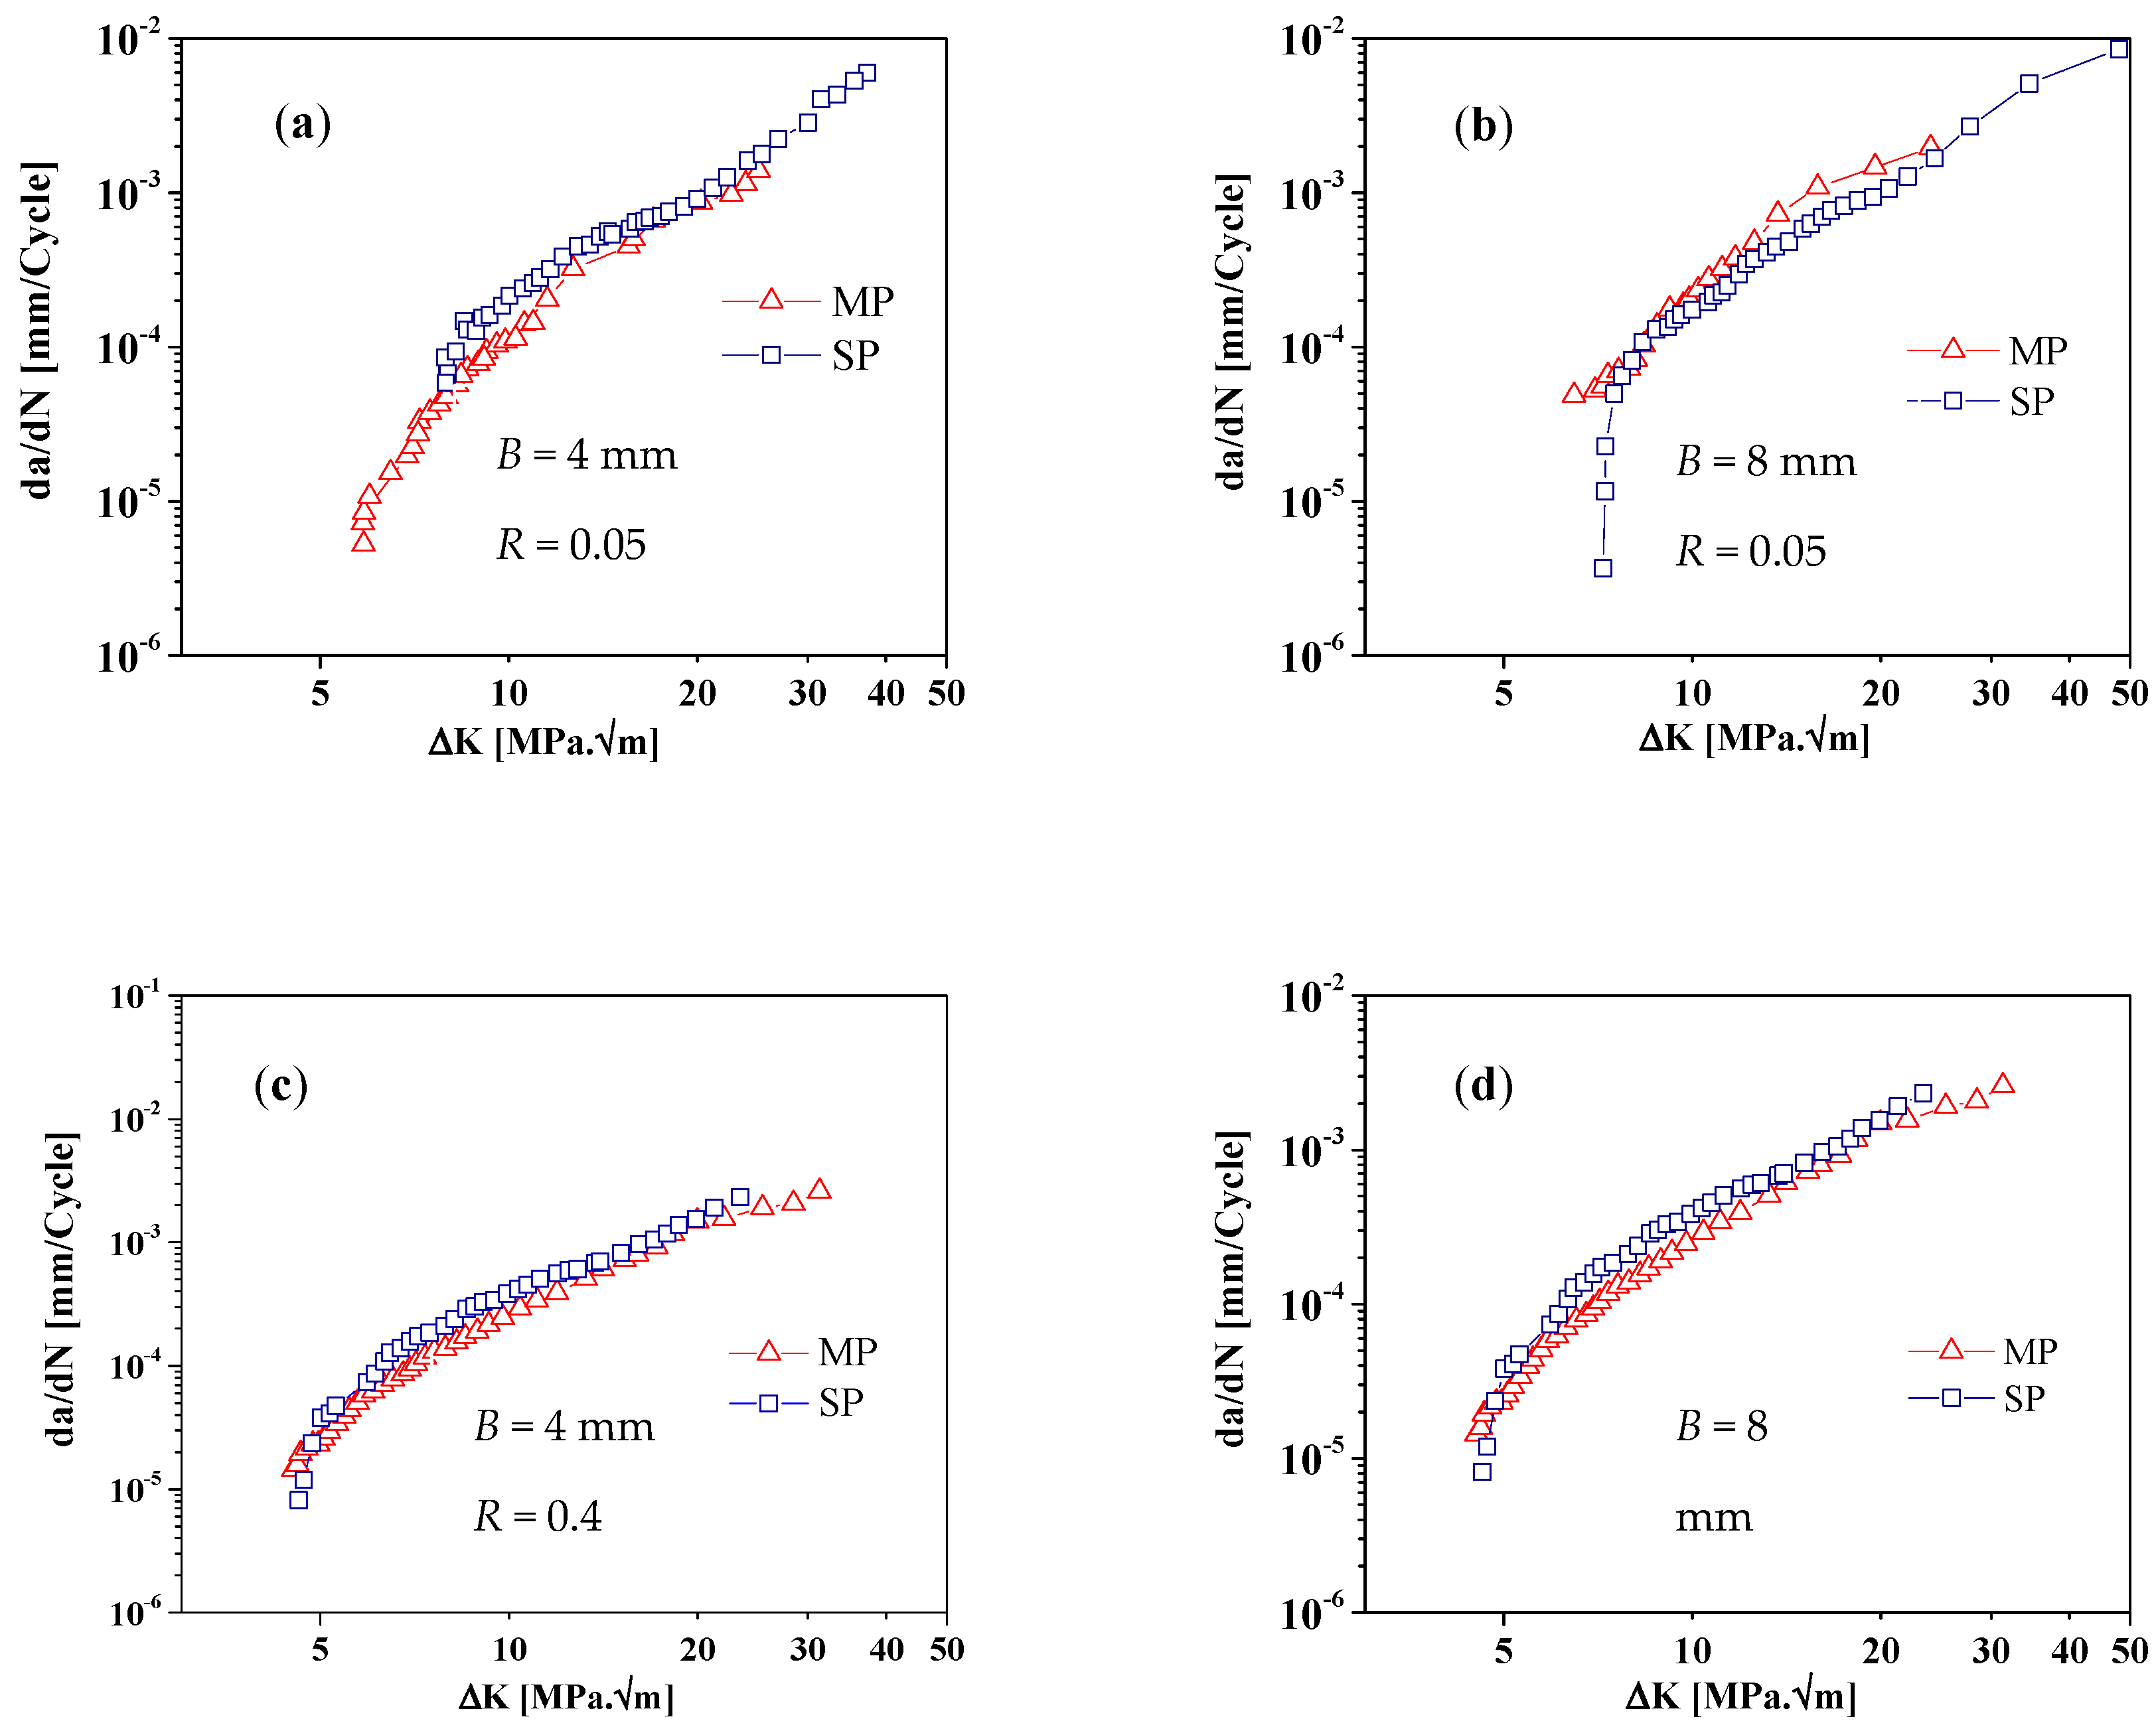
The main purpose of current work was the analysis of the surface peening effect on the crack propagation. Figure 6a–d shows the influence of the shot peening on the da/dN-∆K curves for both thicknesses and stress ratios. Taking into account that shot peening has a very localized effect near the surface, which results in the introduction of compressive residual stresses, the propagation of cracks will be affected only in these areas. To analyze the retardation of crack propagation around the surface, the fractured specimens were observed by optical microscopy.
Figure 7a,b presents exemplary photos showing the marks of crack growth shape for machined and shot peening specimens, with 8 mm thickness, respectively. These marks were produced during variable amplitude loading with periodic overload blocks tests. Although the specimen’s thickness is small to ensure tri-axial plain strain conditions in the center of the sample, the crack path presents a significant tunnel effect, as shown in Figure 7a,b, and also according to Zhou et al. [9]. The visual observation of the images does not show a clear evidence of the shot peening effect on the crack path. For a detailed analysis, a tunnel effect parameter was defined by the Equation (4):
where a1 and a3 are the crack lengths at the specimen’s surfaces, a2 is the current crack length at the center and a0 is the initial crack length. The tunnel effect is a well-studied manifestation in fatigue crack propagation. Specimens stress state affect fatigue crack propagation, thus propagation rate is distinct at the crack flanks front relatively to specimens’ central points. The effect of stress state is usually explained by crack closure mechanisms. Typically, a plane stress state occurs at the surface that promotes crack tip plastic deformation and accordingly plasticity induces crack closure [32]. In turn, inside the specimen, there is a tri-axial stress state which prevents plastic deformation. As fracture surface roughness may be different, promoting roughness induces crack closure, especially for low values of ΔK [33]. This stress state effect on fatigue crack propagation slows down crack growth at the surface and hence promotes the tunnel effect. Several different parameters are used to understand to what extend tunnel affects the specimens’ behavior. The simplest and most common parameter is d/B (Figure 7c). Other used parameters are used and presented in the literature [34,35]. Note that the stable shape of the crack front has a uniform distribution of effective stress intensity factor range.
The tunnel effect parameter is plotted in Figure 7d against the fatigue crack length (a2–a0). As expected, shot peening increases the retardation of the surface crack propagation observed by a higher tunnel effect parameter for crack length lesser than 10 mm. As mentioned above, tunnel effect can be caused by residual stresses profiles.
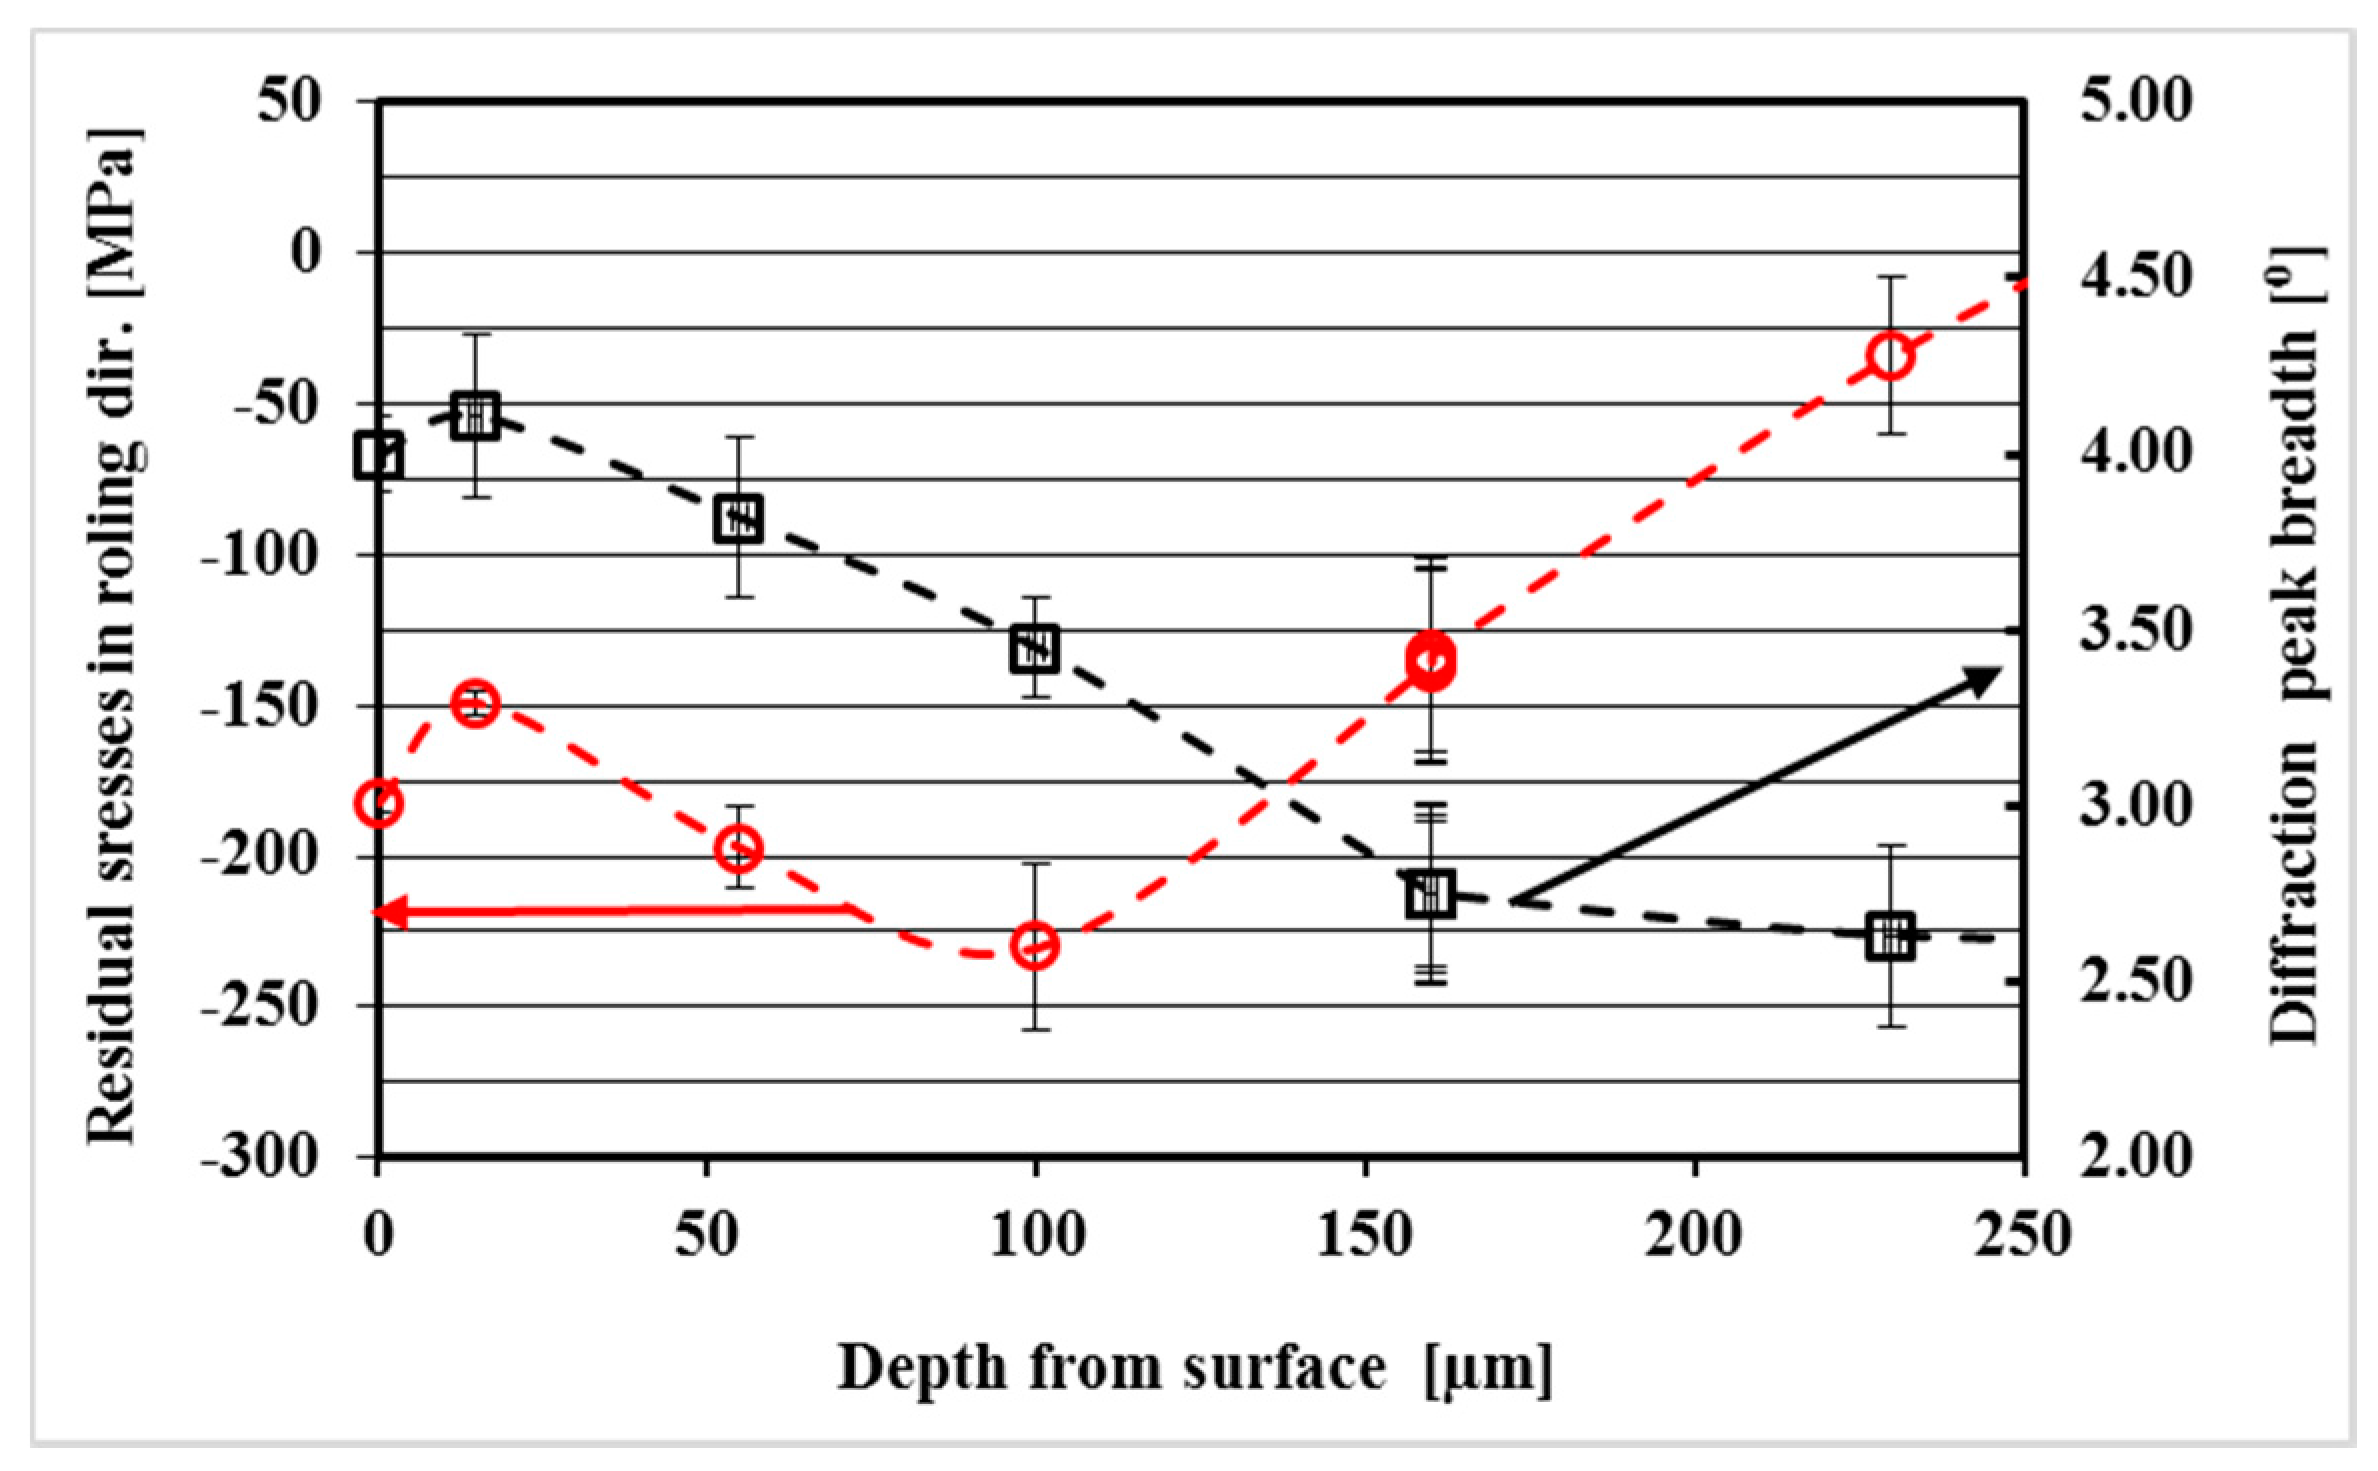
For MP specimens, average residual stress in load direction obtained from four measurements at the surface was about +290 MPa, while for SP samples compressive residual stresses occur around the surface. Figure 8 shows the profile of residual stresses and X-ray diffraction peak breadth against the depth from surface. According to the diffraction peak breadth profiles, the thickness layer affected by all surface treatments is circa 200 µm. The average value of the compressive residual stresses occurring trough a layer below the free surface with a 150 µm depth is about 200 MPa. Regarding the MP specimens, the residual stress measurements, for the same depth of the SP specimens presented an average value of 180 MPa. The reduced thickness of this layer, justifies the reduced influence on the overall propagation of fatigue cracks observed, in accordance to He et al. [36].
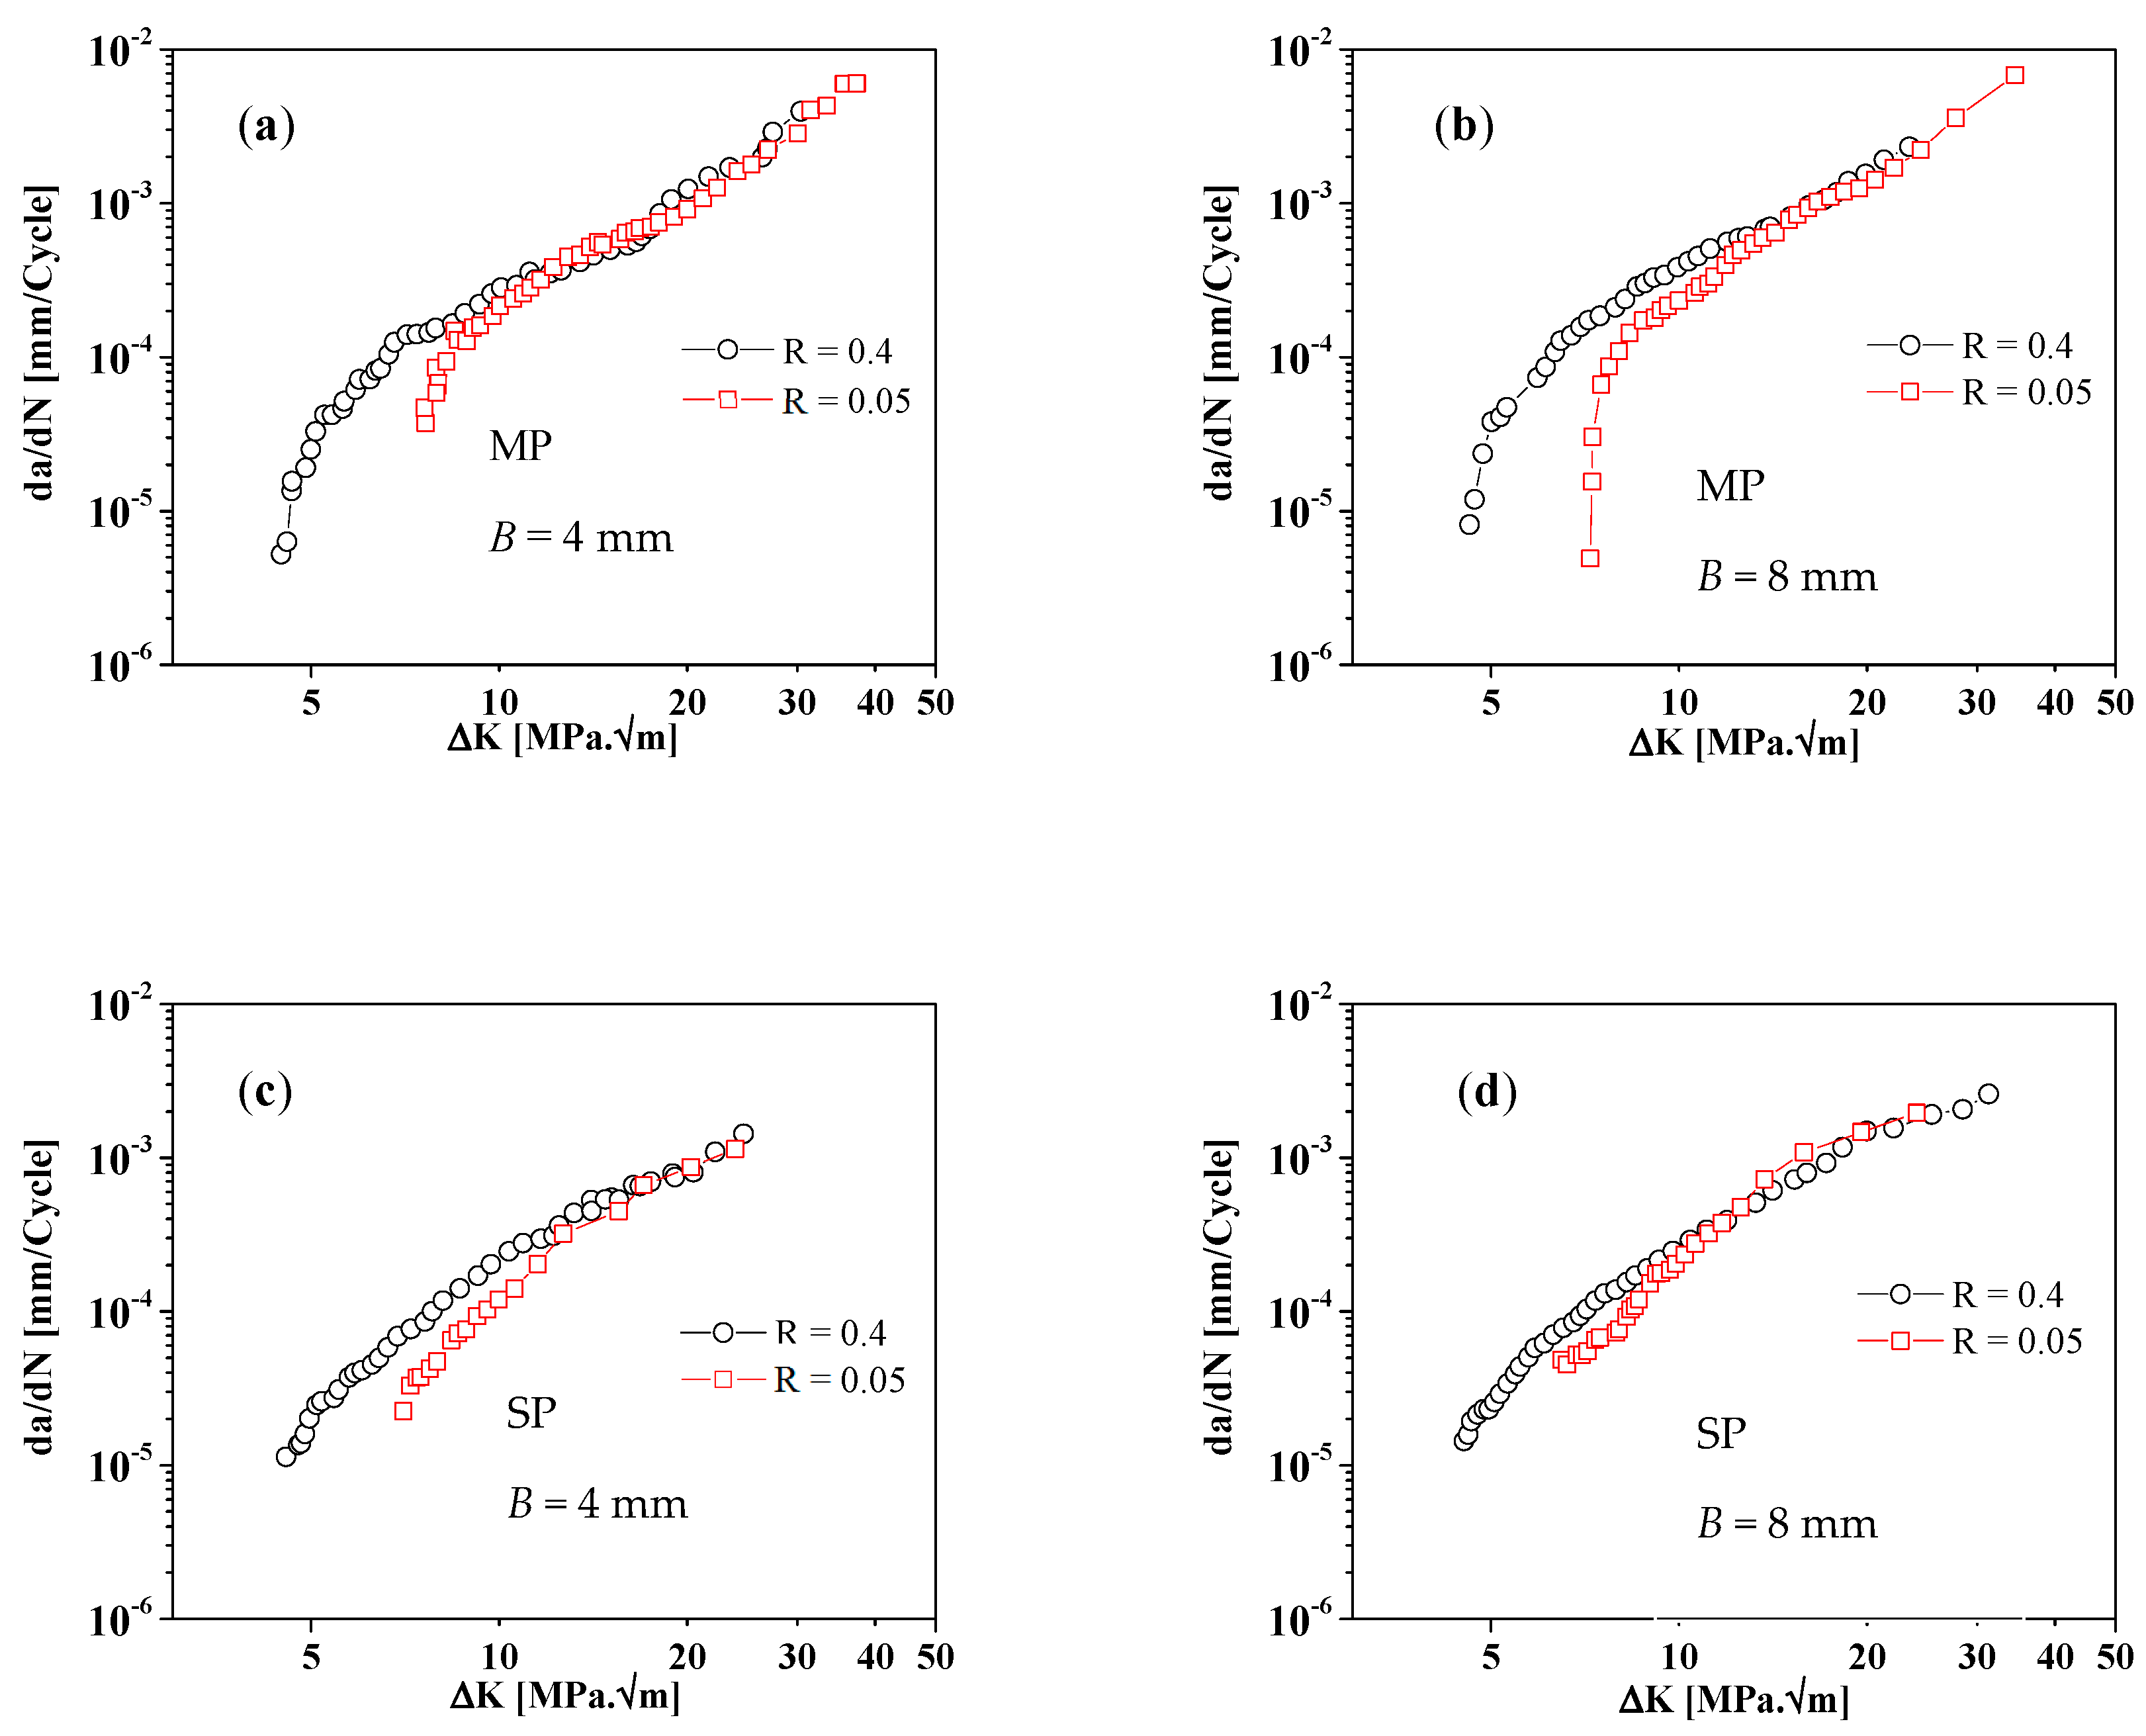
Results obtained for both stress ratios R = 0.05 and R = 0.4 are compared in Figure 9, for both surface treatments and thicknesses. As expected, a meaningful influence of the stress ratio was noticed in both Paris law regime and near-threshold condition. As reported in the literature, this effect is mainly consequence of the significant reduction on crack closure level for higher stress ratio R = 0.4 [31]. This is why above 15 MPa√m the R does not present any significate effect.
Fatigue crack propagation resulting in the stable regime were modeled by Paris law equation. Table 3 summarizes the values of the coefficients and intervals of validity of Paris’ law and the correlation coefficients for all test conditions.
To analyze the transient effects after overloads, variable amplitude loading with R = 0.04 were carried out, in which periodic overload blocks of 300 cycles were applied with intervals of Nint of 7500 and 15,000 cycles, as shown in Figure 3. The results obtained were compared with the reference constant amplitude loading tests. Figure 10a–d shows the collected results from the tests performed in specimens with 8 mm thick. The typical transient behavior after overloads is not detected in all blocks because of the reduced transient zone and the crack measuring method. The analysis of the figure shows that for MP specimens the fatigue crack growth rate reduction reaches the maximum value for Nint = 7500 cycles, while for the SP specimens the crack growth rate continues to decrease, although slightly, when Nint increases from 7500 to 15,000 cycles. For MP specimens, fatigue crack growth decreases more for 7500 cycles because induced plasticity of crack closure retardation is more critical (Figure 10d). This behavior cannot be confirmed when crack closure is not measured. For the SP specimens with R = 0, the behavior is similar. This effect is more noticeable for Nint = 7500 cycles then for 15,000 cycles.
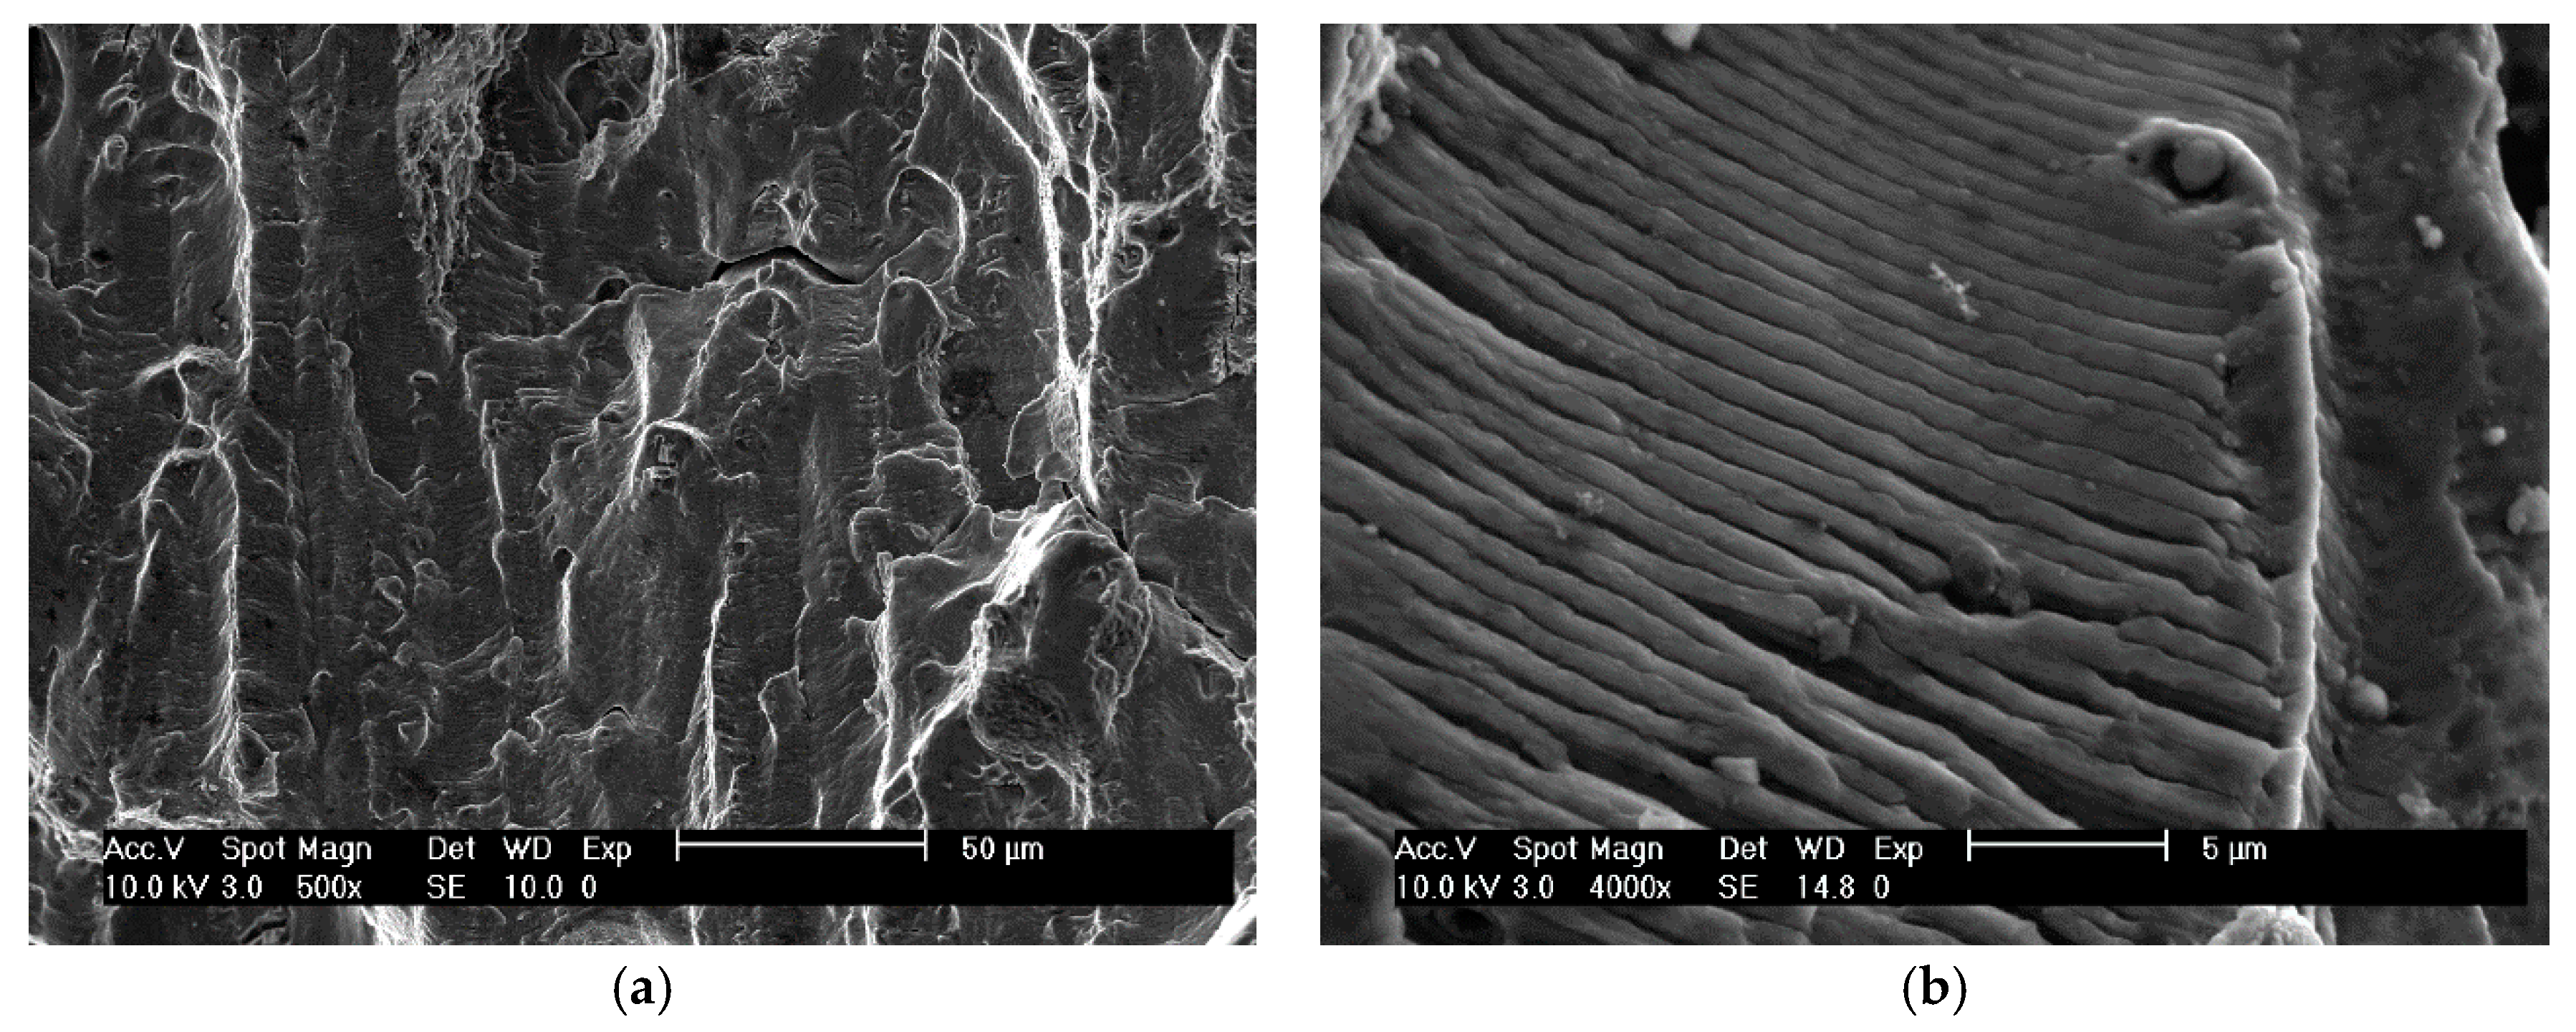
To understand better the fatigue mechanisms processes, fracture surfaces of the samples were observed in a Philips XL30 scanning electron microscope. Figure 11 shows two exemplary photos with different magnification of the crack propagated region in Paris’ law regime, representative of various observations done during the study. Both images in Figure 11 show that fatigue crack propagation occurs mainly by striation.
4. Conclusions
The present work studied the effects of the shot peening and the stress ratio on the fatigue crack propagation of the 7475 aluminum alloy with a T7351 heat treatment, using two specimens’ thickness: 4 and 8 mm. The analysis of the results draws the following conclusions:
- -
- As a result of its small influence depth, the beneficial effect of shot peening on da/dN-ΔK curves is negligible, particularly for R = 0.4. However, this effect seems to increase near the threshold condition.
- -
- For both mechanically polished and shot-peened samples, a specimen’s thickness has only marginal influence on the stable crack propagation regime.
- -
- A significant effect of the mean stress was observed, particularly in near- threshold region.
- -
- Periodic overload blocks promote a reduction of the fatigue crack growth rate. For MP specimens, the reduction reaches the maximum value for the interval between blocks of 7500 cycles, while, for SP specimens, the crack growth rate continues to decrease for intervals of 15,000 cycles.
Acknowledgments
This research is sponsored by FEDER funds through the program COMPETE—Programa Operacional Factores de Competitividade—and by national funds through FCT—Fundação para a Ciência e a Tecnologia—under the project PEst-C/EME/UI0285/2013. The authors would also like to acknowledge OGMA-Indústria Aeronáutica de Portugal, Alverca, Portugal, and Dra Ana Guimarães and Eng. João Miranda for the collaboration in the shot-peening processing.
Author Contributions
José A. M. Ferreira. and José D. M. Costa conceived and designed the experiments; Pedro V. Antunes, Natália Ferreira, and Carlos Capela performed the experiments; Pedro V. Antunes and Carlos Capela analyzed the data; Carlos Capela contributed with the machining of test specimens; Pedro V. Antunes, José A. M. Ferreira, and José D. M. Costa wrote the paper.
Conflicts of Interest
The authors declare no conflict of interest.
References
- Fathallah, R.; Laamouri, A.; Sidhom, H.; Braham, C. High cycle fatigue behavior prediction of shot-peened parts. Int. J. Fatigue 2004, 26, 1053–1067. [Google Scholar] [CrossRef]
- Miková, K.; Bagherifard, S.; Bokůvka, O.; Guagliano, M.; Trško, L. Fatigue behavior of X70 microalloyed steel after severe shot peening. Int. J. Fatigue 2013, 55, 33–42. [Google Scholar] [CrossRef]
- Bagherifard, S.; Guagliano, M. Fatigue behavior of a low alloy steel with nanostructured surface obtained by severe shot peening. Eng. Fract. Mech. 2012, 81, 56–68. [Google Scholar] [CrossRef]
- Zhang, P.; Lindemann, J.; Leyens, L. Shot peening on the high-strength magnesium alloy AZ80—effect of peening media. J. Mater. Process. Technol. 2010, 210, 445–450. [Google Scholar] [CrossRef]
- Petit, J.; Mendez, J. Some aspects of the influence of microstructure on fatigue resistance. In Fatigue 96, Proceedings of the Sixth International Fatigue Congress, Berlin, Germany, 6–10 May 1996; Lutjering, G., Nowack, H., Eds.; Pergamon: Oxford, UK, 1996; Volume I, pp. 15–26. [Google Scholar]
- Bergner, F.; Zouhar, G. A new approach to the correlation between the coefficient and the exponent in the power law equation of fatigue crack growth. Int. J. Fatigue 2000, 22, 229–239. [Google Scholar] [CrossRef]
- Bergner, F.; Zouhar, G.; Tempus, G. The material-dependent variability of fatigue crack growth rates of aluminium alloys in the Paris regime. Int. J. Fatigue 2001, 23, 383–394. [Google Scholar] [CrossRef]
- Sunder, R.; Dash, P.K. Measurement of fatigue crack closure through electron microscopy. Int. J. Fatigue 1982, 4, 97–105. [Google Scholar] [CrossRef]
- Zhou, J.Z.; Huang, S.; Sheng, J.; Lu, J.Z.; Wang, C.D.; Chen, K.M.; Ruan, H.Y.; Chen, H.S. Effect of repeated impacts on mechanical properties and fatigue fracture morphologies of 6061-T6 aluminium subject to laser peening. Mater. Sci. Eng. A 2012, 539, 360–368. [Google Scholar] [CrossRef]
- Pant, B.K.; Pavan, A.H.V.; Prakash, R.V.; Kamaraj, M. Effect of laser peening and shot peening on fatigue striations during FCGR study of Ti6Al4V. Int. J. Fatigue 2016, 93, 38–50. [Google Scholar] [CrossRef]
- Vecchio, R.S.; Hertzberg, R.W.; Jaccard, R. On the overload induced fatigue crack propagation behavior in aluminium and steel alloys. Fatigue Fract. Eng. Mater. Struct. 1984, 7, 181–194. [Google Scholar] [CrossRef]
- Ward-Close, C.M.; Blom, A.F.; Richie, R.O. Mechanisms associated with transient fatigue crack growth under variable amplitude loading: An experimental and numerical study. Eng. Fract. Mech. 1989, 32, 613–638. [Google Scholar] [CrossRef]
- Krumar, R.; Garg, S.B.L. Effect of yield strength and single overload cycles on effective stress intensity range ratio in 6061-T6 Alalloy. Eng. Fract. Mech. 1989, 34, 403–412. [Google Scholar] [CrossRef]
- Ling, M.R.; Schijve, J. The effect of intermediate heat treatments on overload induced retardations during fatigue crack growth in an Al-alloy. Fatigue Fract. Eng. Mater. Struct. 1992, 15, 421–430. [Google Scholar] [CrossRef]
- Damri, D.; Knott, J.F. Fracture modes encountered following the application of a major tensile overload cycle. Int. J. Fatigue 1993, 15, 53–60. [Google Scholar] [CrossRef]
- Shuter, D.M.; Geary, W. Some aspects of fatigue crack growth retardation behaviour following tensile overloads in a structural steel. Fatigue Fract. Eng. Mater. Struct. 1996, 19, 185–199. [Google Scholar] [CrossRef]
- Robin, C.; Louah, M.; Pluvinage, G. Influence of the overload on the fatigue crack growth in steels. Fatigue Fract. Eng. Mater. Struct. 1983, 6, 1–13. [Google Scholar] [CrossRef]
- Shercliff, H.R.; Fleck, N.A. Effect of specimen geometry on fatigue crack growth in plane strain—II. Overload response. Fatigue Fract. Eng. Mater. Struct. 1990, 13, 297–310. [Google Scholar] [CrossRef]
- Shin, C.S.; Hsu, S.H. On the mechanisms and behaviour of overload retardation in AISI 304 stainless steel. Int. J. Fatigue 1993, 15, 181–192. [Google Scholar] [CrossRef]
- Dexter, R.J.; Hudak, S.J.; Davidson, D.L. Modelling and measurement of crack closure and crack growth following overloads and underloads. Eng. Fract. Mech. 1989, 33, 855–870. [Google Scholar] [CrossRef]
- Tsukuda, H.; Ogiyama, H.; Shiraishi, T. Transient fatigue crack growth behaviour following single overloads at high stress ratios. Fatigue Fract. Eng. Mater. Struct. 1996, 19, 879–891. [Google Scholar] [CrossRef]
- Borrego, L.P.; Ferreira, J.M.; Pinho da Cruz, J.M.; Costa, J.M. Evaluation of overload effects on fatigue crack growth and closure. Eng. Fract. Mech. 2003, 70, 1379–1397. [Google Scholar] [CrossRef]
- Donald, K.; Paris, P.C. An evaluation of DKeff estimation procedures on 6061-T6 and 2024-T3 aluminium alloys. Int. J. Fatigue 1999, 21, S47–S57. [Google Scholar] [CrossRef]
- Paris, P.C.; Tada, H.; Donald, J.K. Service load fatigue damage––A historical perspective. Int. J. Fatigue 1999, 21, S35–S46. [Google Scholar] [CrossRef]
- Borrego, L.P.; Ferreira, J.M.; Costa, J.M. Fatigue crack growth and crack closure in an AlMgSi alloy. Fatigue Fract. Eng. Mater. Struct. 2001, 24, 255–265. [Google Scholar] [CrossRef]
- The American Standard SAE J443. Procedures for Using Standard Shot Peening Test Strip; American Standard: Piscataway Township, NJ, USA, 1968. [Google Scholar]
- The American Standard. Aerospace Materials Division; SAE, Shot Peening, SAE AMS 2430; American Standard: Piscataway Township, NJ, USA, 2009. [Google Scholar]
- American Society for Testing and Materials. Standard Test Method for Microhardness of Materials. In Annual Book of ASTM Standards; ASTM: West Conshohocken, PA, USA, 2000; Volume 03.01, p. E647. [Google Scholar]
- International Organization for Standardization. DIN EN ISO 4288: Geometrical Product Specifications (GPS). Surface Texture: Profile Method: Rules and Procedures for the Assessment of Surface Texture; ISO: Geneva, Switzerland, 1996. [Google Scholar]
- American Society for Testing and Materials. Standard Test Method for Vickers Indentation Hardness of Advanced Ceramics; ASTM: West Conshohocken, PA, USA, 2015; p. C1327. [Google Scholar]
- Borrego, L.P.; Costa, J.D.M.; Silva, S.; Ferreira, J.M. Microstructure dependent fatigue crack growth in aged hardened aluminium alloys. Int. J. Fatigue 2004, 26, 1321–1331. [Google Scholar] [CrossRef]
- Antunes, F.V.; Chegini, A.G.; Branco, R.; Camas, D. A numerical study of plasticity induced crack closure under plane strain conditions. Int. J. Fatigue 2015, 71, 75–86. [Google Scholar] [CrossRef]
- Antunes, F.V.; Ramalho, A.L.; Ferreira, J.A.M. Identification of Fatigue Crack Propagation Modes with Roughness Measurements. Int. J. Fatigue 2000, 22, 781–788. [Google Scholar] [CrossRef]
- Lin, X.B.; Smith, R.A. Fatigue shape analysis for corner cracks at fastener holes. Eng. Fract. Mech. 1998, 59, 73–87. [Google Scholar] [CrossRef]
- Branco, R. Numerical Study of Fatigue Crack Growth in MT Specimens. Master’s Thesis, Department of Mechanical Engineering, University of Coimbra, Coimbra, Portugal, 2006. [Google Scholar]
- He, B.Y.; Soady, K.A.; Mellor, B.G.; Harrison, G.; Reed, P.A.S. Fatigue crack growth behaviour in the LCF regime in a shot peened steam turbine blade material. Int. J. Fatigue 2016, 82, 280–291. [Google Scholar] [CrossRef]
Figure 1.
(a) Shot peening machine; (b) shot peened specimen; and (c) dimensions of Compact Tension (CT) specimens in mm.
Figure 1.
(a) Shot peening machine; (b) shot peened specimen; and (c) dimensions of Compact Tension (CT) specimens in mm.

Figure 2.
Microstructure micrographs: (a) base material; and (b) shot peening (SP) sample.
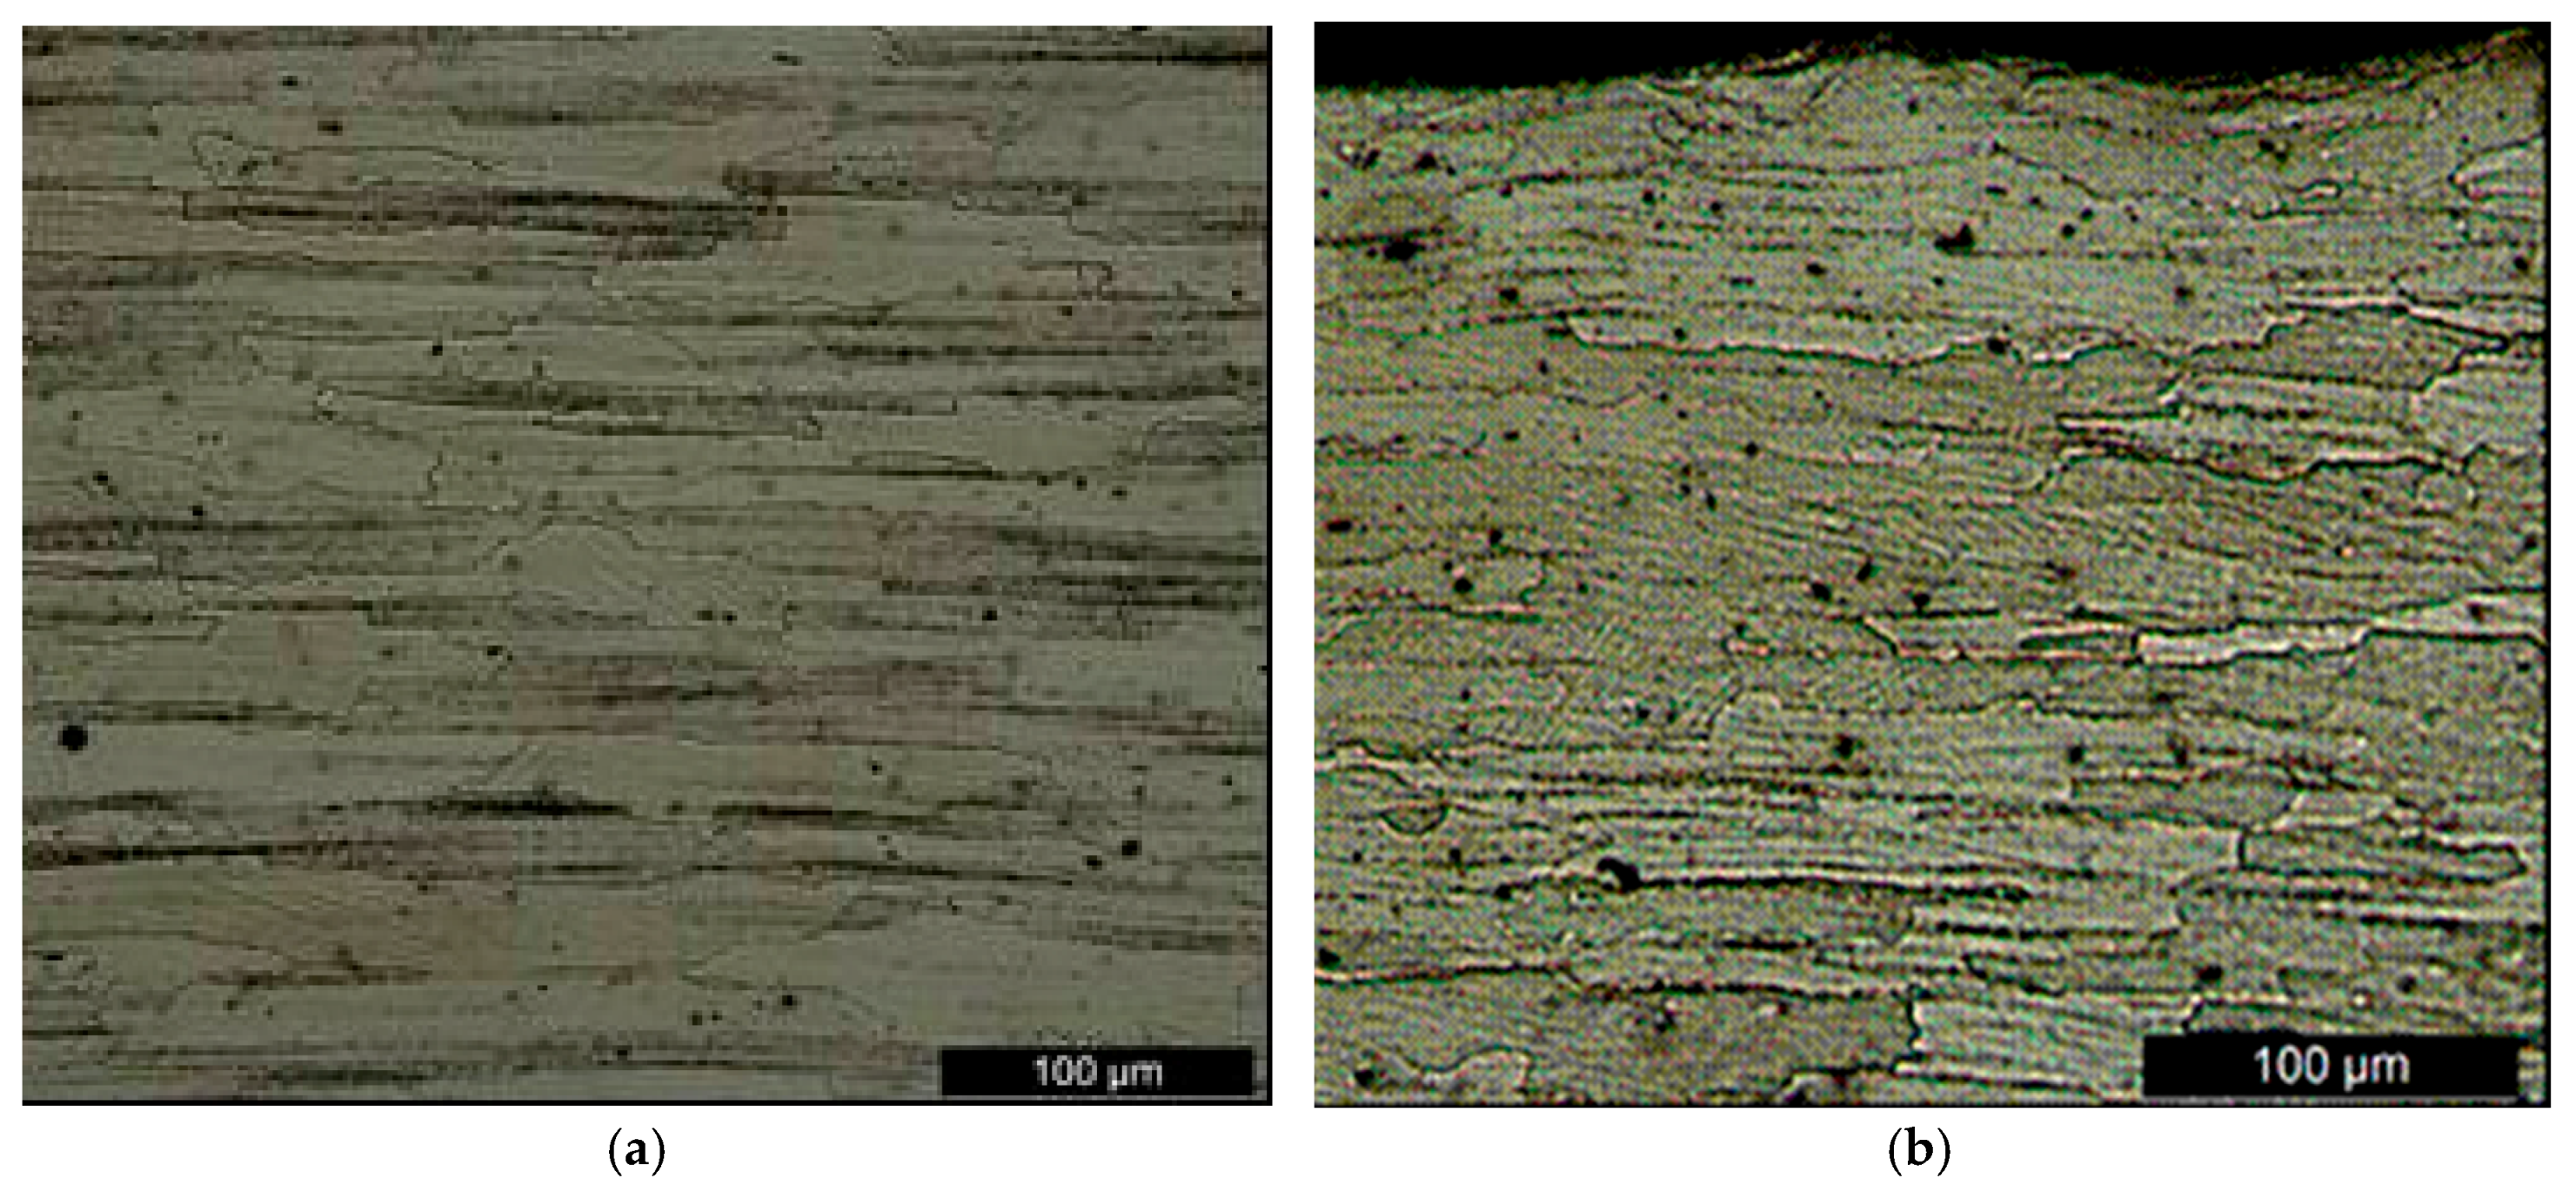
Figure 3.
Scheme of variable amplitude loadings with periodic overloading blocks.

Figure 4.
Calibration curves based on the compliance, C, for 4 and 8 mm thick specimens.
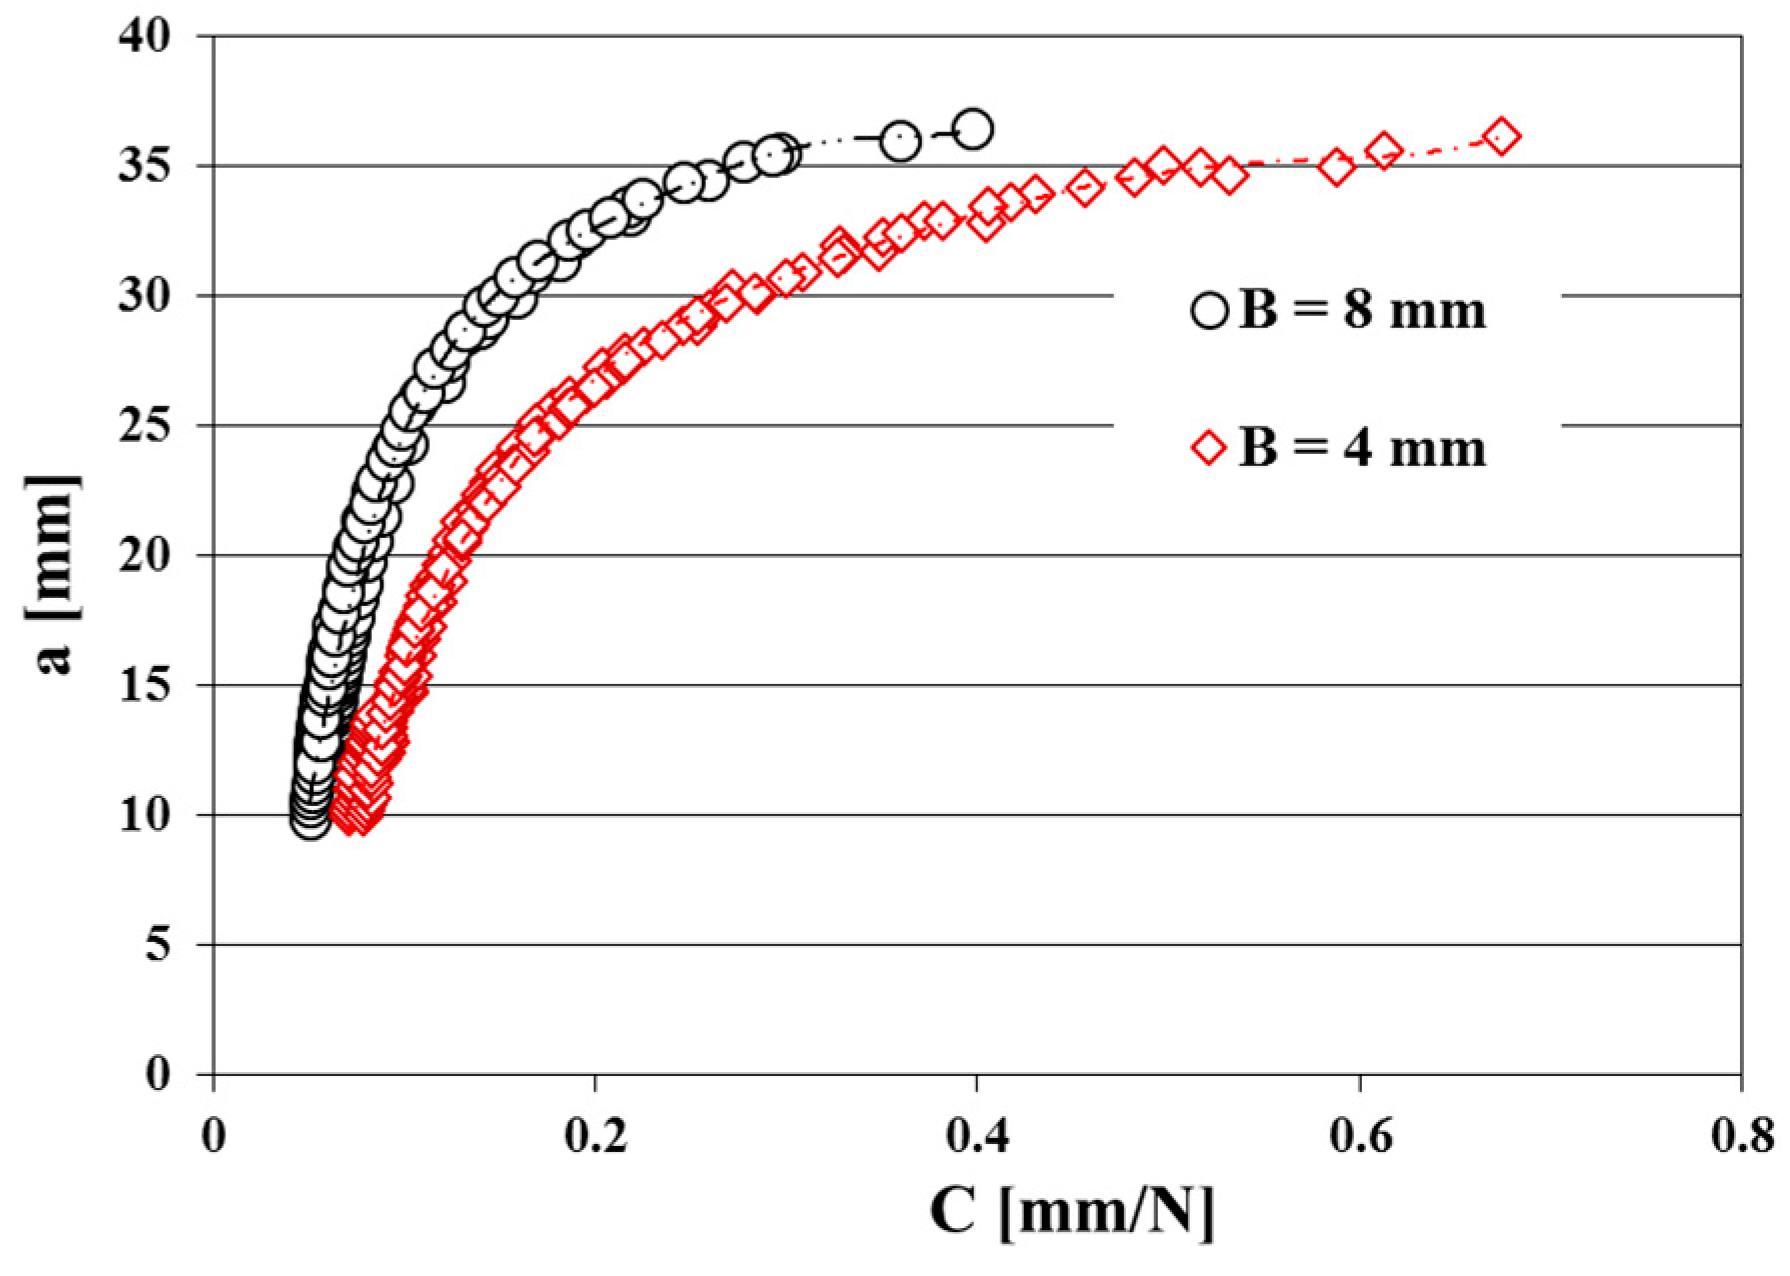
Figure 5.
Thickness effect on the da/dN-∆K curves for specimens: (a) MP, R = 0.05; (b) SP, R = 0.05; (c) MP, R = 0.4; and (d) SP, R = 0.4.
Figure 5.
Thickness effect on the da/dN-∆K curves for specimens: (a) MP, R = 0.05; (b) SP, R = 0.05; (c) MP, R = 0.4; and (d) SP, R = 0.4.

Figure 6.
Shot peening effect on da/dN-∆K curves for specimens: (a) B = 4 mm, R = 0.05; (b) B = 8 mm, R = 0.05; (c) B = 4 mm, R = 0.4; and (d) B = 8 mm, R = 0.4.
Figure 6.
Shot peening effect on da/dN-∆K curves for specimens: (a) B = 4 mm, R = 0.05; (b) B = 8 mm, R = 0.05; (c) B = 4 mm, R = 0.4; and (d) B = 8 mm, R = 0.4.

Figure 7.
Impression marks of the crack path and tunnel effect: (a) MP specimens; (b) SP specimens; (c) schematic indication for tunnel effect parameters; and (d) tunnel effect value distribution for MP and SP specimens.
Figure 7.
Impression marks of the crack path and tunnel effect: (a) MP specimens; (b) SP specimens; (c) schematic indication for tunnel effect parameters; and (d) tunnel effect value distribution for MP and SP specimens.
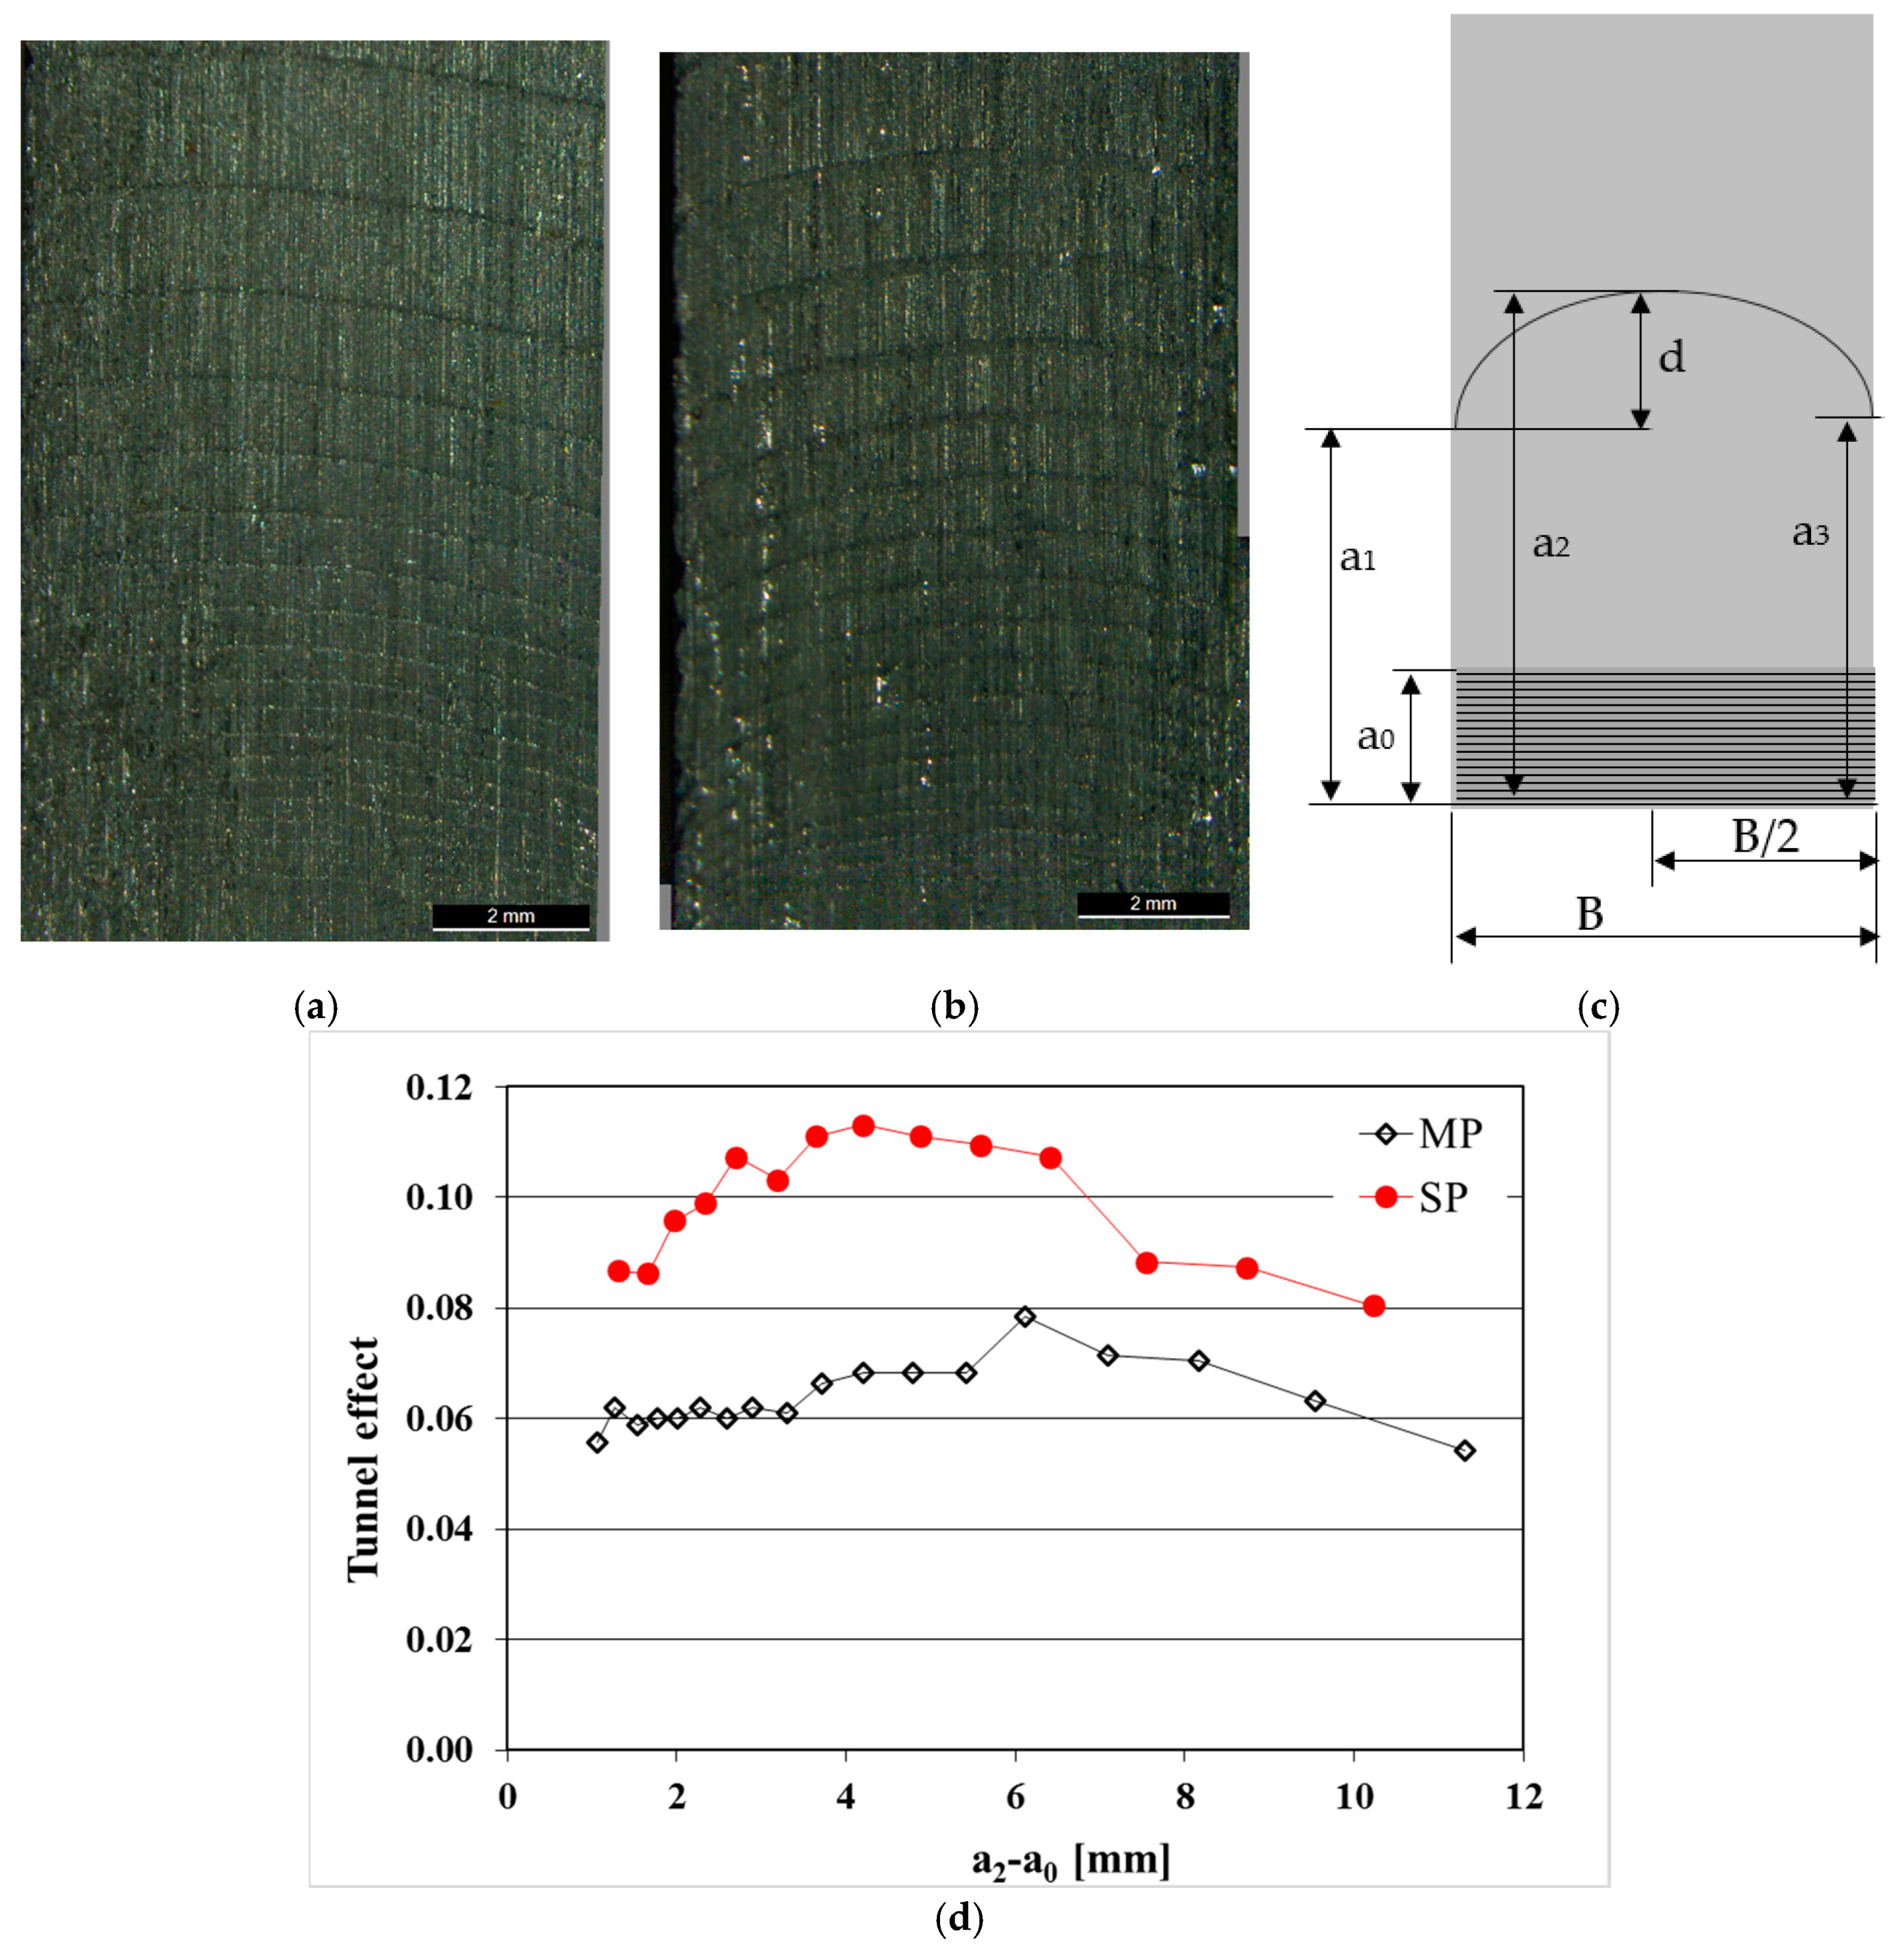
Figure 8.
Residual stresses profile and X-ray diffraction peak breadth against the depth from surface for SP specimens. “○” corresponds to the residual stress in rolling direction (MPa) and “□” to the diffraction peak breadth (°).
Figure 8.
Residual stresses profile and X-ray diffraction peak breadth against the depth from surface for SP specimens. “○” corresponds to the residual stress in rolling direction (MPa) and “□” to the diffraction peak breadth (°).

Figure 9.
R effect on da/dN-∆K curves for specimens: (a) B = 4 mm, MP; (b) B = 8 mm, MP; (c) B = 4 mm, SP; and (d) B = 8 mm, SP.
Figure 9.
R effect on da/dN-∆K curves for specimens: (a) B = 4 mm, MP; (b) B = 8 mm, MP; (c) B = 4 mm, SP; and (d) B = 8 mm, SP.

Figure 10.
Block overload effect on da/dN-∆K curves for 8 mm thick specimens: (a) R = 0.05, MP; (b) R = 0.05, SP; (c) R = 0.4, MP; and (d) R = 0.4, SP.
Figure 10.
Block overload effect on da/dN-∆K curves for 8 mm thick specimens: (a) R = 0.05, MP; (b) R = 0.05, SP; (c) R = 0.4, MP; and (d) R = 0.4, SP.
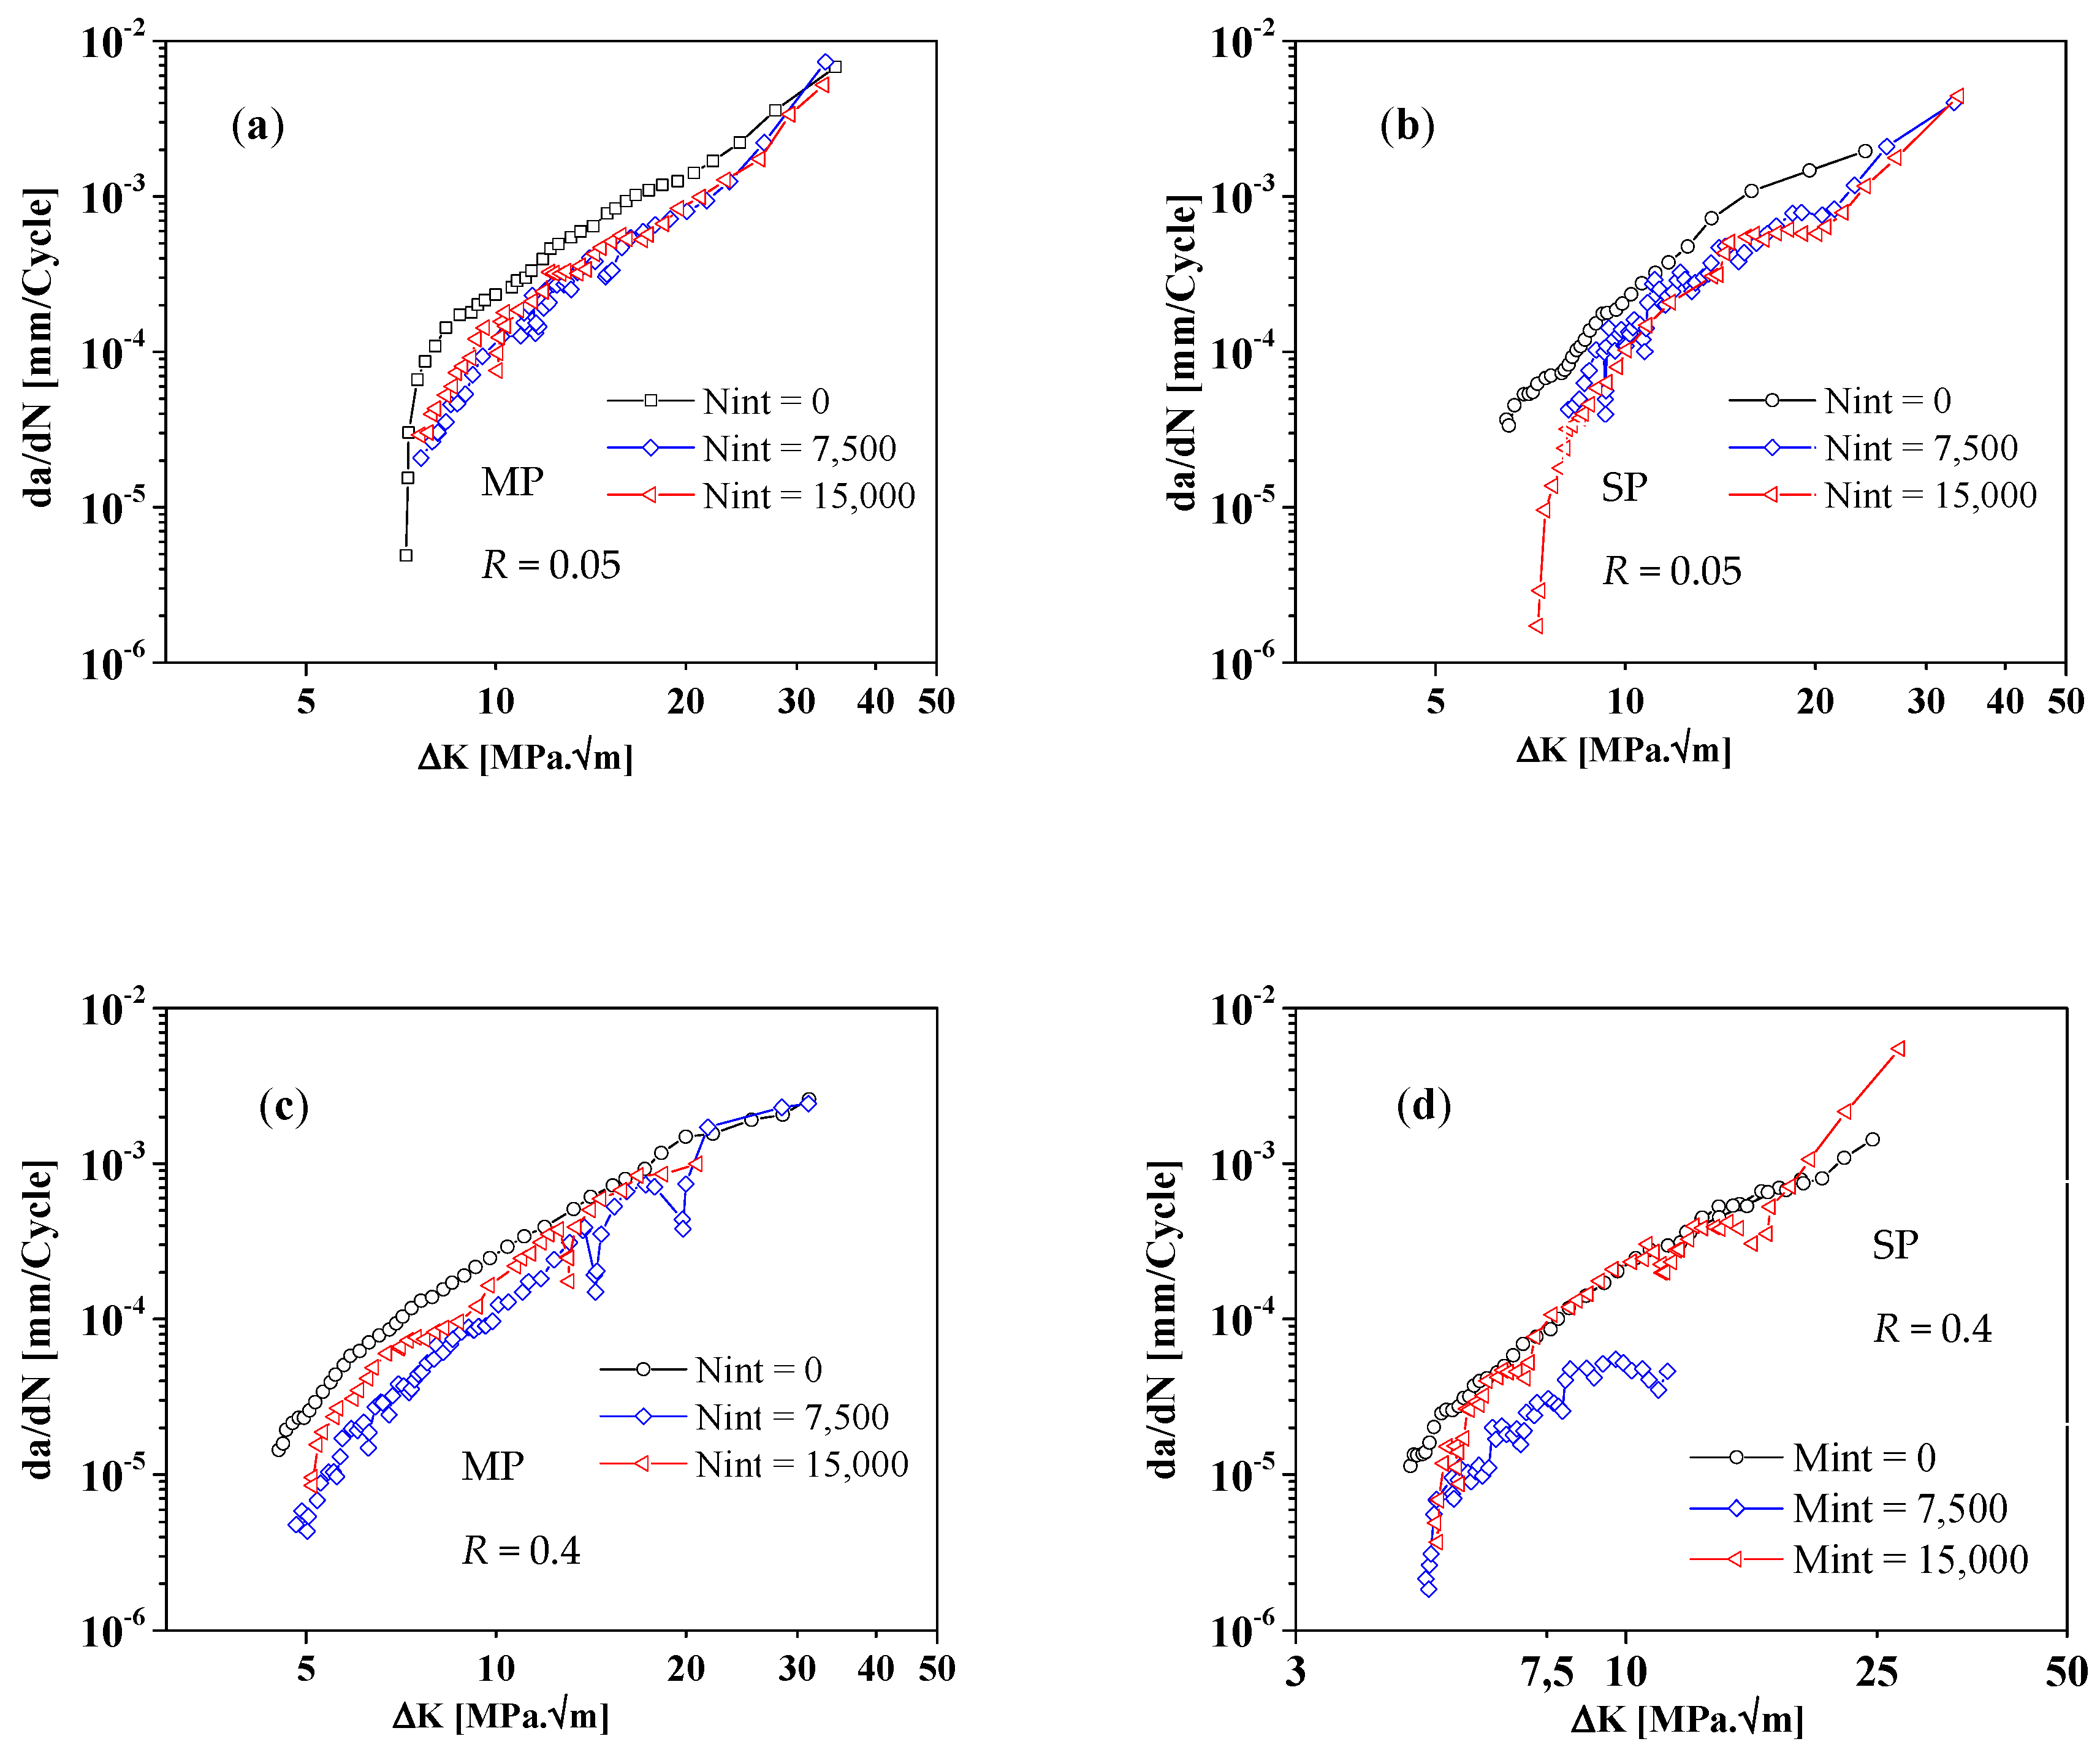
Figure 11.
Exemplary fracture surface morphology from SEM observations.

Table 1.
Chemical composition of the 7475-T7351 aluminum alloy (% Weight).
| Si | Fe | Cu | Mn | Mg | Cr | Zn | Ti | Others | Al |
|---|---|---|---|---|---|---|---|---|---|
| 0.1 | 0.12 | 1.2–1.9 | 0.06 | 1.9–2.6 | 0.18–0.25 | 5.2–6.2 | 0.06 | 0.15 | Remaining |
Table 2.
Surface roughness parameters for Mechanically Polished (MP) and Shot Penned (SP) specimens.
Table 2.
Surface roughness parameters for Mechanically Polished (MP) and Shot Penned (SP) specimens.
| Specimen | Parameter | Mean Value ± Standard Deviation (μm) |
|---|---|---|
| MP | Ra | 1.22 ± 0.02 |
| Rq | 1.50 ± 0.02 | |
| Rz | 7.74 ± 0.13 | |
| SP | Ra | 3.70 ± 0.17 |
| Rq | 4.60 ± 0.21 | |
| Rz | 23.50 ± 2.00 |
Table 3.
Paris law parameters, C and m determined from da/dN vs. ∆K curves (mm/cycle; MPa m1/2).
| B [mm] | Specimen | R | C | m | Validity [MPa m1/2] | Correlation Factor |
|---|---|---|---|---|---|---|
| 4 | MP | 0.05 | 1.41 × 10⁻⁸ | 3.94 | 7–13 | 0.995 |
| 4 | MP | 0.4 | 2.42 × 10⁻⁶ | 2.04 | 12–24 | 0.996 |
| 4 | SP | 0.05 | 2.95 × 10⁻⁷ | 2.94 | 8–14 | 0.970 |
| 4 | SP | 0.4 | 2.70 × 10⁻⁷ | 3.05 | 5–10 | 0.982 |
| 8 | MP | 0.05 | 2.72 × 10⁻⁸ | 3.89 | 7–12 | 0.996 |
| 8 | MP | 0.4 | 1.96 × 10⁻⁶ | 2.16 | 13–22 | 0.998 |
| 8 | SP | 0.05 | 2.53 × 10⁻⁷ | 2.97 | 9–16 | 0.991 |
| 8 | SP | 0.4 | 2.63 × 10⁻⁷ | 3.25 | 5–17 | 0.973 |
© 2018 by the authors. Licensee MDPI, Basel, Switzerland. This article is an open access article distributed under the terms and conditions of the Creative Commons Attribution (CC BY) license (http://creativecommons.org/licenses/by/4.0/).
Share and Cite
MDPI and ACS Style
Ferreira, N.; Antunes, P.V.; Ferreira, J.A.M.; D. M. Costa, J.; Capela, C. Effects of Shot-Peening and Stress Ratio on the Fatigue Crack Propagation of AL 7475-T7351 Specimens. Appl. Sci. 2018, 8, 375. https://doi.org/10.3390/app8030375
AMA Style
Ferreira N, Antunes PV, Ferreira JAM, D. M. Costa J, Capela C. Effects of Shot-Peening and Stress Ratio on the Fatigue Crack Propagation of AL 7475-T7351 Specimens. Applied Sciences. 2018; 8(3):375. https://doi.org/10.3390/app8030375
Chicago/Turabian StyleFerreira, Natália, Pedro V. Antunes, José A. M. Ferreira, José D. M. Costa, and Carlos Capela. 2018. "Effects of Shot-Peening and Stress Ratio on the Fatigue Crack Propagation of AL 7475-T7351 Specimens" Applied Sciences 8, no. 3: 375. https://doi.org/10.3390/app8030375
Note that from the first issue of 2016, this journal uses article numbers instead of page numbers. See further details here.