Seismic Response of a Three-Dimensional Asymmetric Multi-Storey Reinforced Concrete Structure
by
 , ,
, ,
Hyun-Kyu Lim
1, 
Jun Won Kang
1,*,
Hongrak Pak
1,
Ho-Seok Chi
2,
Young-Geun Lee
2 and
Janghwan Kim
3 1
Department of Civil Engineering, Hongik University, Seoul 04066, Korea
2
Department of Structural Systems & Site Safety Evaluation, Korea Institute of Nuclear Safety, Daejeon 34142, Korea
3
Daelim Industrial Corporation Ltd., Seoul 03152, Korea
*
Author to whom correspondence should be addressed.
Appl. Sci. 2018, 8(4), 479; https://doi.org/10.3390/app8040479
Submission received: 28 January 2018
/
Revised: 12 March 2018
/
Accepted: 19 March 2018
/
Published: 22 March 2018
(This article belongs to the Section Mechanical Engineering)
Abstract
:Featured Application
Authors are encouraged to provide a concise description of the specific application or a potential application of the work. This section is not mandatory.
Abstract
This study discusses the seismic behavior of a geometrically asymmetric three-storey reinforced concrete (RC) building, considering torsional effect and material nonlinearity. The building is a test structure that was used for seismic performance evaluation in the SMART 2013 (Seismic design and best-estimate Methods Assessment for Reinforced concrete buildings subjected to Torsion and nonlinear effects) international benchmark. To begin with, nonlinear stress–strain relationships that were set up for concrete and reinforcing steel are validated by finite element local tests with a representative volume element. A modal analysis shows that the first three calculated natural frequencies are close to the ones that are obtained by modal experiments. The finite element modeling is further validated by comparing the calculated displacement and acceleration due to a low-intensity ground motion with the responses from the corresponding shaking table test. Using the validated model, a blind nonlinear seismic analysis is performed for a series of Northridge earthquakes in order to estimate the behavior of the asymmetric RC structure to high-intensity ground motions. The calculated displacement and acceleration, as well as their response spectra at various sampling points, agree well with the results of a three-dimensional benchmark shaking table test. By investigating the seismic torsional behavior of the asymmetric RC structure, it is shown that the seismic response of an asymmetric structure is larger than that of a hypothetical symmetric structure. The result indicates that a larger seismic response should be considered in the seismic design of an asymmetric structure compared to a symmetric structure with similar design conditions.
1. Introduction
The evaluation of the inelastic response of reinforced concrete (RC) structures is essential for estimating the strength and damage of the structure under extreme loads such as earthquake, impact, and blast. In recent years, predicting the large deformation of RC structures has become more practicable, due to the advance of state-of-the-art numerical algorithms and computational power [1,2,3,4,5,6,7,8,9]. In recent decades, the feasibility of numerical methods for predicting the nonlinear behavior of RC structures have been assessed through many benchmark campaigns conducted on RC shear walls, columns, and buildings. In 1997, the Nuclear Power Engineering Corporation of Japan organized a series of shaking table tests on regular and U-shaped low-span RC shear walls [10,11]. The results demonstrated the necessity of improving the nonlinear analysis methods for shear walls when dealing with beyond design basis earthquake. From 1997 to 1998, the Commissariat à l’énergie atomique et aux énergies alternatives (CEA) of France performed SAFE (Structure Armées Faiblement Elancées) tests for the experimental characterization of the dynamic behavior of low-span shear walls [12,13]. The SAFE tests were pseudodynamic tests where shear cracking, failure modes, nonlinear load versus displacement diagrams, and wall ductility were confirmed under various earthquake loadings beyond the design level. Other experimental campaigns were conducted by the CEA, such as Conception et Analyse Sismique des Structures en Béton Armé (CASSBA) tests from 1990 to 1993 [14] and CAMUS tests from 1996 to 2002 [15]. These tests were shaking table tests that were conducted on multi-storey mock-ups with lightly reinforced concrete walls. These campaigns helped improve knowledge on the seismic behavior of RC structural systems and provided reference data for model development and validation [16,17]. In 2006, the Network for Earthquake Engineering Simulation (NEES) launched a blind prediction contest on the seismic response of a seven-storey full-scale RC building with cantilever structural walls [18]. The contest program examined the seismic behavior of RC structural systems with particular emphasis on the interaction among walls, slabs, and other gravity systems [19,20,21,22].
To improve on the previous development of benchmark campaigns for RC structures, a new benchmark project named SMART 2013 (Seismic design and best-estimate Methods Assessment for Reinforced concrete buildings subjected to Torsion and nonlinear effects) was carried out by the CEA from 2011 to 2015. This project consisted of shaking table tests and an international benchmark analysis on a reduced-scale model (¼ scale) that was representative of a typical half part of a nuclear facility building. The objective of the experimental campaign and benchmark analysis was to evaluate the conventional design method of RC structures for seismic loadings and compare the structural dynamic responses, as well as the floor response spectra, from various benchmark participants. The SMART 2013 campaign used a real high-intensity seismic load that was composed of a series of Northridge earthquakes followed by aftershocks. The benchmark participants used the load data at eight actuator locations of a three-dimensional shaking table to calculate the numerical response of the RC structure and compare it with the experimental result. Before SMART 2013, there was a SMART 2008 benchmark organized by the CEA with similar projects. However, SMART 2013 has the following new features compared to SMART 2008: (i) input signals are real ones and not synthetic ones; (ii) aftershock seismic loading is considered; and (iii) additional load data at the actuator location are provided to benchmark participants.
This study aims to investigate the seismic behavior of the asymmetric SMART 2013 RC building structure, considering torsional effect and material nonlinearity. In particular, the study includes benchmark simulations comprising modal, linear, and nonlinear seismic analyses of the RC structure. First, using mechanical parameters provided by the SMART 2013 international benchmark [23,24,25,26], nonlinear constitutive models of concrete and reinforcing steel are constructed. The material models are validated by local tests on a representative volume element (RVE). Then, a finite element (FE) modeling of the entire SMART 2013 RC structure, which is based on its detailed drawings, is validated by comparing the modal and linear time history analysis results with the experimental results. The validated finite element model is used for a blind nonlinear seismic benchmark analysis of the RC structure subjected to the high-intensity Northridge earthquake. Displacement and acceleration, as well as their frequency spectra, are presented, exhibiting the torsional and flexural behaviors of the structure. The computed seismic responses are compared with the results of a shaking table test, which was conducted as part of the benchmark. Finally, the effect of the torsional behavior of the asymmetric RC structure is examined by comparing the seismic response of the asymmetric structure with that of a hypothetical symmetric structure with similar design conditions.
2. Configuration of the Asymmetric RC Building Structure
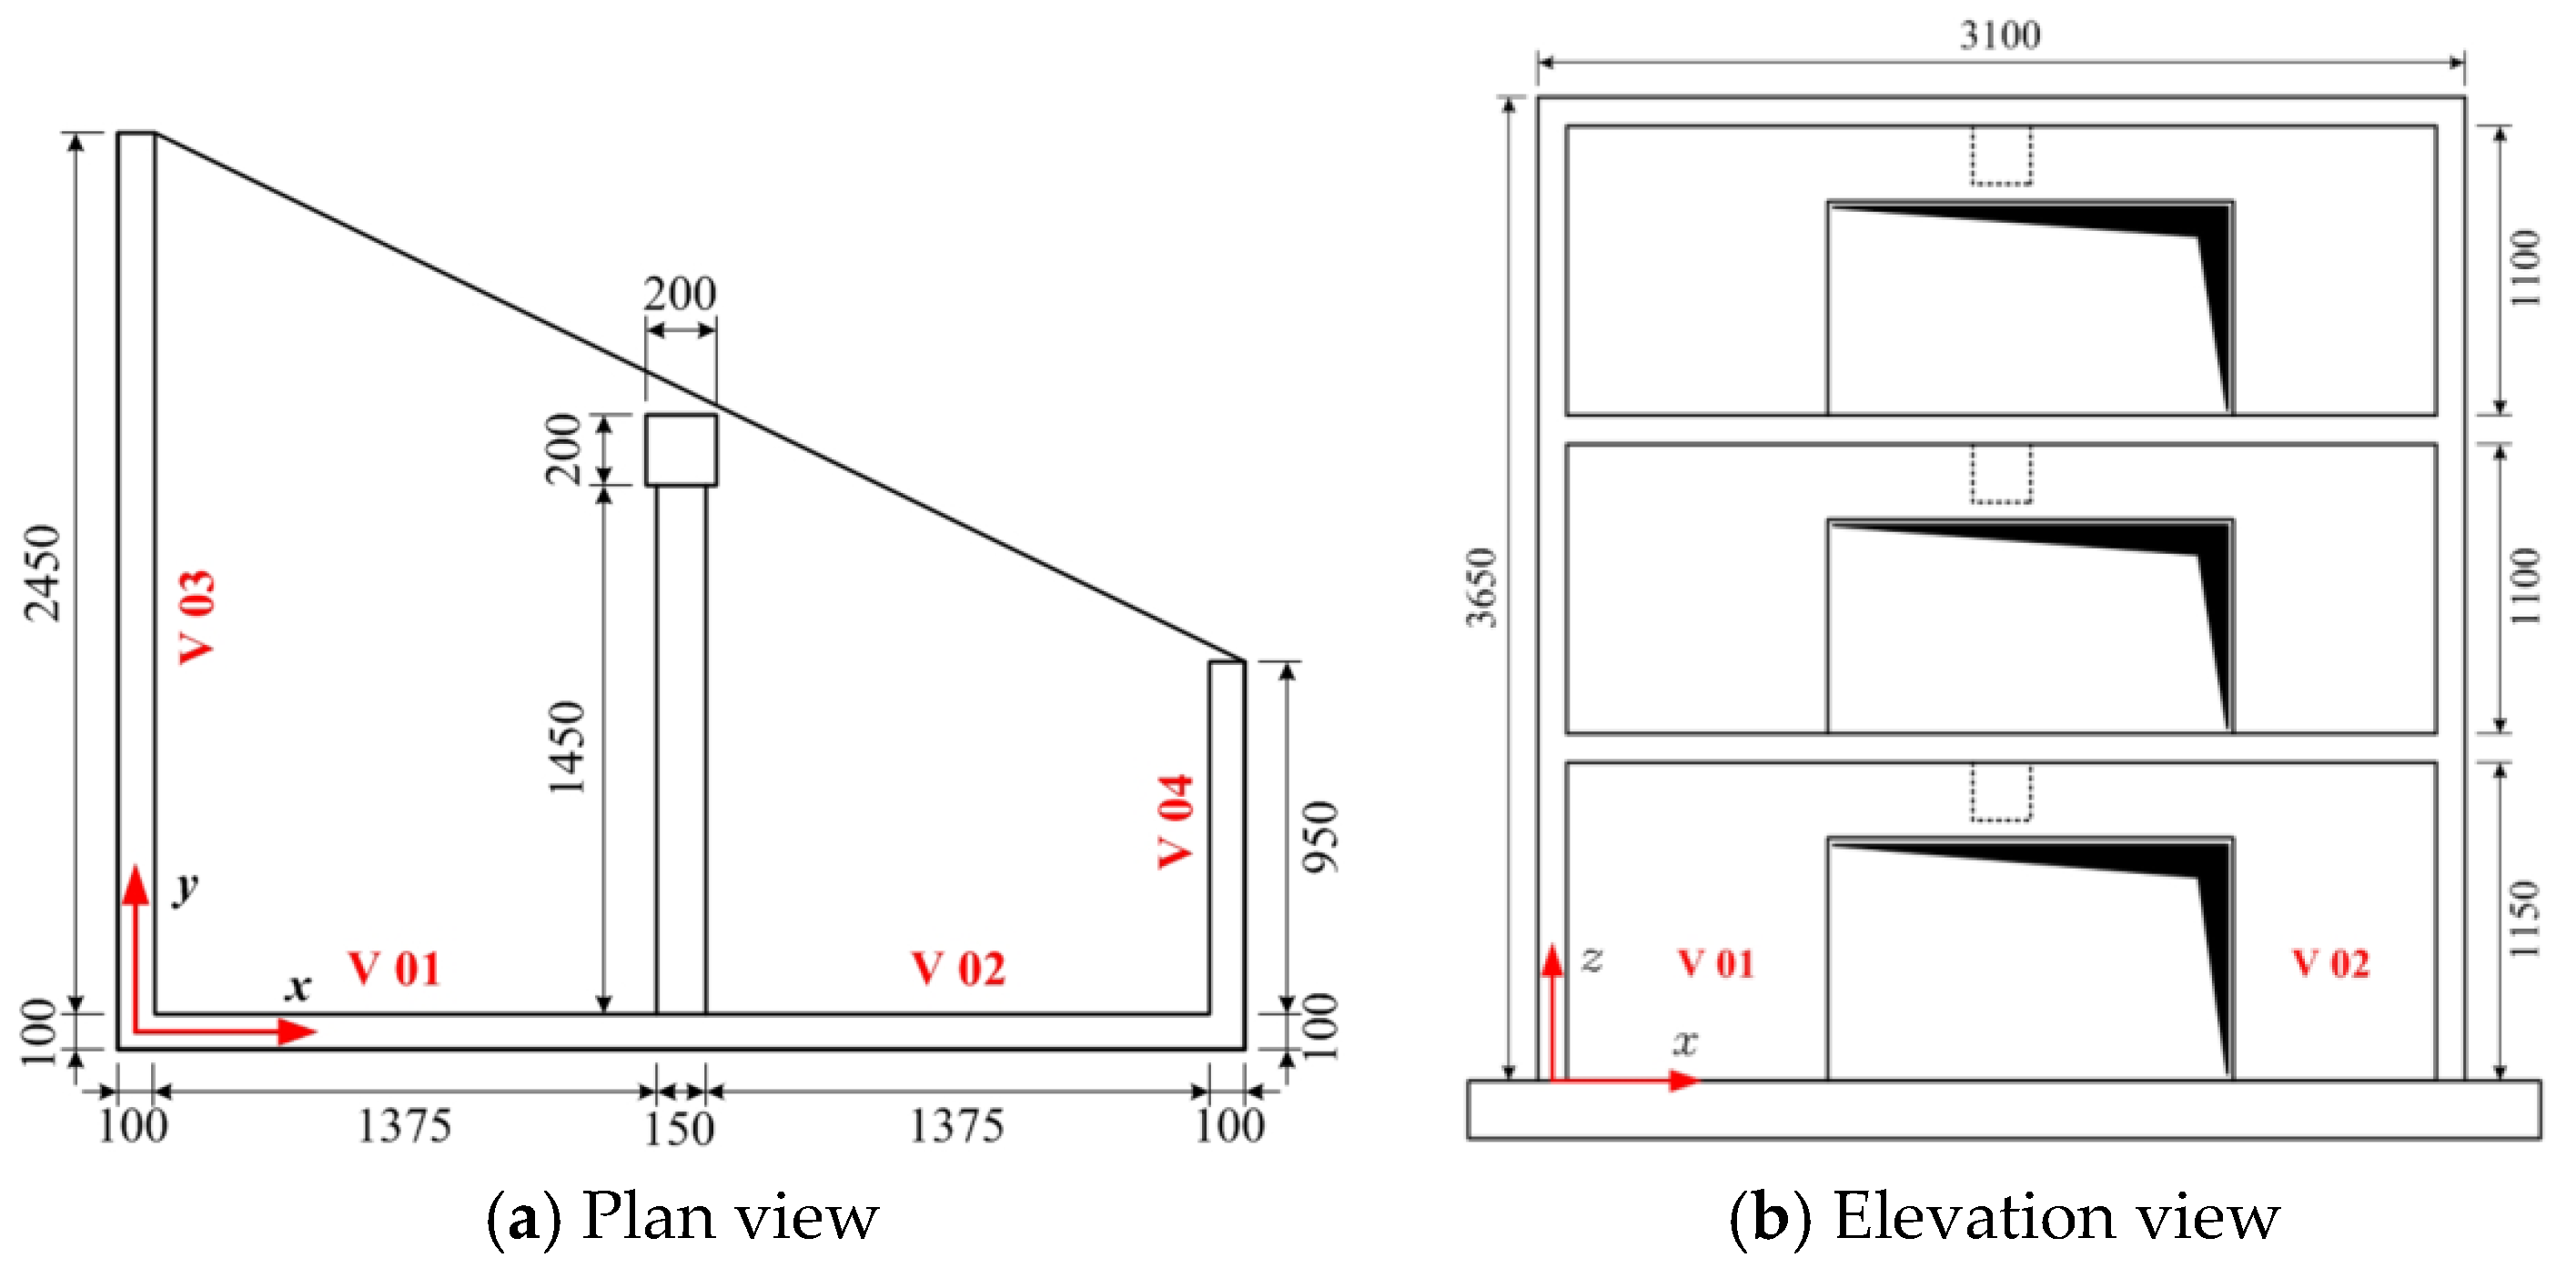
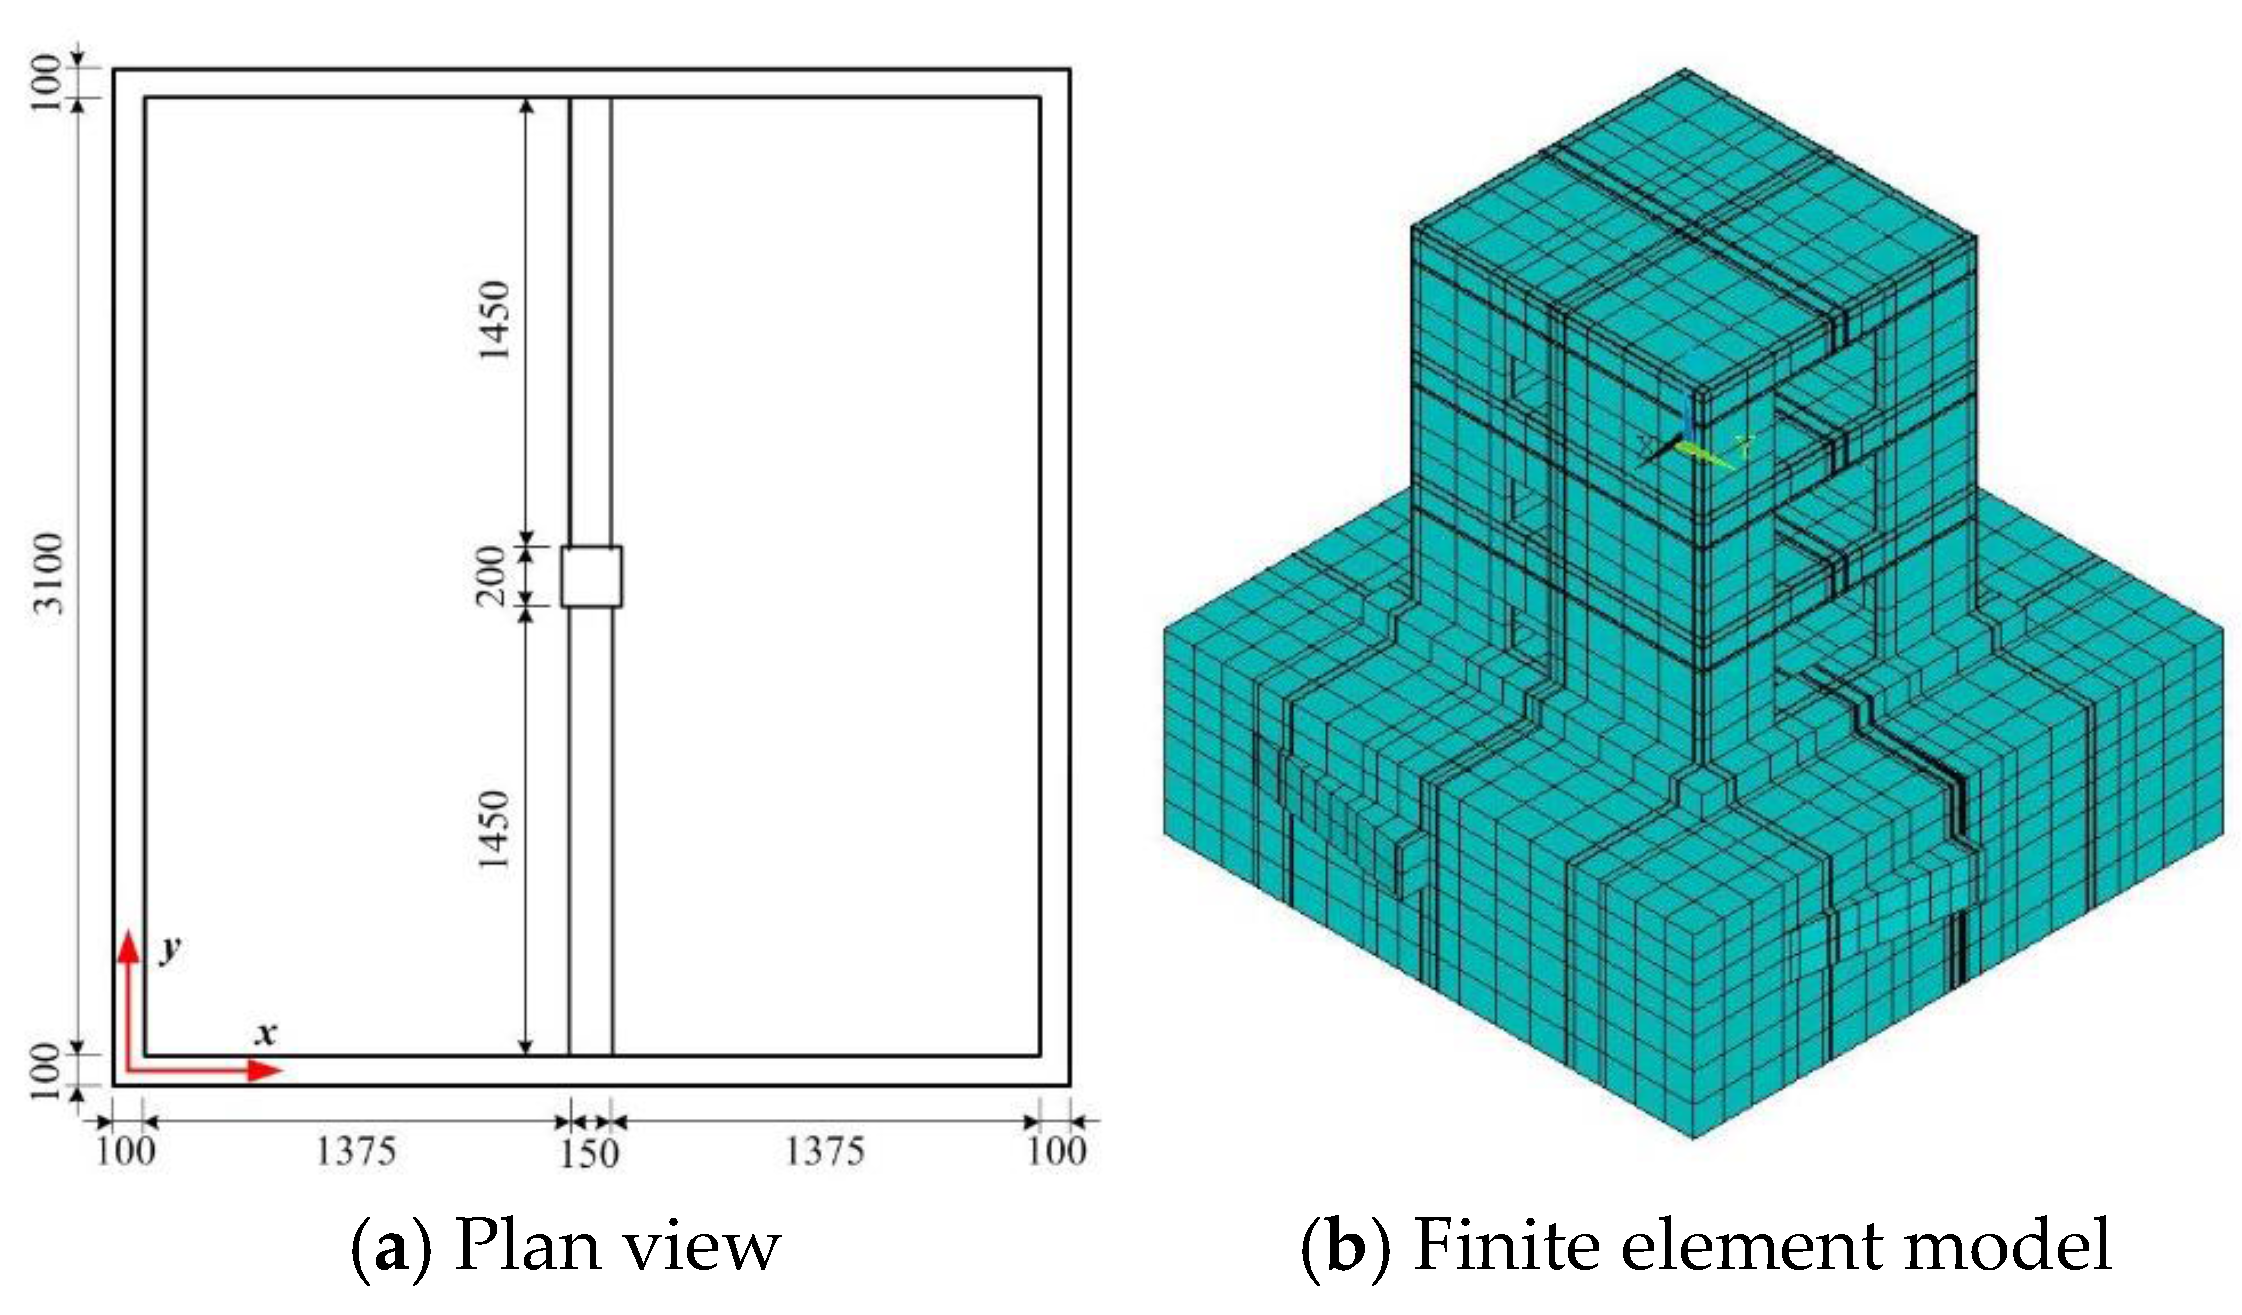
The SMART 2013 structure is an asymmetric three-storey RC building that is representative of a typical half part of a nuclear facility building at ¼ scale, as shown in Figure 1. Due to the asymmetric shape, the structure may exhibit coupled flexural and torsional behaviors against external loads. Figure 2 shows the plan and elevation views of the structure. The principal dimensions of the structural components are presented in Table 1.
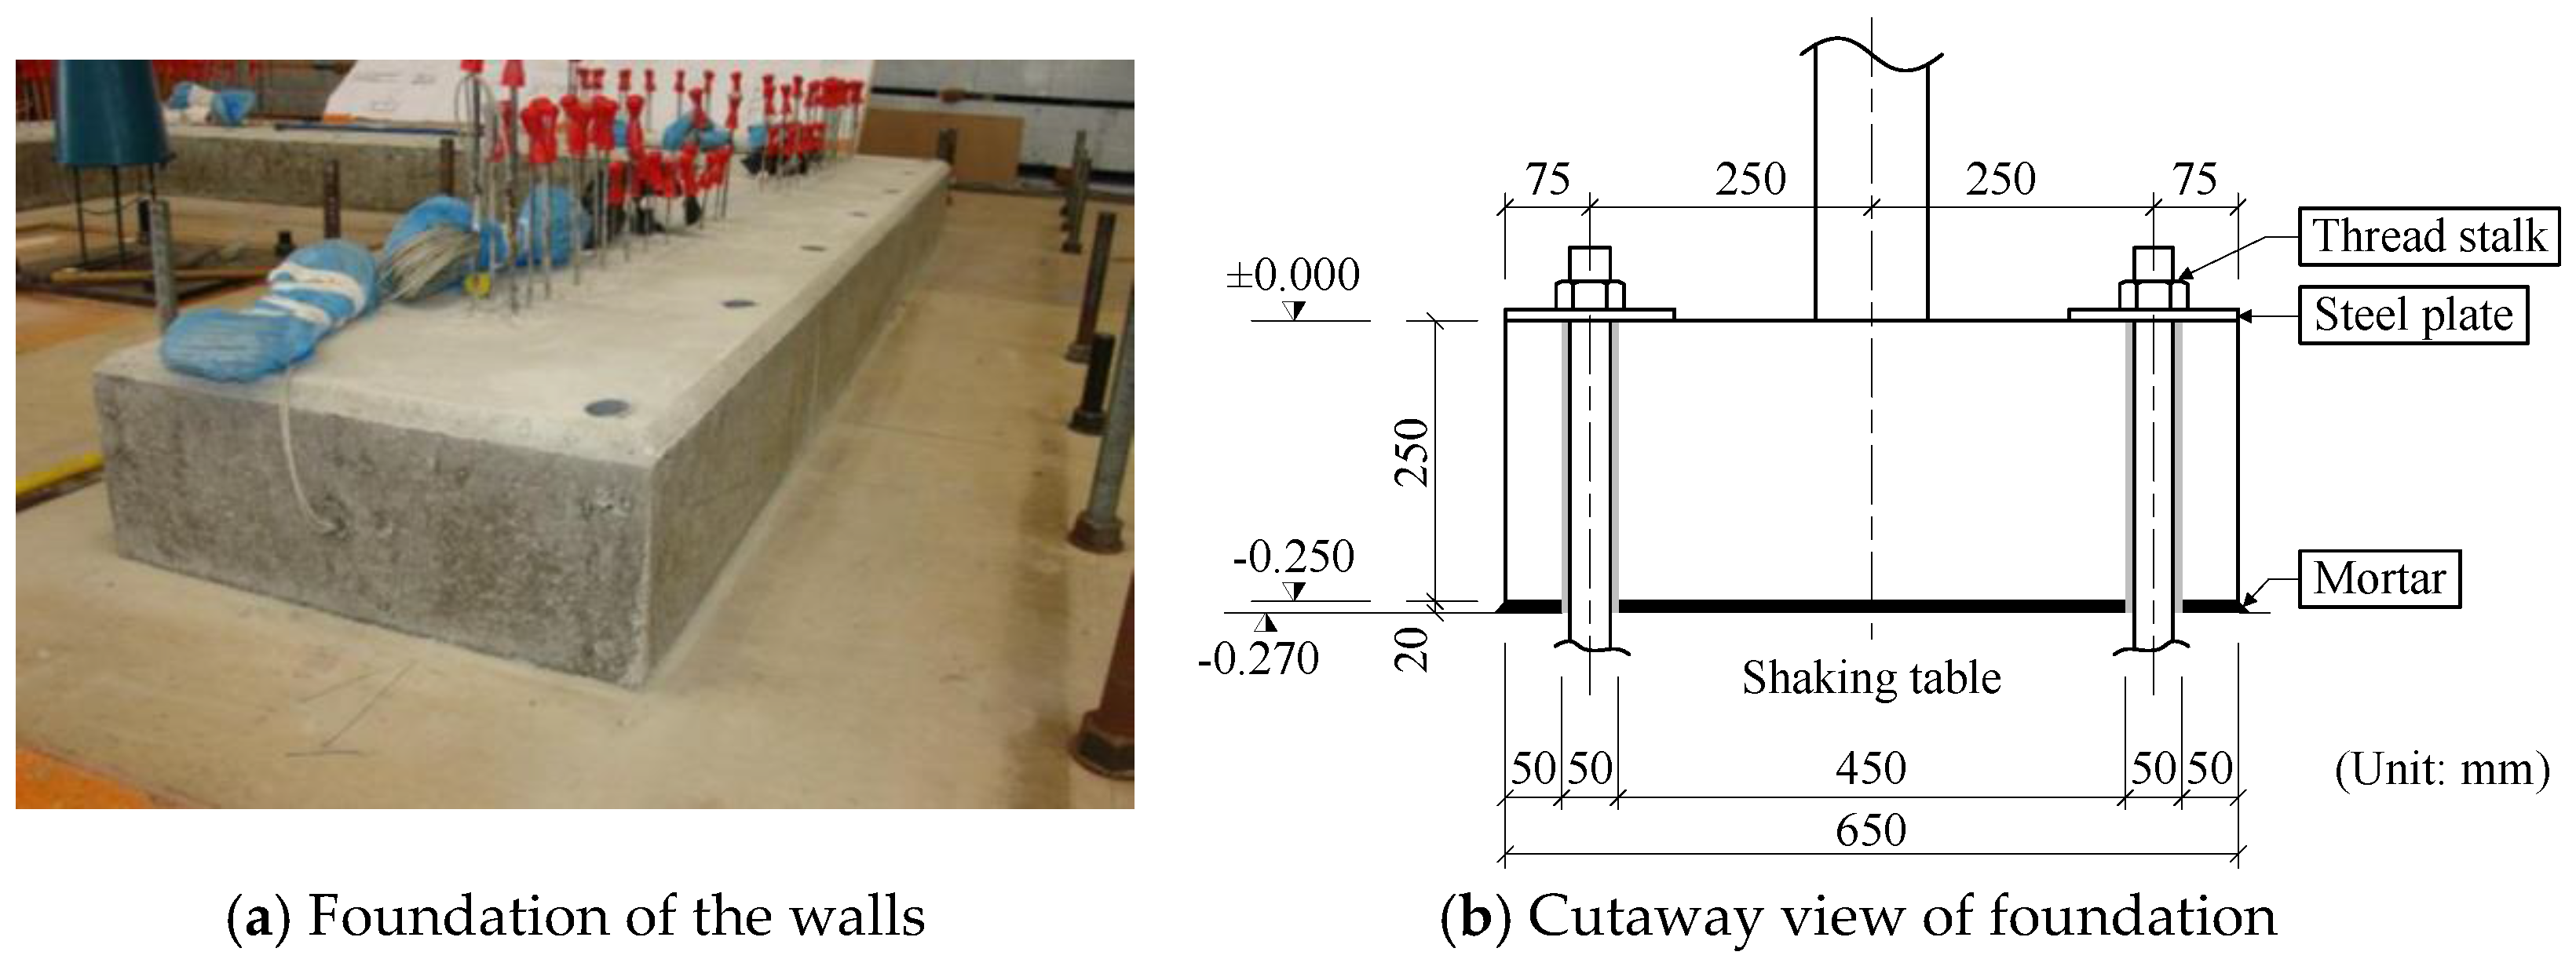
The SMART 2013 RC structure was designed according to the French nuclear regulations and guidelines. The design is based on a design acceleration spectrum for 5% structural damping. The design spectrum is based on a ground motion with the peak ground acceleration (PGA) of 0.2 g, which corresponds to an earthquake with a Richter magnitude of 5.5 and an epicenter distance of 10 km [23]. The foundation of the wall is made of a continuous RC footing with a width of 65 cm and a height of 25 cm, as shown in Figure 3a. There are 34 anchoring points through which threaded steel rods with a 36 mm diameter connect the foundation to the shaking table. Figure 3b shows a cutaway view of the foundation. The center column of the structure is anchored to the shaking table with a connecting steel plate that is 2 mm thick.
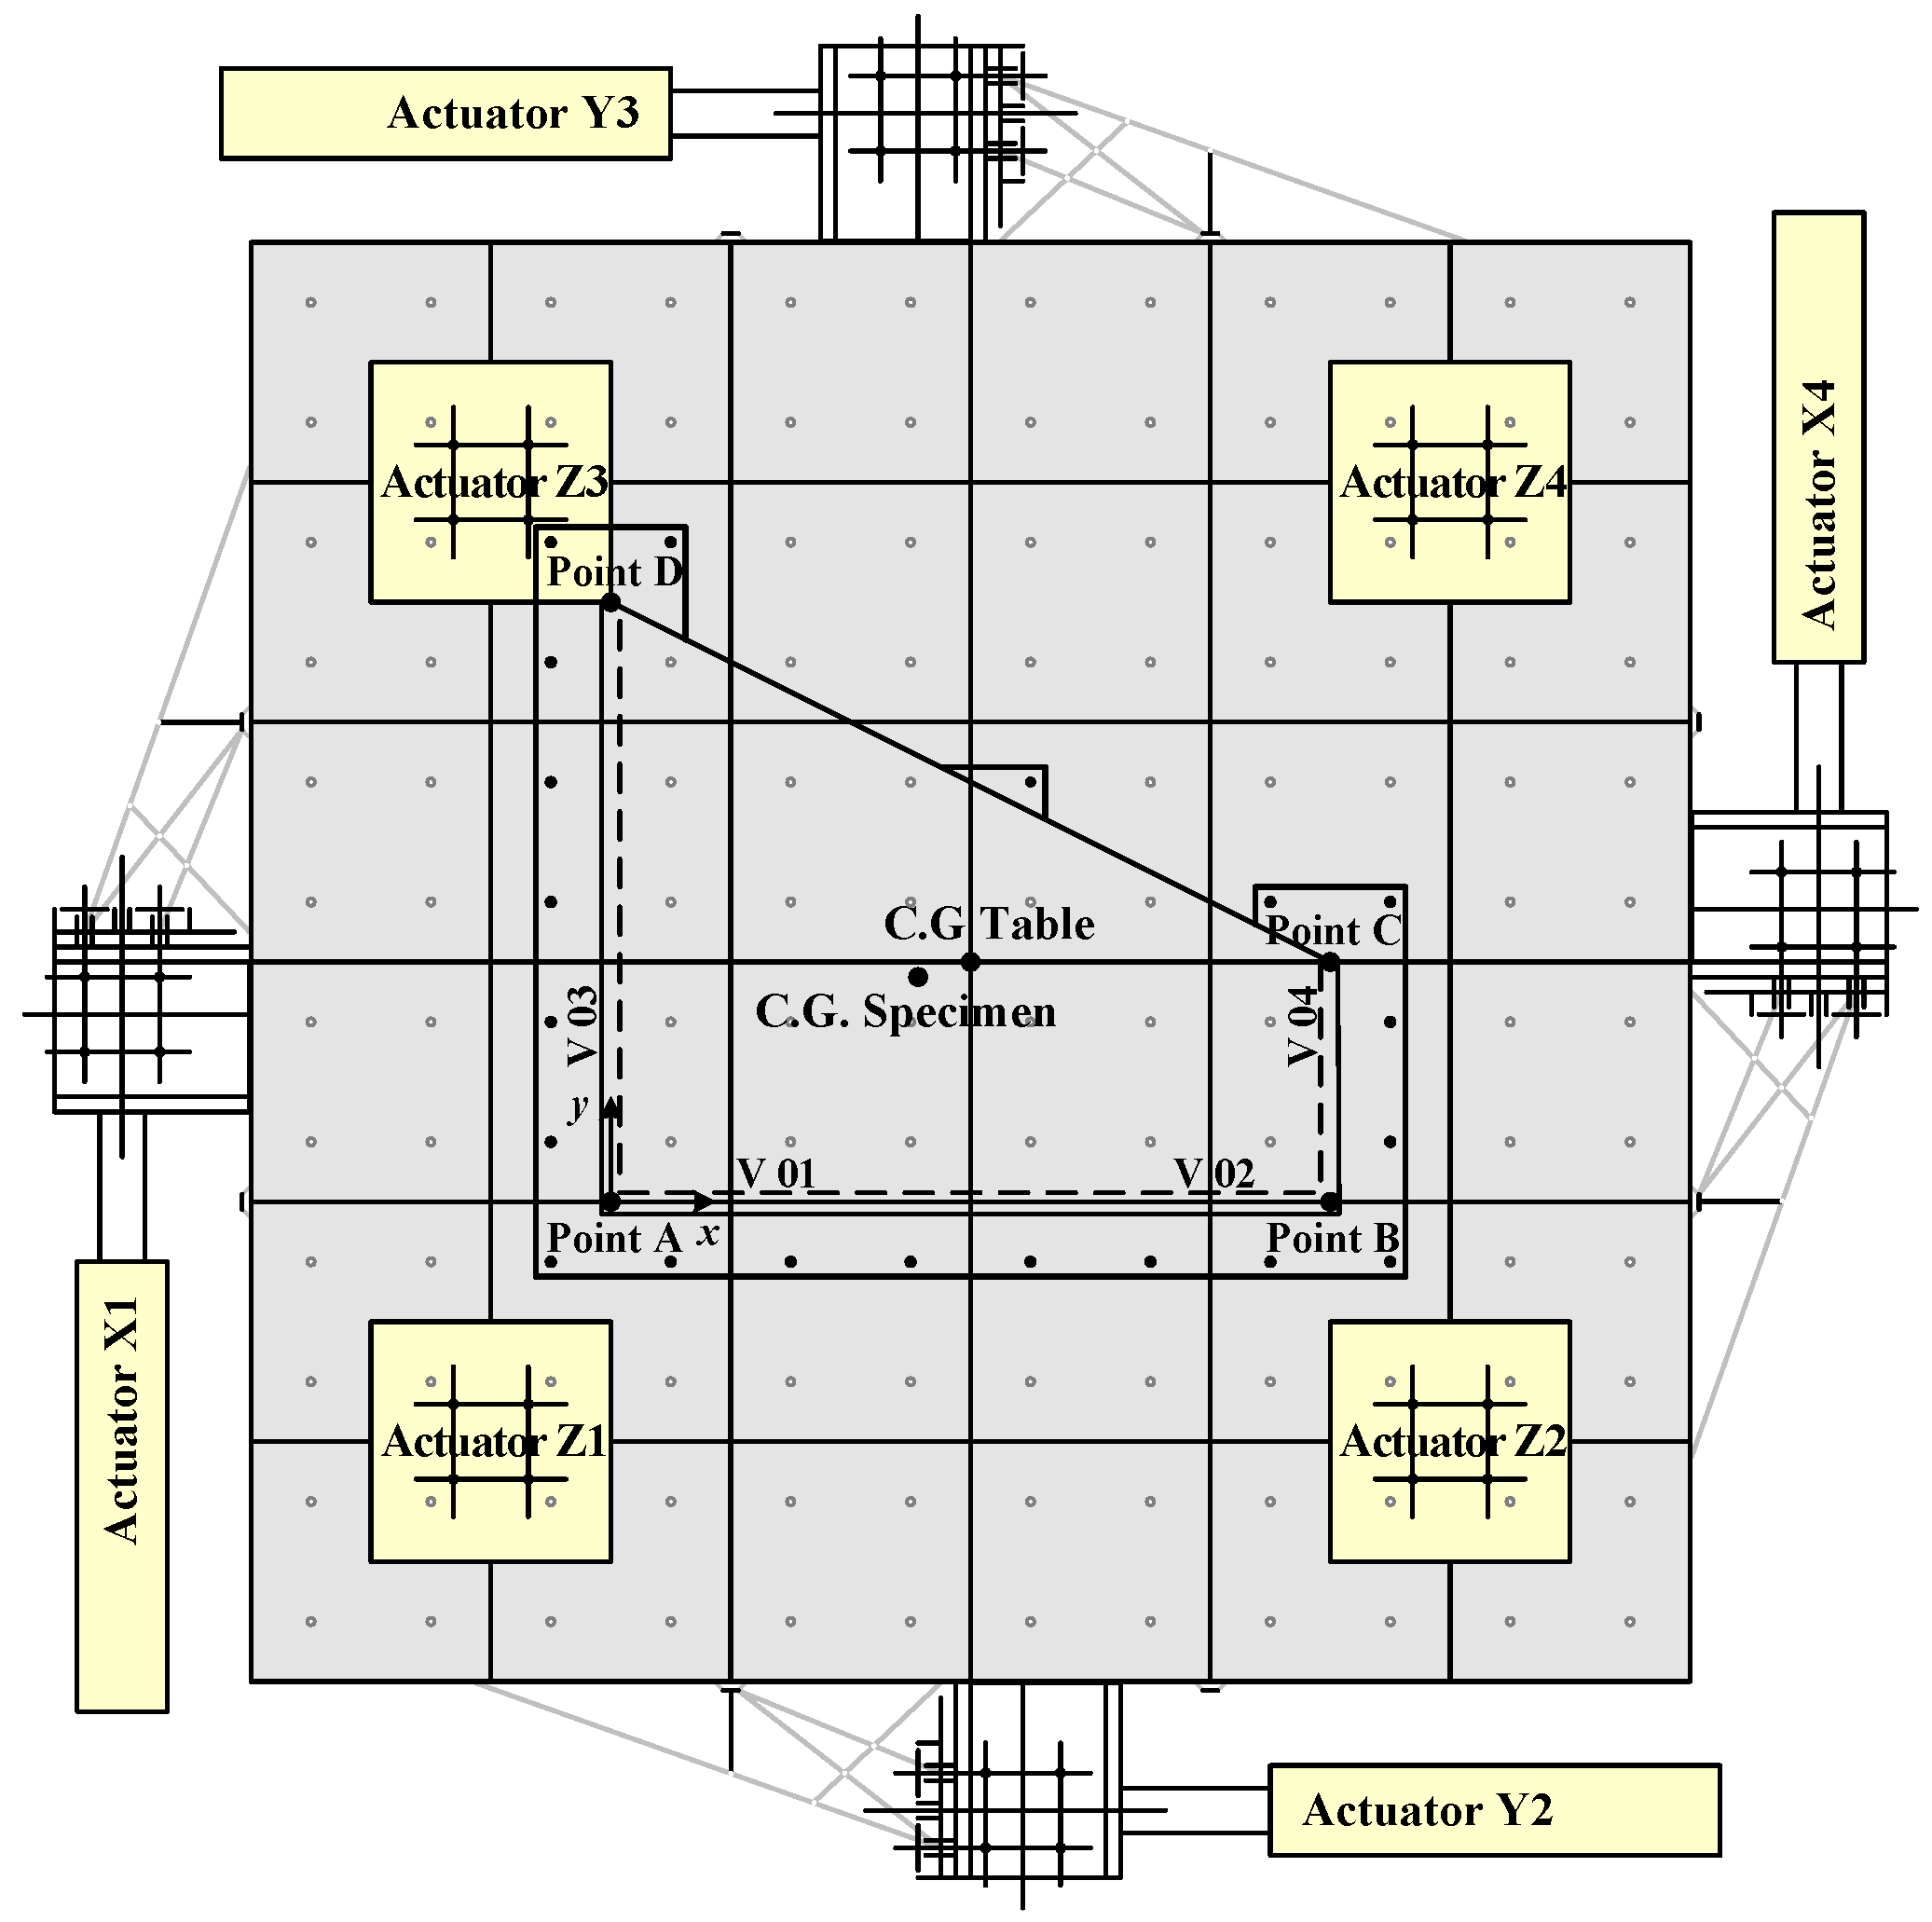
The mass of the SMART 2013 RC building is about 11.89 t. To reflect the weight of the equipment and pipelines, additional mass is considered for each floor. Mass scaling is considered when applying the additional mass to floors, since the building is a quarter-scale structure [23]. The additional mass is 11.45 t for the first floor, 12.17 t for the second floor, and 10.32 t for the third floor. The total mass of the structure with the additional floor mass is about 45 t. The shaking table is connected to eight hydraulic actuators, out of which four are placed in a horizontal direction and the remaining four are laid in a vertical direction. The SMART 2013 structure is placed on the shaking table such that its center of mass corresponds approximately to that of the shaking table. Figure 4 shows the SMART 2013 structure positioned on the shaking table, as well as the eight actuator locations. The ground motion is applied to the actuator locations at the side and bottom of the shaking table using a displacement control method. Figure 5 shows the sampling points on each floor where displacement and acceleration are recorded.
3. Finite Element Modeling of the SMART 2013 RC Structure
3.1. Constitutive Models for Concrete and Steel Reinforcement
To capture the inelastic stress–strain behavior of the RC members, nonlinear constitutive models of concrete and rebar are needed. Equations (1) and (2) represent a widely used uniaxial compressive stress–strain relationship for concrete [27]:
where and denote stress and strain, respectively, denotes the initial Young’s modulus of concrete, and is the ultimate compressive strength of concrete. represents the strain at the compressive strength . Table 2 lists the measured material properties of concrete and rebar. Based on Equation (1), a simplified multilinear stress–strain curve of concrete is constructed using the material properties of Table 2. For steel reinforcement, an elastic–perfectly plastic stress–strain curve is also constructed by referring to the property values in Table 2. Figure 6 shows the simplified strain–stress curves for each of the constitutive models. These curves are incorporated into ANSYS Mechanical APDL [28], a finite element analysis package, as the multilinear constitutive relationship of concrete with isotropic hardening and the elastoplastic constitutive relationship of steel reinforcement, respectively. The concrete model consists of six linear segments with an initial Young’s modulus of 32,000 MPa and successively decreasing moduli. The compressive and tensile strengths of concrete are 30 MPa and 2.4 MPa, respectively. The stress–strain curve starts from zero stress and strain. It is assumed that concrete behaves in a linearly elastic manner up to Point 1, at which the stress is . Points 2, 3, and 4 are obtained from Equation (1), where is calculated by Equation (2). Point 5 is at and . The stress–strain curve is extended to Point 6, where the strain is 0.003, with a slight increase of stress to help the convergence of solutions in the nonlinear seismic analysis with ANSYS. The yield strength of the rebar is 500 MPa at the strain of 0.00238 in both tension and compression.
3.2. Failure Criter Ion for Concrete
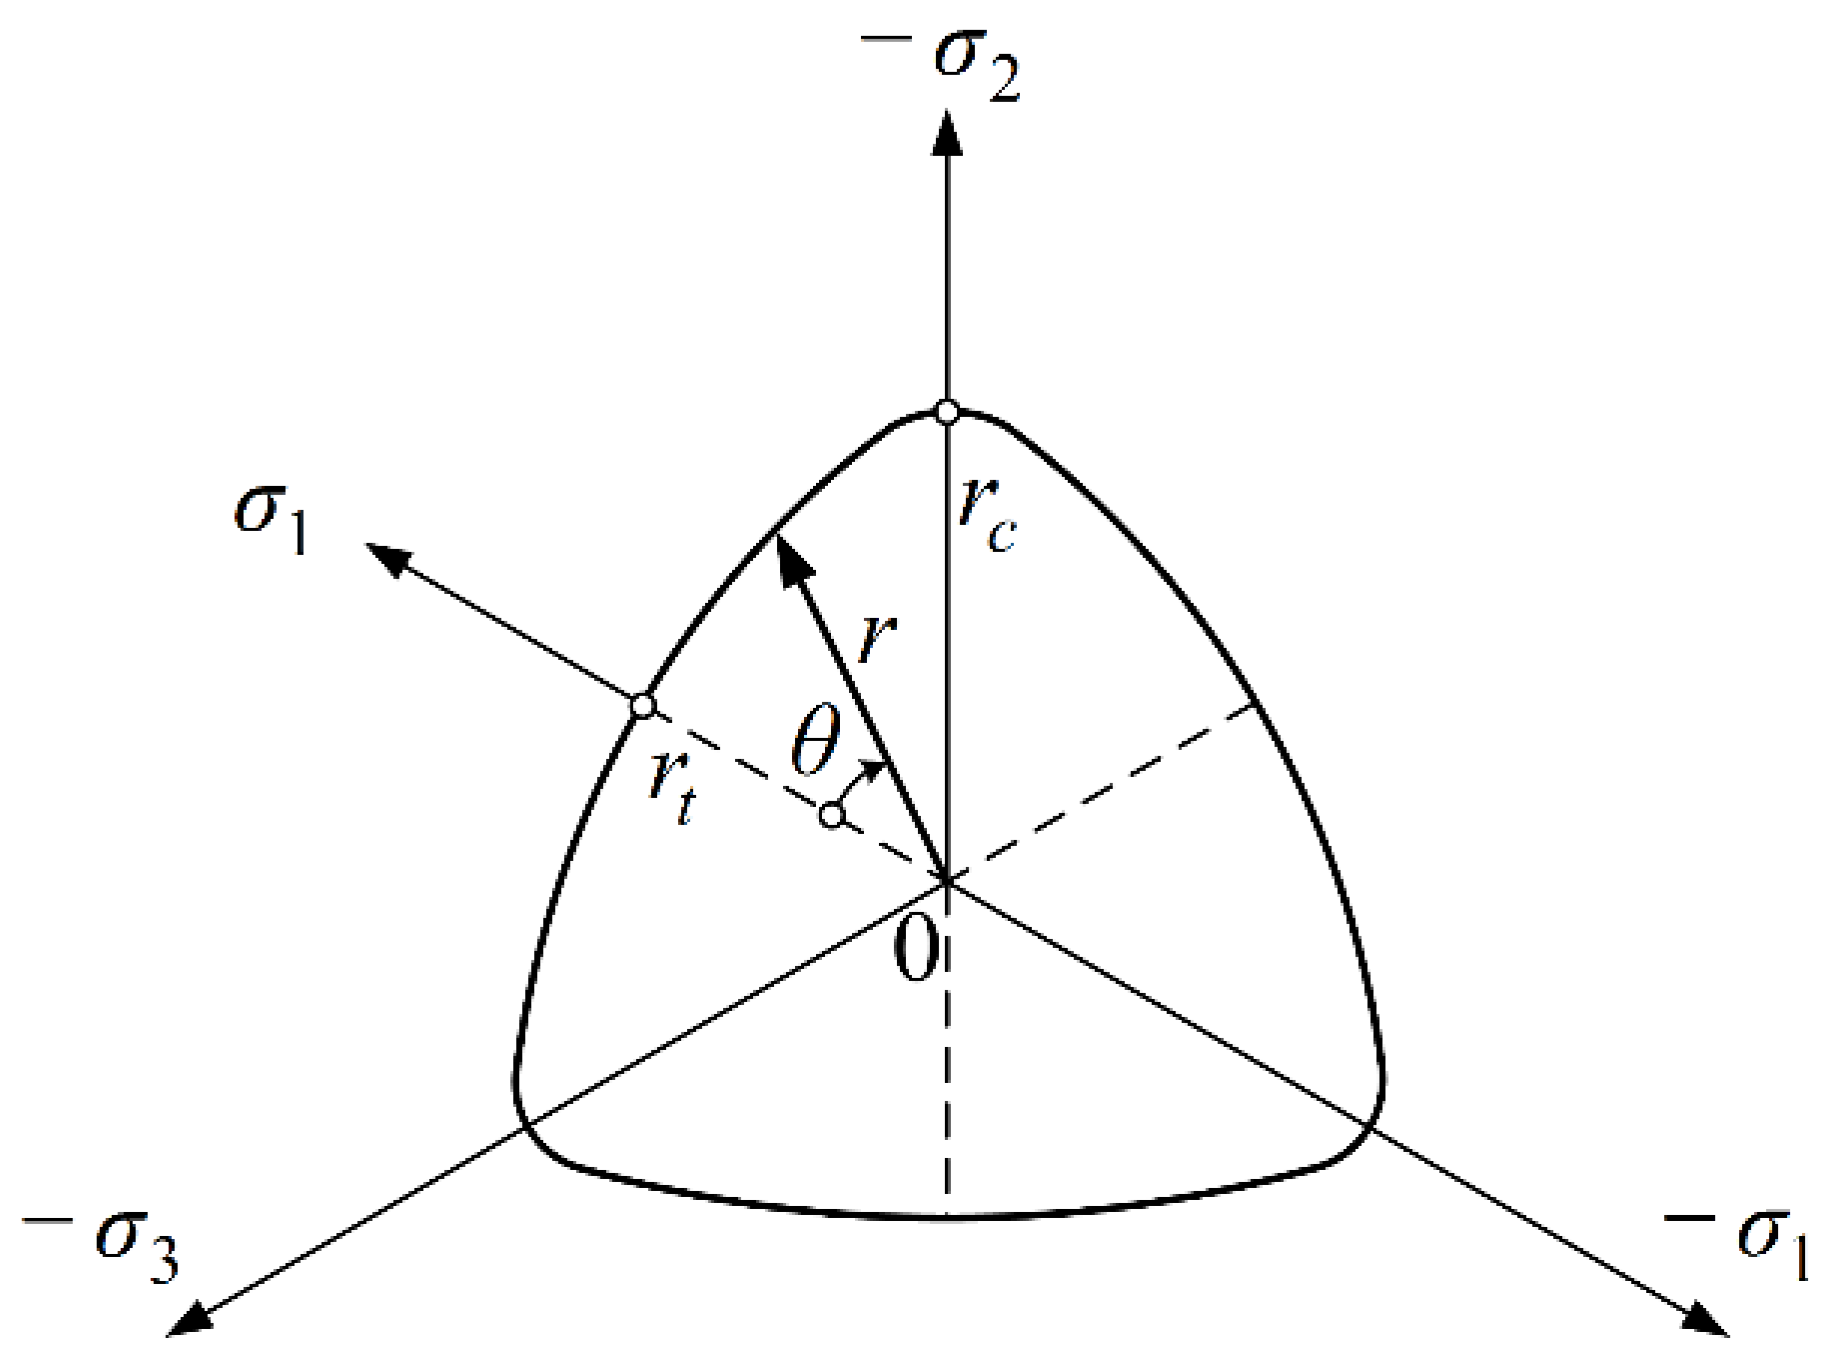
For the simulation of the behavior of concrete materials in multiaxial stress states, the Willam–Warnke failure criterion [29] was implemented in ANSYS with a SOLID65 element (ANSYS Mechanical APDL Release 14.5, ANSYS Inc., Canonsburg, PA, USA, 2012), which is a three-dimensional hexahedral element that can be used to model concrete. Both cracking and crushing failure modes can be accounted for by using the failure criterion. In the concrete element, cracking occurs when the principal tensile stress lies outside the failure surface. On the other hand, crushing occurs when all of the principal stresses are compressive and lie outside the failure surface. The Willam–Warnke failure criterion prescribes the portion of the failure curve in deviatoric plane as part of an elliptic curve. The cylindrical von Mises model and the conical Drucker–Prager model are all special cases of the Willam–Warnke failure criterion. The three-parameter Willam–Warnke failure surface can be expressed as:
where is the uniaxial compressive strength of concrete, while and denote the mean normal and mean shear stresses, respectively. The variable denotes the angle of similarity. They can be represented as:
where is the first invariant of the stress tensor, while and are the second and third invariants of the deviatoric part of the stress tensor, respectively. In Equation (3), is the radial coordinate of the failure surface on the deviatoric plane, which can be expressed as the following:
The parameters , , and in Equations (3) and (5) are the three parameters of the Willam–Warnke failure surface model. The parameters , and are the magnitude of the position vectors at locations and π/3 on the deviatoric plane, respectively, as shown in Figure 7. The three model parameters can be expressed as:
In Equations (6)–(8), and are the strength ratios, which are represented as:
where and are the uniaxial tensile strength and the equal biaxial compressive strength of concrete, respectively. Figure 8 shows the trace of the three-parameter Willam–Warnke yield surface in the - principal coordinate plane for and .
3.3. Finite Element Modeling of Concrete and Steel Reinforcement
For the finite element modeling of concrete, the SOLID65 three-dimensional element of ANSYS was used, which is associated with the plasticity algorithm described in Section 3.2. The solid element had eight nodes, with three translational degrees of freedom at each node. Several material property data are required for SOLID65: elastic modulus , uniaxial compressive strength , uniaxial tensile strength , Poisson’s ratio , shear transfer coefficient , and the uniaxial constitutive relationship as described in Section 3.1. The shear transfer coefficient ranged from 0 to 1, with 0 representing the complete loss of shear transfer along the crack face, and 1 representing no loss of shear transfer. The shear transfer coefficient used in this study was 0.5 for an open crack and 0.9 for a closed crack. For the finite element modeling of steel reinforcement, a three-dimensional beam element, BEAM188, of ANSYS was used, for which the elastic–perfectly plastic constitutive relationship described in Section 3.1 was imposed. The reinforcing steel element was set to share the node with a concrete element in order to model a perfect bond between concrete and reinforcing steel.
3.4. Local Test
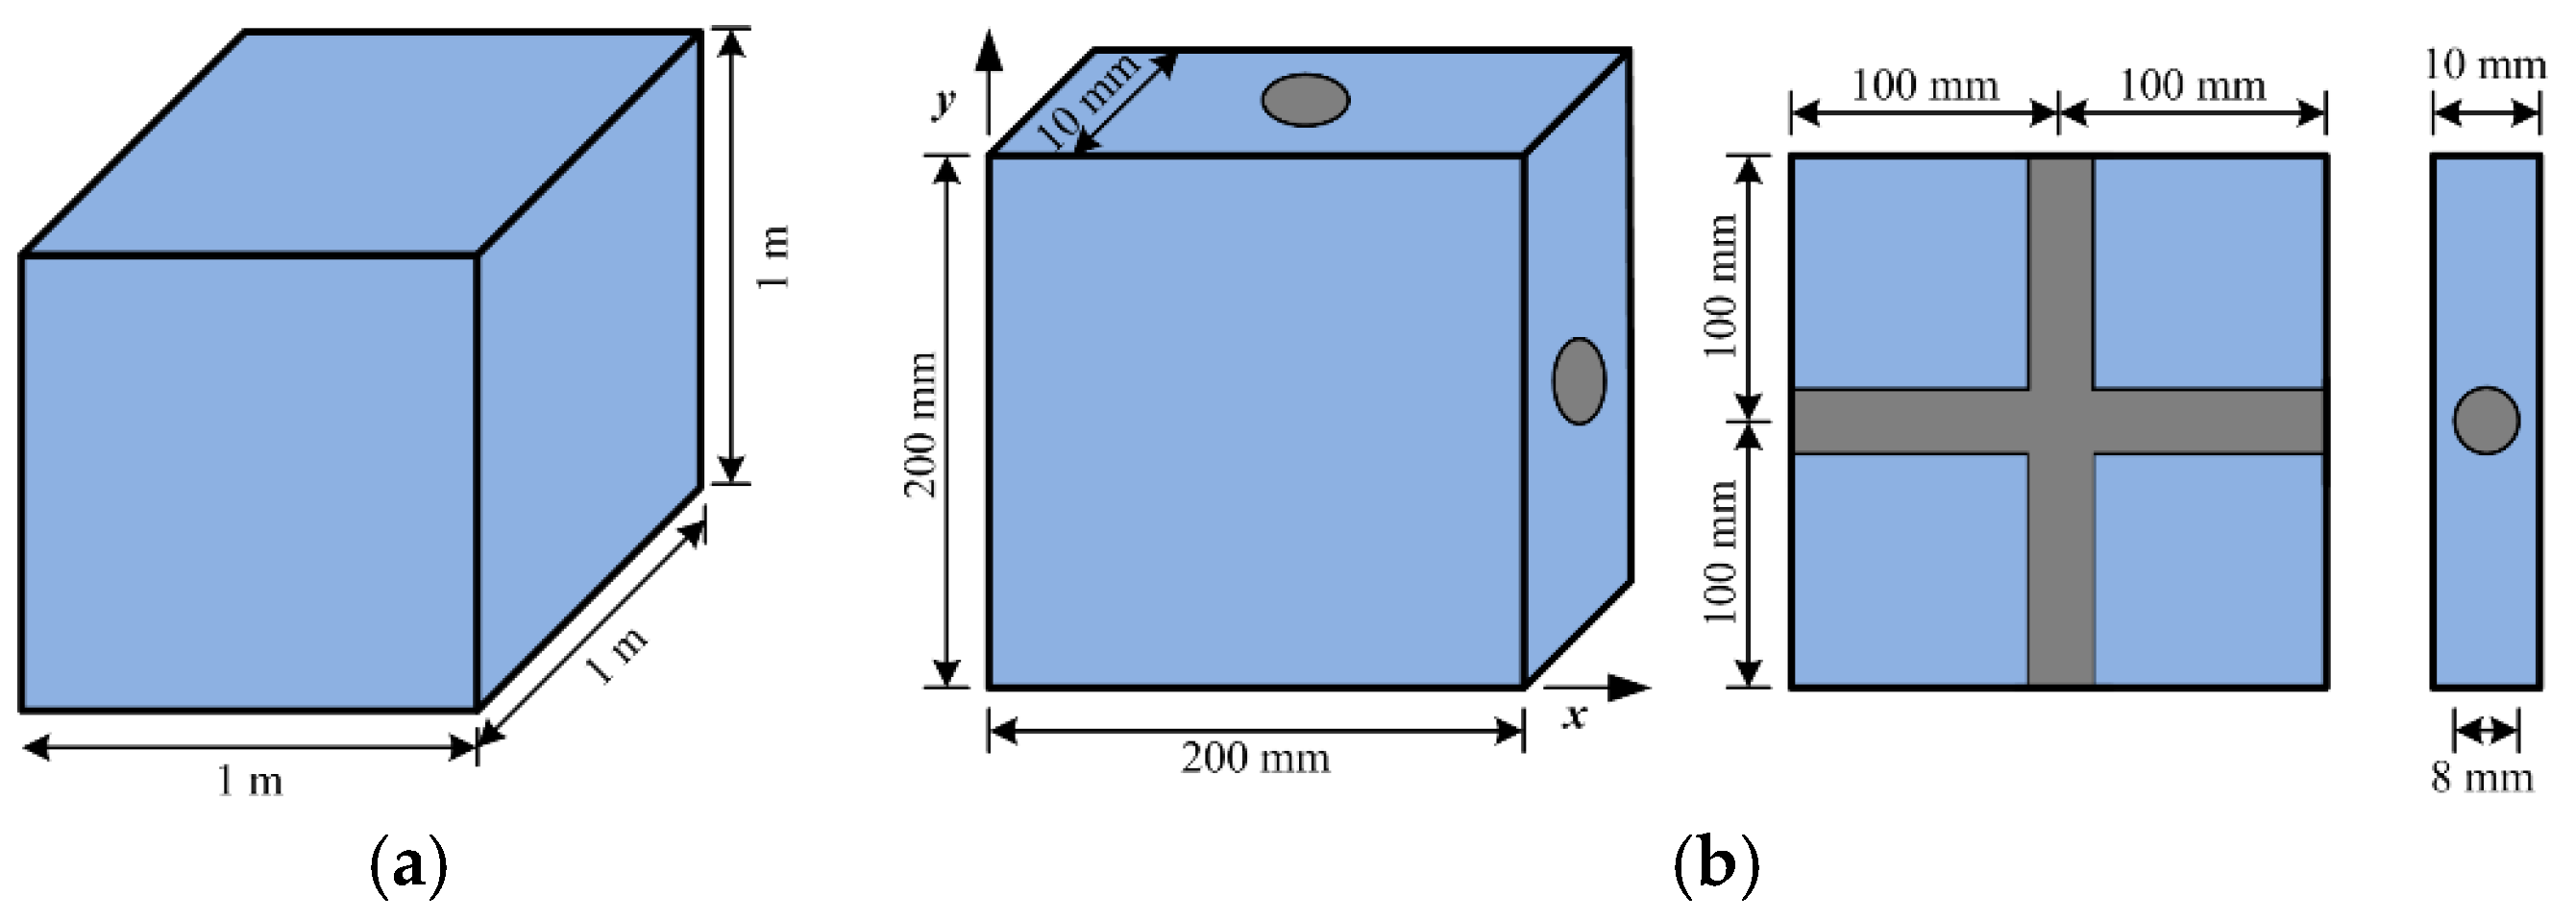
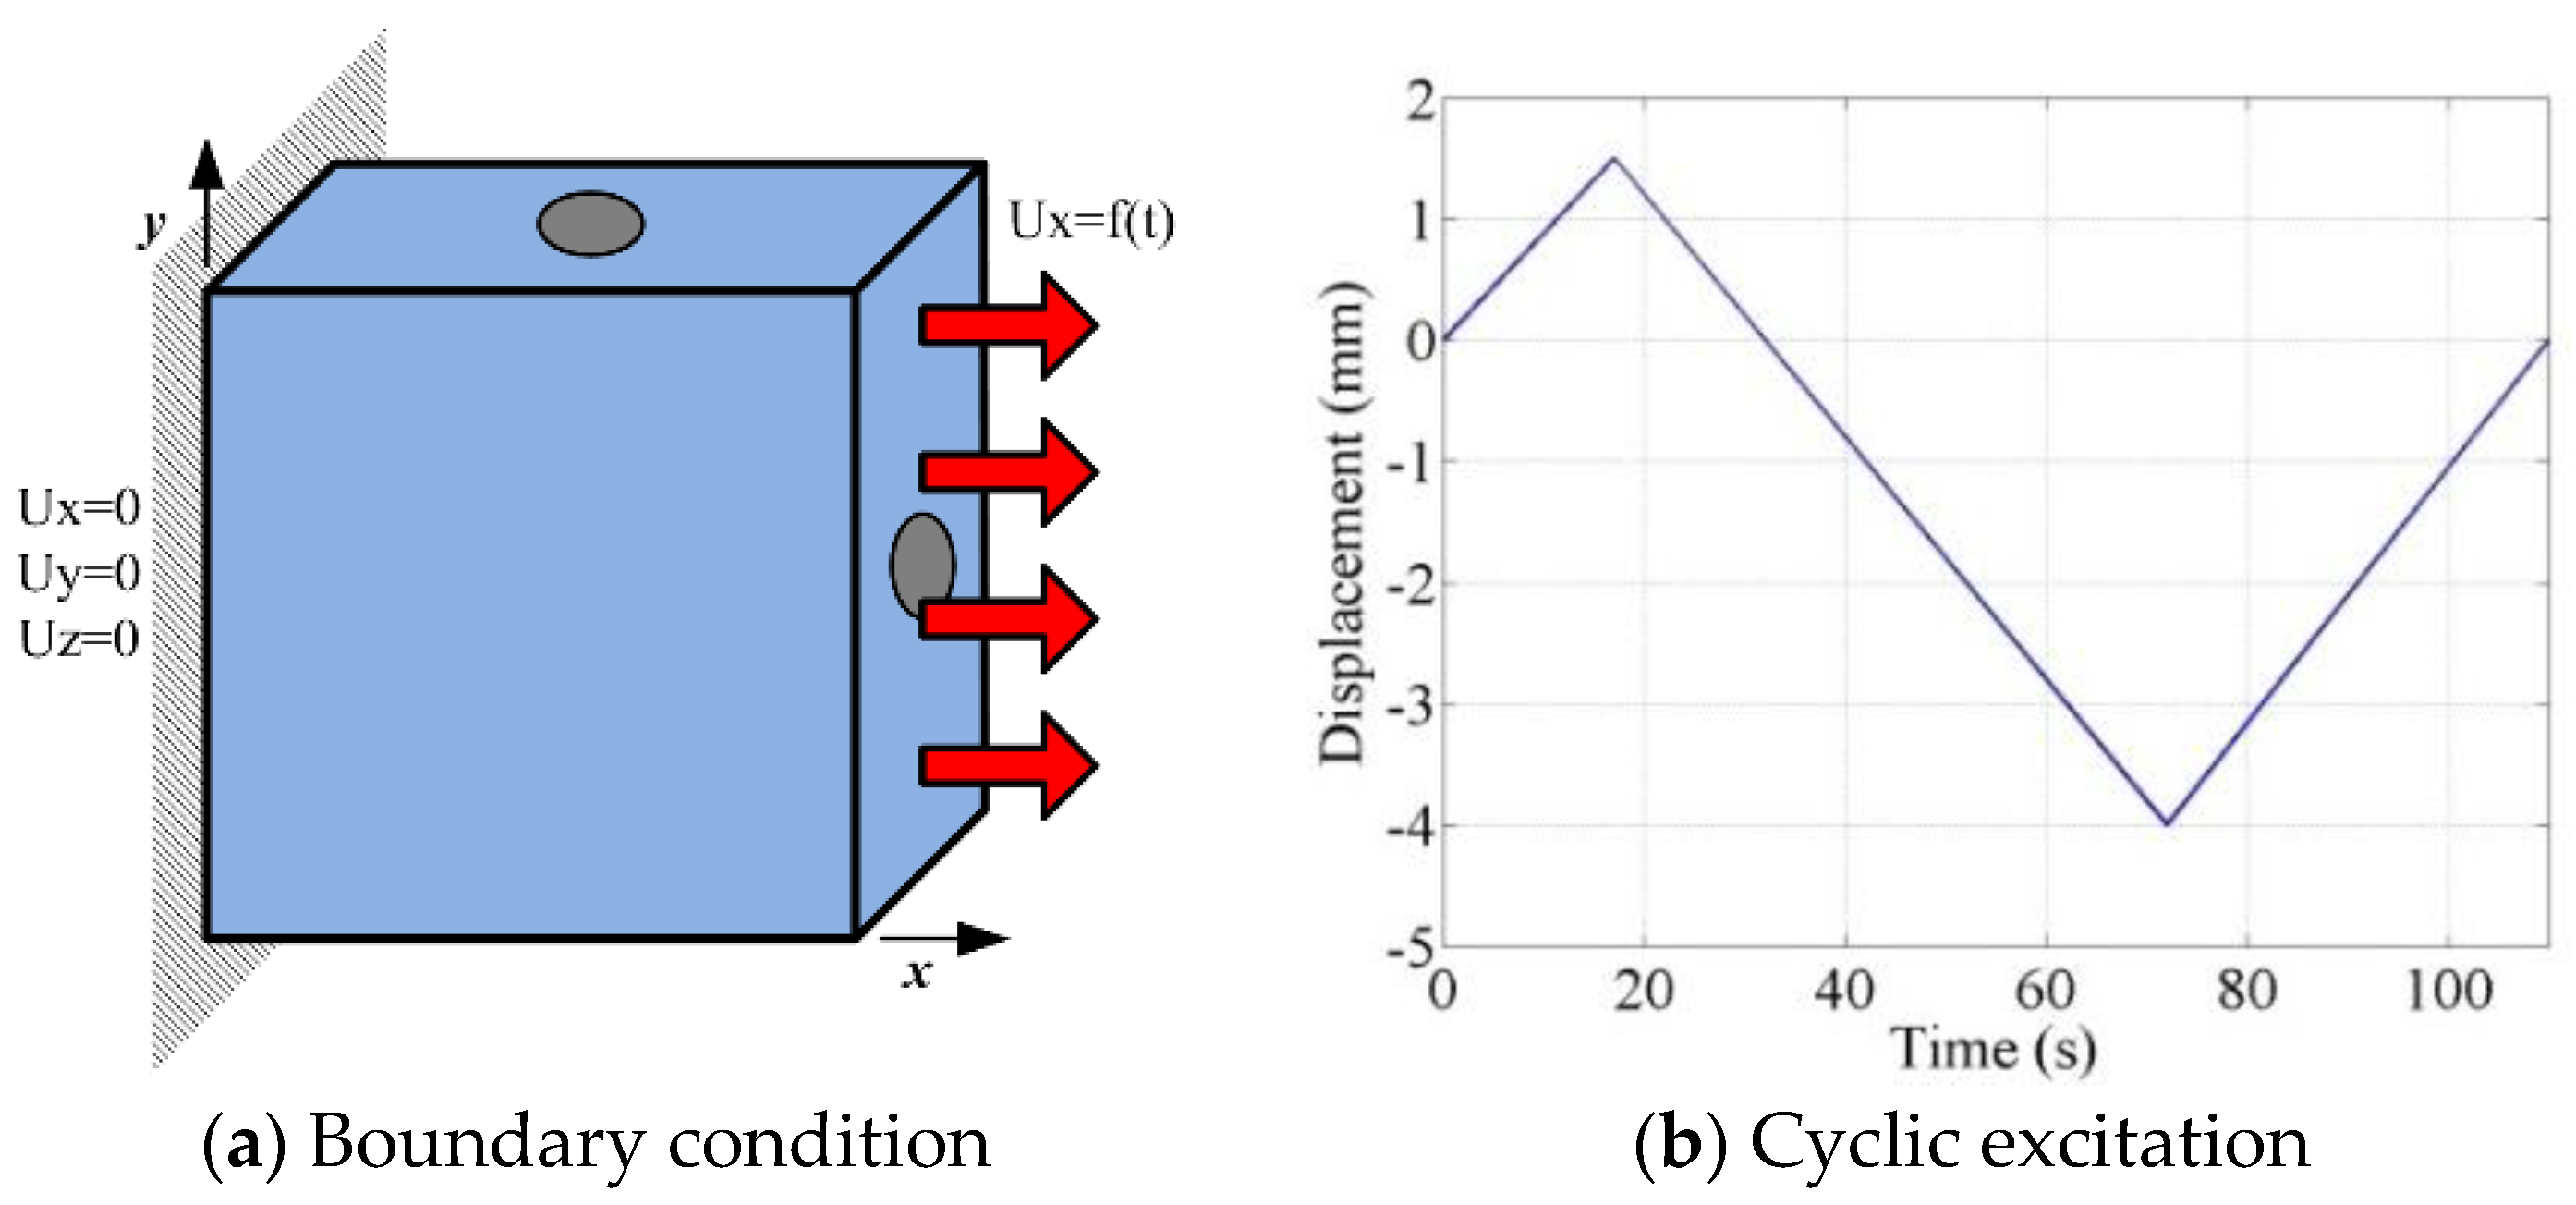
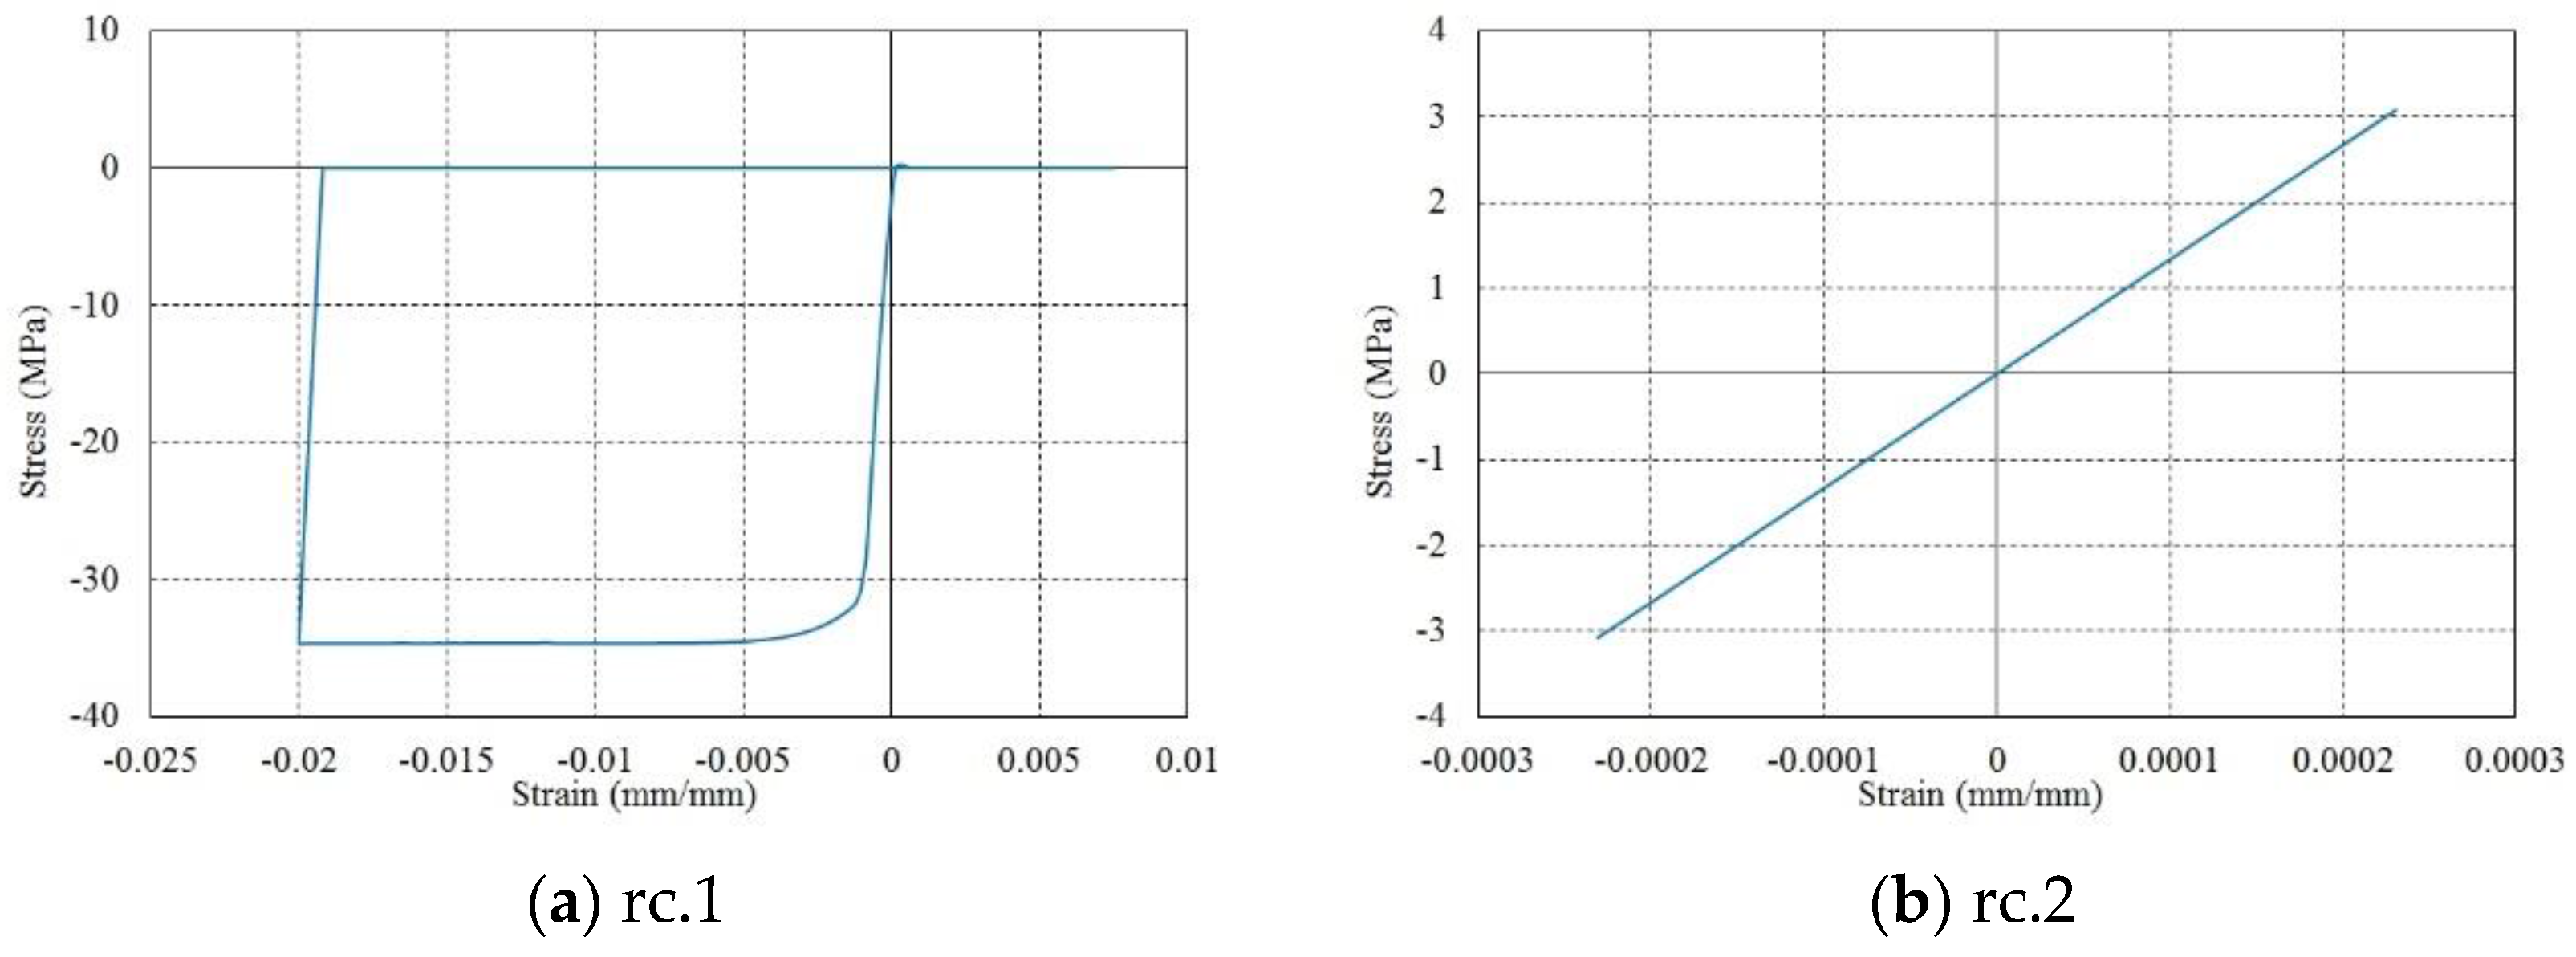
To validate the feasibility of the constitutive models, a local finite element test was performed on the RVEs. The local test consisted of uniaxial and biaxial cyclic loading tests on a concrete RVE, and a shear test on an RC RVE. The concrete RVE was a cube with a side length of 1 m, and the RC RVE was a cuboid with side lengths of 200 mm and a width of 10 mm, as shown in Figure 9. The local test configuration is described in Table 3. Figure 10 and Figure 11 show the boundary condition of the RVEs and the time history of cyclic loads, respectively, for local tests rc.1 and rc.2.
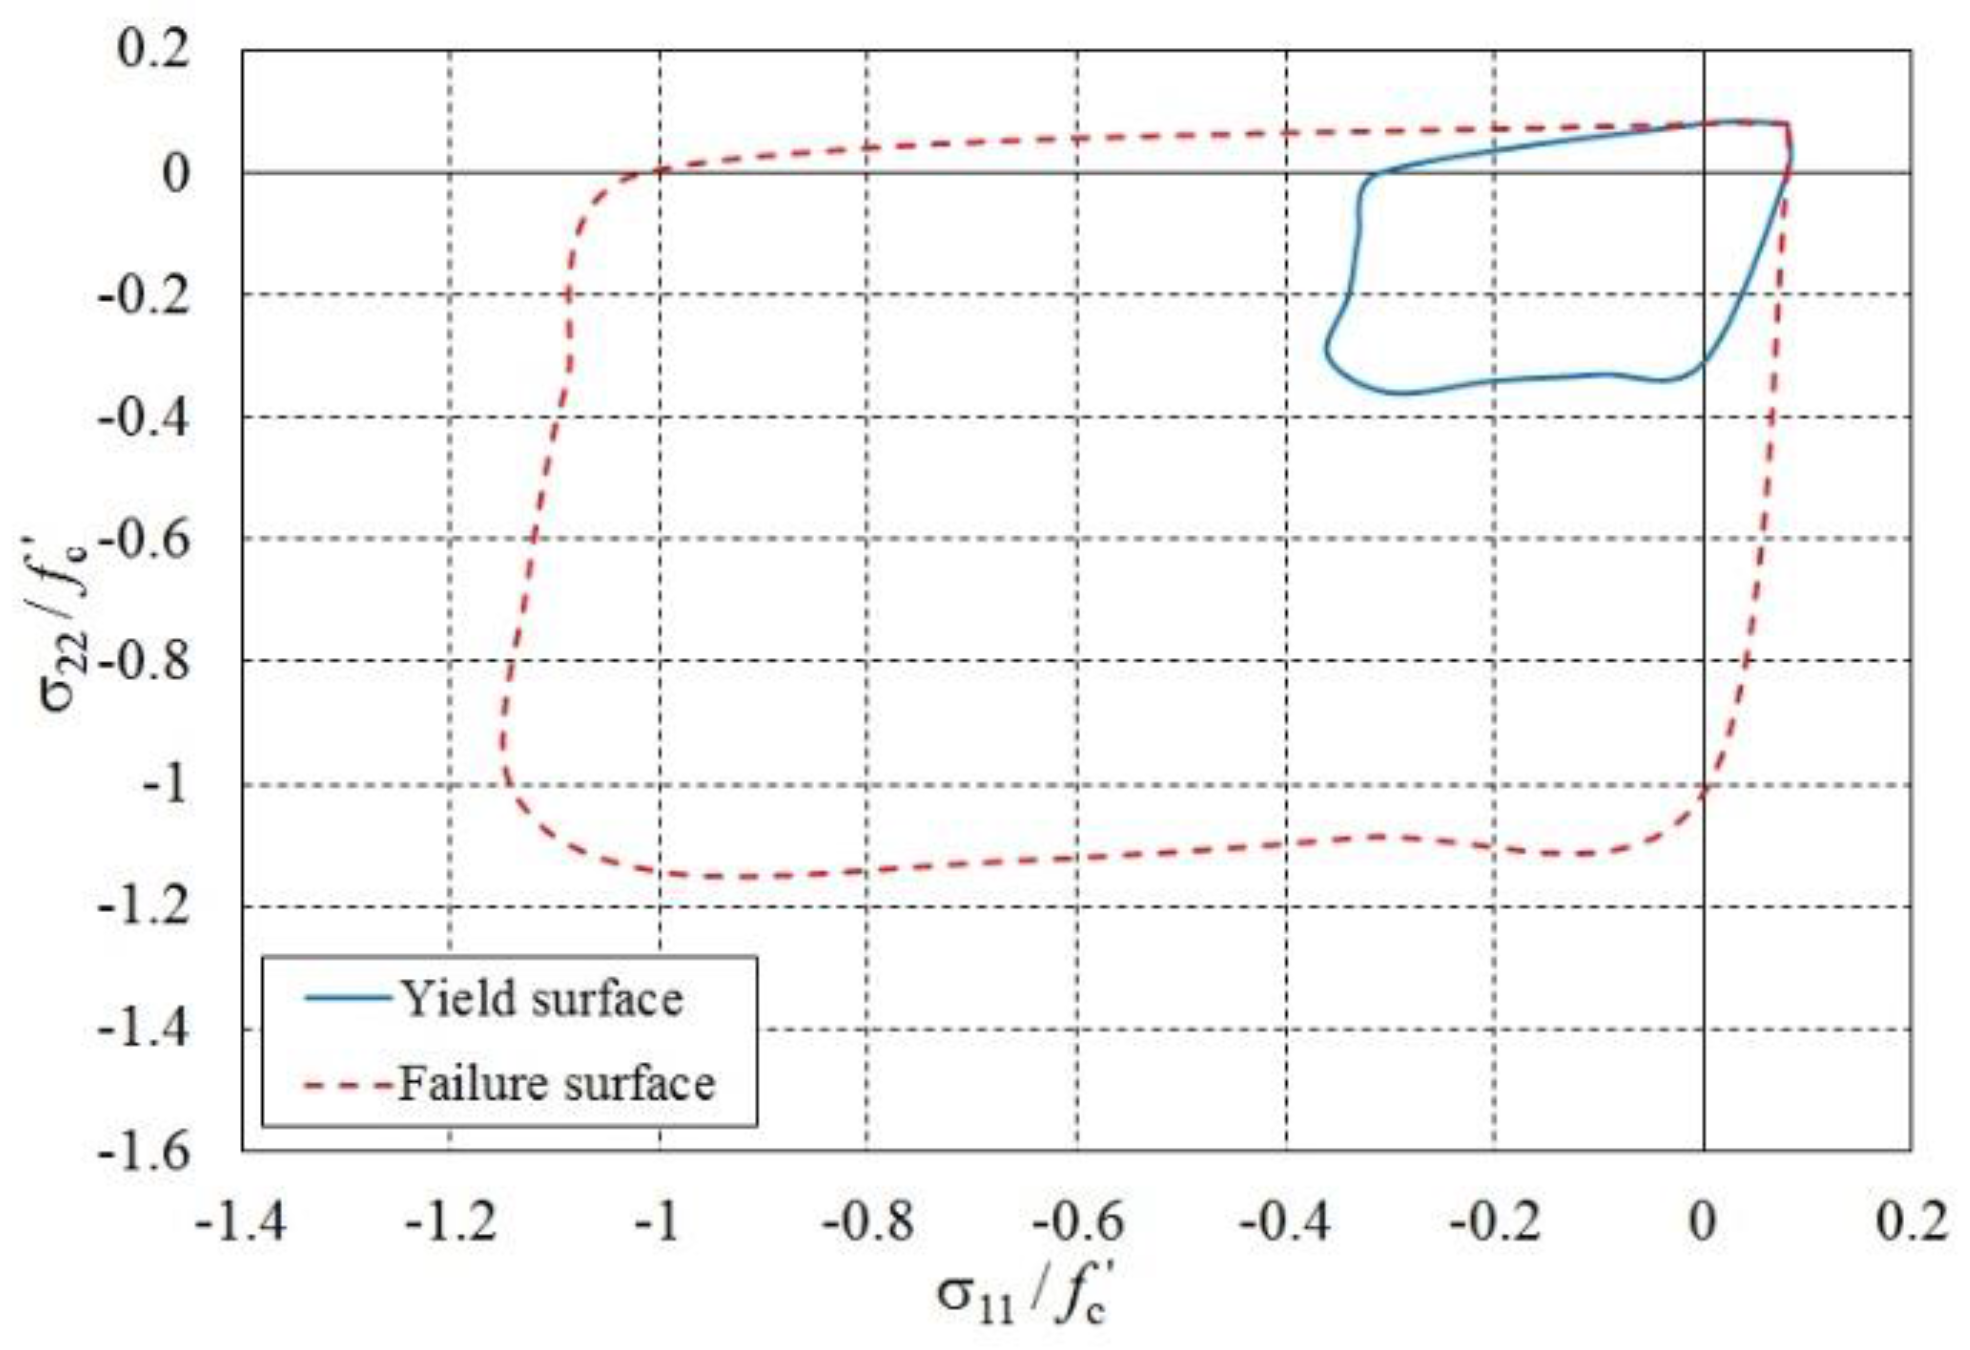
Figure 12 shows the yield and failure surfaces constructed from local test c.1 on the concrete RVE. The failure surface was constructed with the biaxial normal stresses where compressive crushing or tensile cracking occurred. In the case of equal biaxial loading, principal stresses in both and directions reached about at compressive failure, which shows the feasibility of the nonlinear material modeling in Section 3.1 and Section 3.2. Figure 13 shows the stress–strain response from local tests rc.1 and rc.2 on the RC RVE. The stress–strain response from the local test rc.1 was nonlinear because of the large deformation of the RVE, whereas the shear response from the test rc.2 remained linear. The local test showed that the material models of concrete and rebar worked well in the finite element analysis.
3.5. Finite Element Models of Structural Components
The SMART 2013 RC building consists of eight structural components: foundation, wall, slab, beam, column, rebar, steel plate, and shaking table. The rebar and steel plate are modeled with BEAM188 and SOLID185 elements, respectively, and the remaining six components are modeled with SOLID65 concrete element. SOLID185 is an eight-node solid element in ANSYS that is capable of modeling large deformation and stress stiffening. The rebar element was set to share the node with a concrete element in order to model the perfect bond between the two elements. Table 4 summarizes the total number of elements, the total number of nodes, and the number of solid and beam elements. Figure 14a shows the full structural model of the mock-up structure, including the shaking table. Figure 14b shows the rebar elements in the concrete slabs, walls, beams, and the column. Figure 14c–f exhibits modeling details for the slab connected to the column, the slab supported by floor beams, and the reinforcement in walls and slabs, respectively.
4. Validation of the Finite Element Model
4.1. Modal Analysis
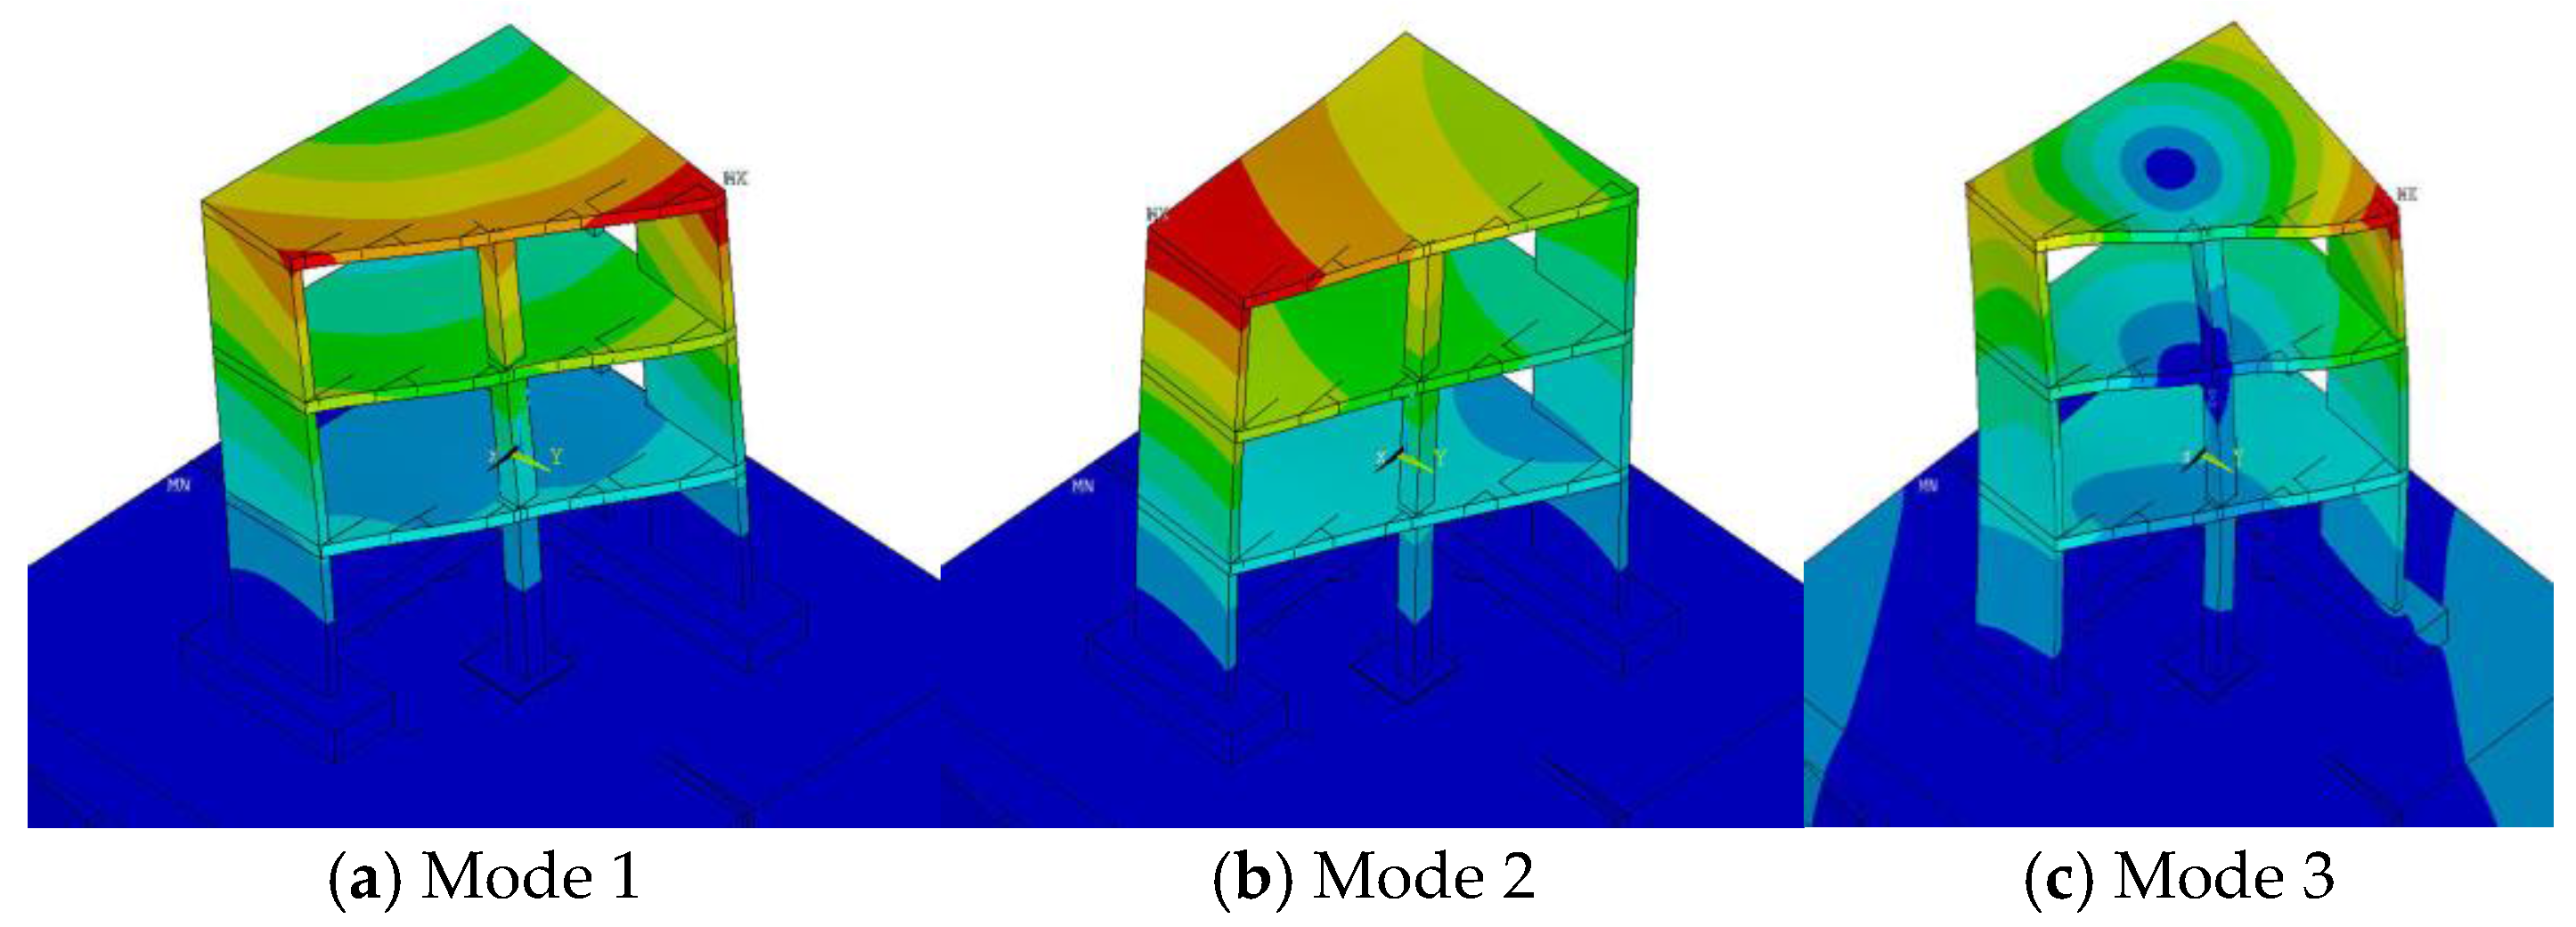
In order to validate the finite element modeling of the SMART 2013 RC structure, natural frequencies calculated by modal analysis were compared with those obtained by experiment. In the modal analysis, three different model configurations were investigated. In Case 1, the mock-up structure was fixed at the foundation level with no additional mass. In Case 2, the structure was fixed at the foundation level, and loaded with the additional mass on each floor. In Case 3, the structure was connected to the shaking table and loaded with the additional mass on each floor, similar to Case 2. The actuator locations were set as fixed boundaries. Table 5 presents the first three natural frequencies that were calculated for each model case, along with the experimentally obtained natural frequencies for Case 3 [30,31,32,33]. The computed first three natural frequencies for the Case 3 were 6.26 Hz, 7.77 Hz, and 13.15 Hz, respectively, and they are close to the experiment results. The modal analysis used a reduced integration method in order to reduce the stiffness of the RC structure, and thus relieve the stiffer simulation that results when solid elements are used. The reduced integration method was also used in the subsequent seismic simulation. Figure 15, Figure 16 and Figure 17 show the mode shape for each case of model configurations. The first and second modes were bending modes to - and -axes, respectively, while the third mode is a torsional mode to the -axis. As seen in the figures, the structure exhibited torsional behavior in all three modes because of its asymmetrical shape.
4.2. Seismic Analysis to Low-Intensity Ground Motions
Alongside the modal analysis result, the seismic response of the SMART 2013 structure to low-intensity ground motions was investigated. A classical Rayleigh damping was introduced to the SMART 2013 RC building with the following equation:
where M and K are the mass and stiffness matrices of the structure, respectively. The two coefficients α and β are determined by solving the following system of equations:
where and are the natural frequencies corresponding to modes and , respectively, and and are the modal damping ratios for each mode. Table 6 shows the natural frequencies of the first three modes, and the corresponding modal damping ratios obtained by modal experiments. The modal damping ratios were obtained by analyzing the response of the structure with 28 accelerometers under the low-level (PGA < 0.1 g) biaxial random ground motion using a stochastic subspace identification bottom approach [23]. The coefficients and were calculated by solving Equation (11) using the frequencies and damping ratios for the first and second modes. The calculated α and β are −1.649 and 0.002, respectively.
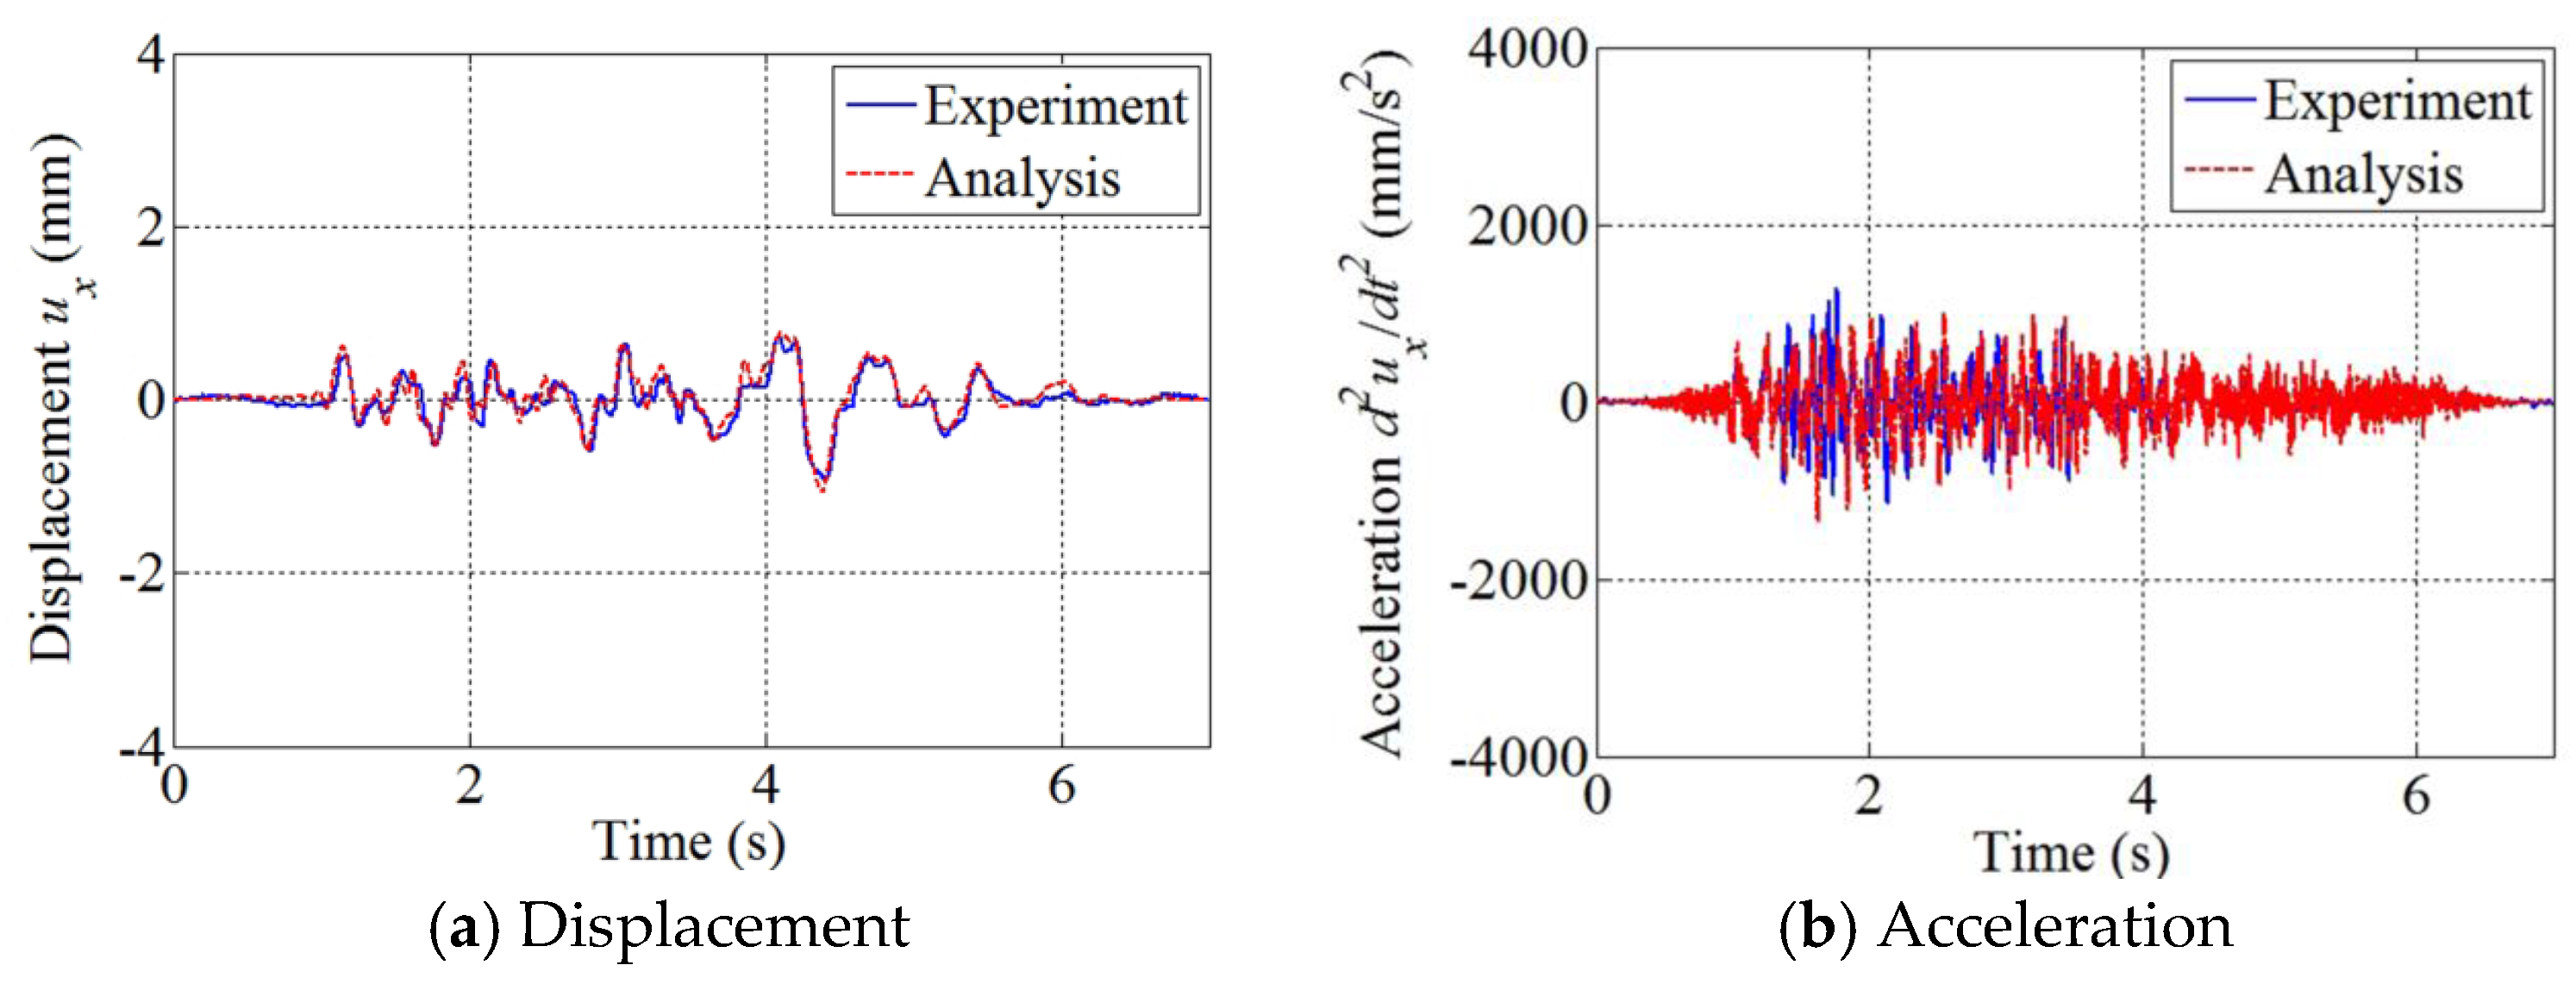
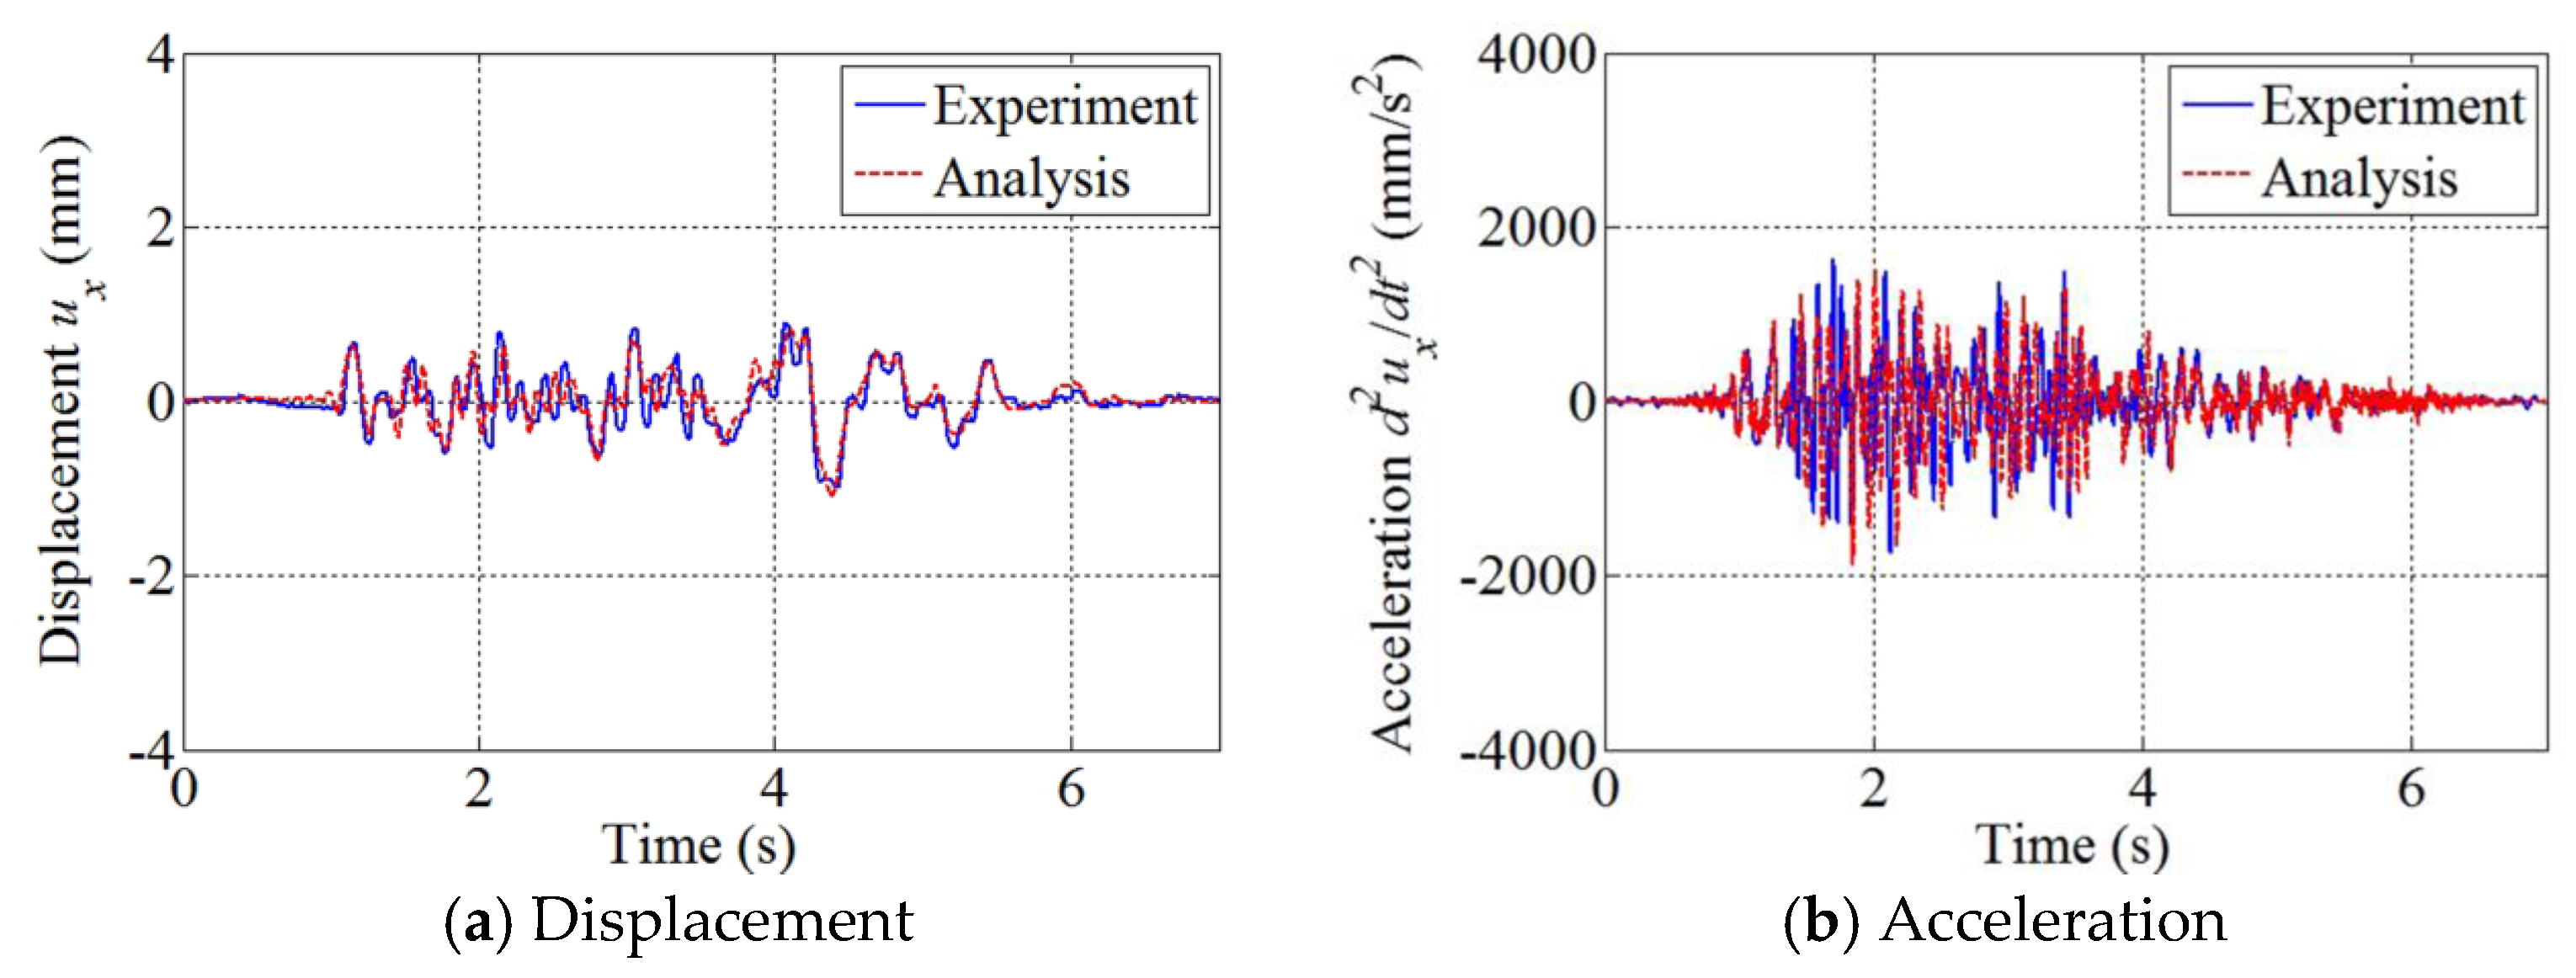
Figure 18 shows the time history of the low-intensity ground motion. The time signal is the one scaled by 50% from the Northridge earthquake. The PGA is about 0.1 g in both the x and y directions. The structural response to the ground motion is calculated without considering material nonlinearity. Figure 19, Figure 20 and Figure 21 show the seismic response of each floor of the SMART 2013 RC structure to the low-intensity ground motion at sampling point A. The calculated displacement and acceleration showed excellent agreement with the experimental results.
Table 7 presents the absolute maximum seismic response of the structure at the sampling point A. Both the displacement and acceleration values agreed quite well with the experimental results.
5. Nonlinear Seismic Response of the SMART 2013 RC Structure
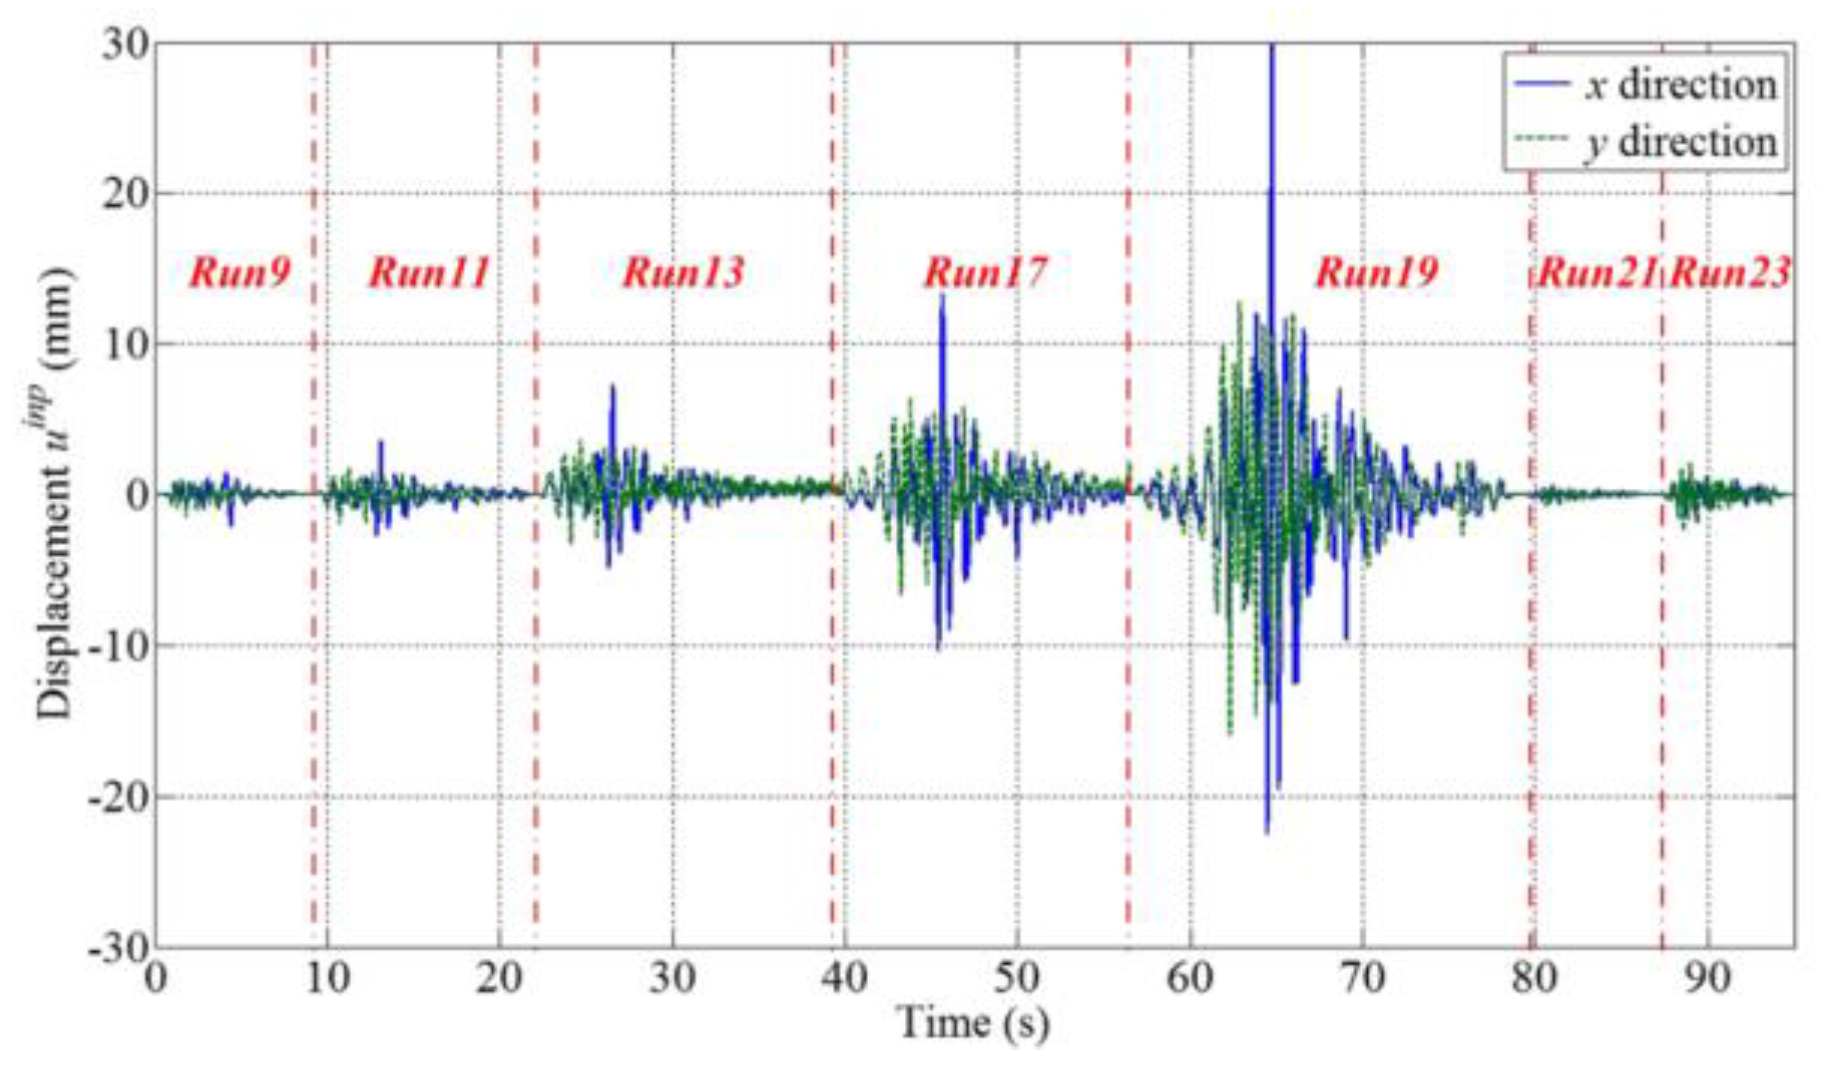
After the seismic simulation to the low-intensity ground motion, the inelastic seismic response of the asymmetric three-storey RC structure subjected to high-intensity ground motions was investigated. Such a nonlinear analysis was part of the SMART 2013 international benchmark. The analysis case consisted of several simulations for three different seismic sequences: the design signal (Run 9), the Northridge earthquake main shocks (Run 11, Run 13, Run 17, and Run 19), and the Northridge aftershock (Run 21 and Run 23). The “Runs” are different regarding the strength of the ground motions. The PGA of each ground motion is presented in Table 8. The ground motion of Run 19 is the unscaled Northridge earthquake with PGAs of 1.1 g and 1.0 g in the x and y directions, respectively. Figure 22 shows the time history of the input ground motion used for the nonlinear seismic analysis.
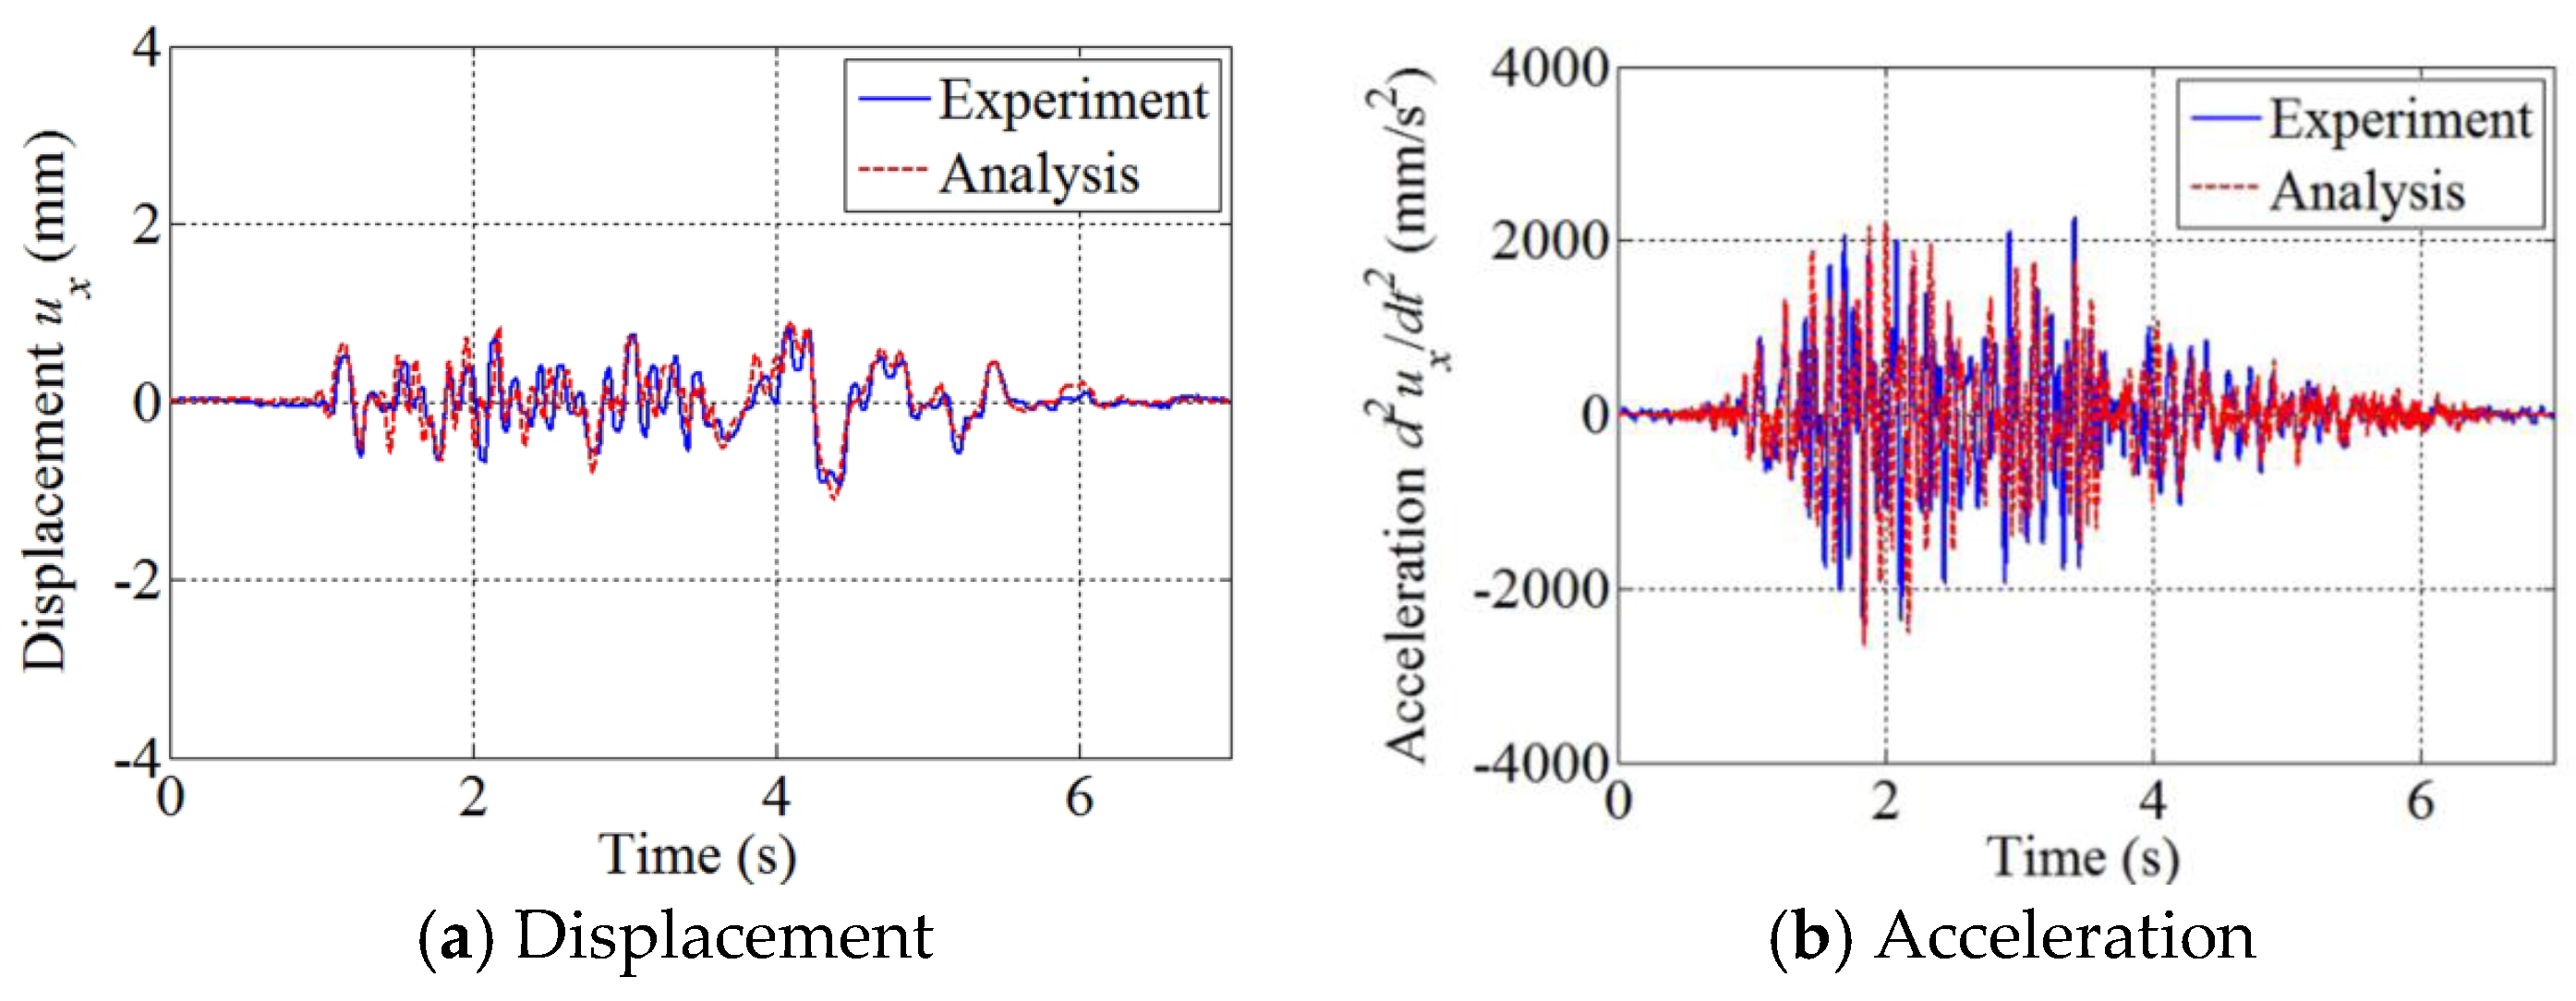
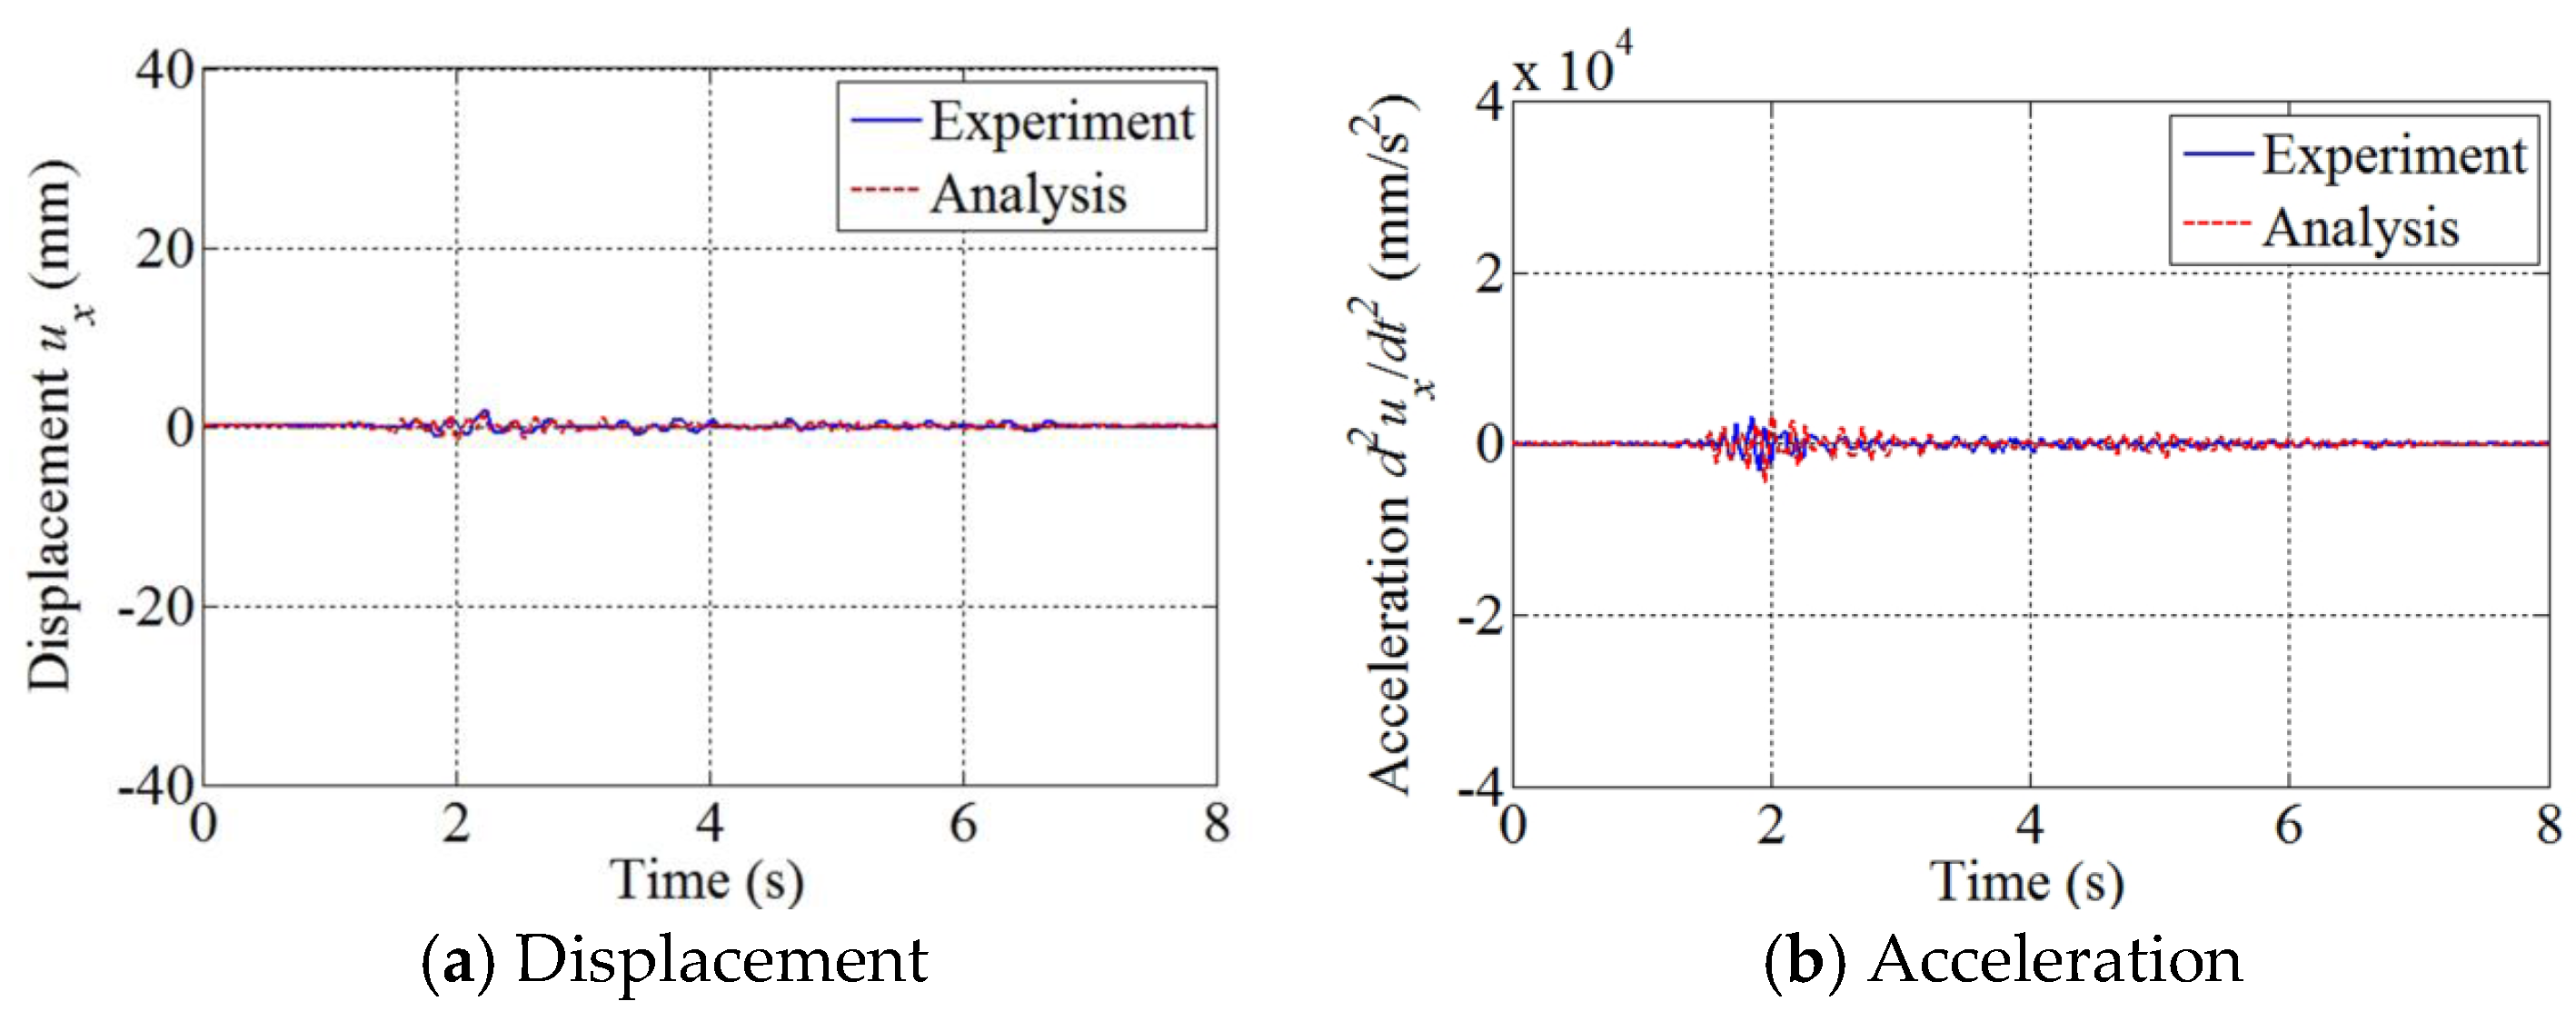
First, the ground displacement of Run 9 was applied to the structure at the actuator locations of the shaking table. Figure 23 shows the experimental and numerical responses of the structure in the x direction sampled at point A of the third floor. The numerical response agreed well with the experimental result. The absolute maximum values of displacement and acceleration obtained from the shaking table test were 2.02 mm and 4100 , respectively. They are about twice as high as the responses to the low-intensity ground motion in Section 4.2, where the earthquake signal is scaled by 50%.
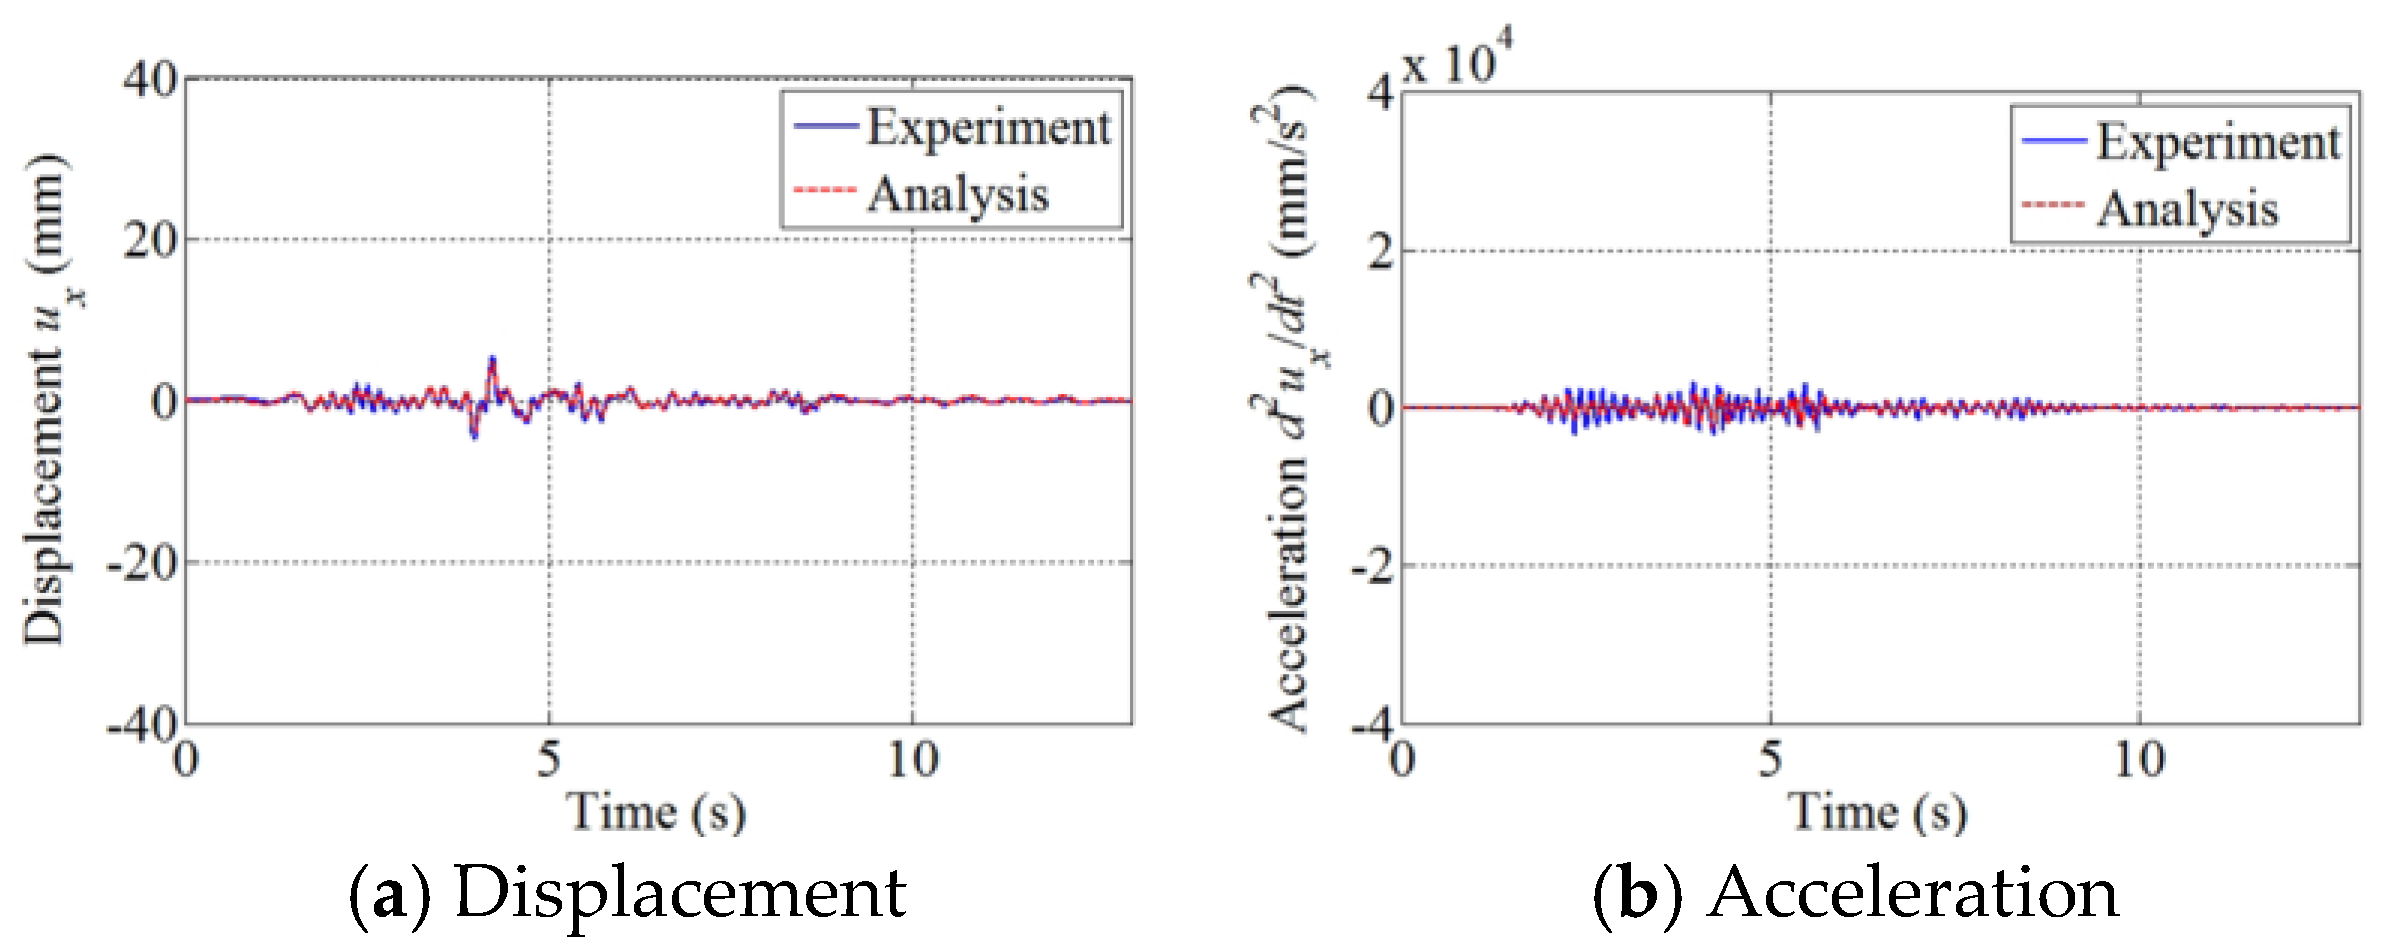
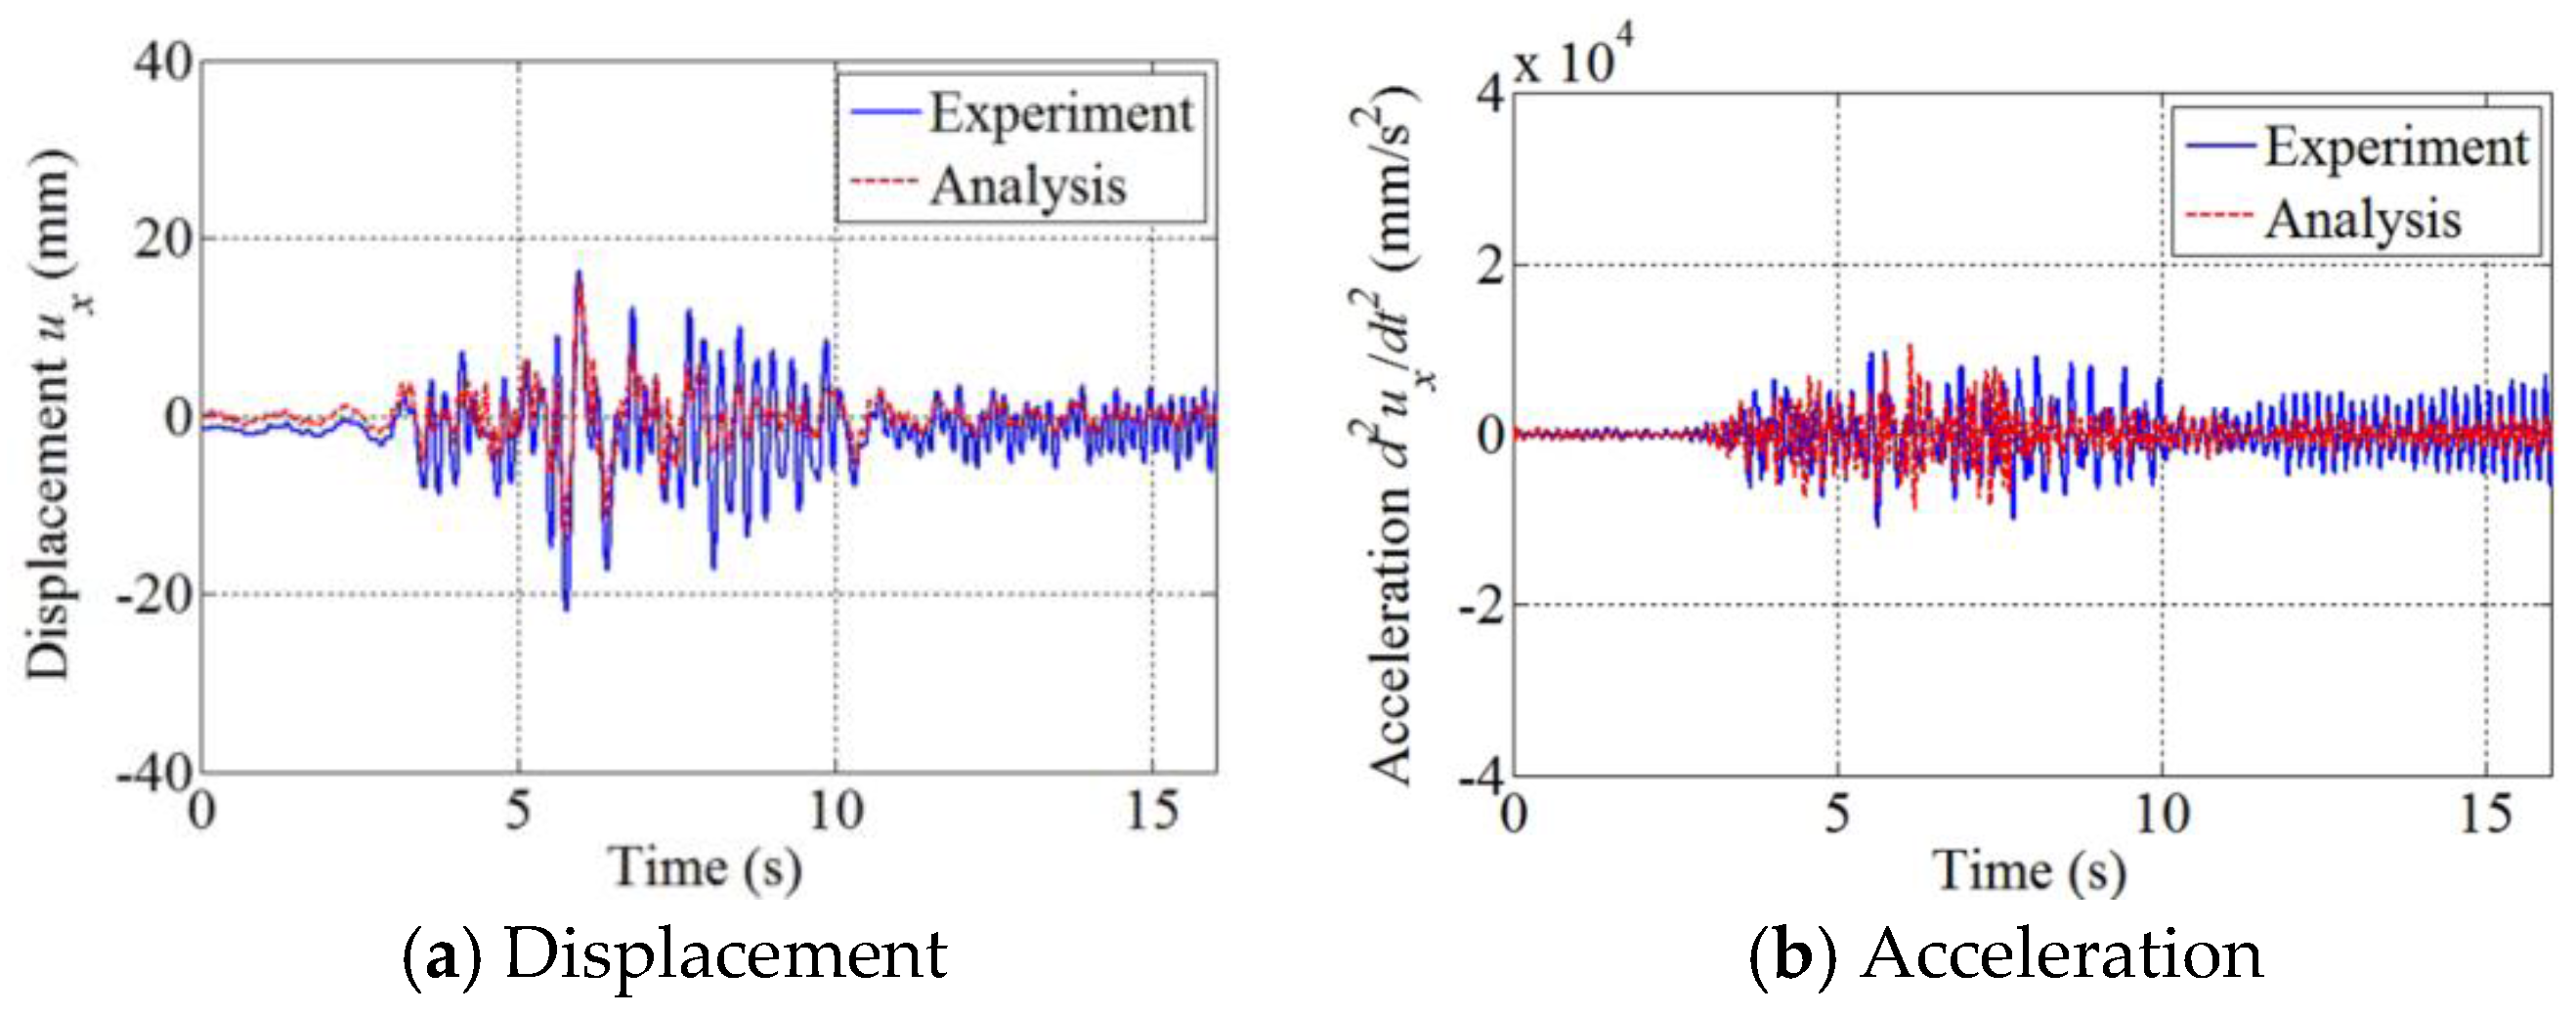
Following Run 9, the Northridge earthquake’s main shocks (Run 11, Run 13, Run 17, and Run 19) with successively increasing PGA were applied to the structure at the actuator locations of the shaking table. Figure 24, Figure 25, Figure 26 and Figure 27 show the displacement and acceleration at point A of the third floor. Overall, the numerical responses agreed well with experimental results, even during the high-intensity ground motions. The response was largest in the case of Run 19, where the absolute maximum displacement and acceleration were 36.73 mm and 22,420 (2.28 g), respectively. These values are about 13.4 and 5.8 times higher than the calculated responses from Run 9, respectively.
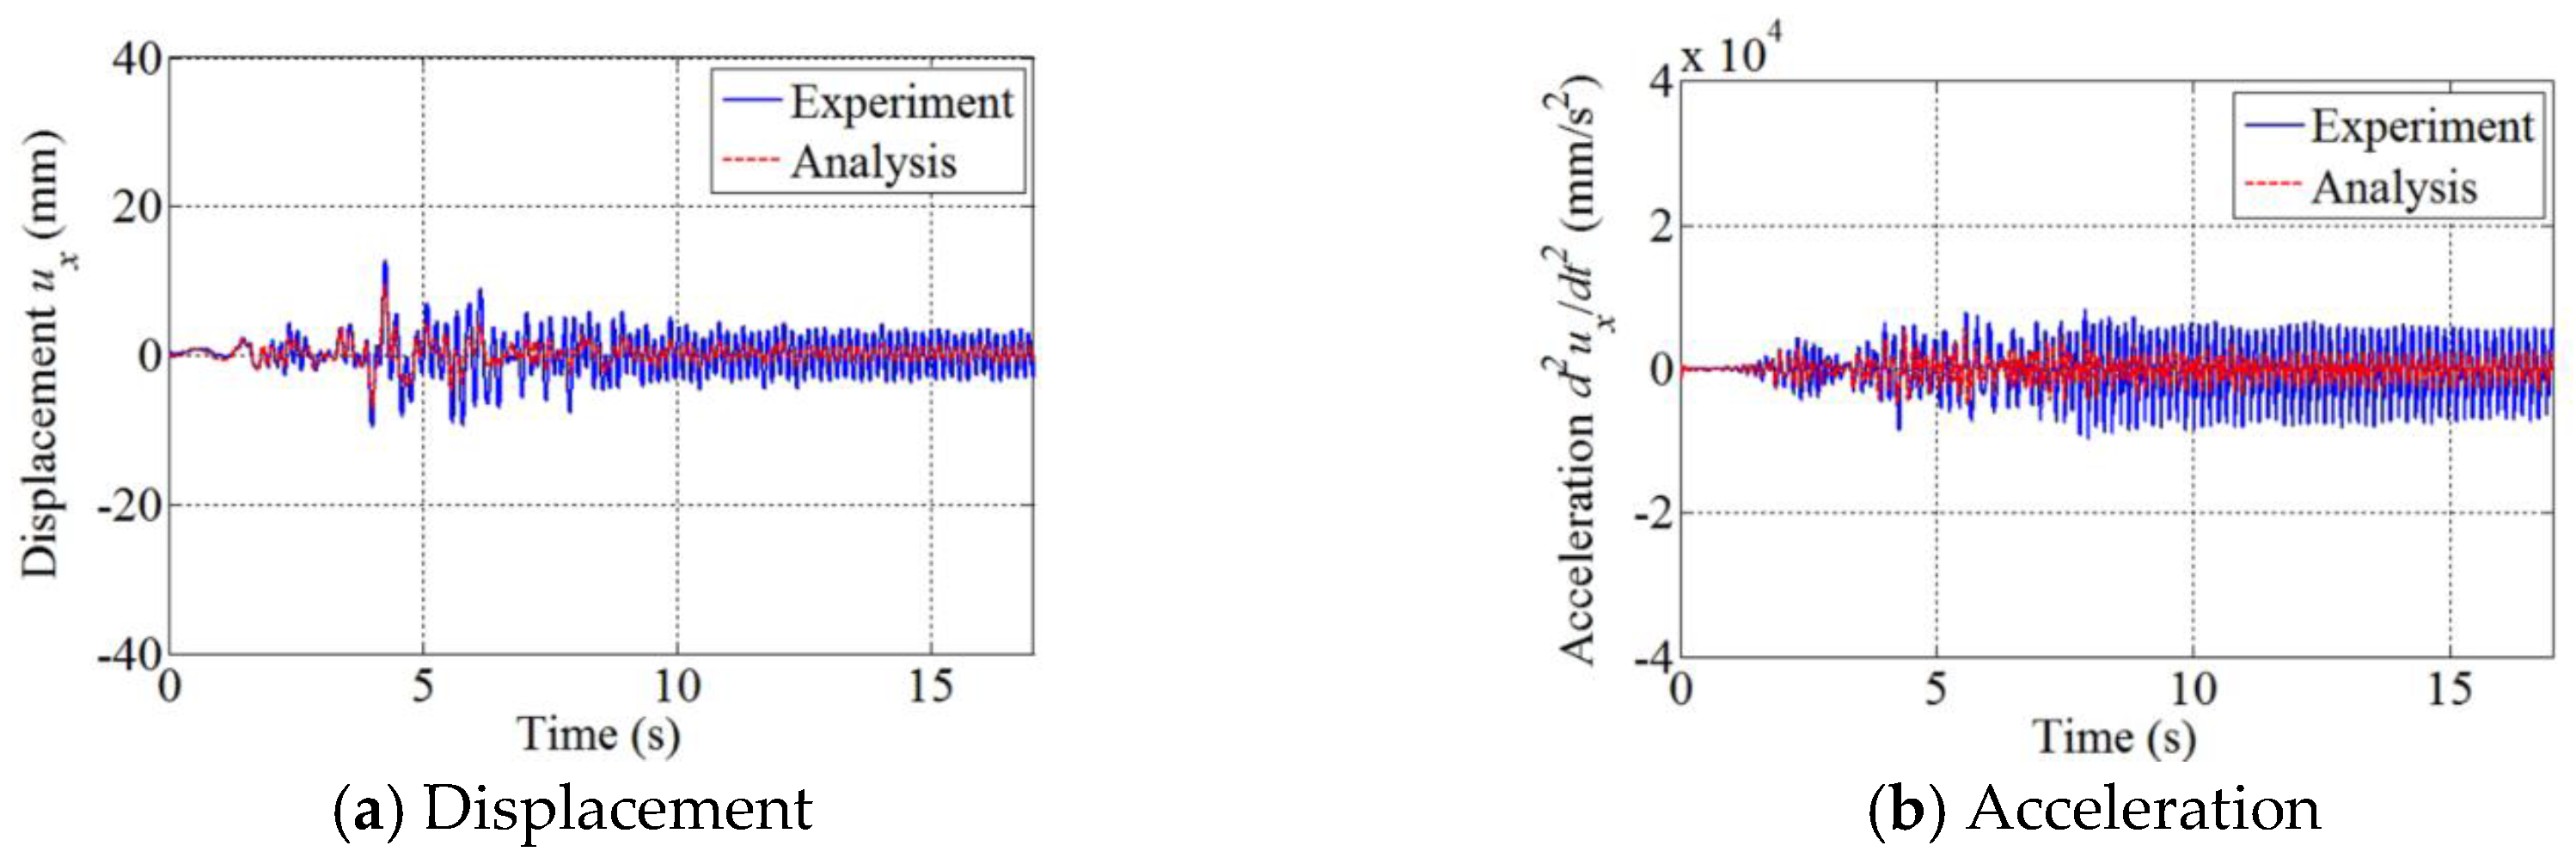
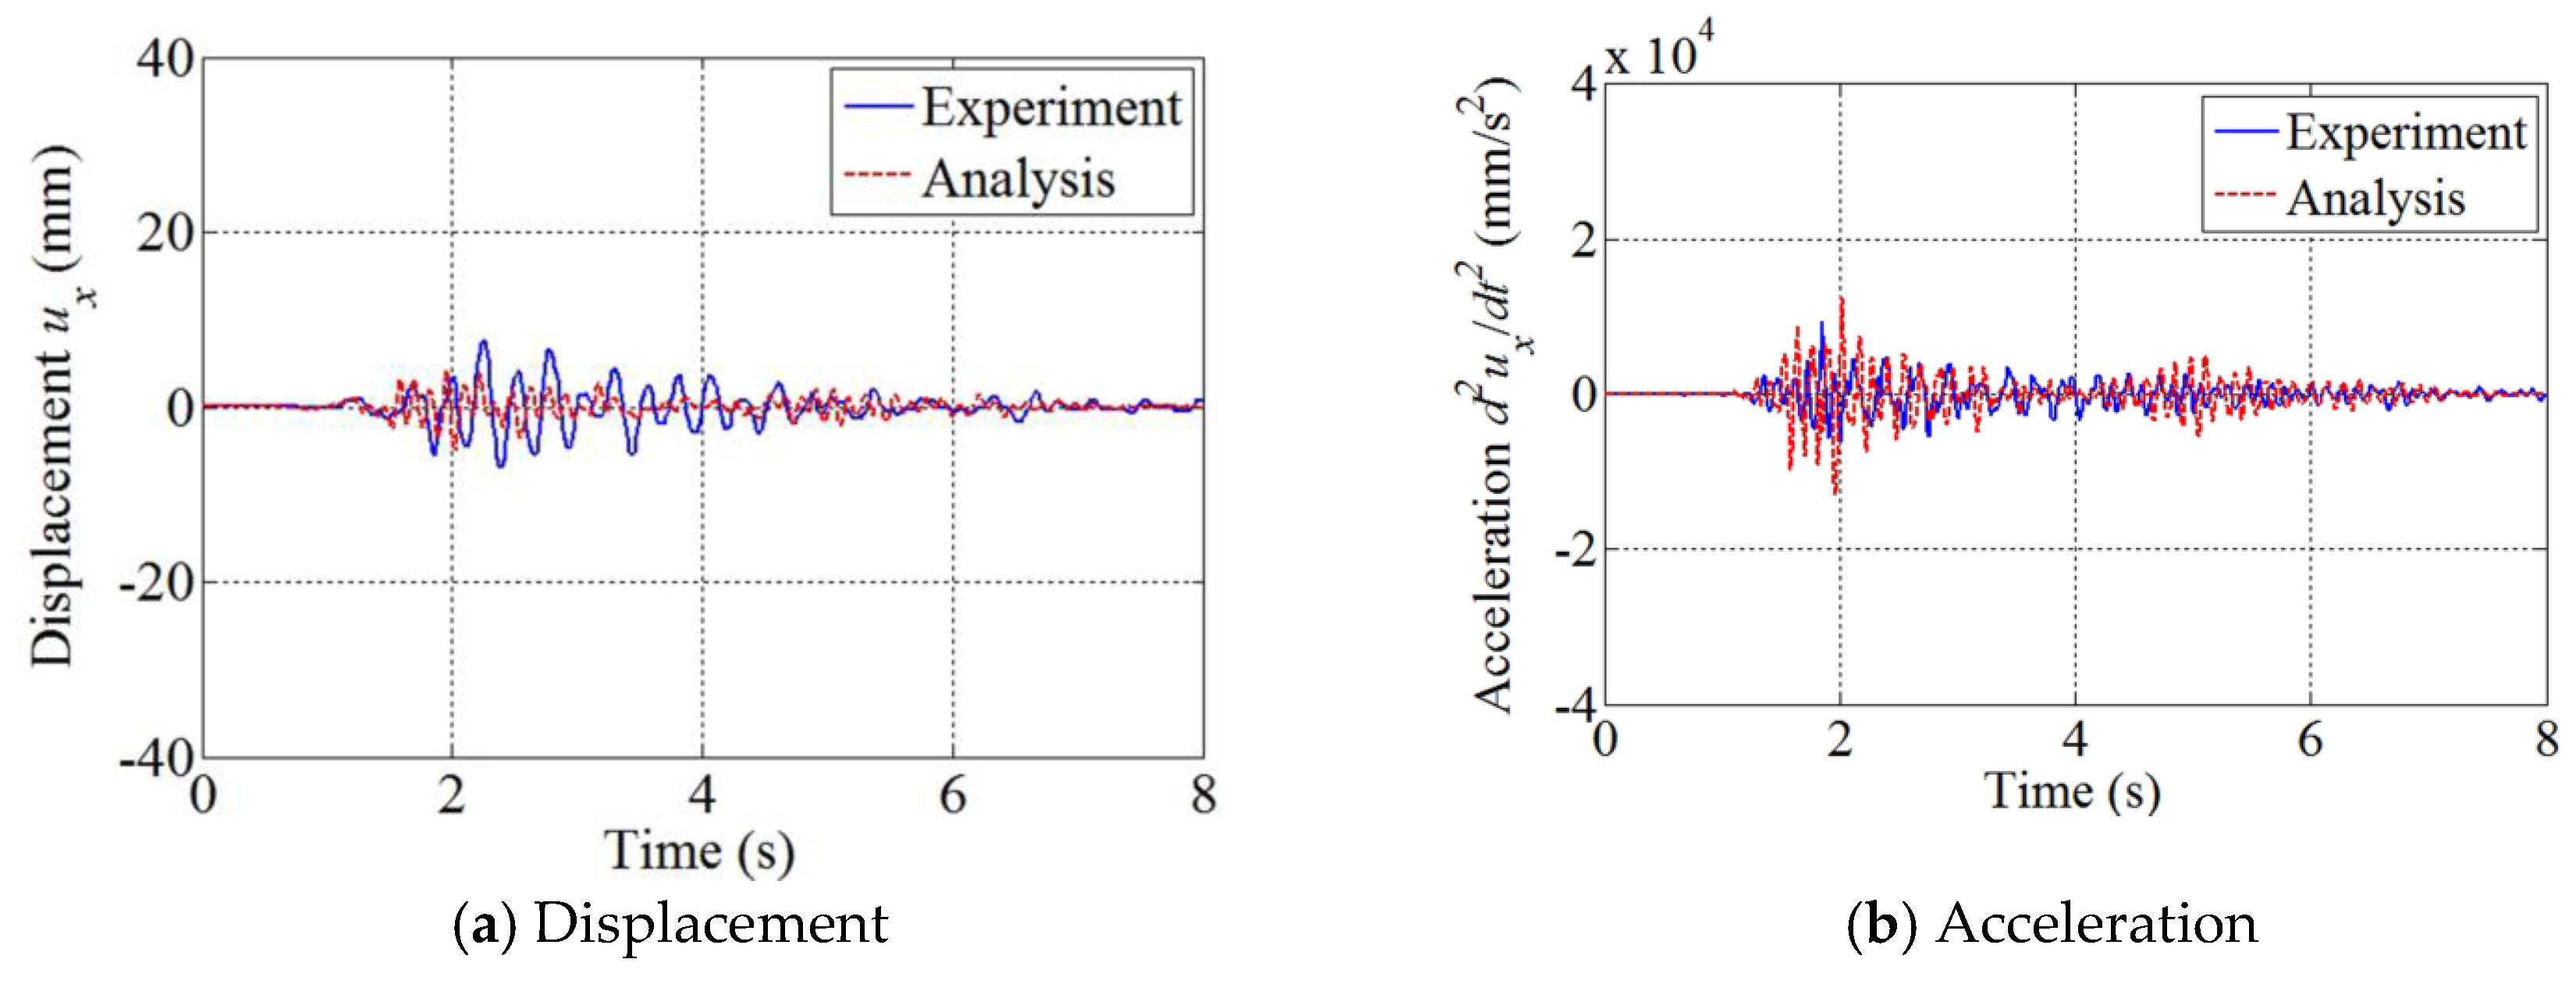
In Run 13, the numerical response does not reflect the high-frequency experimental response well after about 5 s. This difference in response may be due to a gradual error in predicting structural stiffness during numerical analysis [34,35]. Despite the partial difference between the numerical and experimental results, the computed displacement and acceleration appear to capture the general trend of the experimental seismic behavior of the structure. After Run 13, the first three natural frequencies of the structure decreased by 26.66%, 19.98%, and 17.72%, respectively. These results implied that the stiffness of the SMART 2013 RC structure decreased after Run 13 compared to its initial stiffness. In the shaking table test corresponding to Run 13, significant cracks began to develop at the lower part of concrete walls and the column.
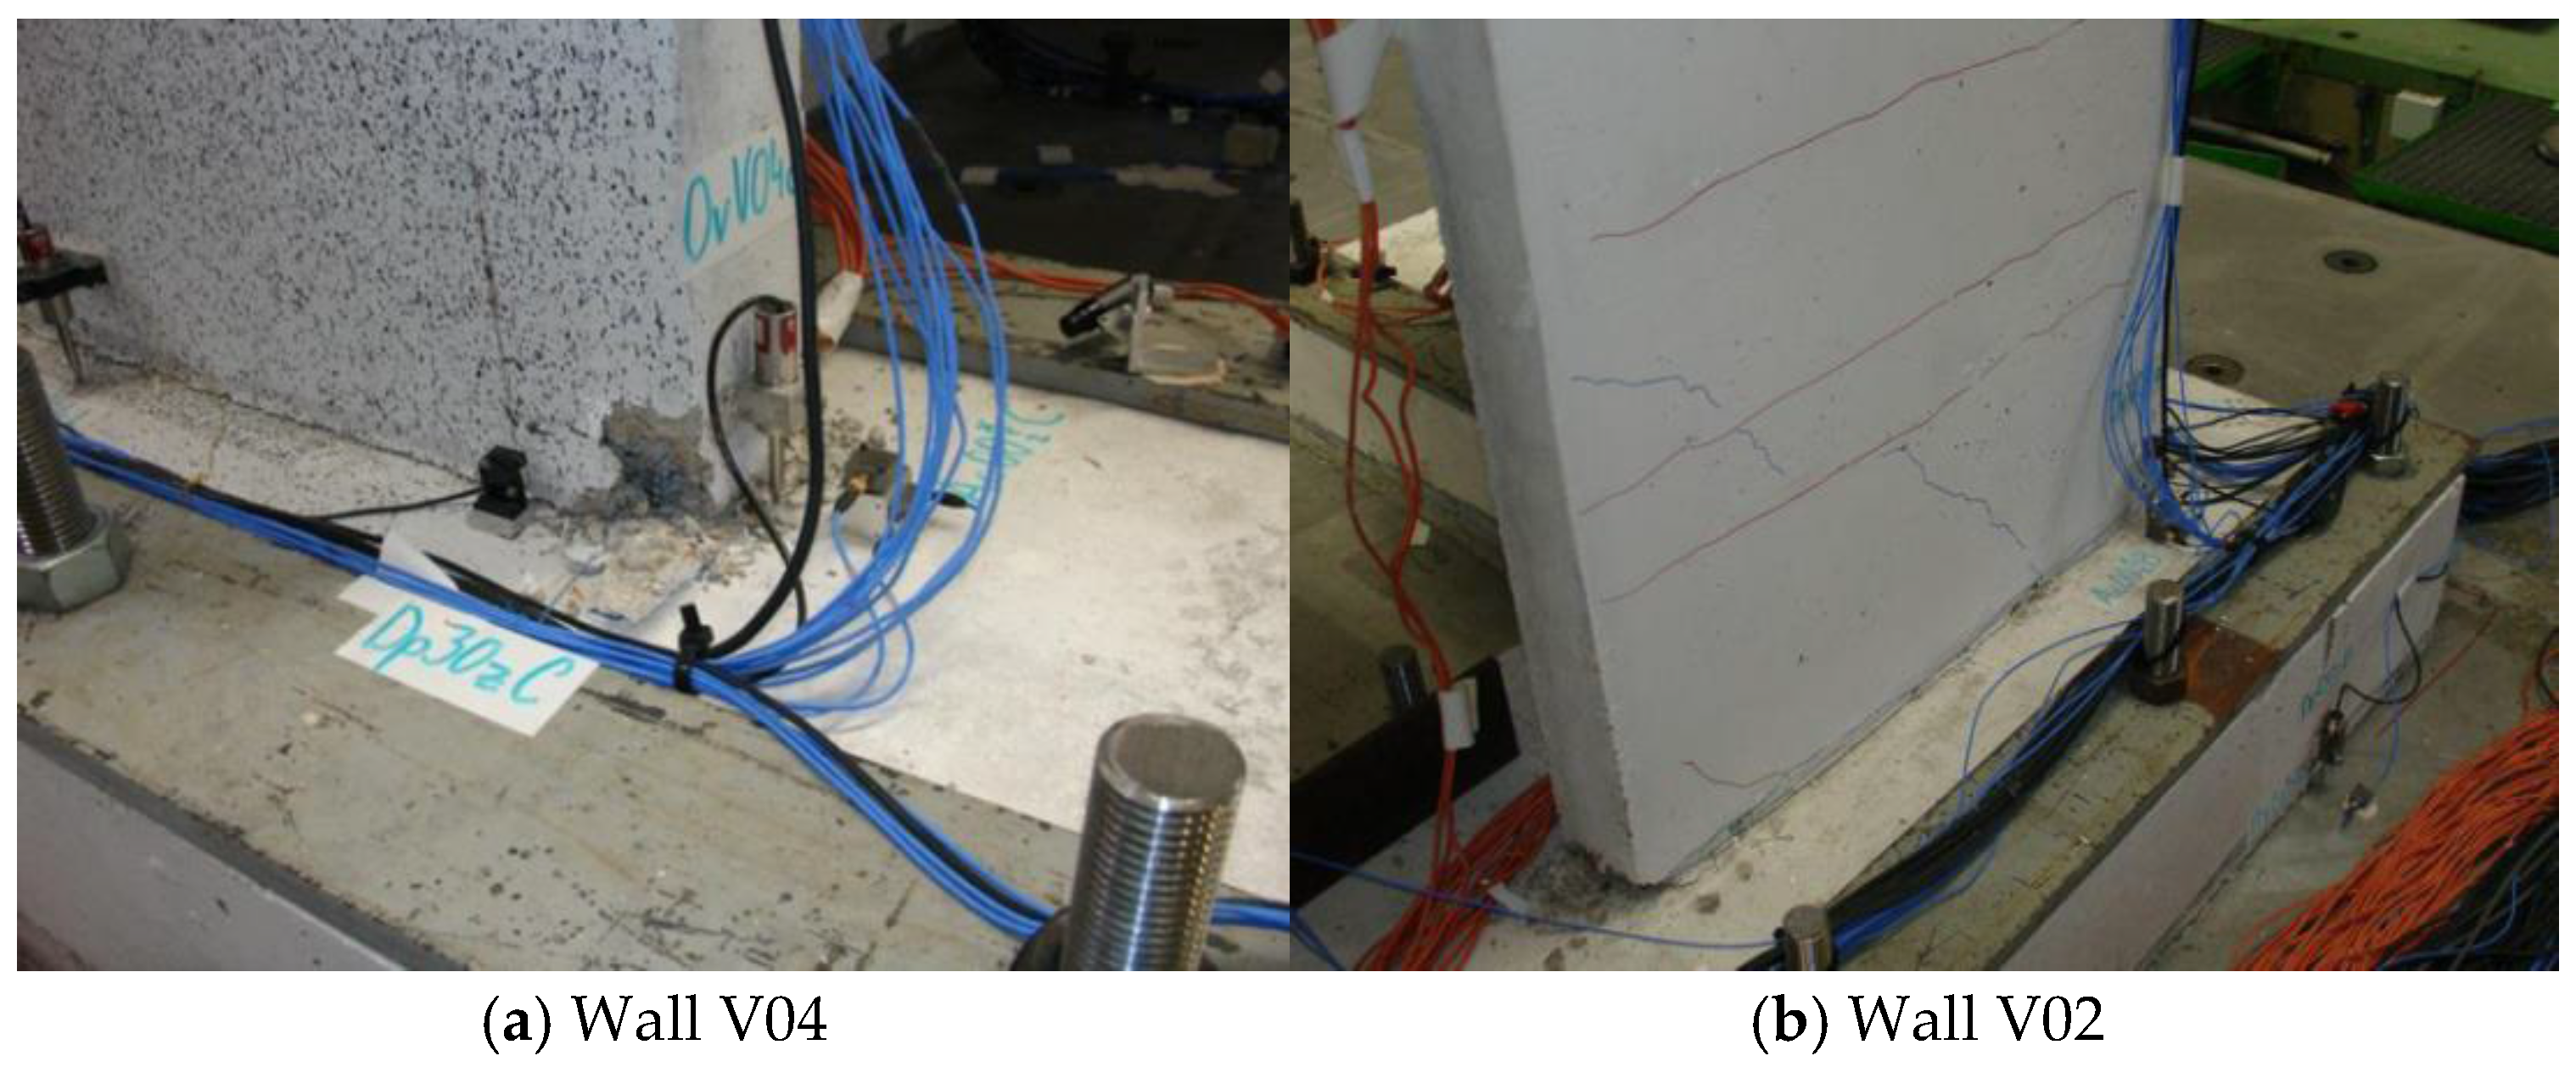
Figure 28 and Figure 29 show the numerical and experimental responses of the SMART 2013 RC structure for the Northridge aftershock (Run 21 and Run 23). Overall, the numerical results reflected the experimental results, although there was a slight phase difference in the result of Run 23. The difference could be because the numerical model did not accurately reflect the stiffness degradation after severe damage to the structure. The cumulative error of numerical solutions of earlier seismic sequences might have also influenced the response difference. Table 9 and Table 10 present the absolute maximum displacement and acceleration, respectively, that were calculated from each simulation stage. The displacement error was less than 10% for Run 19, wherein the ground motion was the strongest, whereas the error was around 20–30% for other runs. Table 11 shows the absolute maximum seismic responses at sampling points A to D in both the x and y directions for the case of Run 19. Although the peak values were somewhat different from the experimental values, the time histories in Figure 23, Figure 24, Figure 25, Figure 26, Figure 27, Figure 28 and Figure 29 show that the numerical solution had a similar tendency to the response obtained from the experiment. Figure 30 shows the concrete walls after the shaking table test corresponding to Runs 13–19. Severe cracks and spalling of concrete occurred at the lower part of the concrete walls and the column connected to the foundation. Figure 31 and Figure 32 show the Fourier frequency spectrum of displacement in the x and y directions, respectively, for Runs 17, 19, and 21. Overall, the spectra show a good agreement with those obtained from the experiment, particularly in the frequency range up to about 3 Hz.
6. Torsional Behavior
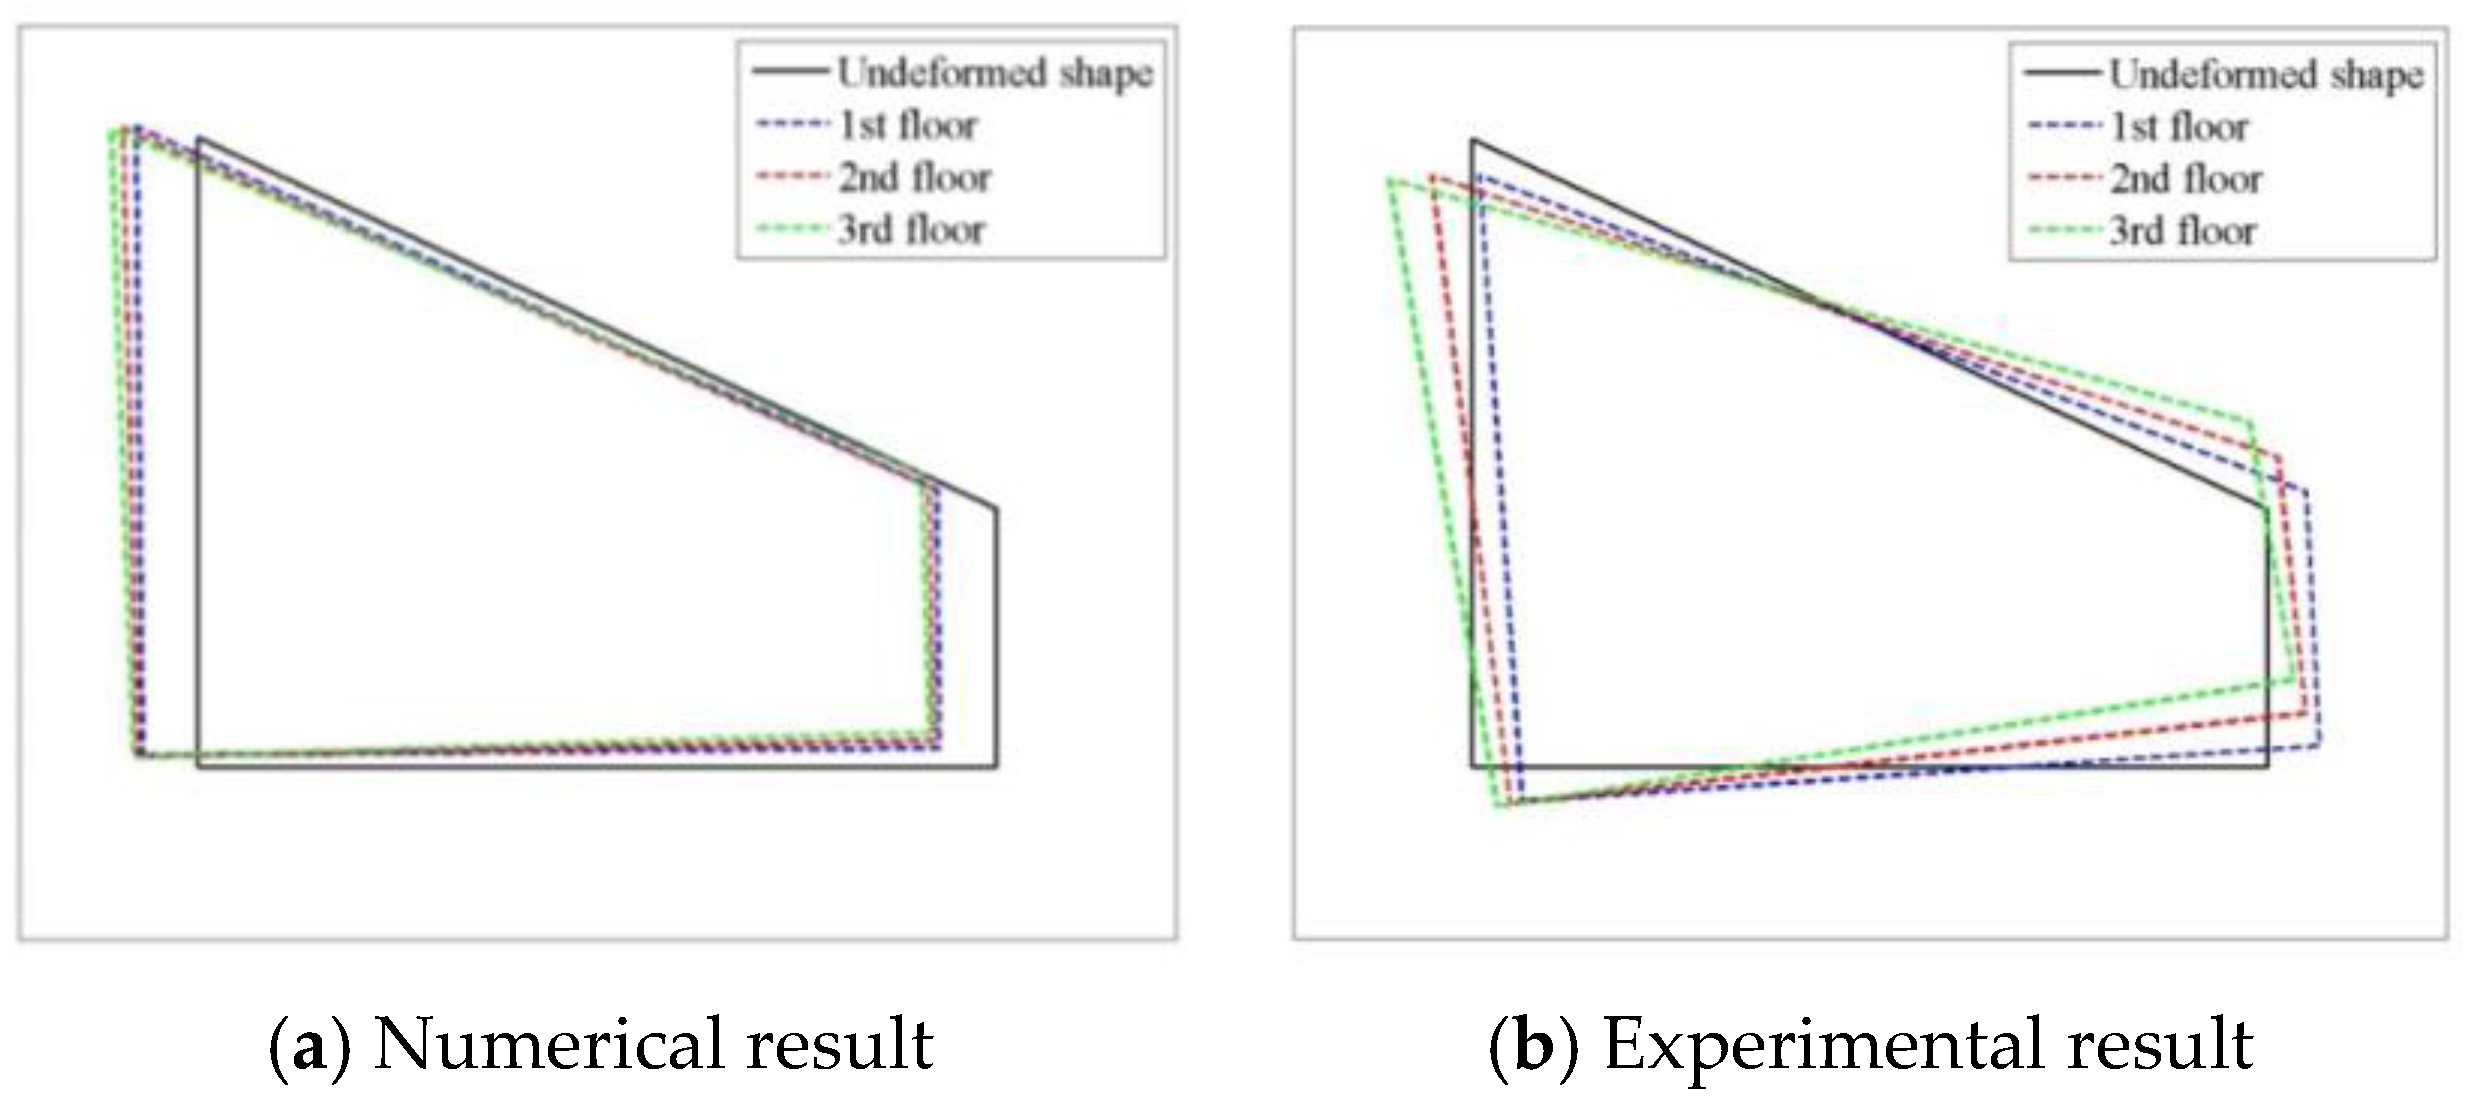
The SMART 2013 RC structure is asymmetric in plan view, as shown in Figure 2. In general, asymmetric structures often exhibit coupled flexural and torsional behaviors against lateral loads, since the line of action of the lateral load does not pass through the center of the stiffness of the structure when viewed in plan [36,37,38,39,40,41]. Figure 33 shows the displacement trace at the sampling points of the third floor of the building during the Northridge main shock with Run 19. The displacement traces indicate that the building was not only bent by seismic forces, but also twisted. Figure 34 shows the distortion of each floor of the building at 8.6 s, when the seismic response was the largest, as can be seen in Figure 27. For the calculated torsional response, the phase was similar to what was obtained from the shaking table test. Furthermore, the calculated torsional response seems to reflect the test result in that the degree of twist was more substantial on the higher floors. However, the numerical plan view deformation seems to be more correlated to a horizontal translation rather than a twisting mode. The difference could be because the numerical model did not accurately reflect the reduced torsional stiffness of the damaged structure.
In order to further investigate the torsional effect, we compared the seismic response of the asymmetric SMART 2013 structure with the response of a hypothetical symmetric structure. Figure 35 shows a plan view of the symmetric structure and the corresponding three-dimensional finite element model. The number of floors, thickness of the floors and walls, dimensions of the column, length in the x and y directions, mass of each floor, and materials used were the same as for the asymmetric SMART 2013 structure.
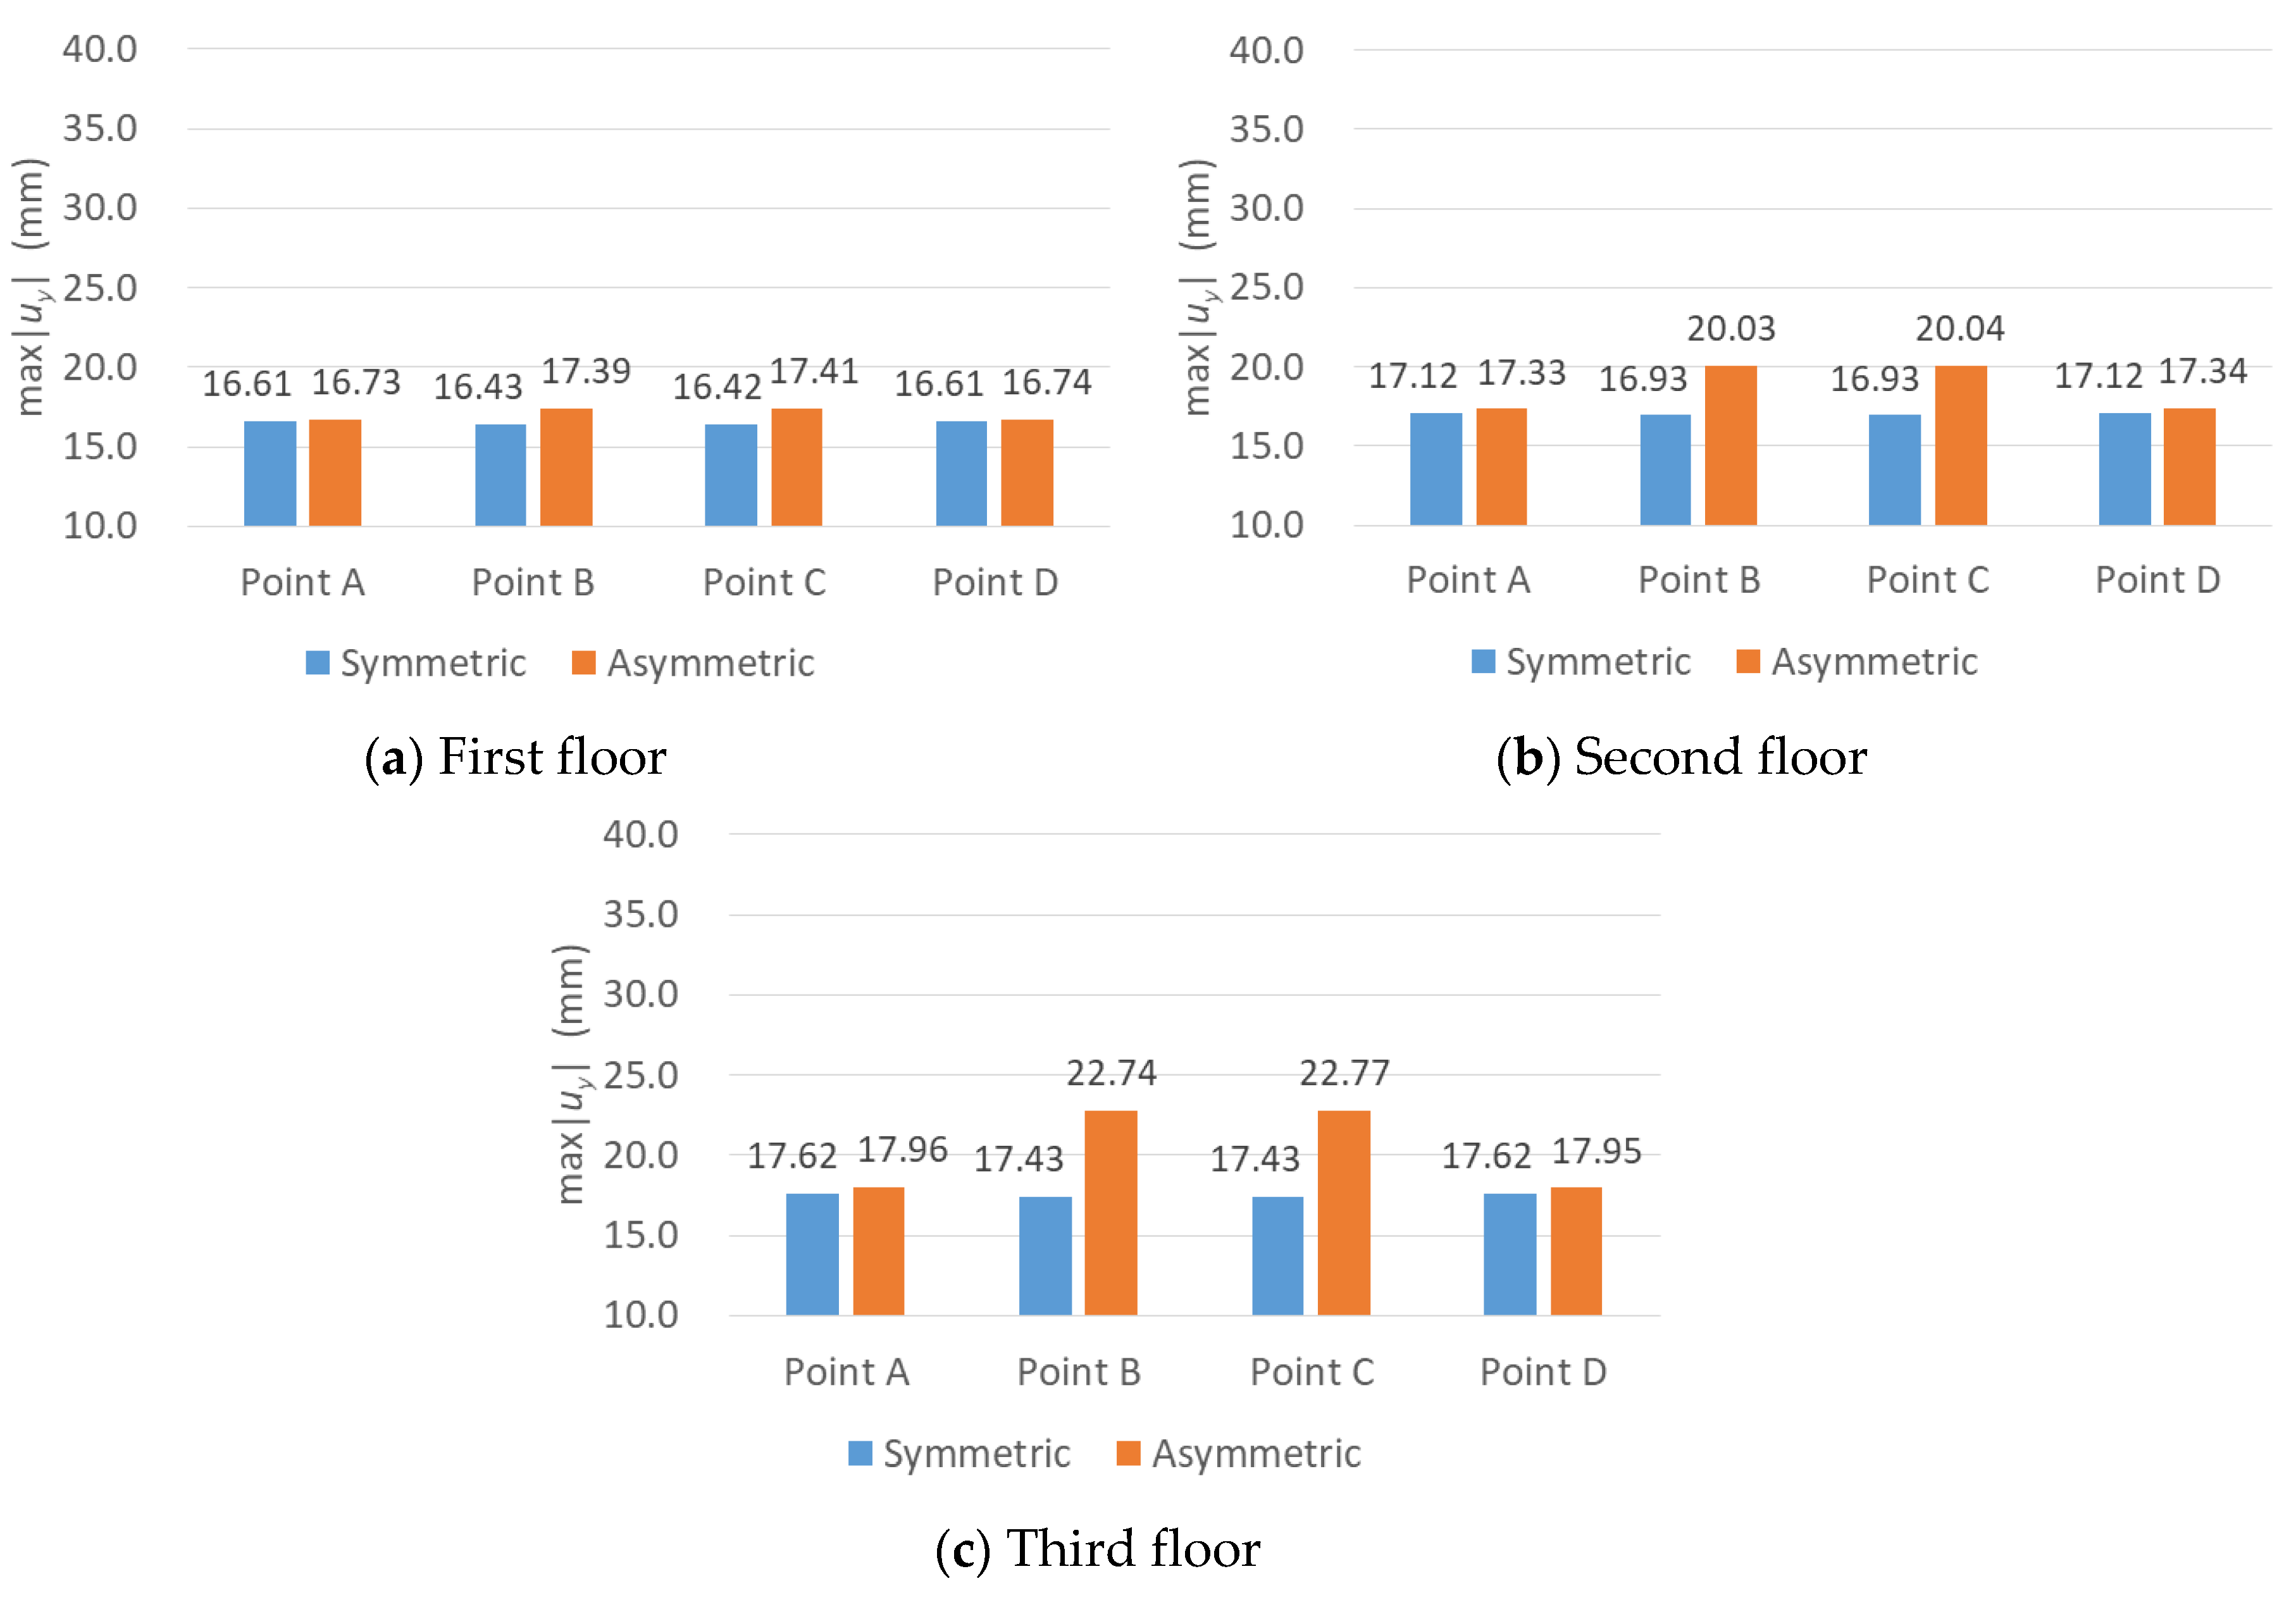
In Figure 36, the displacement responses of the asymmetric SMART 2013 structure and the hypothetical symmetric structure due to the Northridge main shock are compared with each other. The responses are sampled at point D. On the first floor, the responses were similar to each other. However, the difference in response became more substantial on the higher floors. The tendency of the greater response of the asymmetric structure also appeared in the frequency response spectrum, as shown in Figure 37. Figure 38 and Figure 39 compare the absolute maximum displacement for the two cases. For all of the sampling points and all of the floors, the displacement response of the asymmetric structure was larger than that of the hypothetical symmetric structure. It can also be seen that the response difference increased on the higher floors. The difference in the x directional absolute maximum displacement between the asymmetric and symmetric structures was up to 15%, while the difference in the y directional absolute maximum displacement was up to 31%. The results indicate that, similar to previous studies [36,37,38,39,40,41], a larger seismic response should be considered in the seismic design of an asymmetric structure compared to a symmetric structure with same design conditions.
7. Conclusions
This study presented the finite element modeling and simulation of the asymmetric SMART 2013 RC structure, considering torsional effect and material nonlinearity. Local tests with a representative volume element validated the nonlinear constitutive models set up for concrete and steel reinforcement. The computed first three natural frequencies were 6.26 Hz, 7.77 Hz, and 13.15 Hz, respectively, which were close to the experimental results. In the seismic analysis with low-intensity ground motions, the displacement and acceleration calculated at sampling points showed good agreement with the experimental results. In the blind seismic simulation, the consecutive seismic sequence of design signal, Northridge main shock, and Northridge aftershock were used to calculate the seismic response of the SMART 2013 RC structure at each floor. The time history of displacement and acceleration, as well as their frequency spectrum, agreed reasonably with the result of the shaking table test that was conducted as part of the international benchmark. By investigating the torsional behavior of the asymmetric SMART 2013 structure due to the seismic load, it was shown that the seismic response of the asymmetric structure was larger than that of the hypothetical symmetric structure. The response difference increased on the higher floors. The result indicates that a larger seismic response should be considered in the seismic design of an asymmetric structure compared to a symmetric structure with similar design conditions.
Acknowledgments
This research was supported by the Korea Institute of Nuclear Safety (Grant No. 14-51) and by the Korea Institute of Energy Technology Evaluation and Planning (KETEP) Grant (No. 20151510400100) funded by the Ministry of Trade, Industry and Energy of the Republic of Korea.
Author Contributions
Hyun-Kyu Lim, Jun Won Kang and Ho-Seok Chi conceived the main idea of this work; Hyun-Kyu Lim prepared this article as the first author; Hyun-Kyu Lim, Jun Won Kang, Hongrak Pak and Young-Geun Lee contributed finite element simulation; Hyun-Kyu Lim, Jun Won Kang and Janghwan Kim analyzed the numerical and experimental data; Hyun-Kyu Lim and Jun Won Kang wrote the paper.
Conflicts of Interest
The authors declare no conflict of interest.
References
- Bhattacharjee, S.S.; Léger, P. Concrete constitutive models for nonlinear seismic analysis of gravity dams—State-of-the-art. Can. J. Civ. Eng. 1992, 19, 492–509. [Google Scholar] [CrossRef]
- Willam, K.J. Encyclopedia of Physical Science and Technology. In Constitutive Models for Engineering Materials, 3rd ed.; Academic Press: San Diego, CA, USA, 2002; Volume 3, pp. 3603–3633. [Google Scholar]
- Chen, W.F. Plasticity in Reinforced Concrete; J. Ross Publishing: New York, NY, USA, 2007. [Google Scholar]
- Kim, T.H.; Kim, Y.J.; Shin, H.M. Seismic performance assessment of reinforced concrete bridge piers supported by laminated rubber bearings. Struct. Eng. Mech. 2008, 29, 259–278. [Google Scholar] [CrossRef]
- Jayalekshmi, B.R.; Deepthi, V.G.; Venkataramana, K.; Shivashankar, R. Seismic response analysis of reinforced concrete frames including soil flexibility. Struct. Eng. Mech. 2013, 48, 1–16. [Google Scholar] [CrossRef]
- Fardis, M.N.; Biskinis, D.E. Deformation capacity of RC members, as controlled by flexure or shear. In Proceedings of the Otani Symposium 2003, Tokyo, Japan, 8–9 September 2003; Volume 511530. [Google Scholar]
- Haselton, C.B.; Deierlein, G.G. Assessing Seismic Collapse Safety of Modern Reinforced Concrete Frame Buildings; PEER Report 2007/08; PEER Center, University of California: Berkeley, CA, USA, 2007. [Google Scholar]
- Ibarra, L.F.; Medina, R.A.; Krawinkler, H. Hysteretic models that incorporate strength and stiffness deterioration. Earthq. Eng. Struct. Dyn. 2005, 34, 1489–1511. [Google Scholar] [CrossRef]
- Fischinger, M.; Rejec, K.; Isakovic, T. Modeling Inelastic Shear Response of RC Walls. In Proceedings of the 15th World Conference on Earthquake Engineering, Lisbon, Portugal, 24–28 September 2012. [Google Scholar]
- Ueda, M.; Seya, H.; Ohmiya, Y.; Taniguchi, H.; Kambayashi, A. Nonlinear analysis on RC shear wall shaking table test. In Proceedings of the 14th International Conference on Structural Mechanics in Reactor Technology, Lyon, France, 17–22 August 1997. [Google Scholar]
- Ile, N.; Reynouard, J.M. Nonlinear analysis of reinforced concrete shear wall under earthquake loading. J. Earthq. Eng. 2000, 4, 183–214. [Google Scholar] [CrossRef]
- Richard, B.; Ile, N.; Frau, A.; Ma, A.; Loiseau, O.; Giry, C.; Ragueneau, F. Experimental and numerical study of a half-scaled reinforced concrete building equipped with thermal break components subjected to seismic loading up to severe damage state. Eng. Struct. 2015, 92, 29–45. [Google Scholar] [CrossRef]
- Pegon, P.; Magonette, G.; Molina, F.J.; Verzeletti, G.; Dyngeland, T.; Negro, P.; Tognoli, P. Programme SAFE: Rapport du Test T5; Unité Mécanique des Structures, Institut des Systèmes, de lInformatique et de la Sécurité, Centre Commun de Recherche, Commission Européenne: Ispra, Italy, 1998; p. 21020. [Google Scholar]
- Bisch, P.; Coin, A. The CASSBA project. In Proceedings of the 10th European Conference on Earthquake Engineering, Vienna, Austria, 28 August–2 September 1994. [Google Scholar]
- Bisch, P.; Coin, A. The CAMUS research program. In Proceedings of the 11th European Conference on Earthquake Engineering, Paris, France, 6–11 September 1998. [Google Scholar]
- Richard, B.; Martinelli, P.; Voldoire, F.; Corus, M.; Chaudat, T.; Abouri, S.; Bonfils, N. SMART 2008: Shaking table tests on an asymmetrical reinforced concrete structure and seismic margins assessment. Eng. Struct. 2015, 105, 48–61. [Google Scholar] [CrossRef]
- Richard, B.; Martinelli, P.; Voldoire, F.; Chaudat, T.; Abouri, S.; Bonfils, N. SMART 2008: Overview, synthesis and lessons learned from the International Benchmark. Eng. Struct. 2016, 106, 166–178. [Google Scholar] [CrossRef]
- Panagiotou, M.; Restrepo, J.I.; Conte, J.P. Shake-table test of a full-scale 7-story building slice. Phase I: Rectangular wall. J. Struct. Eng. 2010, 137, 691–704. [Google Scholar] [CrossRef]
- Negro, P.; Verzeletti, G.; Magonette, G.E.; Pinto, A.V. Tests on a Fourstorey Full-Scale R/C Frame Designed According to Eurocodes 8 and 2: Preliminary Report; Report EUR, 15879; Joint Research Centre: Ispra, Italy, 1994. [Google Scholar]
- Magliulo, G.; Ramasco, R. Seismic response of three-dimensional r/c multi-storey frame building under uni-and bi-directional input ground motion. Earthq. Eng. Struct. Dyn. 2007, 36, 1641–1657. [Google Scholar] [CrossRef]
- Jeong, S.H.; Elnashai, A.S. Analytical assessment of an irregular RC frame for full-scale 3D pseudo-dynamic testing part I: Analytical model verification. J. Earthq. Eng. 2005, 9, 95–128. [Google Scholar] [CrossRef]
- Jeong, S.H.; Elnashai, A.S. Analytical assessment of an irregular RC frame for full-scale 3D pseudo-dynamic testing part II: Condition assessment and test deployment. J. Earthq. Eng. 2005, 9, 265–284. [Google Scholar] [CrossRef]
- Chaudat, T.; Charbonnel, P.E.; Garnier, C.; Le Corre, M.; Mahé, M.; Poupin, S.; Vasic, S. SMART 2013 Test Report; SEMT/EMSI/NT/14-019; French Alternative Energies and Atomic Commission: Gif-sur-Yvette, France, 2014. [Google Scholar]
- Richard, B.; Fontan, M.; Mazars, J. SMART-2013: Overview, Synthesis and Lessons Learnt from the International Benchmark; SEMT/EMSI/NT/14-037; French Alternative Energies and Atomic Commission: Gif-sur-Yvette, France, 2014. [Google Scholar]
- Richard, B.; Voldoire, F.; Fontan, M.; Mazars, J.; Chaudat, T.; Abouri, S.; Bonfils, N. SMART 2013: Lessons learned from the international benchmark about the seismic margin assessment of nuclear RC buildings. Eng. Struct. 2018, 161, 207–222. [Google Scholar] [CrossRef]
- Richard, B.; Cherubini, S.; Voldoire, F.; Charbonnel, P.E.; Chaudat, T.; Abouri, S.; Bonfils, N. SMART 2013: Experimental and numerical assessment of the dynamic behavior by shaking table tests of an asymmetrical reinforced concrete structure subjected to high intensity ground motions. Eng. Struct. 2016, 109, 99–116. [Google Scholar] [CrossRef]
- Kachlakev, D.; Miller, T. Finite Element Modeling of Reinforced Concrete Structures Strengthened with FRP Laminates-Final Report: 2001; FHWA-OR-RD-01-17; Oregon Department of Transportation: Salem, OR, USA, 2001.
- ANSYS Inc. ANSYS Mechanical APDL, Release 14.5; ANSYS Inc.: Canonsburg, PA, USA, 2012. [Google Scholar]
- Willam, K.J.; Warnke, E.P. Constitutive models for the triaxial behavior of concrete. Int. Assoc. Bridge Struct. Eng. 1975, 19, 1–30. [Google Scholar]
- Richard, B.; Charbonnel, P.E. SMART 2013 International Benchmark Experimental Data for Stage #2; SEMT/EMSI/NT/13-035/A; French Alternative Energies and Atomic Commission: Gif-sur-Yvette, France, 2013. [Google Scholar]
- Chaudat, M.; Benjamin, R. SMART 2013 Data Acquisition Project; SEMT/EMSI/NT/13-003; French Alternative Energies and Atomic Commission: Gif-sur-Yvette, France, 2013. [Google Scholar]
- Crijanovschi, S.; Richard, B.; Chaudat, T.; Atanasiu, G.M. Preliminary numerical analysis of a reinforced concrete mock up: Effects of thermal breakers and shaking table. In Proceedings of the 15th World Conference on Earthquake Engineering, Lisbon, Portugal, 24–28 September 2012. [Google Scholar]
- Juster-Lermitte, S.; Chaudat, T.; Zenter, I.; Courtois, A. Project SMART 2008; SEMT/EMSI/RT/09-011A; French Alternative Energies and Atomic Commission: Gif-sur-Yvette, France, 2009. [Google Scholar]
- Richard, B.; Ragueneau, F. Nonlinear analysis of a reinforced concrete mock-up under seismic loading. In Proceedings of the 15th World Conference on Earthquake Engineering, Lisbon, Portugal, 24–28 September 2012. [Google Scholar]
- Richard, B.; Ragueneau, F. Continuum damage mechanics based model for quasi brittle materials subjected to cyclic loadings: Formulation, numerical implementation and applications. Eng. Fract. Mech. 2013, 98, 383–406. [Google Scholar] [CrossRef]
- Paulay, T. Some design principles relevant to torsional phenomena in ductile buildings. J. Earthq. Eng. 2001, 5, 273–308. [Google Scholar] [CrossRef]
- Rutenberg, A. EAEE Task Group (TG) 8: Behaviour of irregular and complex structures, asymmetric structures–Progress since 1998. In Proceedings of the 12th European Conference on Earthquake Engineering, London, UK, 9–13 September 2002. Paper No. 832. [Google Scholar]
- Stathopoulos, K.G.; Anagnostopoulos, S.A. Inelastic earthquake induced torsion in buildings: Results and conclusions from realistic models. In Proceedings of the 12th European Conference on Earthquake Engineering, London, UK, 9–13 September 2002. [Google Scholar]
- Garcia, O.; Islas, A.; Ayala, A.G. Effect of the in-plan distribution of strength on the non-linear seismic response of torsionally coupled buildings. In Proceedings of the 13th World Conference on Earthquake Engineering, Vancouver, BC, Canada, 1–6 August 2004. [Google Scholar]
- Magliulo, G.; Maddaloni, G.; Petrone, C. Influence of earthquake direction on the seismic response of irregular plan RC frame buildings. Earthq. Eng. Eng. Vib. 2014, 13, 243–256. [Google Scholar] [CrossRef]
- Llera, J.C.D.L.; Chopra, A.K. Inelastic behavior of asymmetric multistory buildings. J. Struct. Eng. 1996, 122, 597–606. [Google Scholar] [CrossRef]
Figure 1.
The asymmetric three-storey reinforced concrete building used for the SMART (Seismic design and best-estimate Methods Assessment for Reinforced concrete buildings subjected to Torsion and nonlinear effects) 2013 international benchmark campaign.
Figure 1.
The asymmetric three-storey reinforced concrete building used for the SMART (Seismic design and best-estimate Methods Assessment for Reinforced concrete buildings subjected to Torsion and nonlinear effects) 2013 international benchmark campaign.
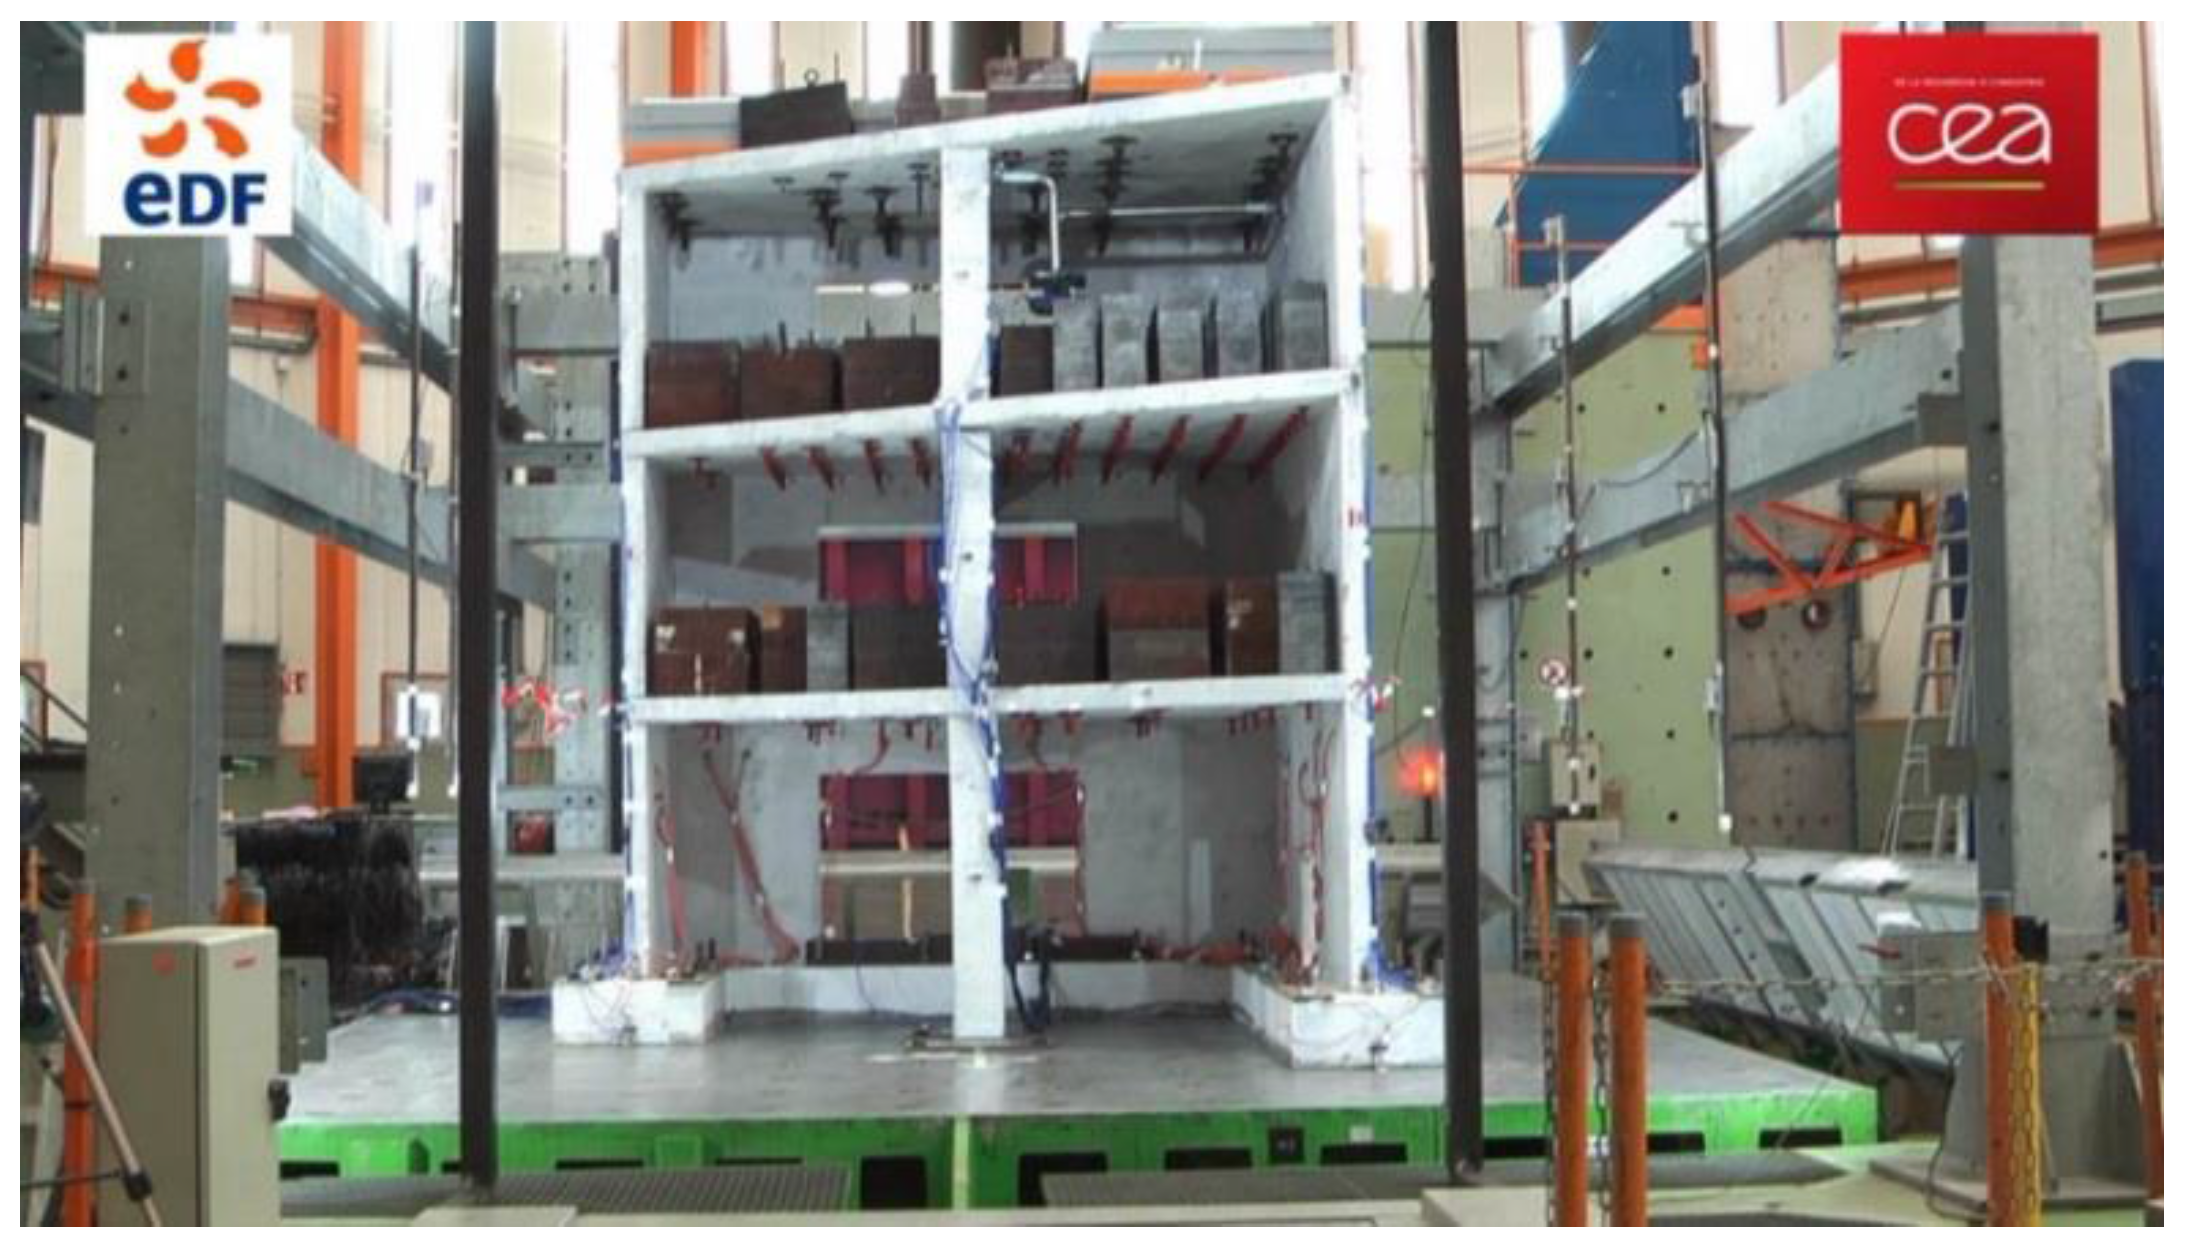
Figure 2.
Plan and elevation views of the SMART 2013 reinforced concrete (RC) structure (unit: mm).

Figure 3.
Wall foundation of the SMART 2013 RC structure [23]; (a) RC footing; (b) cutaway view.
Figure 3.
Wall foundation of the SMART 2013 RC structure [23]; (a) RC footing; (b) cutaway view.

Figure 4.
Plan view of the SMART 2013 structure positioned on the shaking table [23]; four hydraulic actuators (X1, X4, Y2, Y3) are placed in a horizontal direction, and the other four (Z1, Z2, Z3, Z4) are laid in a vertical direction.
Figure 4.
Plan view of the SMART 2013 structure positioned on the shaking table [23]; four hydraulic actuators (X1, X4, Y2, Y3) are placed in a horizontal direction, and the other four (Z1, Z2, Z3, Z4) are laid in a vertical direction.

Figure 5.
Response sampling points on each floor (unit: mm).
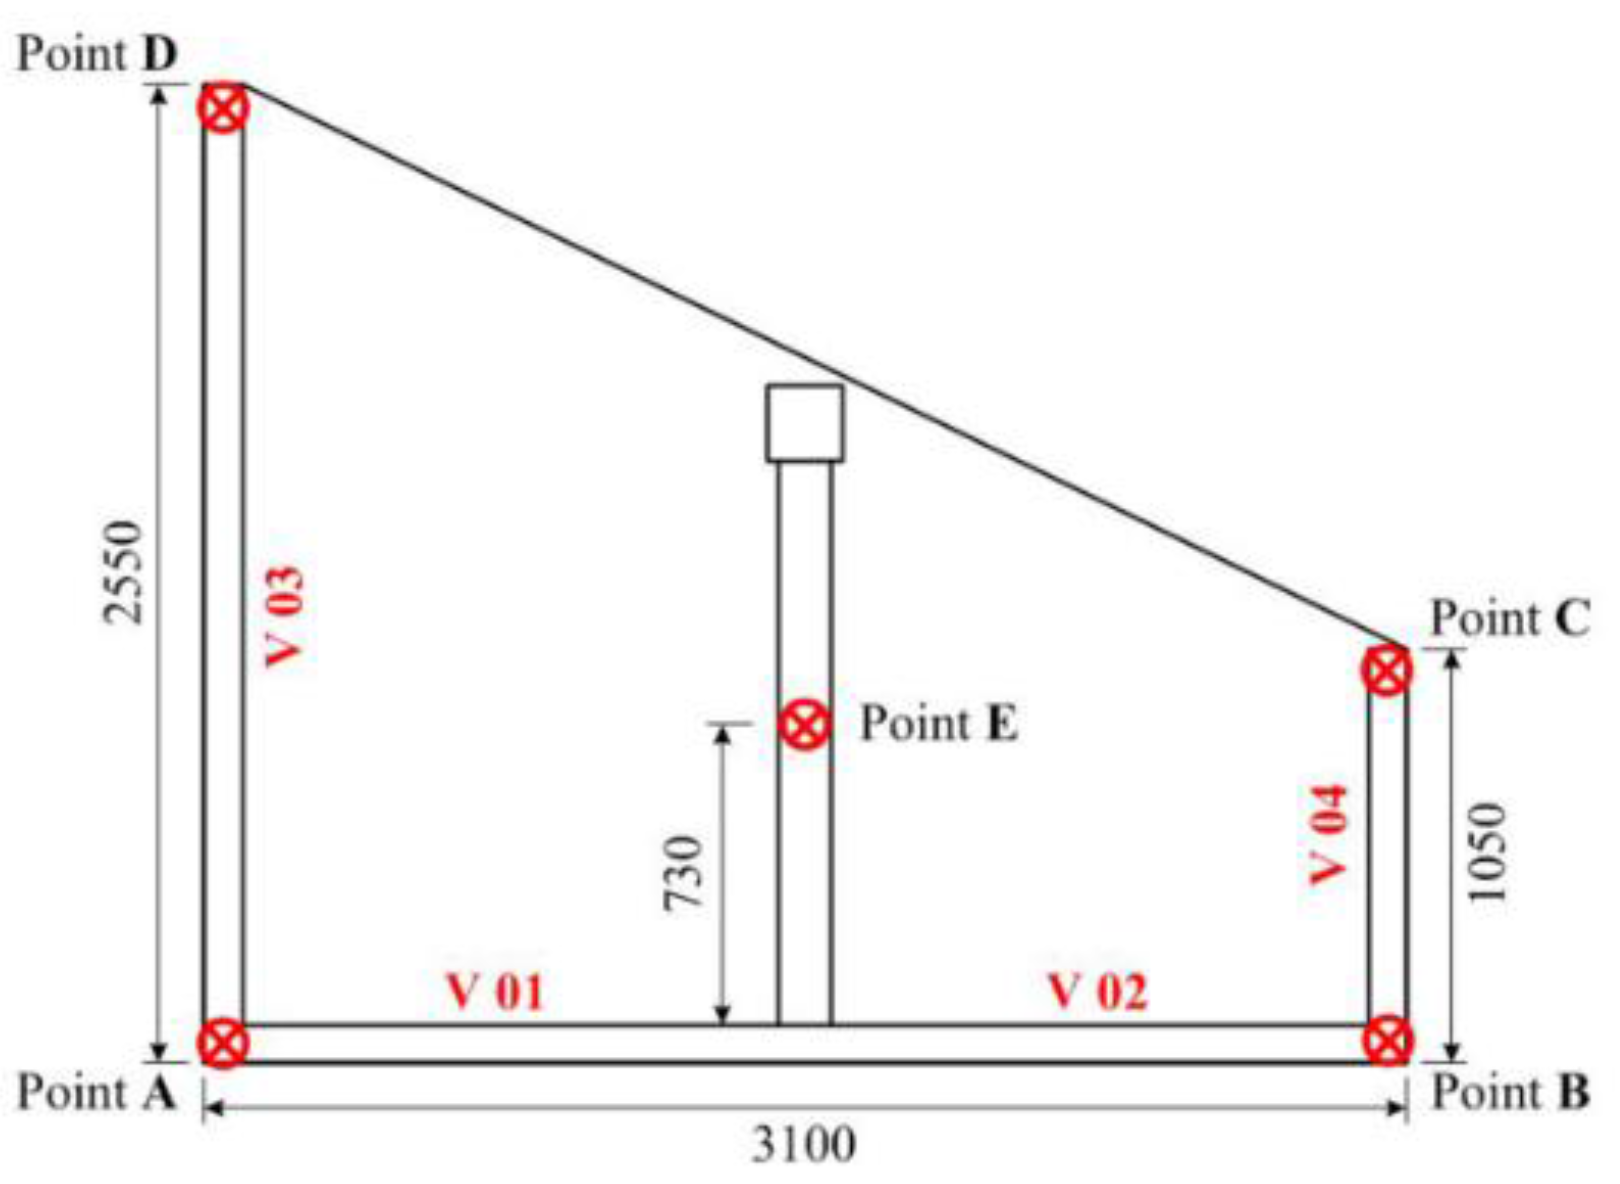
Figure 6.
Strain–stress curves for concrete and steel reinforcement.

Figure 7.
Deviatoric section of the Willam–Warnke failure surface.

Figure 8.
Trace of the three-parameter Willam–Warnke yield surface in the - plane for and .
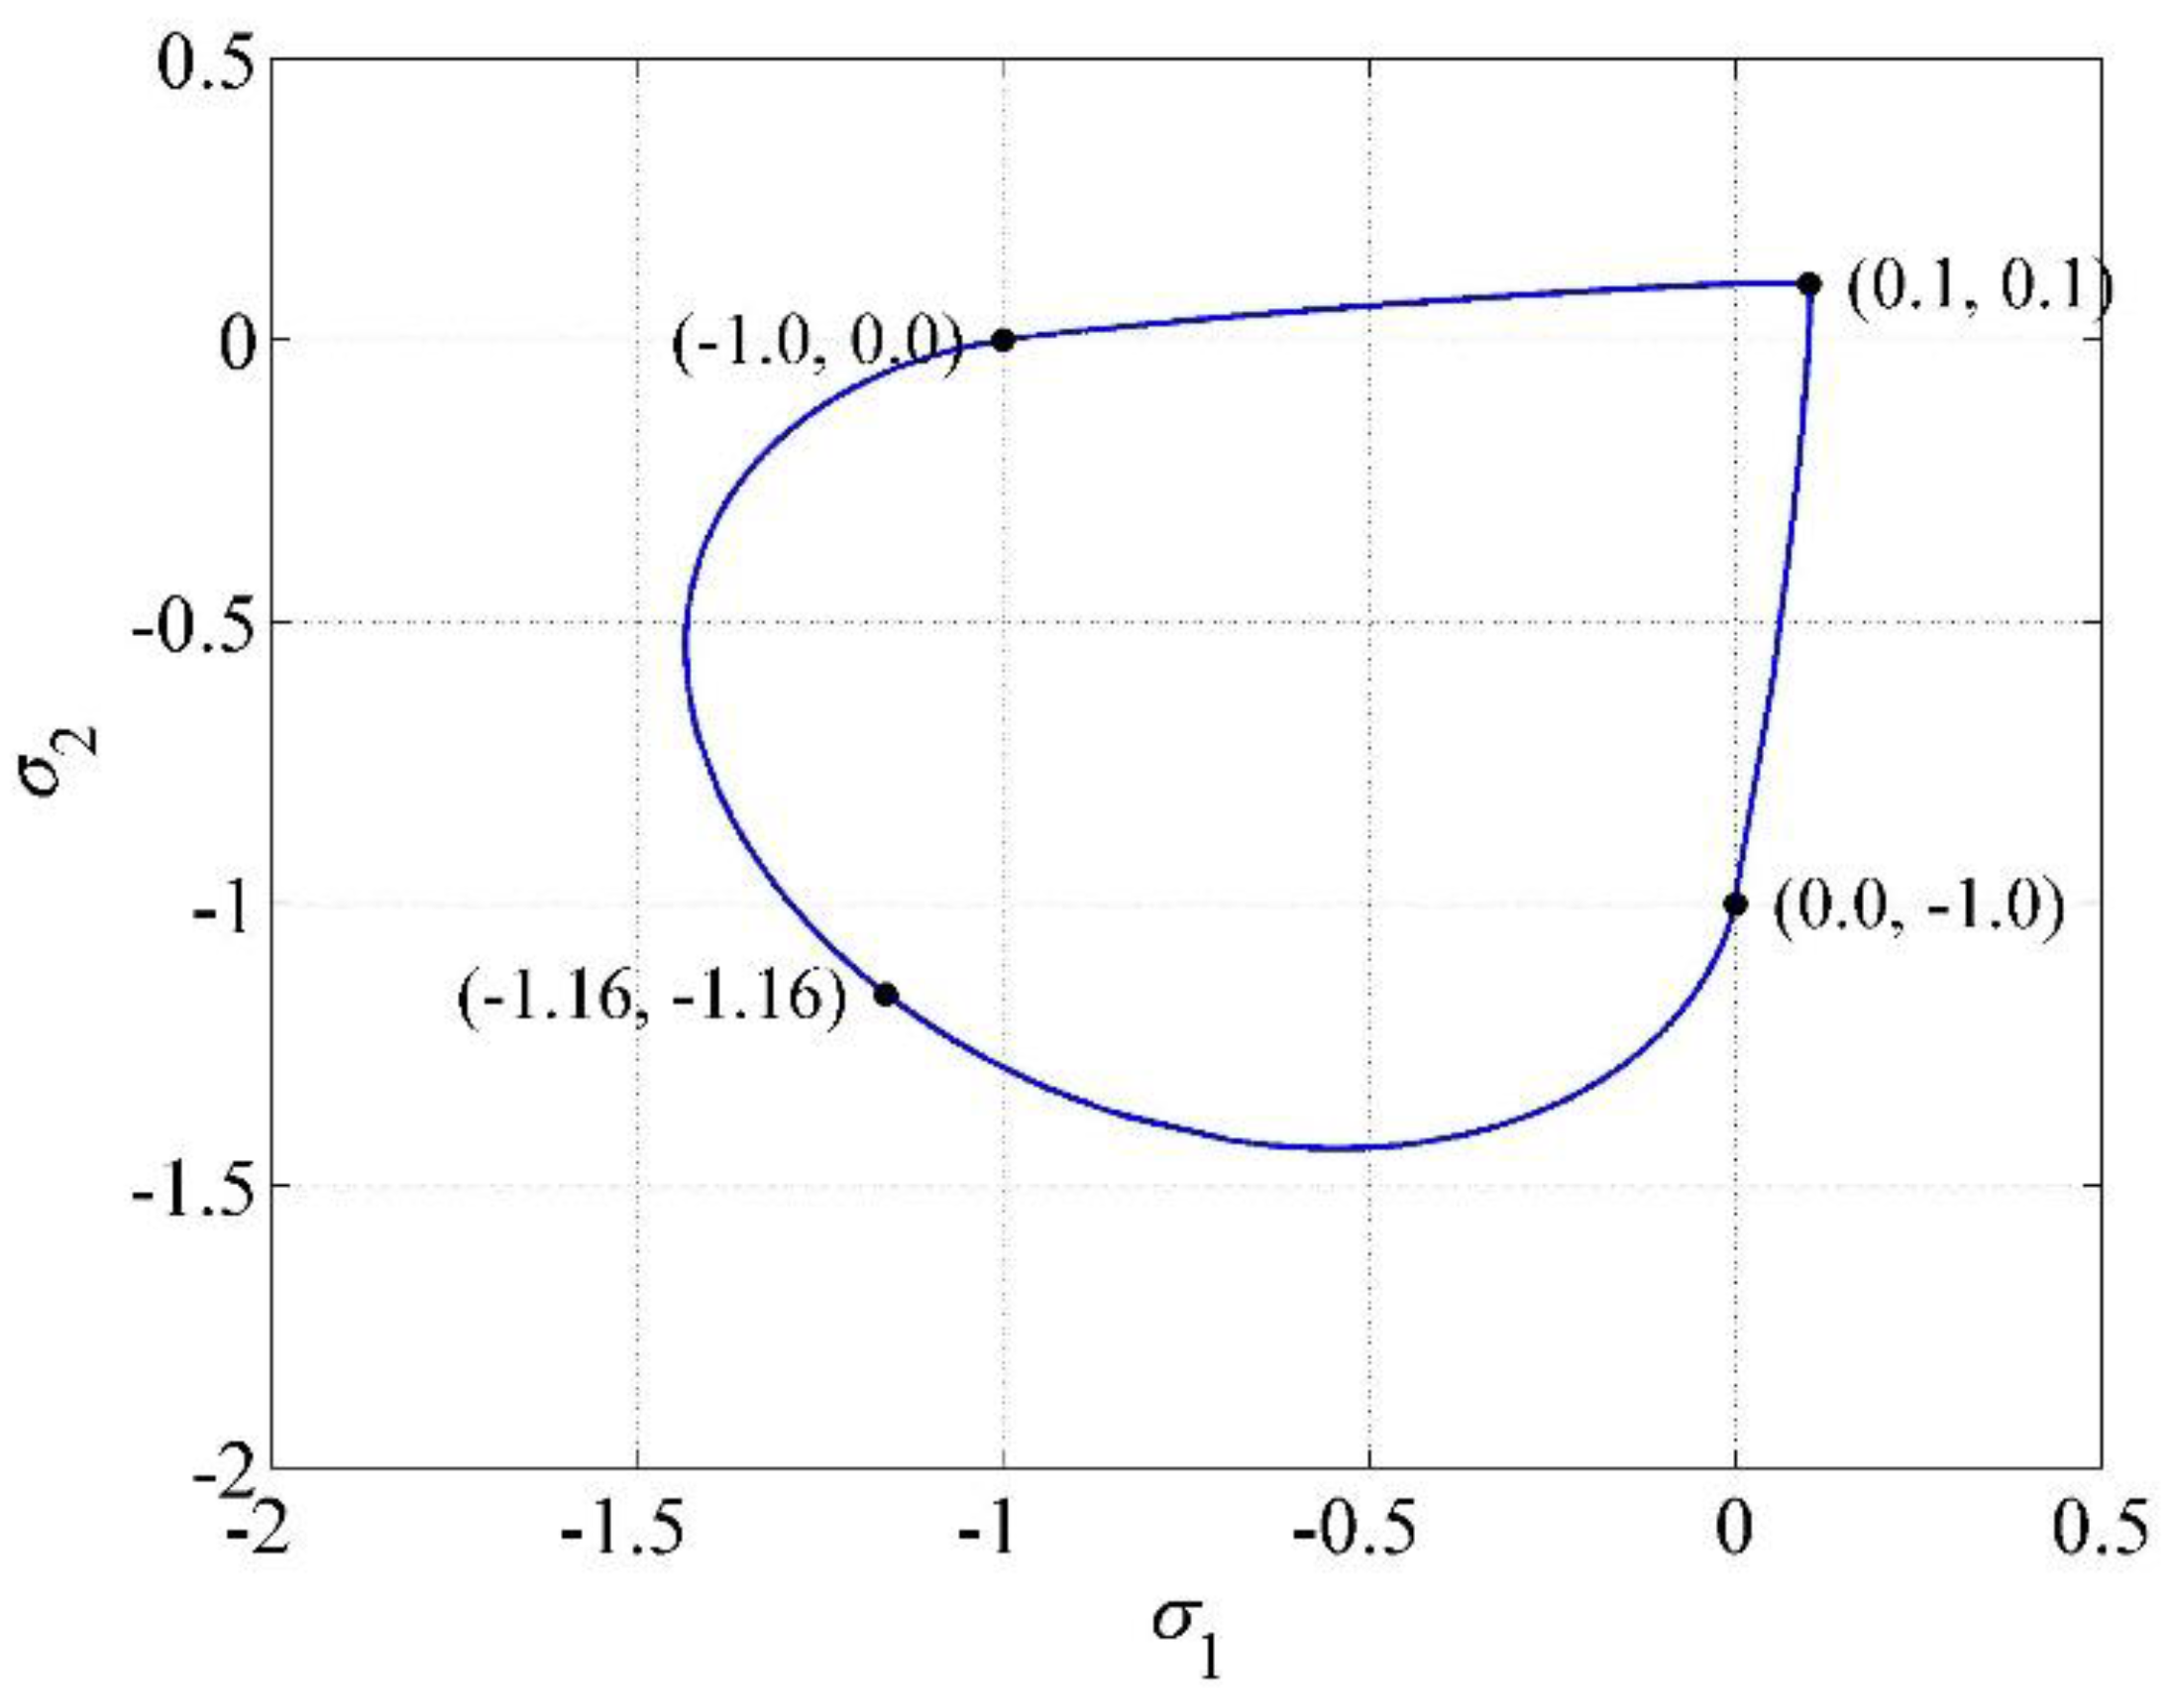
Figure 9.
Representative volume elements for local finite element test; (a) Concrete representative volume element (RVE); (b) RC RVE.
Figure 9.
Representative volume elements for local finite element test; (a) Concrete representative volume element (RVE); (b) RC RVE.

Figure 10.
Local test rc.1: uniaxial cyclic displacement loading.

Figure 11.
Local test rc.2: cyclic pure shear loading.
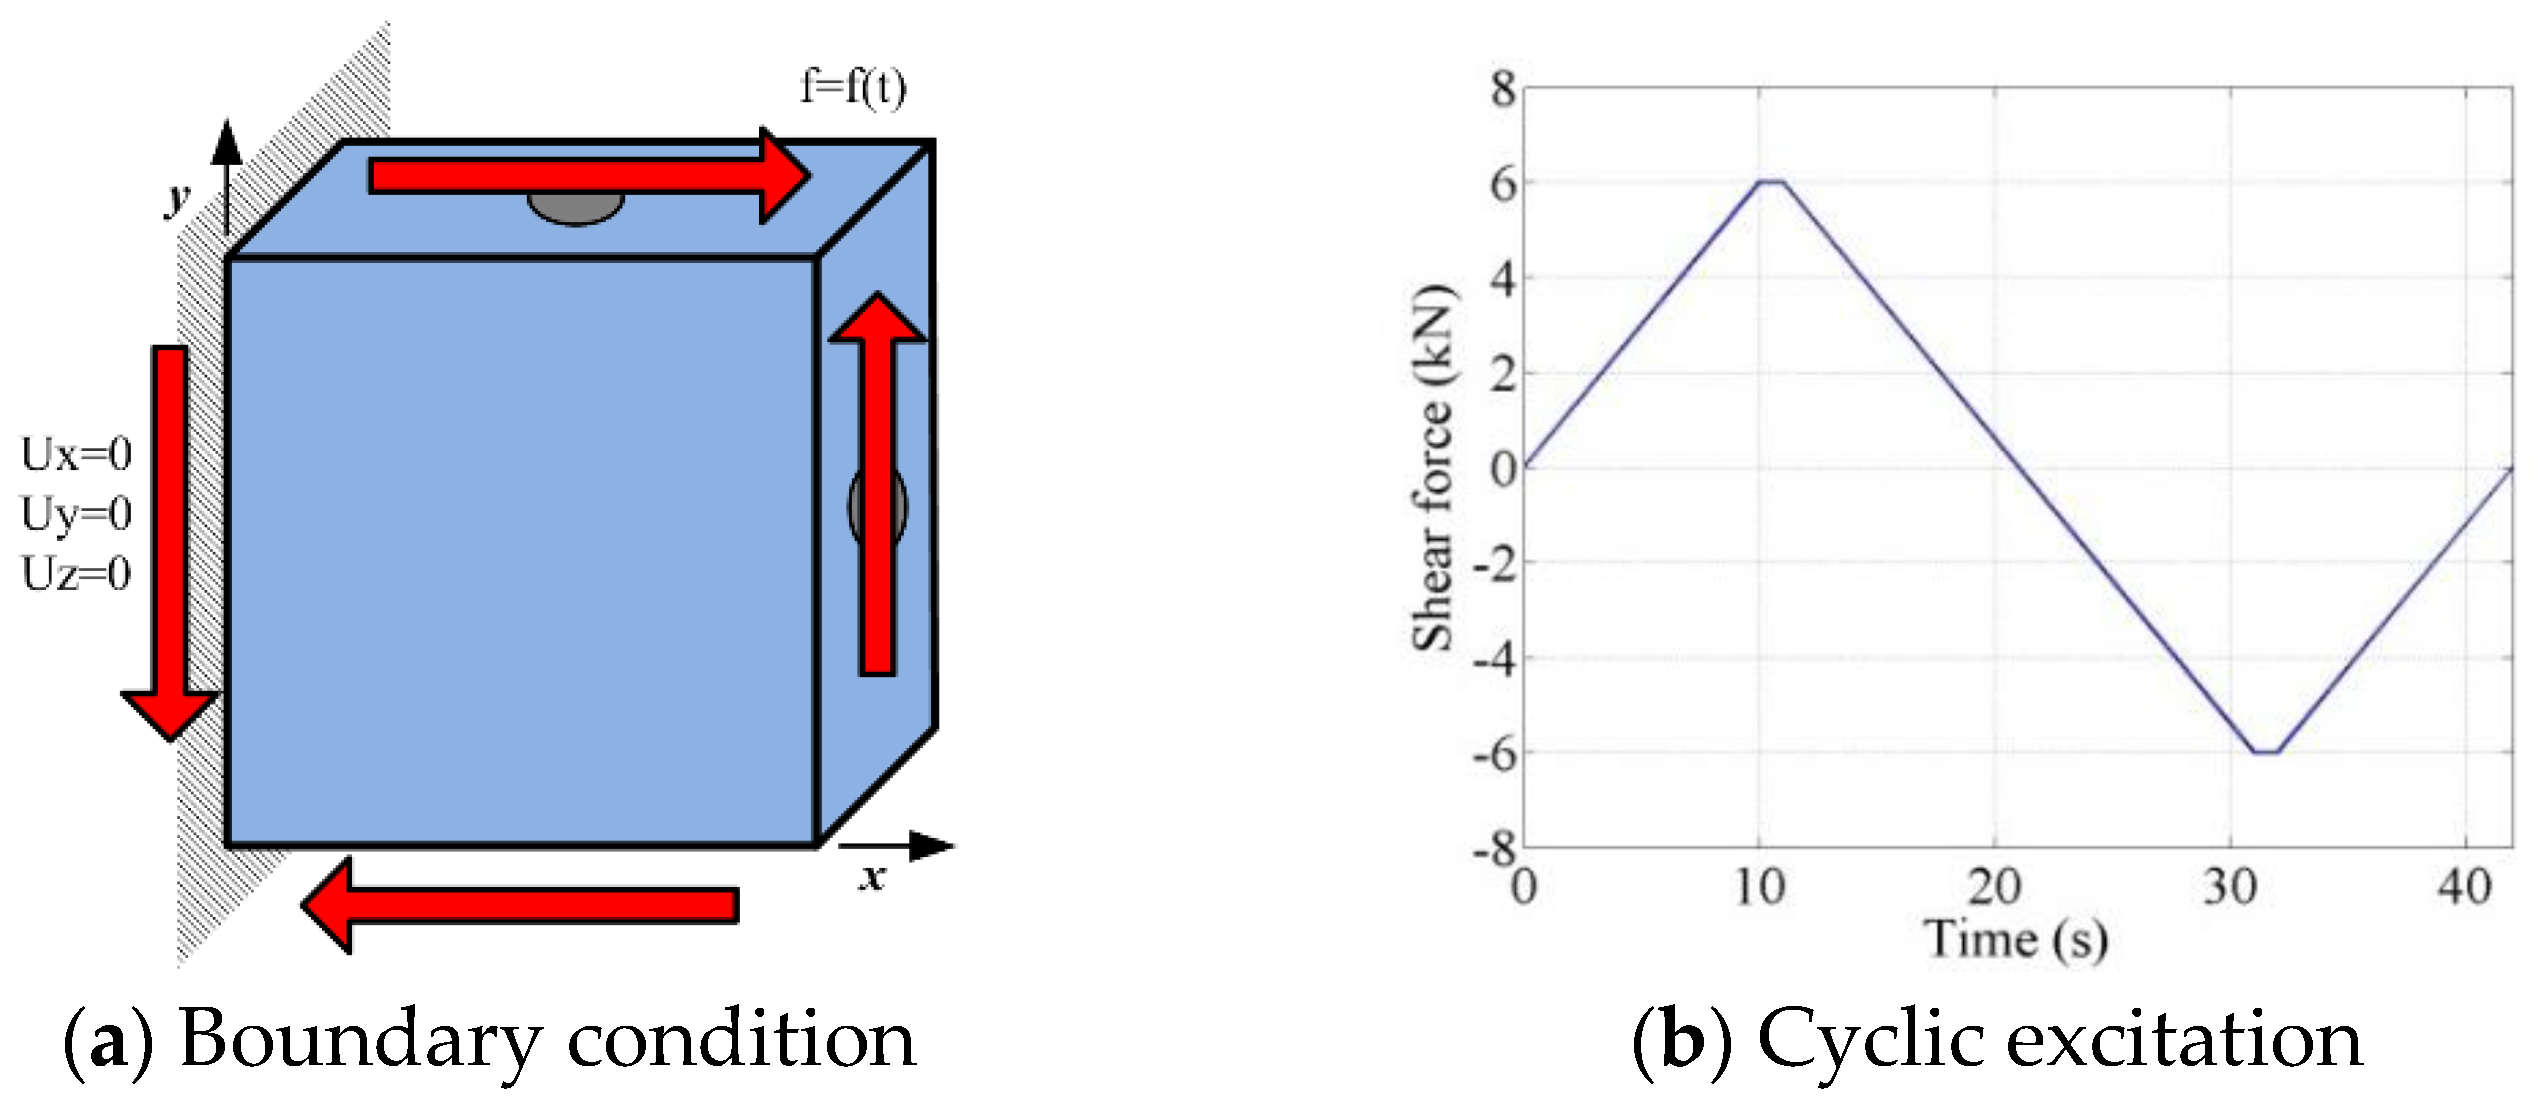
Figure 12.
Yield and failure surfaces constructed from local test c.1.

Figure 13.
Stress–strain responses from local tests rc.1 and rc.2.

Figure 14.
Finite element modeling of the SMART 2013 RC structure.
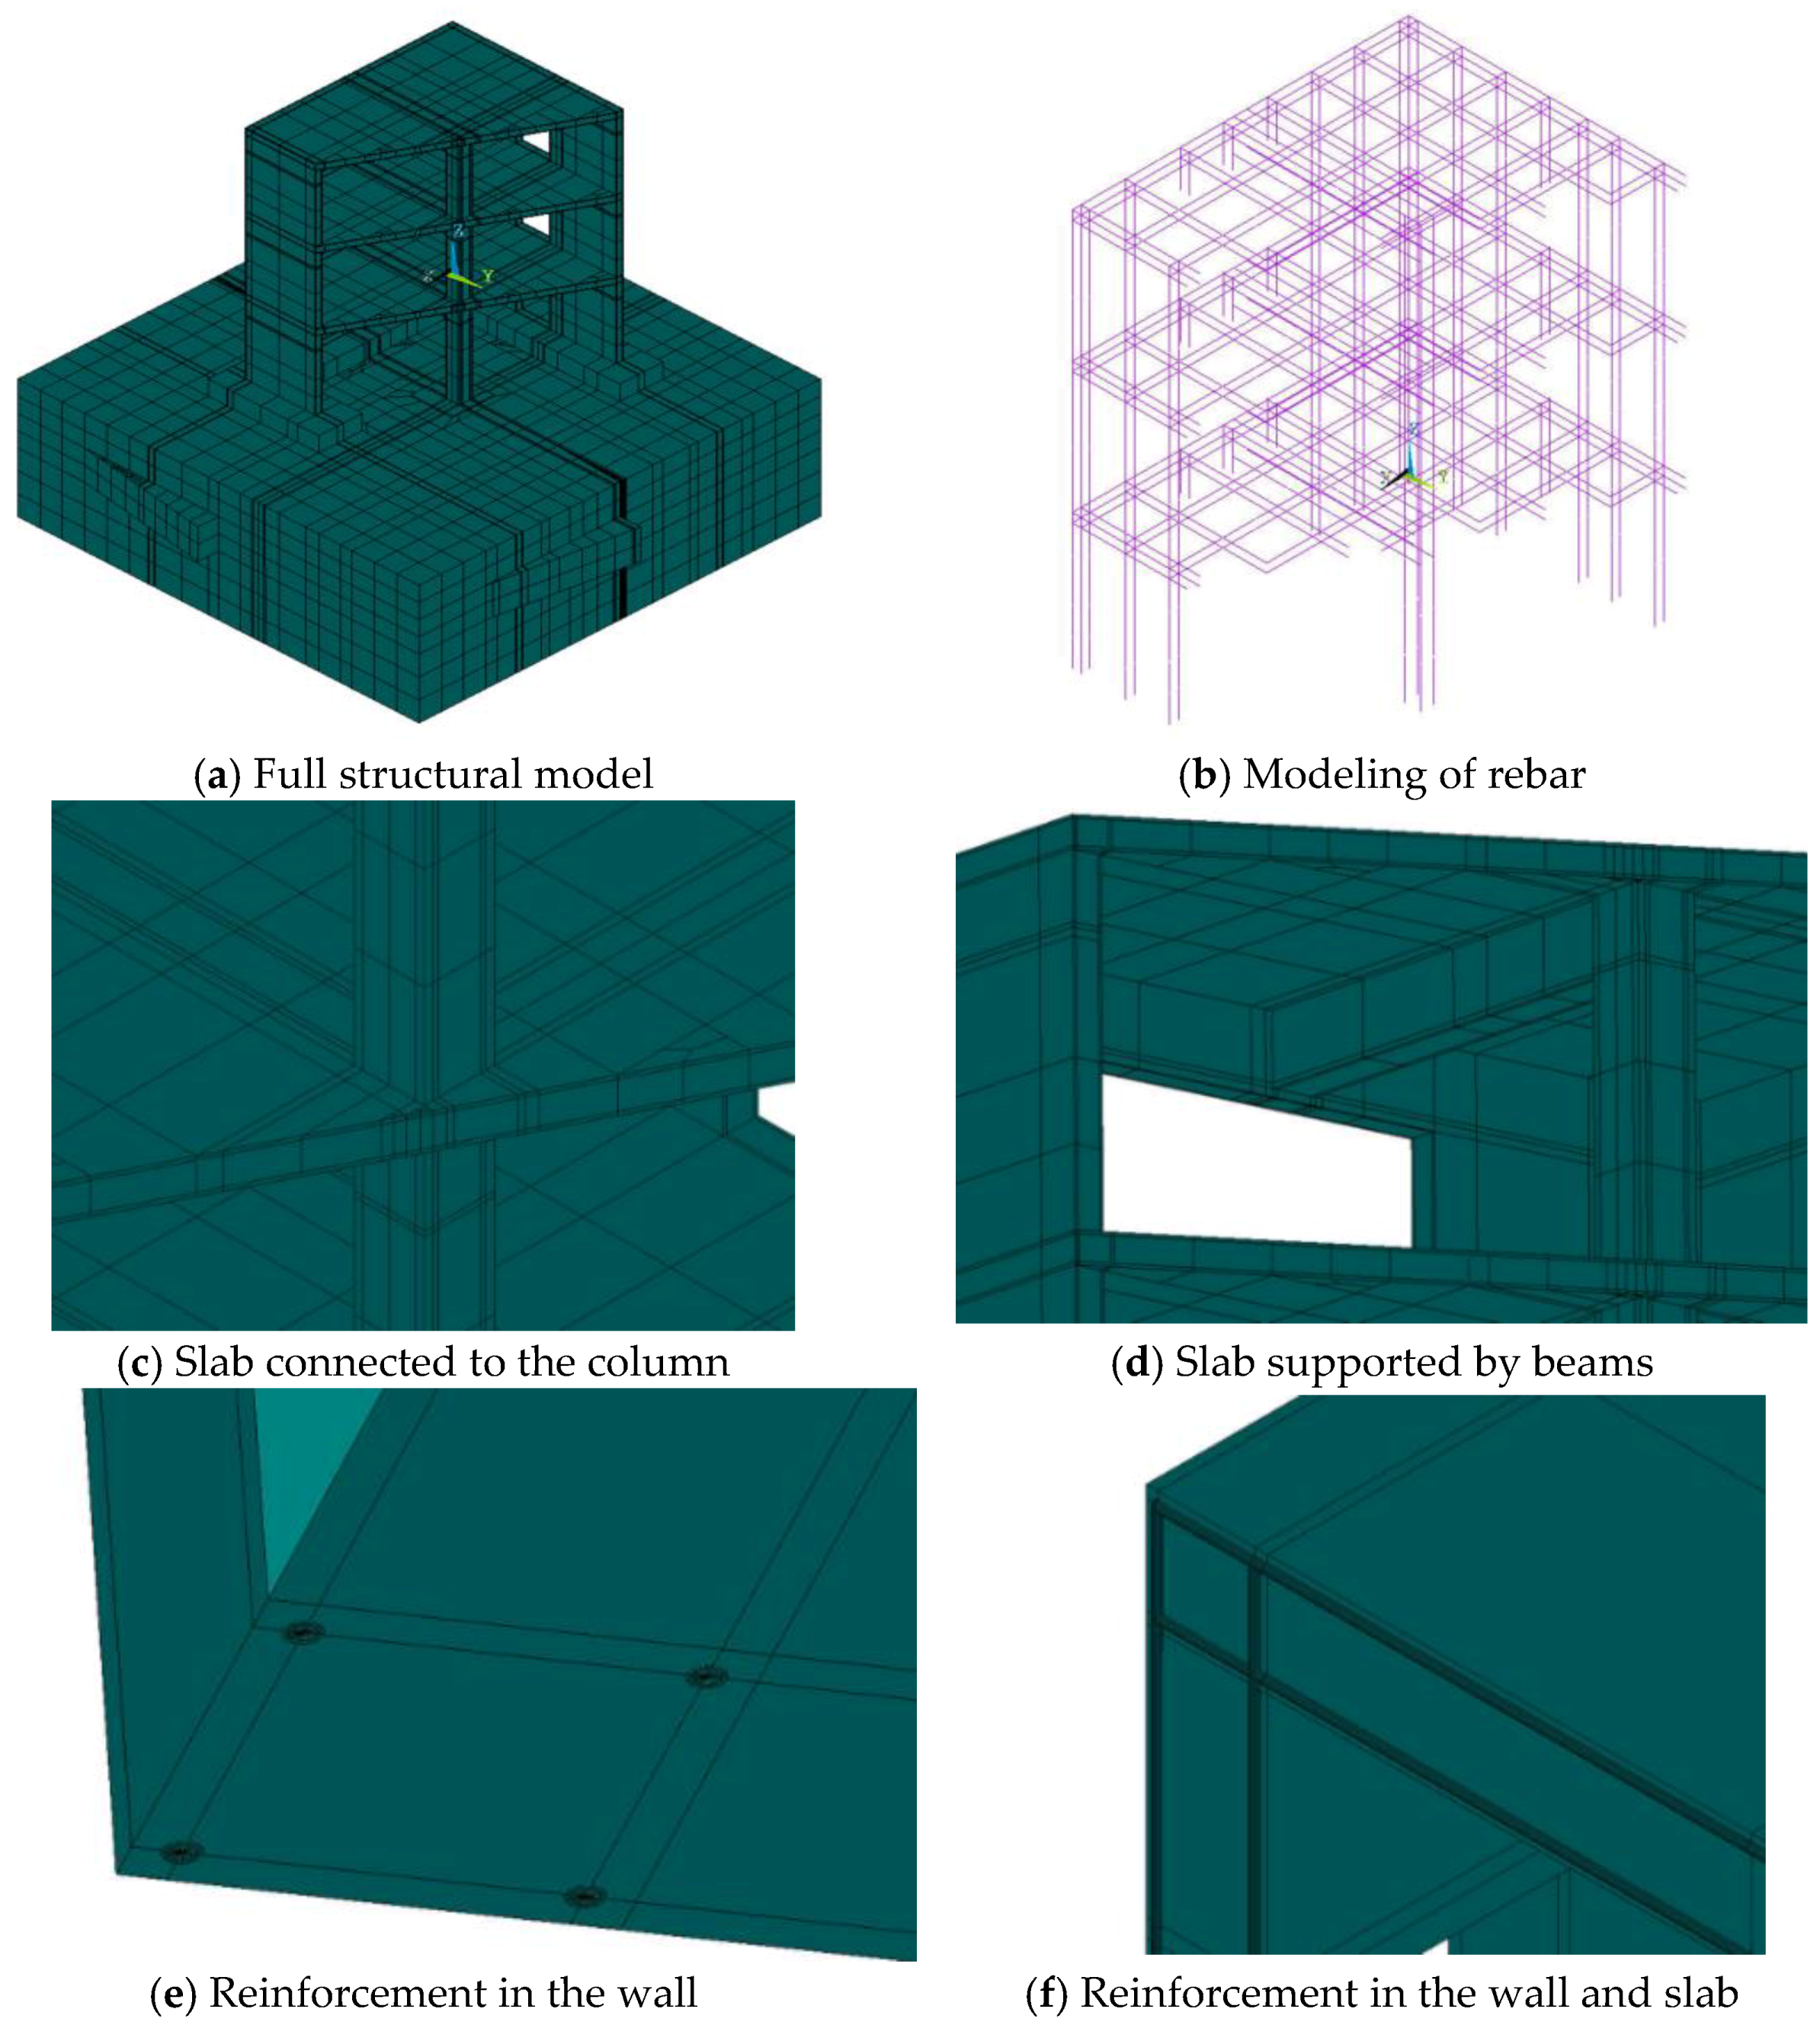
Figure 15.
Mode shapes of the SMART 2013 RC structure for the model Case 1.
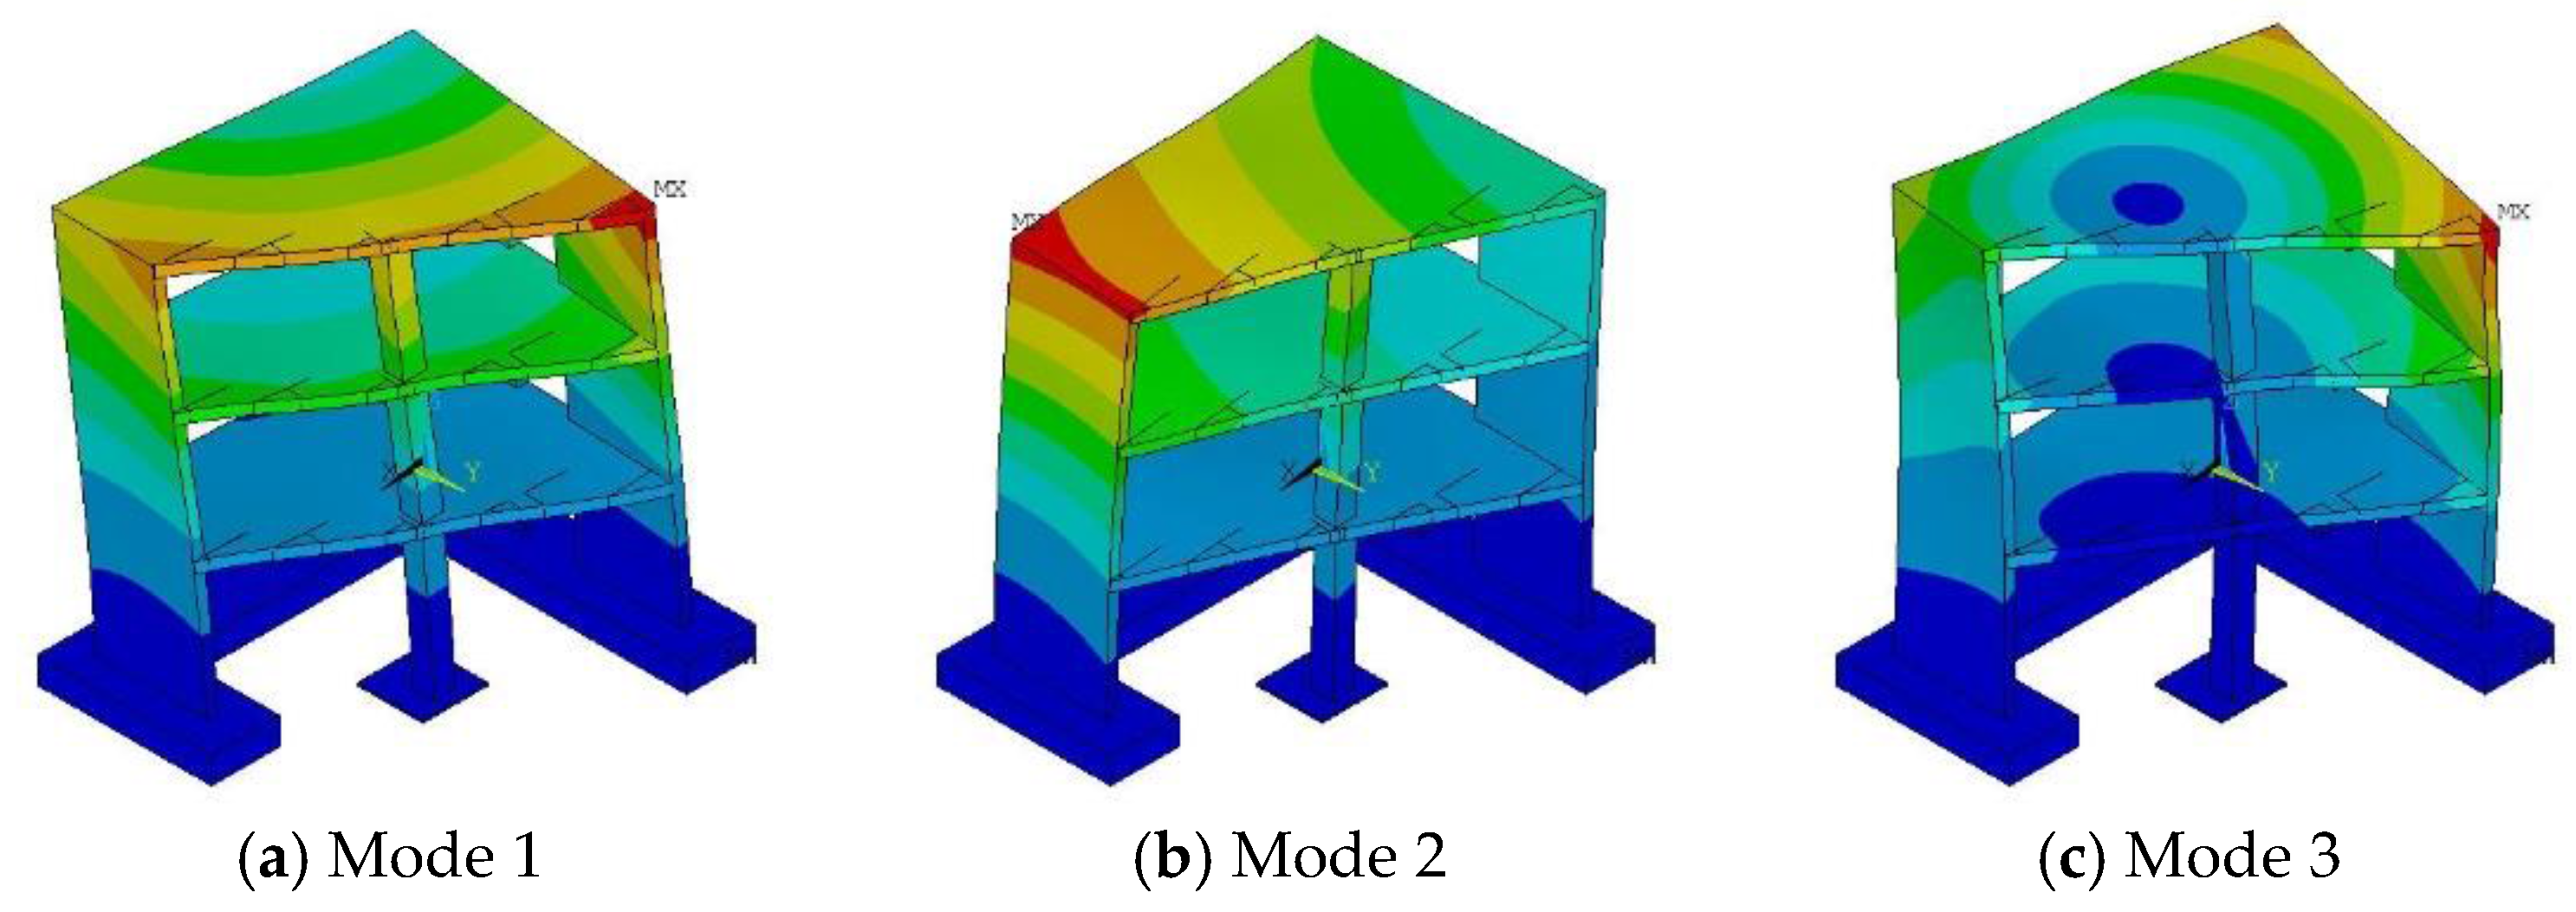
Figure 16.
Mode shapes of the SMART 2013 RC structure for the model Case 2.
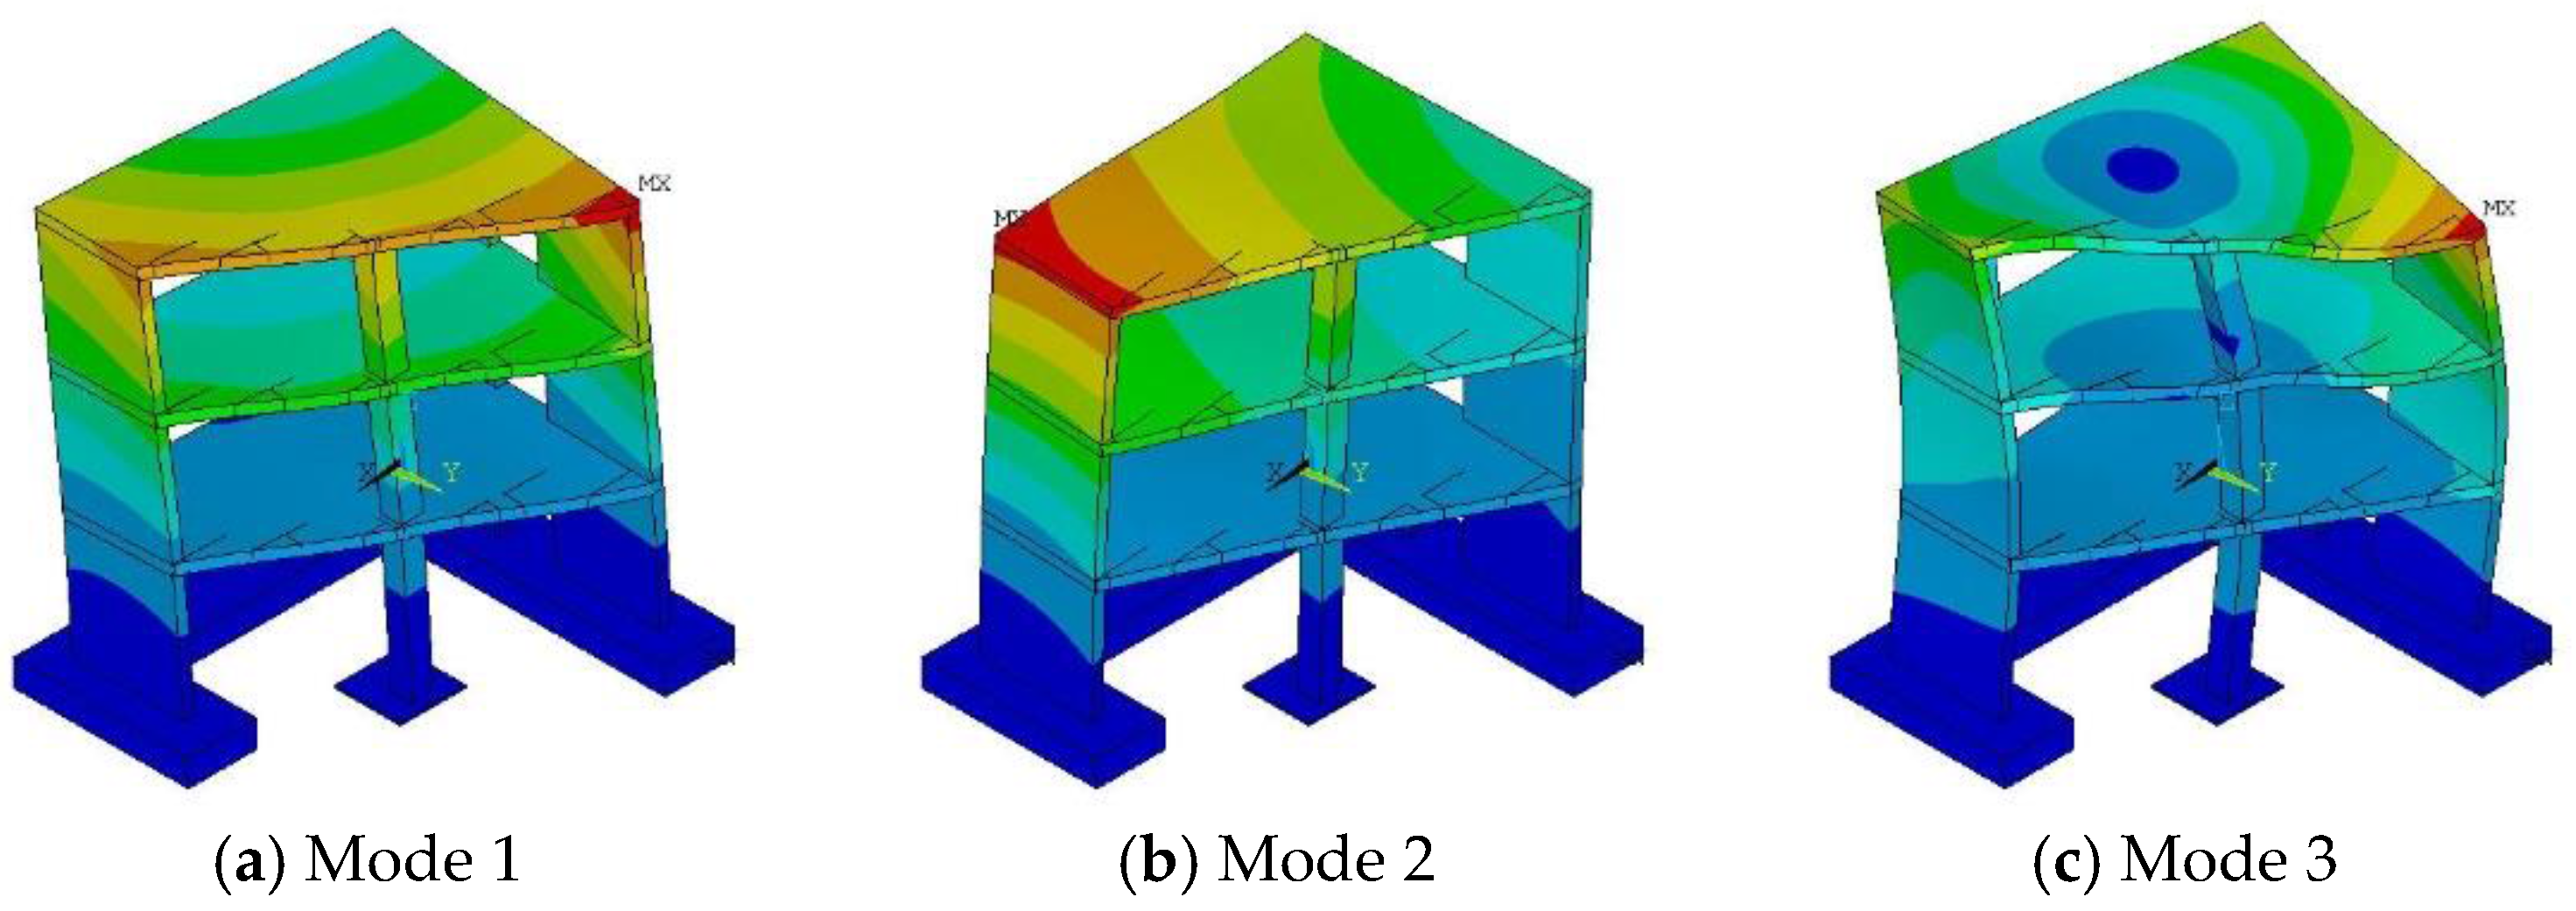
Figure 17.
Mode shapes of the SMART 2013 RC structure for the model Case 3.

Figure 18.
Low-intensity ground motions; (a) ground displacement; (b) ground acceleration.
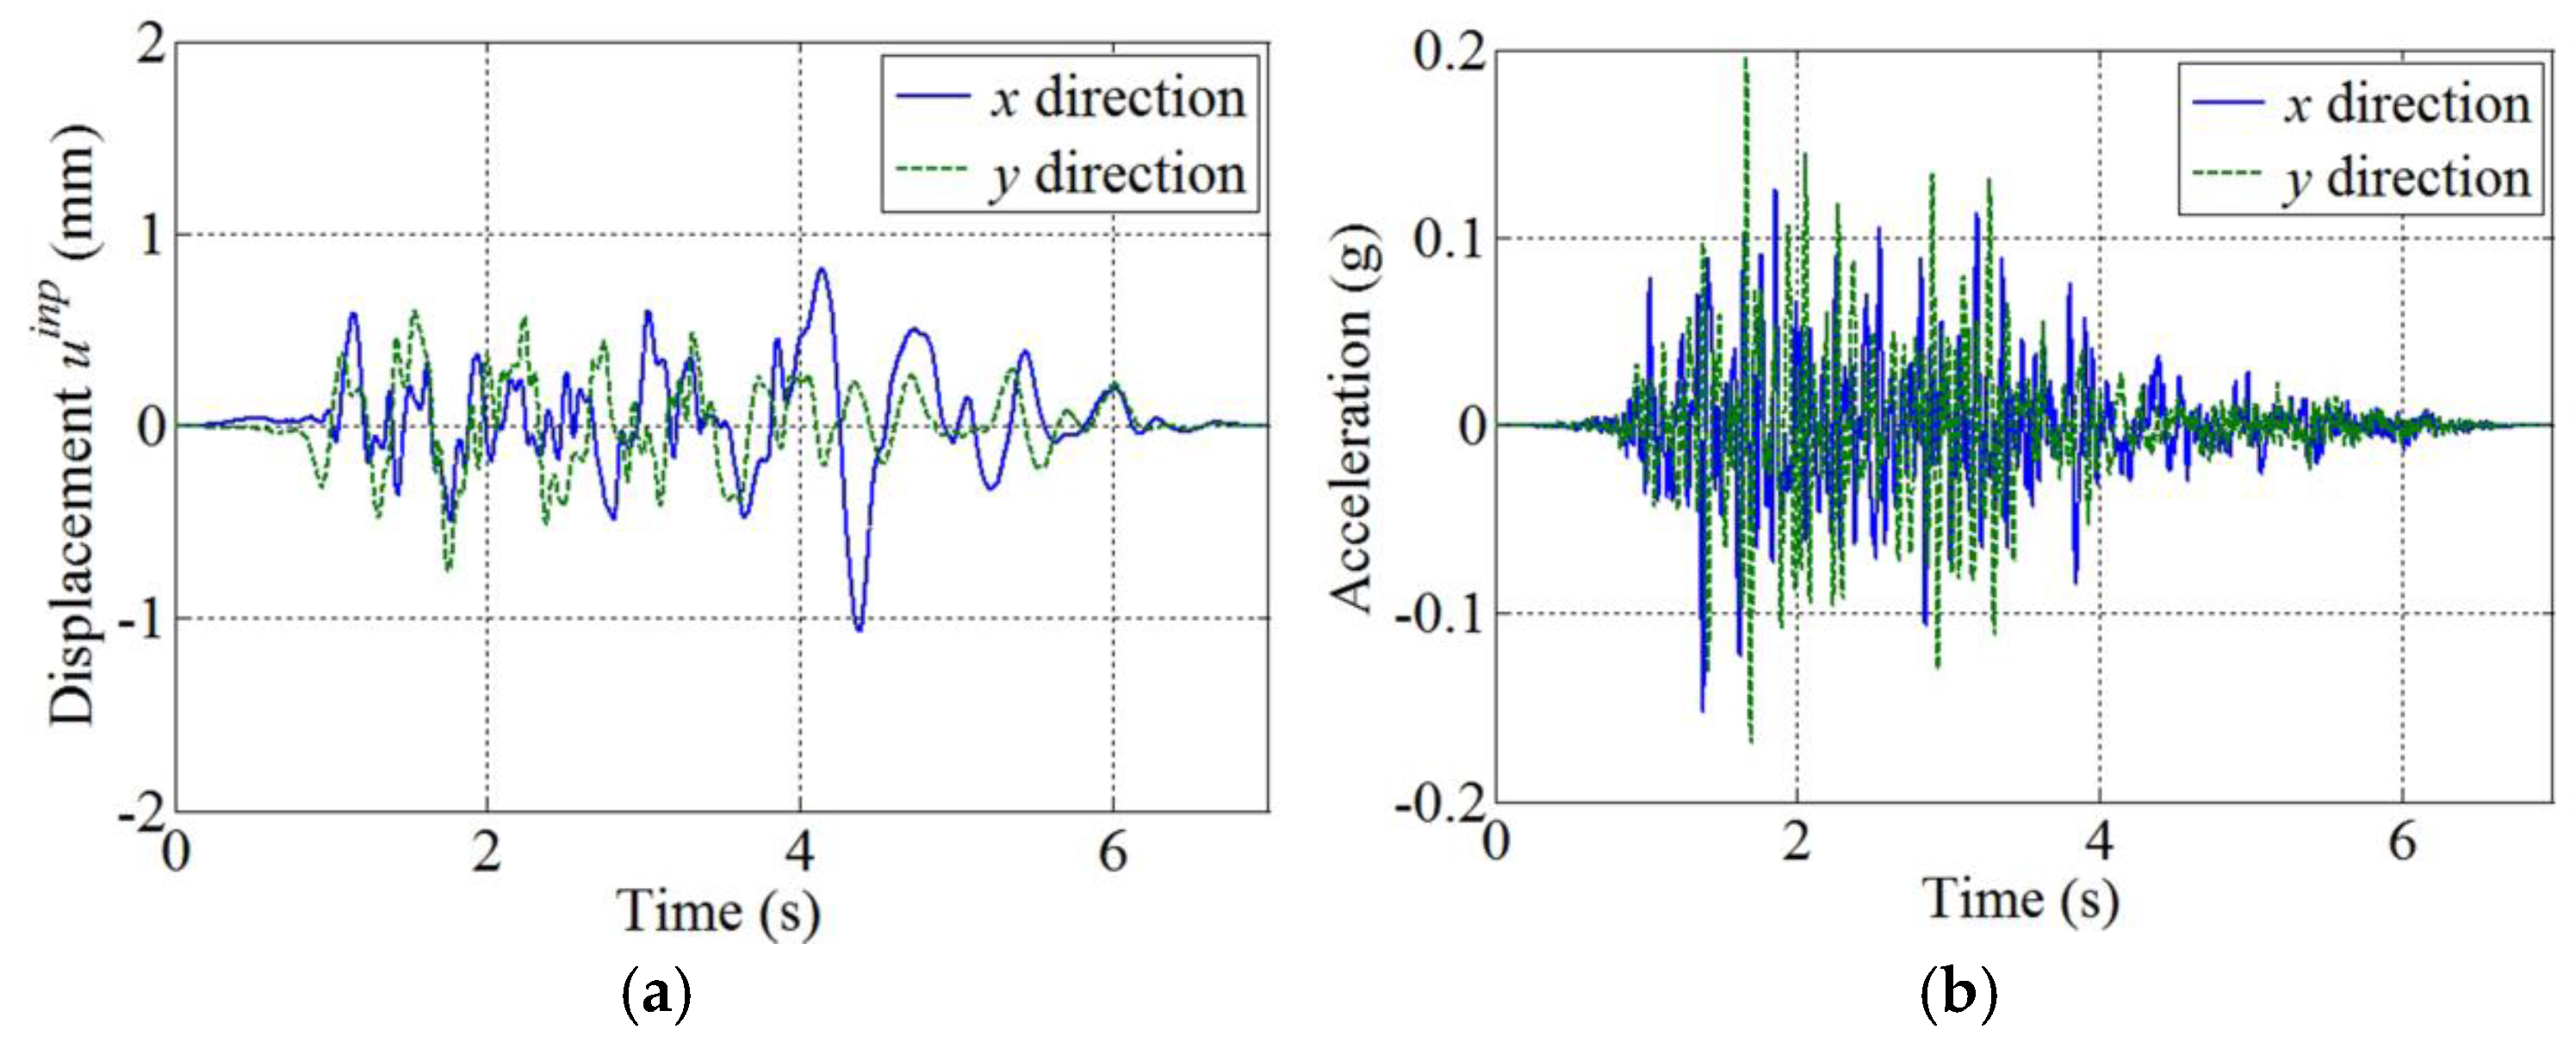
Figure 19.
First-floor response in the x direction due to the low-intensity ground motion; responses sampled at point A.
Figure 19.
First-floor response in the x direction due to the low-intensity ground motion; responses sampled at point A.

Figure 20.
Second-floor response in the x direction due to the low-intensity ground motion; responses sampled at point A.
Figure 20.
Second-floor response in the x direction due to the low-intensity ground motion; responses sampled at point A.

Figure 21.
Third-floor response in the x direction due to the low-intensity ground motion; responses sampled at point A.
Figure 21.
Third-floor response in the x direction due to the low-intensity ground motion; responses sampled at point A.

Figure 22.
High-intensity ground motions for a nonlinear seismic analysis of the SMART 2013 structure.
Figure 22.
High-intensity ground motions for a nonlinear seismic analysis of the SMART 2013 structure.

Figure 23.
Numerical and experimental responses in the x direction due to the ground motion of Run 9; responses sampled at point A on the third floor.
Figure 23.
Numerical and experimental responses in the x direction due to the ground motion of Run 9; responses sampled at point A on the third floor.
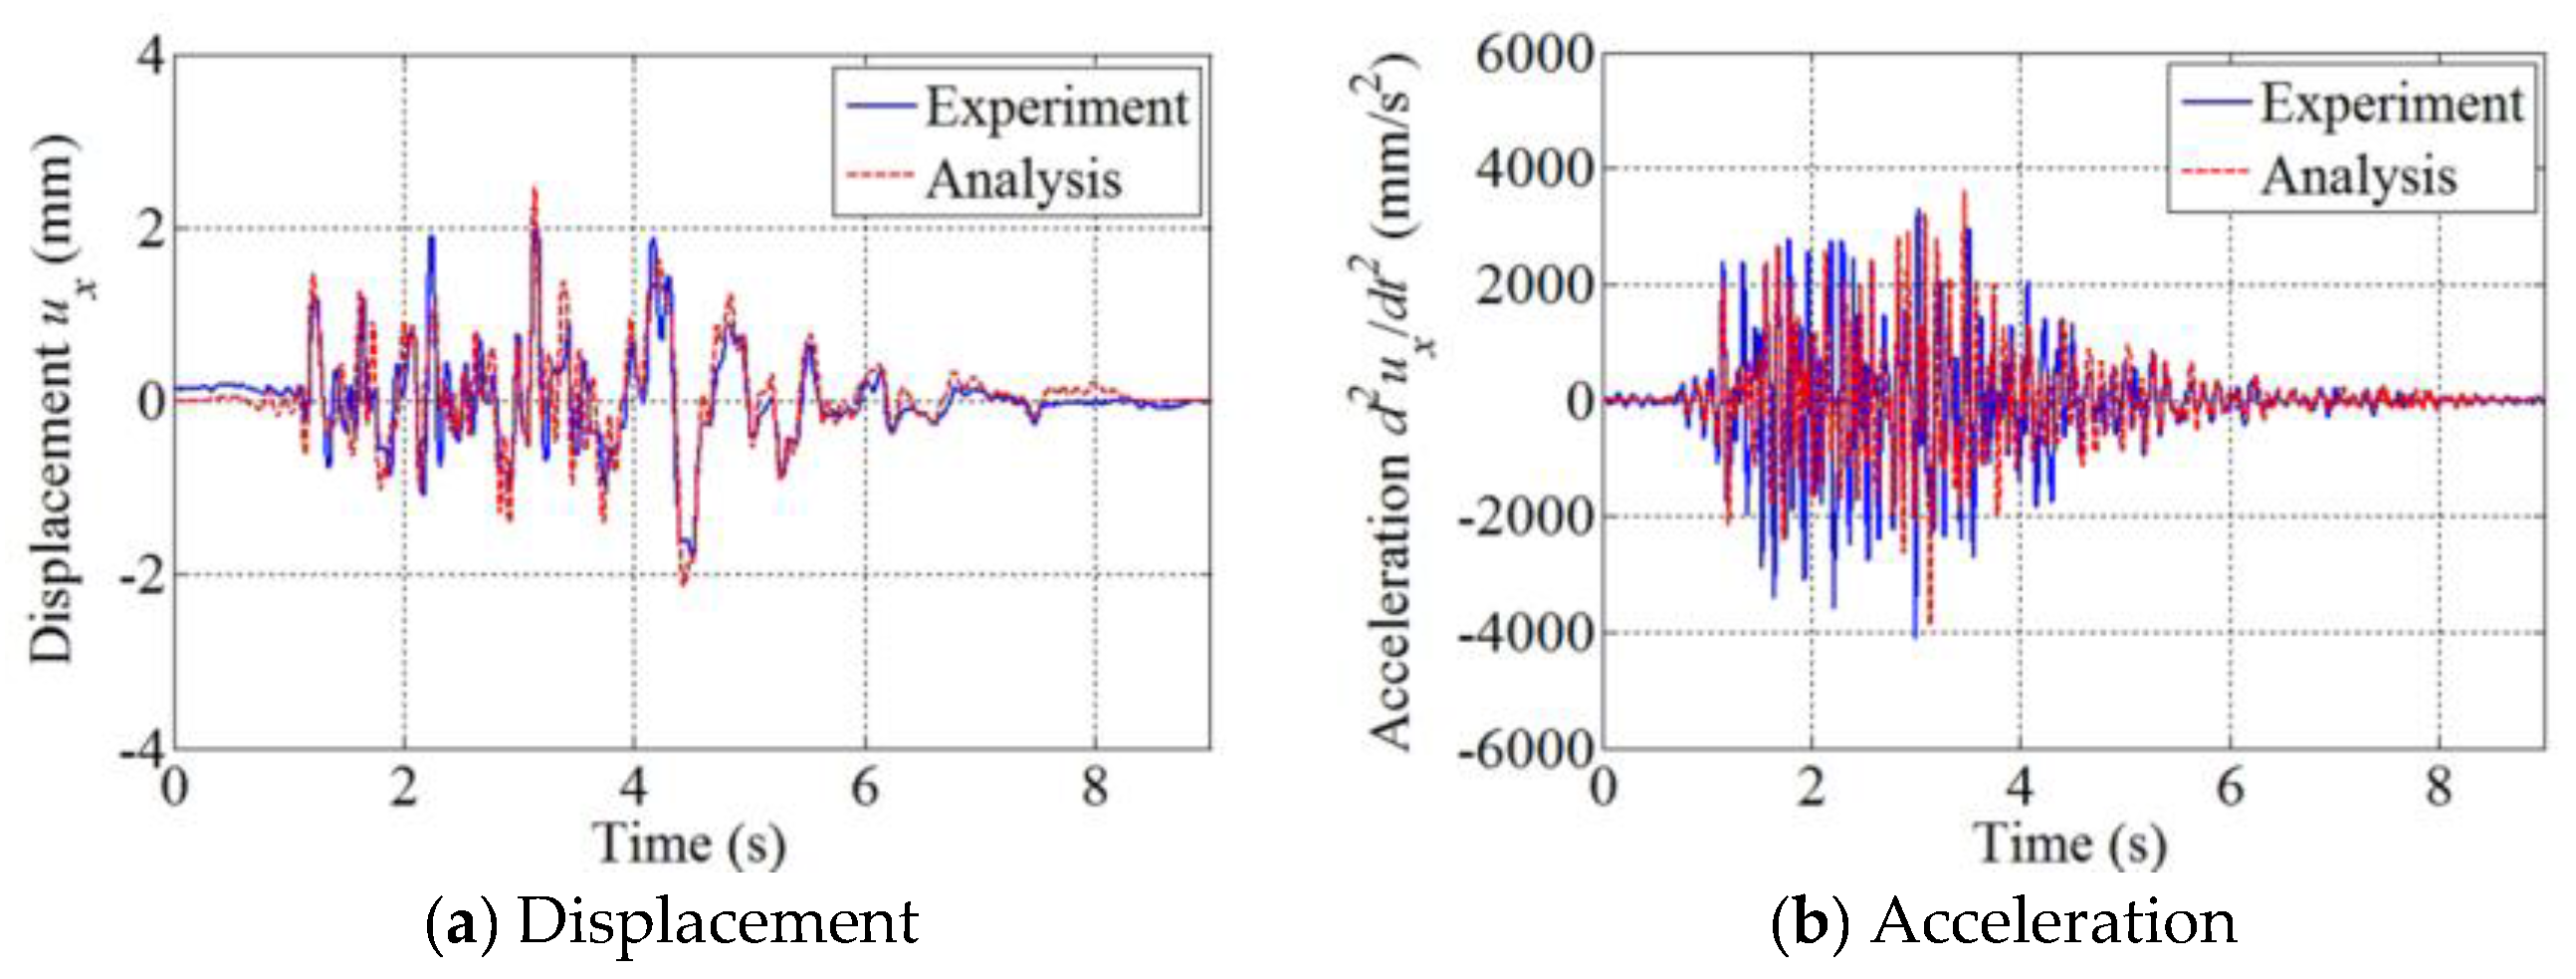
Figure 24.
Numerical and experimental responses in the x direction due to the scaled Northridge earthquake of Run 11; responses sampled at point A on the third floor.
Figure 24.
Numerical and experimental responses in the x direction due to the scaled Northridge earthquake of Run 11; responses sampled at point A on the third floor.

Figure 25.
Numerical and experimental responses in the x direction due to the scaled Northridge earthquake of Run 13; responses sampled at point A on the third floor.
Figure 25.
Numerical and experimental responses in the x direction due to the scaled Northridge earthquake of Run 13; responses sampled at point A on the third floor.

Figure 26.
Numerical and experimental responses in the x direction due to the scaled Northridge earthquake of Run 17; responses sampled at point A on the third floor.
Figure 26.
Numerical and experimental responses in the x direction due to the scaled Northridge earthquake of Run 17; responses sampled at point A on the third floor.

Figure 27.
Numerical and experimental responses due to real Northridge earthquake of Run 19; responses sampled at point A on the third floor.
Figure 27.
Numerical and experimental responses due to real Northridge earthquake of Run 19; responses sampled at point A on the third floor.
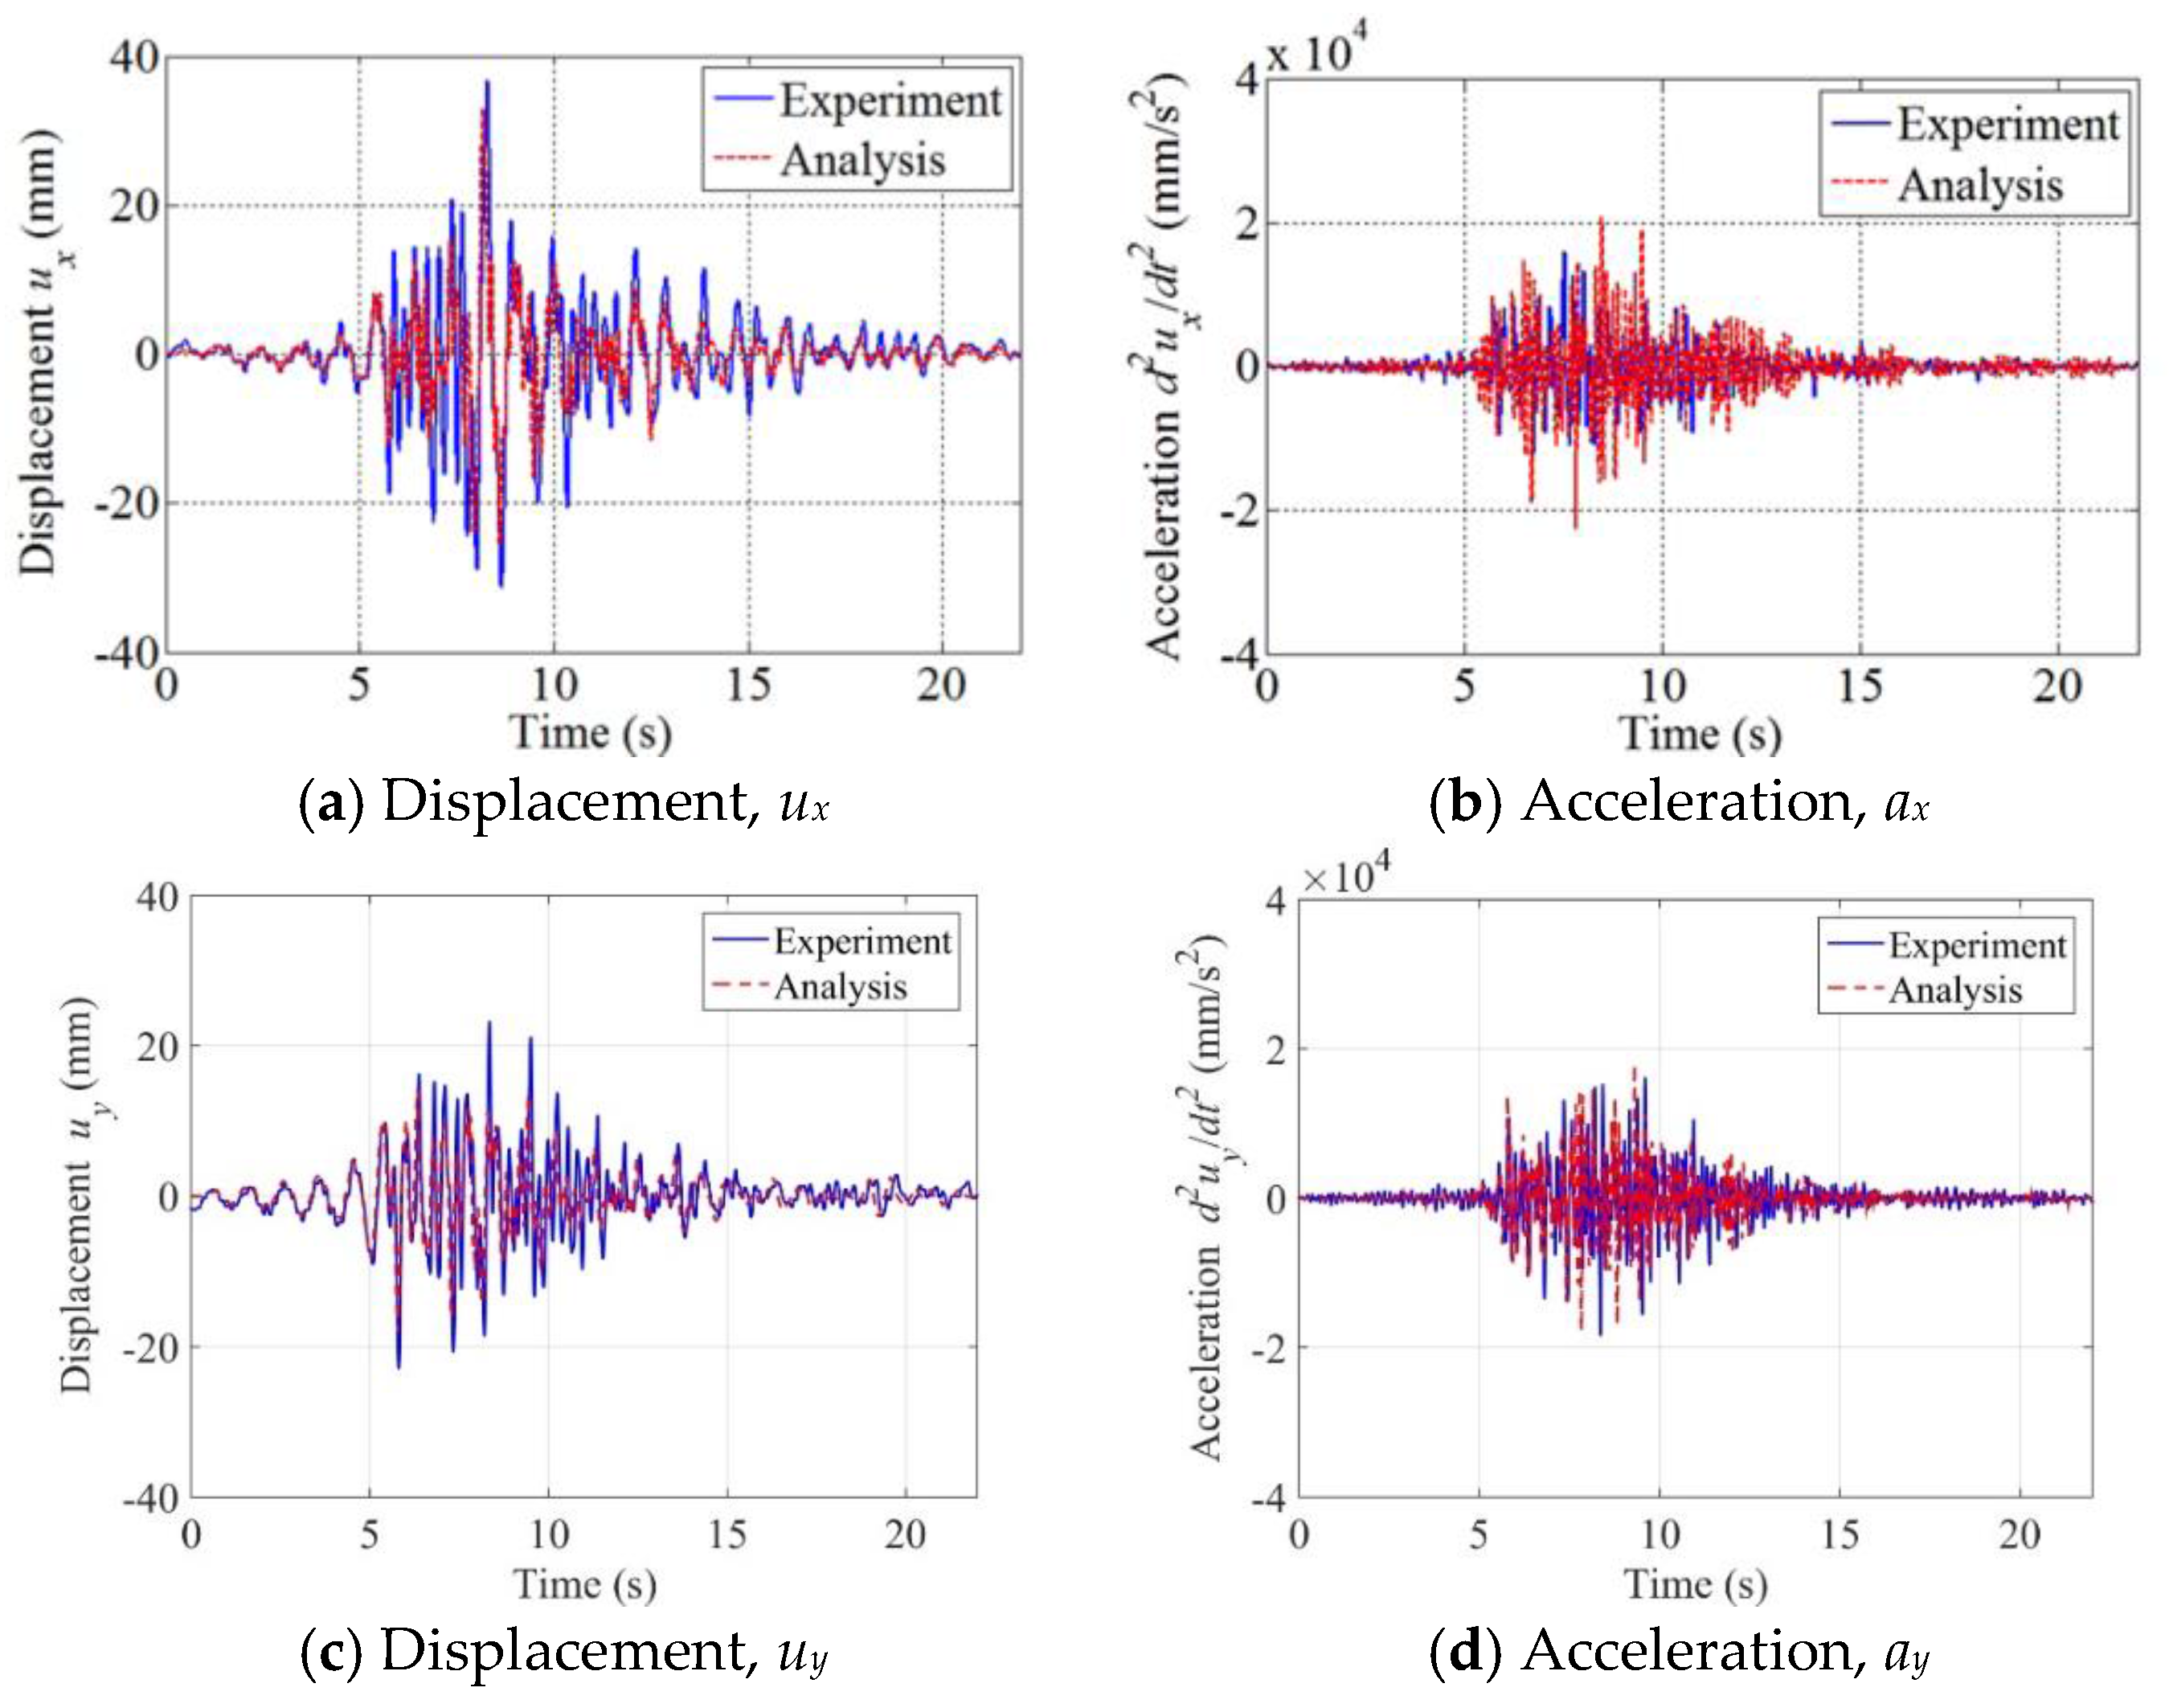
Figure 28.
Numerical and experimental responses in the x direction due to the scaled Northridge aftershock of Run 21; responses sampled at point A on the third floor.
Figure 28.
Numerical and experimental responses in the x direction due to the scaled Northridge aftershock of Run 21; responses sampled at point A on the third floor.

Figure 29.
Numerical and experimental responses in the x direction due to real Northridge aftershock of Run 23; responses sampled at point A on the third floor.
Figure 29.
Numerical and experimental responses in the x direction due to real Northridge aftershock of Run 23; responses sampled at point A on the third floor.


Figure 31.
Frequency spectrum of the x directional displacement at point A on the third floor.
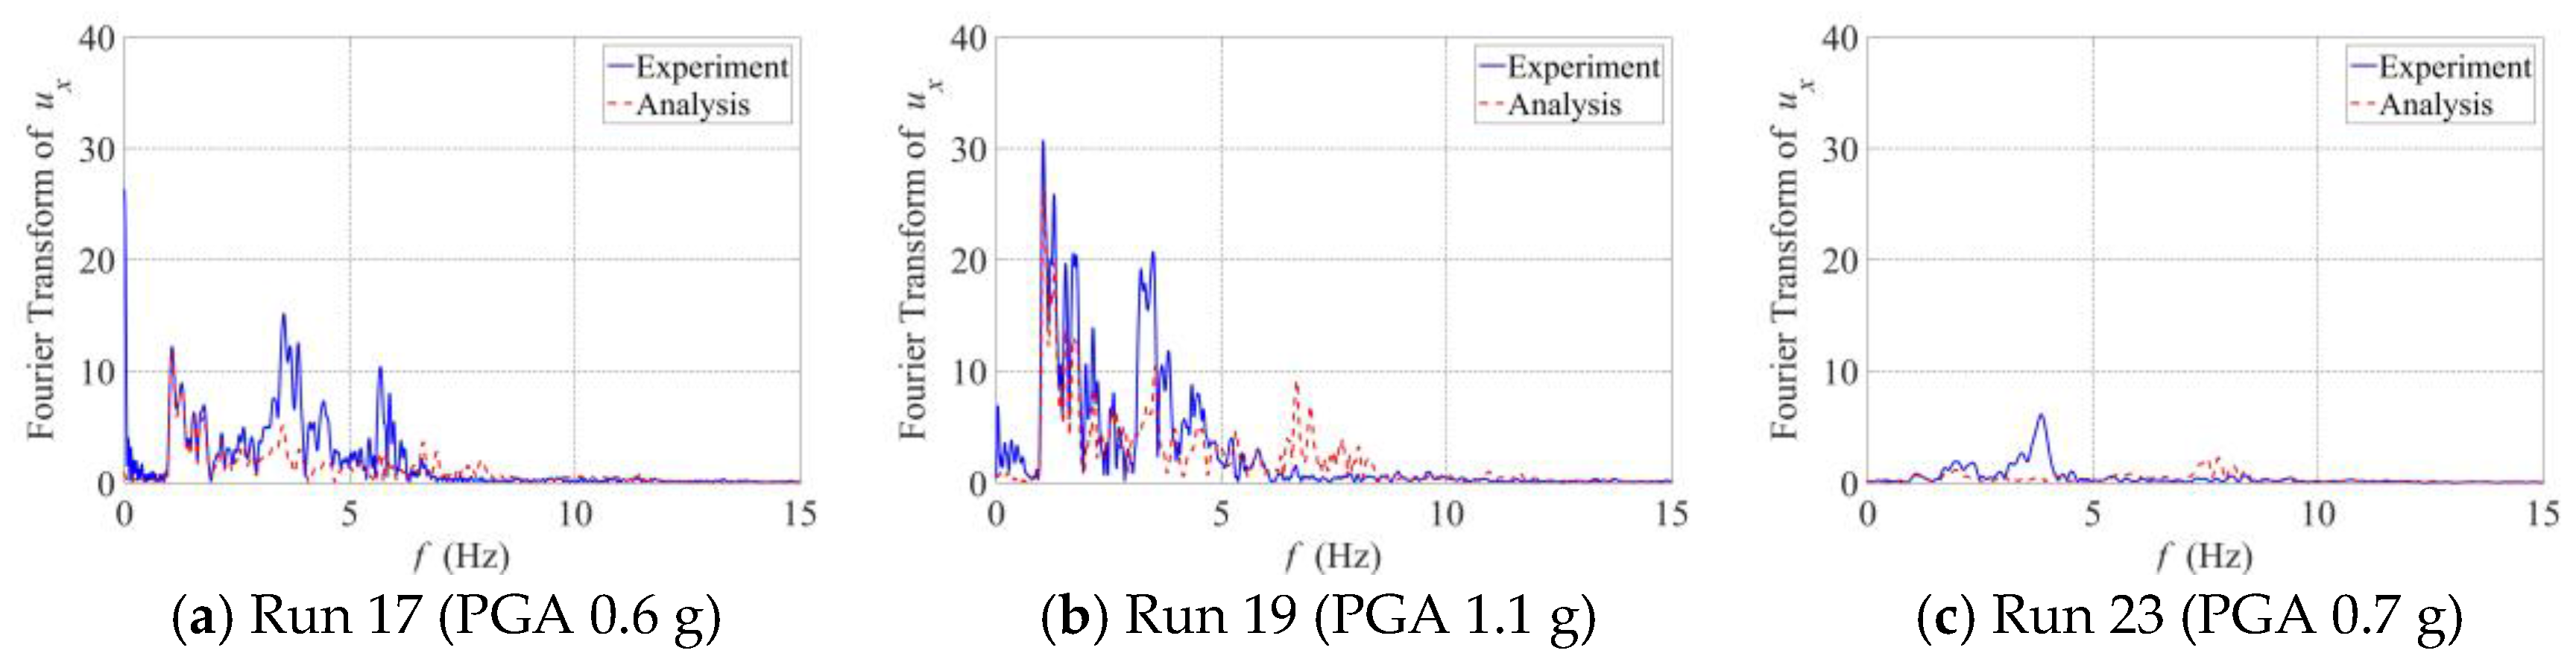
Figure 32.
Frequency spectrum of the y directional displacement at point A on the third floor.
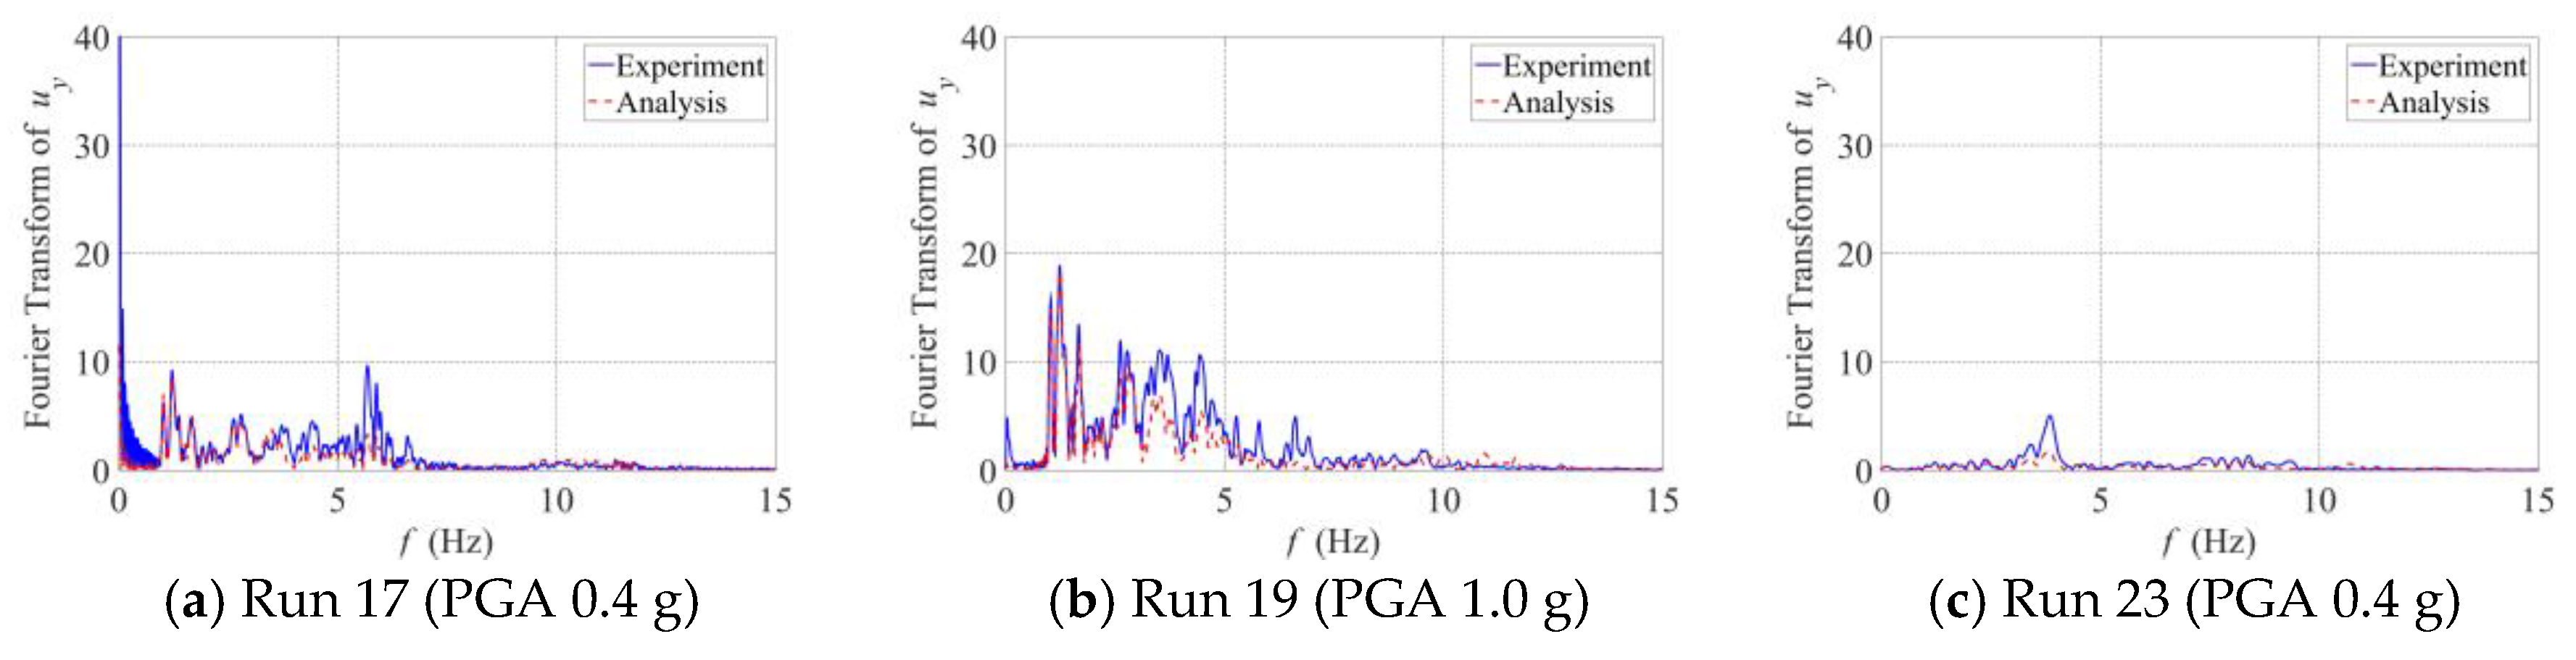
Figure 33.
Displacement trace at sampling points during the Northridge main shock of Run 19.
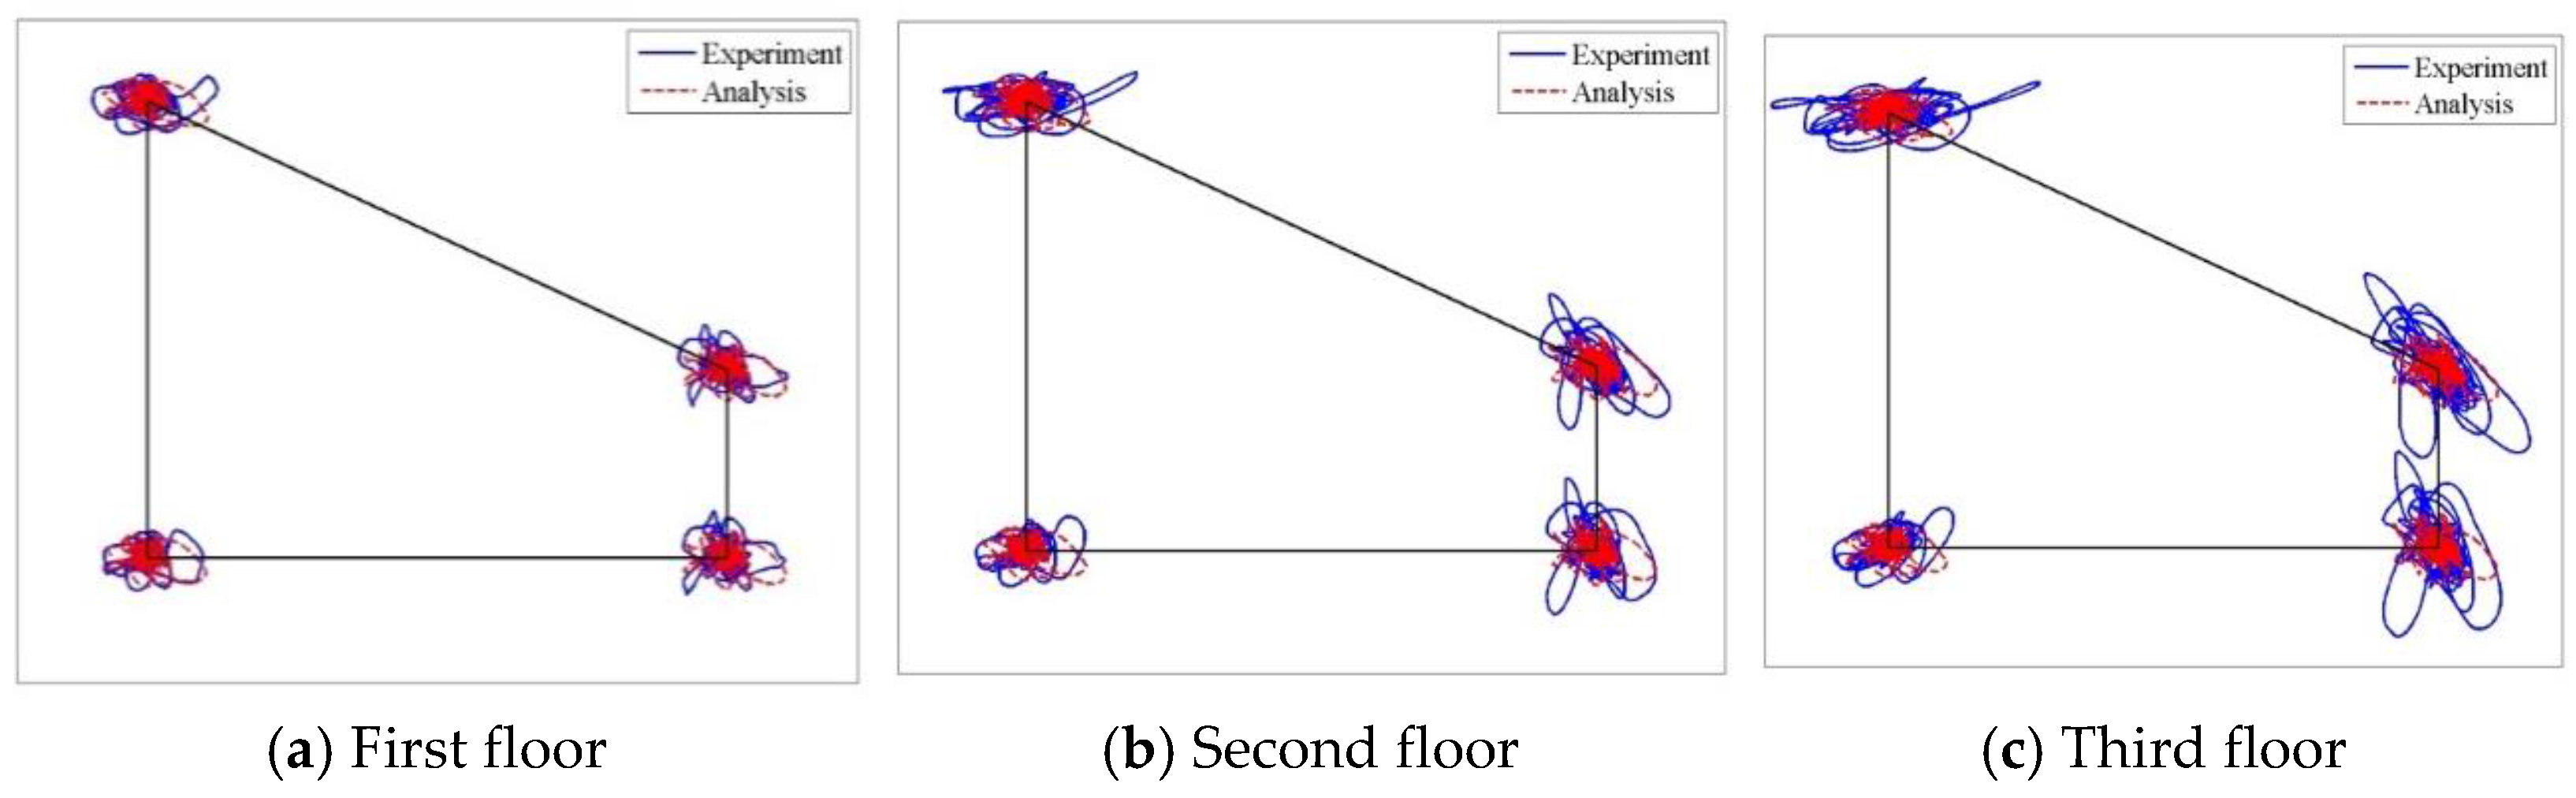
Figure 34.
Distortion of each floor due to the Northridge main shock (Run 19) at 8.6 s.

Figure 35.
Finite element modeling of a hypothetical symmetric structure for comparison with the SMART 2013 RC structure.
Figure 35.
Finite element modeling of a hypothetical symmetric structure for comparison with the SMART 2013 RC structure.

Figure 36.
Displacement responses of the asymmetric SMART 2013 structure and the hypothetical symmetric structure due to the Northridge earthquake (Run 19); Responses sampled at point D.
Figure 36.
Displacement responses of the asymmetric SMART 2013 structure and the hypothetical symmetric structure due to the Northridge earthquake (Run 19); Responses sampled at point D.
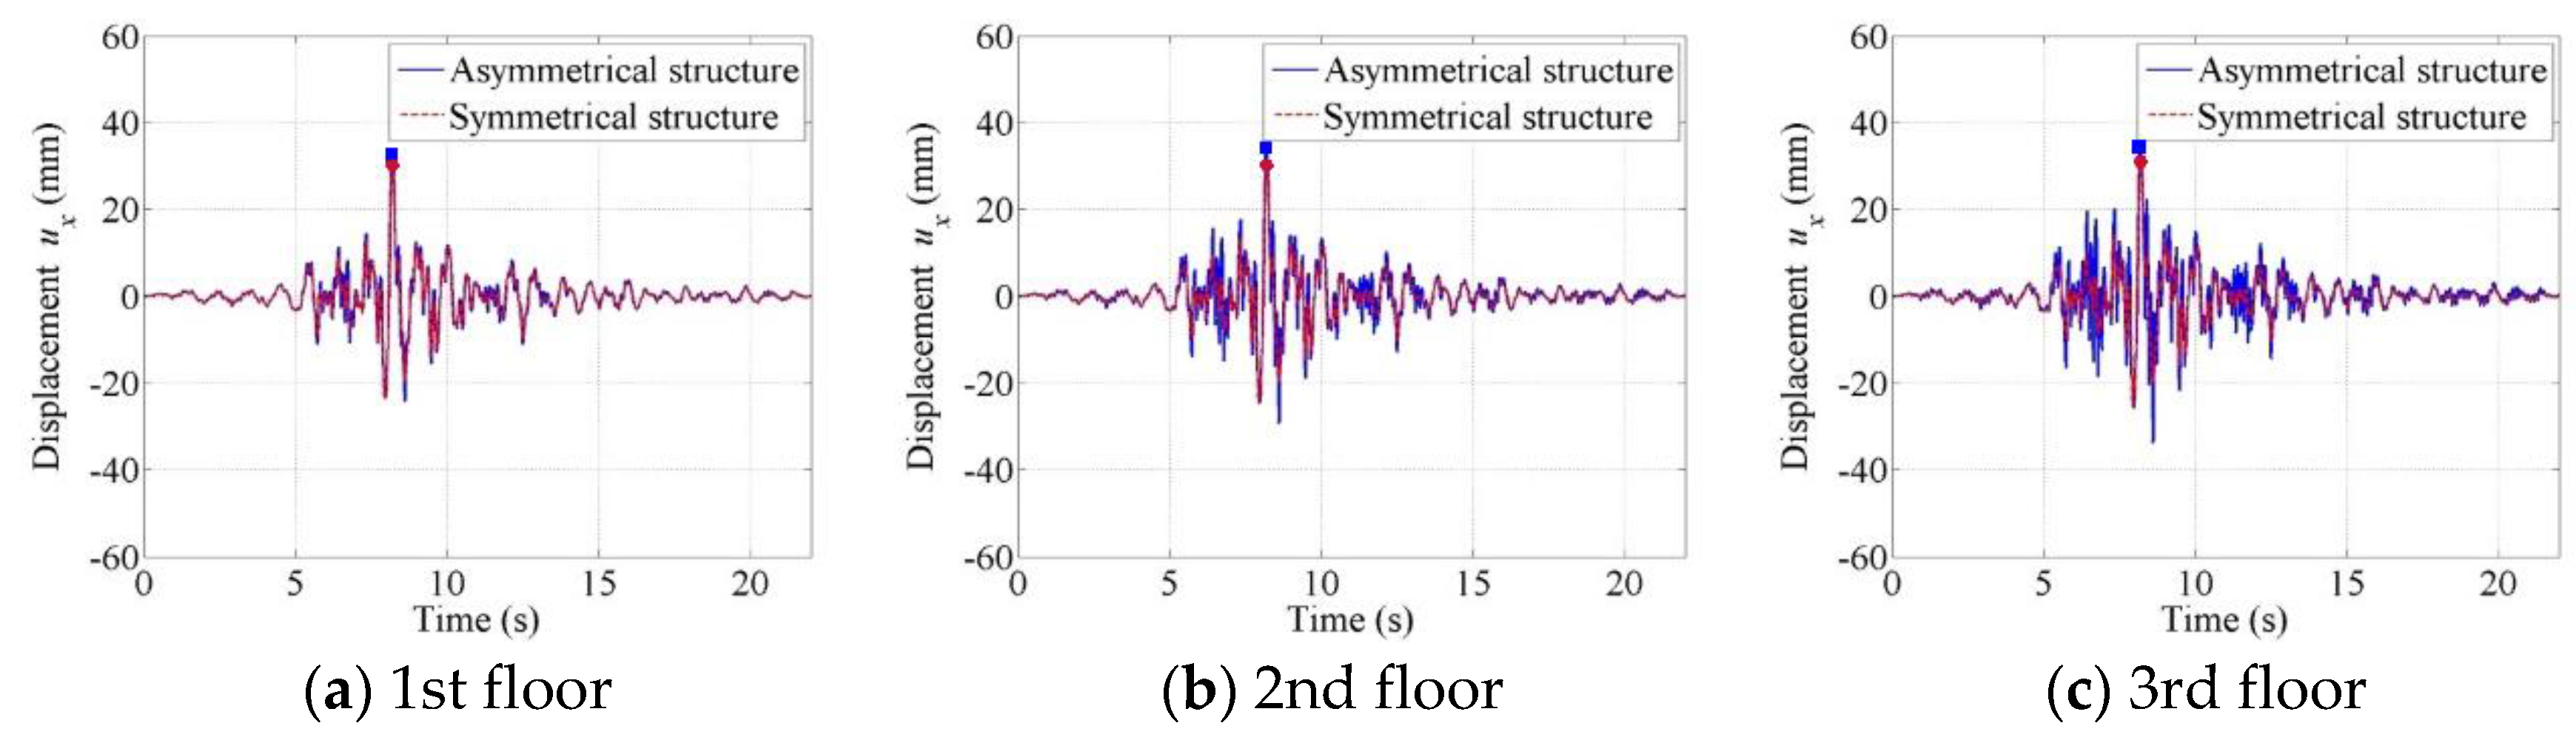
Figure 37.
Displacement frequency spectra of the asymmetric SMART 2013 structure and the hypothetical symmetric structure due to the Northridge earthquake (Run 19); Displacement amplitude sampled at point D.
Figure 37.
Displacement frequency spectra of the asymmetric SMART 2013 structure and the hypothetical symmetric structure due to the Northridge earthquake (Run 19); Displacement amplitude sampled at point D.
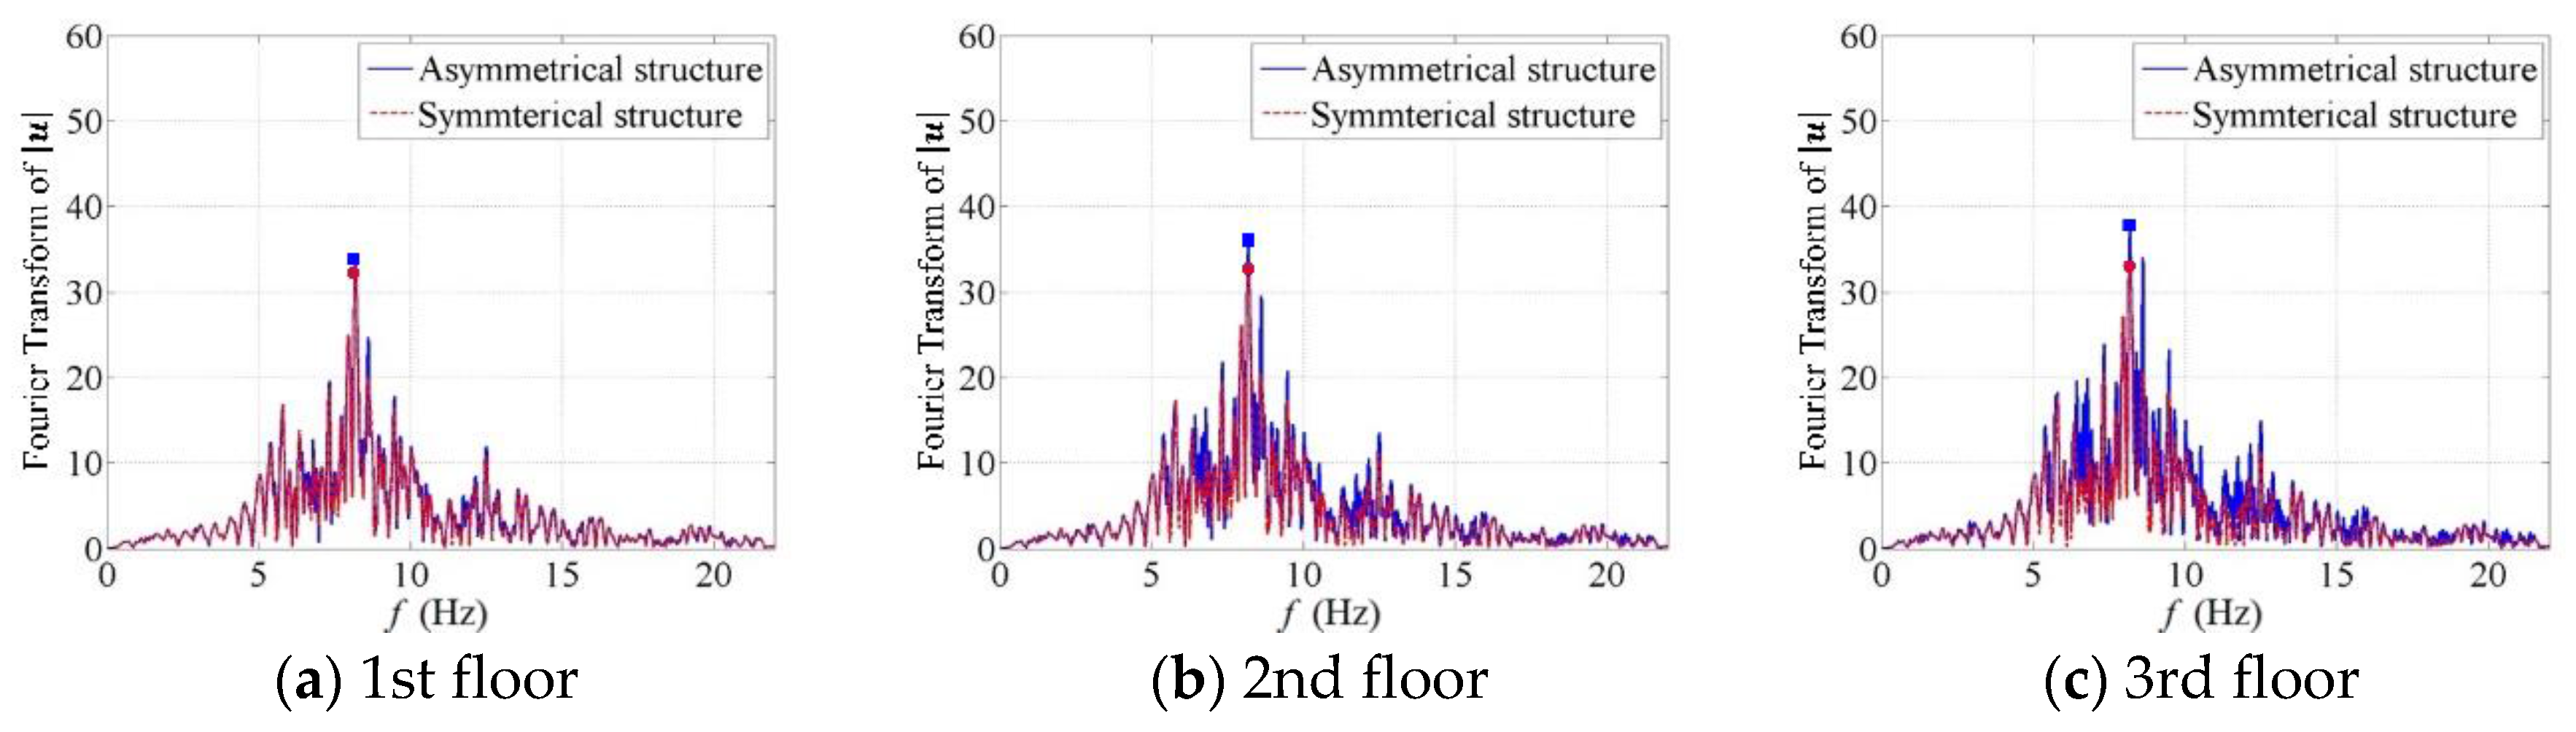
Figure 38.
Absolute maximum displacement in the x-direction of the asymmetric and the hypothetical symmetric structures due to the Northridge earthquake (Run 19).
Figure 38.
Absolute maximum displacement in the x-direction of the asymmetric and the hypothetical symmetric structures due to the Northridge earthquake (Run 19).
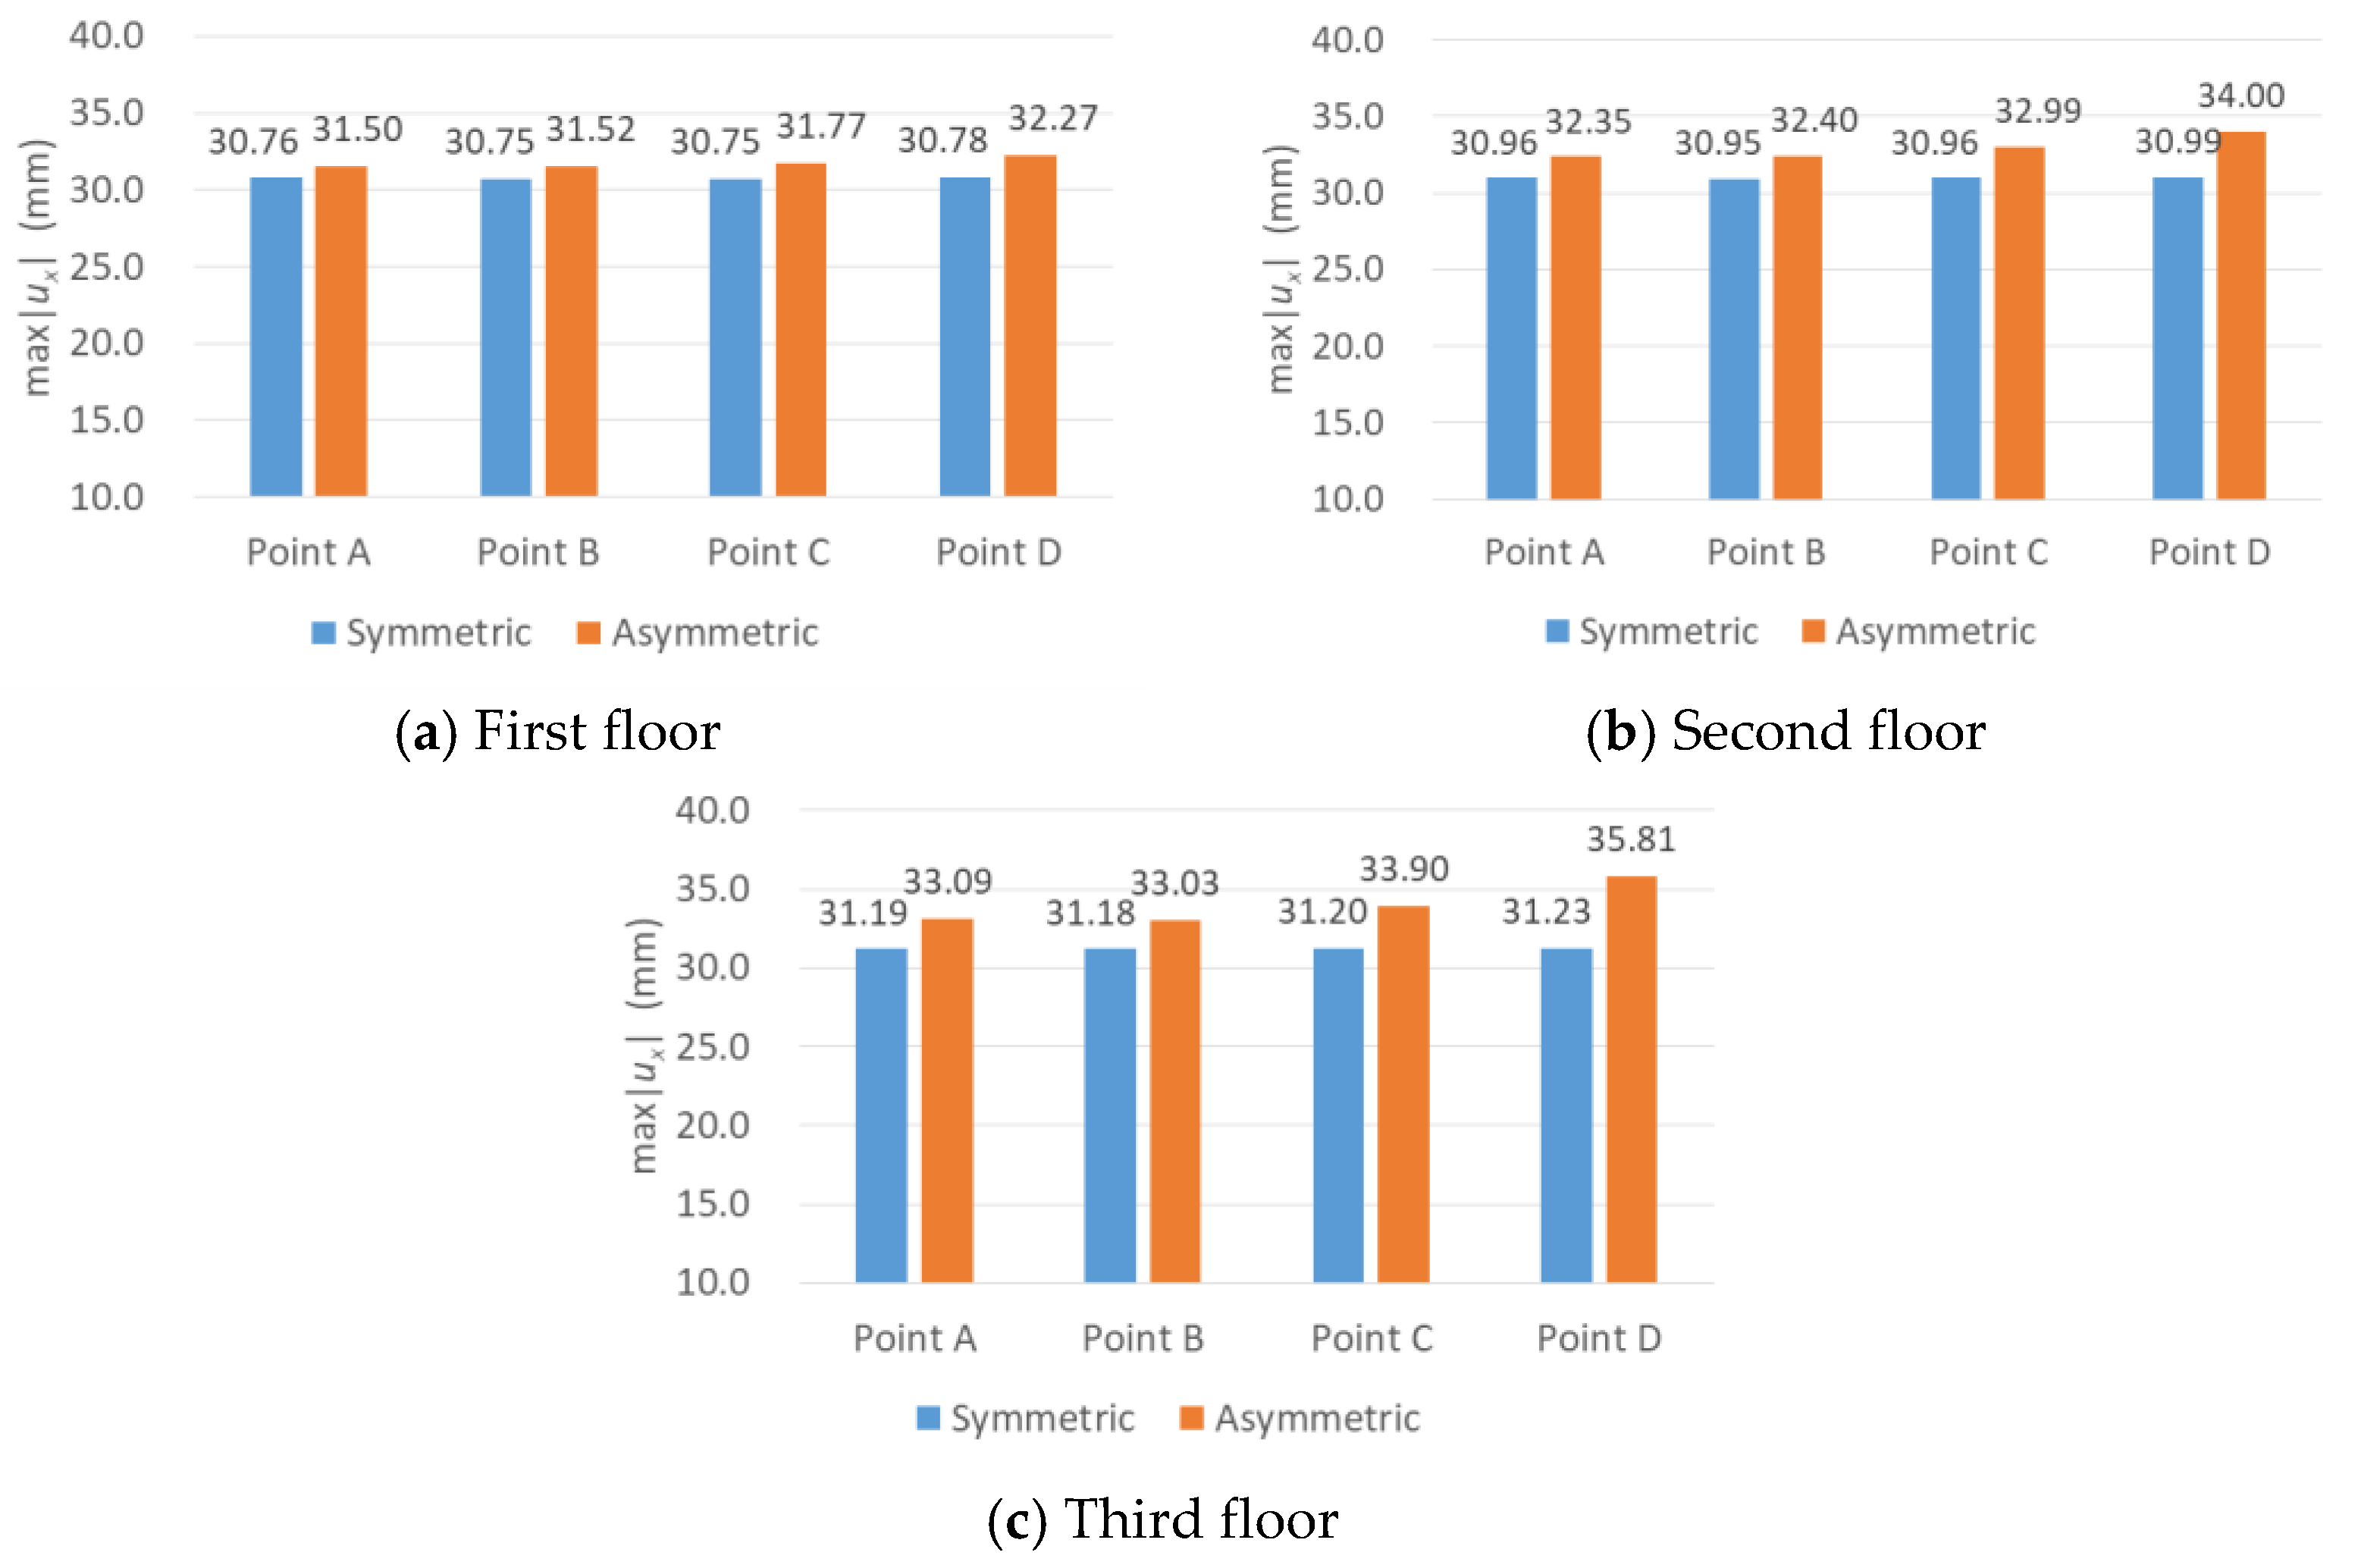
Figure 39.
Absolute maximum displacement in the y direction of the asymmetric and the hypothetical symmetric structures due to the Northridge earthquake (Run 19).
Figure 39.
Absolute maximum displacement in the y direction of the asymmetric and the hypothetical symmetric structures due to the Northridge earthquake (Run 19).

Table 1.
Dimensions of the structural components of the SMART (Seismic design and best-estimate Methods Assessment for Reinforced concrete buildings subjected to Torsion and nonlinear effects) 2013 reinforced concrete (RC) structure.
Table 1.
Dimensions of the structural components of the SMART (Seismic design and best-estimate Methods Assessment for Reinforced concrete buildings subjected to Torsion and nonlinear effects) 2013 reinforced concrete (RC) structure.
| Structural Component | Length (mm) | Thickness (mm) | Height (mm) |
|---|---|---|---|
| Wall (V01 + V02) | 3100 | 100 | 3650 |
| Wall V03 | 2550 | 100 | 3650 |
| Wall V04 | 1050 | 100 | 3650 |
| Beams | 1450 | 150 | 325 |
| Column | 200 | 200 | 3900 |
Table 2.
Material properties of concrete and rebar obtained by experiments [24].
Table 2.
Material properties of concrete and rebar obtained by experiments [24].
| Structural Component | Young’s Modulus (MPa) | Poisson’s Ratio | Compressive Strength (MPa) | Tensile Strength (MPa) | Mass Density (kg·m−3) |
|---|---|---|---|---|---|
| Foundation concrete | 25,400 | 0.17 | 43.3 | 3.45 | 2300 |
| Slab concrete on the first floor | 28,200 | 0.18 | 41.1 | 3.25 | 2300 |
| Slab concrete on the second floor | 24,700 | 0.17 | 36.8 | 3.35 | 2300 |
| Slab concrete on the third floor | 24,400 | 0.18 | 37.8 | 3.40 | 2300 |
| Wall concrete | 28,700 | 0.19 | 41.7 | 3.89 | 2300 |
| Steel reinforcement | 267,333 | 0.30 | 528 | 528 | 7800 |
Table 3.
Configuration of the local test. RVE: representative volume element.
| Test No. | Material | Aim | Loading Conditions |
|---|---|---|---|
| c.1 | Concrete | Construct failure surface | Biaxial tension–compression loading from –35 MPa to 2.4 MPa |
| rc.1 | Reinforced concrete | Identify axial cyclic response of RC RVE | Uniaxial cyclic tension–compression loading with displacement ranging from −4 mm to 1.5 mm |
| rc.2 | Reinforced concrete | Identify shear cyclic response of RC RVE | Cyclic pure shear loading with the force ranging from −6 KN to 6 KN |
Table 4.
Geometrical characteristics of the finite element (FE) model.
| Geometrical Characteristics of the FE Model | Number |
|---|---|
| Total number of elements | 13,391 |
| Total number of nodes | 14,479 |
| Number of solid elements | 11,007 |
| Number of beam elements | 2384 |
Table 5.
Natural frequencies of the SMART 2013 RC structure for three model cases.
| Model Configurations | First Modal Frequency (Hz) | Second Modal Frequency (Hz) | Third Modal Frequency (Hz) | |
|---|---|---|---|---|
| Analysis | Case 1 | 21.37 | 36.23 | 65.82 |
| Case 2 | 8.93 | 15.39 | 30.71 | |
| Case 3 | 6.26 | 7.77 | 13.15 | |
| Experiment | Case 3 | 6.28 | 7.86 | 16.50 |
Table 6.
Modal damping ratios obtained by experiments.
| Mode | Frequency, (Hz) | Modal Damping Ratio, |
|---|---|---|
| 1 | 6.28 | 0.026 |
| 2 | 7.86 | 0.042 |
| 3 | 16.50 | 0.055 |
Table 7.
Absolute maximum seismic responses at point A due to the low-intensity ground motions.
| Floor | Displacement, ux (mm) | Acceleration, ax (m/s2) | ||
|---|---|---|---|---|
| Analysis | Experiment | Analysis | Experiment | |
| 1st floor | 1.06 | 0.91 | 1.37 (0.14 g) | 1.29 (0.13 g) |
| 2nd floor | 1.08 | 1.00 | 1.88 (0.19 g) | 1.74 (0.18 g) |
| 3rd floor | 1.10 | 1.01 | 2.66 (0.27 g) | 2.49 (0.25 g) |
Table 8.
Nominal input ground motions for a nonlinear seismic analysis.
| Run | PGA X (g) | PGA Y (g) | Percentage of Nominal Signal (%) | Type |
|---|---|---|---|---|
| 9 | 0.22 | 0.23 | 100 | Design earthquake signal–nominal |
| 11 | 0.21 | 0.16 | 11 | Scaled Northridge earthquake–step 1 |
| 13 | 0.40 | 0.21 | 22 | Scaled Northridge earthquake–step 2 |
| 17 | 0.60 | 0.40 | 44 | Scaled Northridge earthquake–step 3 |
| 19 | 1.10 | 1.00 | 100 | Real Northridge earthquake–nominal |
| 21 | 0.14 | 0.14 | 33 | Scaled Northridge aftershock–step 1 |
| 23 | 0.70 | 0.40 | 100 | Real Northridge aftershock–nominal |
Table 9.
Absolute maximum displacement at point A on the third floor.
| Seismic Simulation | Absolute Maximum Displacement, ux | ||
|---|---|---|---|
| Analysis (mm) | Experiment (mm) | Error (%) | |
| Run 9 | 2.47 | 2.02 | 22.28 |
| Run 11 | 4.83 | 5.57 | 13.29 |
| Run 13 | 9.51 | 12.92 | 26.39 |
| Run 17 | 15.23 | 22.02 | 30.84 |
| Run 19 | 33.09 | 36.73 | 9.91 |
| Run 21 | 1.53 | 1.79 | 14.53 |
| Run 23 | 4.93 | 7.66 | 35.64 |
Table 10.
Absolute maximum acceleration at point A on the third floor.
| Seismic Simulation | Absolute Maximum Acceleration, ax | ||
|---|---|---|---|
| Analysis (m/s2) | Experiment (m/s2) | Error (%) | |
| Run 9 | 3.88 (0.40 g) | 4.10 (0.42 g) | 5.37 |
| Run 11 | 2.46 (0.25 g) | 3.39 (0.34 g) | 27.43 |
| Run 13 | 5.67 (0.58 g) | 9.73 (0.99 g) | 41.73 |
| Run 17 | 10.50 (1.07 g) | 10.83 (1.10 g) | 3.05 |
| Run 19 | 22.42 (2.28 g) | 16.11 (1.64 g) | 39.17 |
| Run 21 | 4.42 (0.45 g) | 3.23 (0.33 g) | 36.84 |
| Run 23 | 13.15 (1.34 g) | 9.28 (0.95 g) | 41.70 |
Table 11.
Absolute maximum seismic responses at sampling points A to D in both x and y directions for the analysis case of Run 19.
Table 11.
Absolute maximum seismic responses at sampling points A to D in both x and y directions for the analysis case of Run 19.
| A | B | C | D | |||||||||
|---|---|---|---|---|---|---|---|---|---|---|---|---|
| Anal. | Exper. | Error (%) | Anal. | Exper. | Error (%) | Anal. | Exper. | Error (%) | Anal. | Exper. | Error (%) | |
| (mm) | 33.09 | 36.79 | 10.06 | 33.03 | 35.34 | 6.54 | 33.90 | 51.67 | 34.39 | 35.81 | 85.39 | 58.06 |
| (mm) | 17.96 | 23.20 | 22.59 | 22.74 | 55.89 | 59.31 | 22.77 | 55.36 | 58.87 | 17.95 | 22.31 | 19.54 |
| (m/s2) | 22.42 | 16.11 | 39.17 | 20.27 | 14.61 | 38.74 | 25.52 | 16.78 | 52.09 | 34.32 | 32.01 | 7.22 |
| (m/s2) | 18.05 | 18.37 | 1.74 | 31.76 | 26.89 | 18.11 | 31.95 | 27.80 | 14.93 | 17.67 | 17.57 | 0.57 |
© 2018 by the authors. Licensee MDPI, Basel, Switzerland. This article is an open access article distributed under the terms and conditions of the Creative Commons Attribution (CC BY) license (http://creativecommons.org/licenses/by/4.0/).
Share and Cite
MDPI and ACS Style
Lim, H.-K.; Kang, J.W.; Pak, H.; Chi, H.-S.; Lee, Y.-G.; Kim, J. Seismic Response of a Three-Dimensional Asymmetric Multi-Storey Reinforced Concrete Structure. Appl. Sci. 2018, 8, 479. https://doi.org/10.3390/app8040479
AMA Style
Lim H-K, Kang JW, Pak H, Chi H-S, Lee Y-G, Kim J. Seismic Response of a Three-Dimensional Asymmetric Multi-Storey Reinforced Concrete Structure. Applied Sciences. 2018; 8(4):479. https://doi.org/10.3390/app8040479
Chicago/Turabian StyleLim, Hyun-Kyu, Jun Won Kang, Hongrak Pak, Ho-Seok Chi, Young-Geun Lee, and Janghwan Kim. 2018. "Seismic Response of a Three-Dimensional Asymmetric Multi-Storey Reinforced Concrete Structure" Applied Sciences 8, no. 4: 479. https://doi.org/10.3390/app8040479
Note that from the first issue of 2016, this journal uses article numbers instead of page numbers. See further details here.