Ultraviolet Transient Absorption Spectrometer with Sub-20-fs Time Resolution


IFN-CNR, Dipartimento di Fisica, Politecnico di Milano, Piazza Leonardo da Vinci 32, 20133 Milano, Italy
*
Author to whom correspondence should be addressed.
Appl. Sci. 2018, 8(6), 989; https://doi.org/10.3390/app8060989
Submission received: 11 May 2018
/
Revised: 8 June 2018
/
Accepted: 13 June 2018
/
Published: 16 June 2018
(This article belongs to the Special Issue Femtosecond Light Sources and Their Applications in the Deep UV, Vacuum UV, and Extreme UV)
Abstract
:We describe a transient absorption (TA) spectroscopy system in the ultraviolet (UV) spectral range, for the study of the ultrafast optical response of biomolecules. After reviewing the techniques for the generation and characterization of ultrashort UV pulses, we describe the experimental setup of our ultrabroadband UV TA spectrometer. The setup combines sub-20-fs UV pump pulses tunable between 3.35 and 4.7 eV, with broadband white-light-continuum probe pulses in the 1.7–4.6 eV range. Thanks to the broad tunability of the pump pulses in the UV spectral range, the extremely high temporal resolution and the broad spectral coverage of the probe, this TA system is a powerful and versatile tool for the study of many biomolecules. As an example of its potential, we apply the TA spectrometer to track ultrafast internal conversion processes in pyrene after excitation in the UV, and to resolve an impulsively excited molecular vibration with 85-fs period.
1. Introduction
Since the development of mode-locked laser sources [1], ultrafast optical spectroscopy has provided invaluable insight into the light-triggered dynamical processes in many different systems of interest for physics, materials science and (bio)chemistry [2,3]. While several techniques with growing level of complexity and sophistication have been developed [4,5], transient absorption (TA) still remains a very powerful and versatile approach, delivering a rich information content with a comparatively simple experimental setup. TA typically works in a stroboscopic fashion, using two synchronized pulses, the pump and the probe. The pump pulse is resonant with a transition of the system under study, triggering a photoinduced process whose time course is followed by measuring the absorption change of the time-delayed probe pulse, which should ideally be as broadband as possible in order to deliver the maximum amount of spectroscopic information on the system [6,7,8,9]. The time resolution of TA spectroscopy is determined by the so-called instrumental response function (IRF). In TA spectrometers with relatively narrow-band (>100 fs duration) transform-limited (TL) pump and probe pulses, the IRF is the cross-correlation of the intensity profiles of pump and probe pulses [10]. When dealing with broadband probe pulses, it can be shown that, independently from their chirp, the temporal resolution is determined by their TL duration, provided that the probe pulses are detected through a narrow-band filter [11,12]. The ability to generate pump pulses with duration of just a few optical cycles [1,13] and probe pulses with ultrabroad bandwidth has pushed the time resolution in the visible and near-infrared (NIR) ranges to the sub-10-fs domain, allowing the observation of primary light-induced processes in molecules and solids, which govern important biochemical processes such as photosynthesis [14] and vision [15].
The ultraviolet (UV) wavelength range is of great interest for ultrafast spectroscopic investigations due to several reasons. First of all, the UV range is resonant with electronic transitions of many small molecules with fairly simple excited state energy level structure, whose photoinduced dynamics can be accurately modeled using ab initio computational approaches; ultrafast TA spectroscopy in the UV can thus be used to benchmark the accuracy of such methods [16,17]. In addition, the UV matches the absorption spectrum of many biomolecules, which present cyclic aromatic rings with strongly allowed π→π* transitions. Examples are the nucleobases (adenine, cytosine, guanine, thymine, and uracil) and their multimers up to the double-stranded DNA helix, as well as the aromatic amino acids (tryptophan, phenylalanine, and tyrosine), all of which have strong absorption bands in the 250–300 nm wavelength range (≈4–5 eV). While the main biological functions of these biomolecules are not directly related to their interaction with light, still the study of their ultrafast optical response is very important. In DNA the absorbed UV photon energy could initiate a variety of photoreactions, involving substantial rearrangements of the molecular structure, that corrupt the information encoded in the base sequence. Nevertheless, the quantum yield of such photoproducts is remarkably low, because DNA manages to dissipate the absorbed energy very efficiently, mainly through harmless ultrafast non-radiative decay processes [18,19,20,21]. This self-protecting property of DNA is not just an interesting feature of its photophysics, but it is an essential requirement for the very existence and the replication of life, which relies on the stability of the hereditary genetic information. In proteins, aromatic amino acids have been proposed as built-in structural markers [22,23] whose TA signal is able to deliver information on their secondary structure and on the misfolding processes that lead to aggregation, fibril formation and are the precursors of several neurodegenerative diseases.
Despite the strong scientific motivation and the great potential interest, pushing the time resolution of UV TA spectroscopy to the 10–20 fs domain, which is nowadays customary in the visible range, requires addressing several technological challenges:
- (i)
- the generation of few-optical-cycle pulses in the UV is difficult, due to the lack of suitable broadband gain media, either linear or nonlinear, in this frequency range;
- (ii)
- standard methods for the temporal characterization of ultrashort pulses, based on nonlinear frequency up-conversion processes such as second harmonic generation (SHG), cannot be applied to the UV, and more complex techniques are required;
- (iii)
- due to the proximity with the onset of electronic transitions, all transparent materials in the UV display a strong dispersion, causing a frequency chirp; this calls for a careful design of the spectroscopic system to minimize the number and the thickness of refractive optical elements and prevent the loss of temporal resolution.
This paper describes our recent efforts at developing an ultrafast TA spectroscopy system in the UV with high temporal resolution for the study of the ultrafast optical response of biomolecules. The system combines sub-20-fs pump pulses tunable in the 3.35–4.7 eV range (corresponding to 260–370 nm) with broadband probe pulses obtained by white-light-continuum (WLC) generation in different materials. The paper is organized as follows: Section 2 reviews the methods used for the generation and characterization of ultrashort UV pulses; Section 3 describes the experimental setup of the UV TA spectrometer; Section 4 characterizes the performance of the system and presents representative experimental results; finally, Section 5 draws conclusions and discusses prospects for applications and improvements of the system.
2. UV Pulse Generation and Characterization
2.1. Pulse Generation
Few-optical-cycle light pulses are nowadays routinely generated in the visible and NIR ranges using different approaches: directly from a laser oscillator [24], by spectral broadening in a nonlinear medium (solid or hollow-core optical fiber) [25,26] or by a non-collinear optical parametric amplifier (NOPA) [27,28]. The extension of these techniques to the UV range is challenging for a variety of reasons. First of all, there are no broadband laser gain media in the UV, with the exception of excimers of noble gas halides [29,30]. Nonlinear gain media based on OPAs are also difficult to implement in the UV, because they require pumping with high energy photons, which undergo strong two-photon absorption in all nonlinear media [31]. For these reasons, broadband UV pulses are typically generated by nonlinear frequency up-conversion of few-optical-cycle pulses in the visible or NIR ranges.
Few-optical-cycle UV pulses have been generated by nonlinear optical processes in noble gases in a guiding geometry, using either a hollow-core optical fiber or a filament. The exploited nonlinear processes were third or higher order harmonic generation or four-wave-mixing (FWM) between the fundamental wavelength (FW) and the second harmonic (SH) of the driving pulse, typically generated by a Ti:sapphire laser. Backus et al. produced 16-fs, 1-μJ pulses at 266 nm by third-harmonic generation (THG) in air of the 20-fs pulses produced by an amplified Ti:sapphire laser [32]. Graf et al. obtained considerably shorter sub-4-fs pulses at 270 nm with 1-μJ energy by THG in a Ne cell of the 6-fs output of Ti:sapphire spectrally broadened in a hollow-core fiber [33]; the pulses were further shortened to 2.8-fs duration by Reiter et al. using a sub-4-fs driver pulse [34]. Kosma et al. produced 11-fs, 4-nJ vacuum UV (VUV) pulses at 166 nm from fifth harmonic generation of Ti:sapphire in an Ar-filled cell [35]. In a series of pioneering studies, Durfee et al. generated 8-fs pulses at 266 nm with μJ energy by FWM between the SH and the FW of a 20-fs Ti:sapphire laser [36,37]. Beutler et al. reported on sub-20-fs VUV pulses at 160 nm with energies exceeding 400 nJ generated by FWM between the third harmonic of Ti:sapphire and the FW broadened by filamentation [38]. Kida et al. employed broadband four-wave mixing for the generation of sub 10-fs deep-UV [39,40,41], which were further exploited as pump pulses in a TA spectrometer [42,43,44]. Even shorter wavelengths were produced by Horio et al., who generated 5-nJ pulses at 133 nm by cascaded FWM between third, fourth and fifth harmonic of Ti:sapphire in a filament [45].
Nonlinear interactions in gases typically require high-energy short-duration (<50 fs) driving pulses and, due to the high order of the involved nonlinear process, they generate pulses whose shot-to-shot stability is not optimum for TA applications. For this reason, in many TA setups the UV pulses are generated by second-order nonlinear frequency conversion in crystals. Frequency up-conversion processes generally need to compromise between efficiency, which scales as the square of the thickness L of the nonlinear crystal, and phase matching bandwidth, which is inversely proportional to L. For the case of SHG, the phase-matching bandwidth is given by [46] where is the group velocity mismatch (GVM) between the FW and the SH. For the case of β-barium borate (BBO) and Type I (ooe) phase matching, in the case of a FW visible pulse at λ = 600 nm wavelength, one has δSH = 410 fs/mm, so that a crystal thickness of L = 8 μm would be required to obtain a sub-5-fs UV pulse. With a thicker 50-μm crystal UV pulses with ≈20-fs duration and 5–10 μJ energy were generated by frequency doubling a high-energy visible NOPA [47]. The phase-matching bandwidth can be considerably increased by the use of achromatic phase matching [48,49], in which the broadband pulses are angularly dispersed so that each frequency propagates within the nonlinear crystal at its own phase matching angle. Employing achromatic SHG, Baum et al. [50,51] frequency doubled the output of a broadband visible NOPA in a 360-μm-thick BBO crystal, obtaining pulses with energy in excess of 200 nJ and 250 THz bandwidth. Zhao et al. produced sub-15-fs pulses with 600-nJ energy by achromatic sum-frequency generation (SFG) of the NOPA output with the FW of Ti:sapphire [52]. The advantage of achromatic phase matching, however, comes at the cost of a considerable complication of the experimental apparatus.
The phase-matching requirements are less tight for SFG between a narrowband pulse at frequency ω1 and a broadband pulse at frequency ω2, to give ω3 = ω1 + ω2. For this configuration, the phase-matching bandwidth becomes [53] , where is the GVM between the broadband pulse and the SFG pulse. For the case of BBO with Type II (eoe) phase matching, considering up-conversion of a visible pulse by a narrowband pulse centered at λ1 = 800 nm, one gets δ23 = 120 fs/mm; this means that a relatively thick 50-μm BBO crystal can be used to up-convert a sub-10-fs visible pulse to the UV. Using this configuration, Borrego-Varillas et al. generated 8 fs pulses with 1-μJ energy and central wavelength tunable from 310 to 400 nm by SFG between the NOPA output and a narrowband NIR pulse, generated either directly by Ti:sapphire or by an OPA [53].
2.2. Pulse Characterization
The application of UV pulses in TA spectroscopy requires the precise management of dispersion to keep the pulse duration as short as possible, thus maximizing the time resolution of the experiment. The measurement of the temporal duration requires the knowledge of the spectral amplitude and phase [54]. The characterization of the spectral phase is however not straightforward in the UV range since, due to the lack of transparent materials and of suitable phase-matching configurations, no traditional techniques based on SHG or SFG can be applied.
For this reason, autocorrelation techniques in the UV exploit multi-photon absorption as nonlinear process. A first approach consists in utilizing the two-photon conductivity of a substrate and measuring the generated charge by using a pair of electrodes [55,56], with the main drawback of a complex manufacture of the electrodes. In gas phase, two-photon induced fluorescence of excimers [57] or gas ionization [58] have been exploited. Another group of techniques uses two-photon absorption (TPA) in liquids and bulk materials [59,60,61,62]. For this purpose, the beam is divided in two replicas: when they temporally overlap, a contribution due to TPA arises, thus creating an autocorrelation signal. Finally, Motzkus et al. proposed a shaper-assisted cross-correlation setup by combining a pulse modulator and a solar-blind photomultiplier tube [63]. Such techniques, however, do not allow the full reconstruction of the light pulse in amplitude and phase.
Among the approaches for complete pulse reconstruction, the so-called spectrographic techniques aim at evaluating the relative arrival time of spectral slices of the pulse. A measurement generates thus a 2D map as a function of time and frequency—known as spectrogram—from which it is possible to extract the spectral phase. The most well-known example of these techniques is the frequency-resolved optical gating (FROG) [64]. In FROG the pulse is split in two replicas which are superimposed in a nonlinear crystal. The delay of one of the replicas is varied and the SHG signal is registered in a spectrometer as a function of the delay yielding the spectrogram. With an iterative algorithm it is then possible to retrieve the spectral phase of the pulse. Unfortunately, this approach cannot be directly applied in the UV due to the lack of suitable SHG crystals in this range. Another scheme, the polarization gating (PG) FROG, which exploits a χ(3) polarization-gate arrangement, was successfully extended by Kane et al. to the UV using quartz as the nonlinear medium [65].
Other variants of FROG have been also demonstrated for the measurement of ultrashort pulses in the UV. One of the most common approaches is the cross-correlation FROG (XFROG) [66], which exploits a fully-characterized reference pulse beam for difference frequency generation (DFG) with the unknown UV pulse. The amplitude and phase of the test pulse are therefore retrieved from the corresponding spectrogram and from the fully characterized reference. Self-diffraction (SD) FROG has also been applied in the UV range, although it requires comparatively high energies in the μJ range. SD-FROG retrieves the temporal information on the pulse from the diffracted beam scattered by the crossing of two replicas in a material. Backus et al. measured 16-fs pulses at a central wavelength of 266 nm by using this method [32]. Seidel et al. combined XFROG with a technique of tomographic ultrafast retrieval of transverse light E-fields (TURTLE) [67]. In XTURTLE two orthogonal linear projections at 0° and 90° and an additional projection, for example at 45°, of the vector-shaped test fields in the UV are down-converted with a fully characterized reference pulse. The first two maps (at 0° and 90°) are inserted in the XFROG algorithm to retrieve the phase. In a second step, a TURTLE algorithm combines those measurements to model the third component at 45°. This allows for retrieving the complete vector field of the UV test pulse. Finally, molecular alignment-based (M-) FROG, which employs the impulsive alignment of gaseous molecules as gate function, was utilized for the measurement of weak UV femtosecond pulses around 200 nm [68].
Another class of methods for the full reconstruction of an ultrashort pulse is based on spectral interferometry (SI). In SI a fully characterized auxiliary pulse (reference) and the unknown pulse (test) are delayed by delay τ and sent collinearly onto a detector. SI has been applied to the near-UV range by using as reference the SH of a fully characterized pulse [69]. This approach is however limited by the fact that it requires a reference pulse in the same spectral range as the pulse under test and with a comparable bandwidth. To overcome the limitations of SI, self-referenced interferometric techniques were developed in the 90s. The most widespread method is the spectral interferometry for direct electric-field reconstruction (SPIDER) [70]. In SPIDER the pulse is split in two replicas by a Michelson interferometer and combined with a highly chirped pulse in a nonlinear crystal. The interferogram encodes in its frequency-dependent phase the derivative of the pulse spectral phase.
Riedle and co-workers introduced a new scheme called zero additional phase (ZAP) SPIDER and demonstrated the measurement of ultrashort UV pulses with this technique. In conventional SPIDER additional dispersion due to beam splitter in the Michelson interferometer is added to the test pulse. Instead, in ZAP SPIDER the unknown pulse is mixed with two chirped replicas, which avoids further manipulation of the original pulse. This approach was applied to the characterization of 7-fs pulses in the UV range (270–310 nm) by using a DFG scheme with a highly chirped fraction of the FW beam at 800 nm.
3. Experimental Setup
3.1. UV Pump Pulse Generation
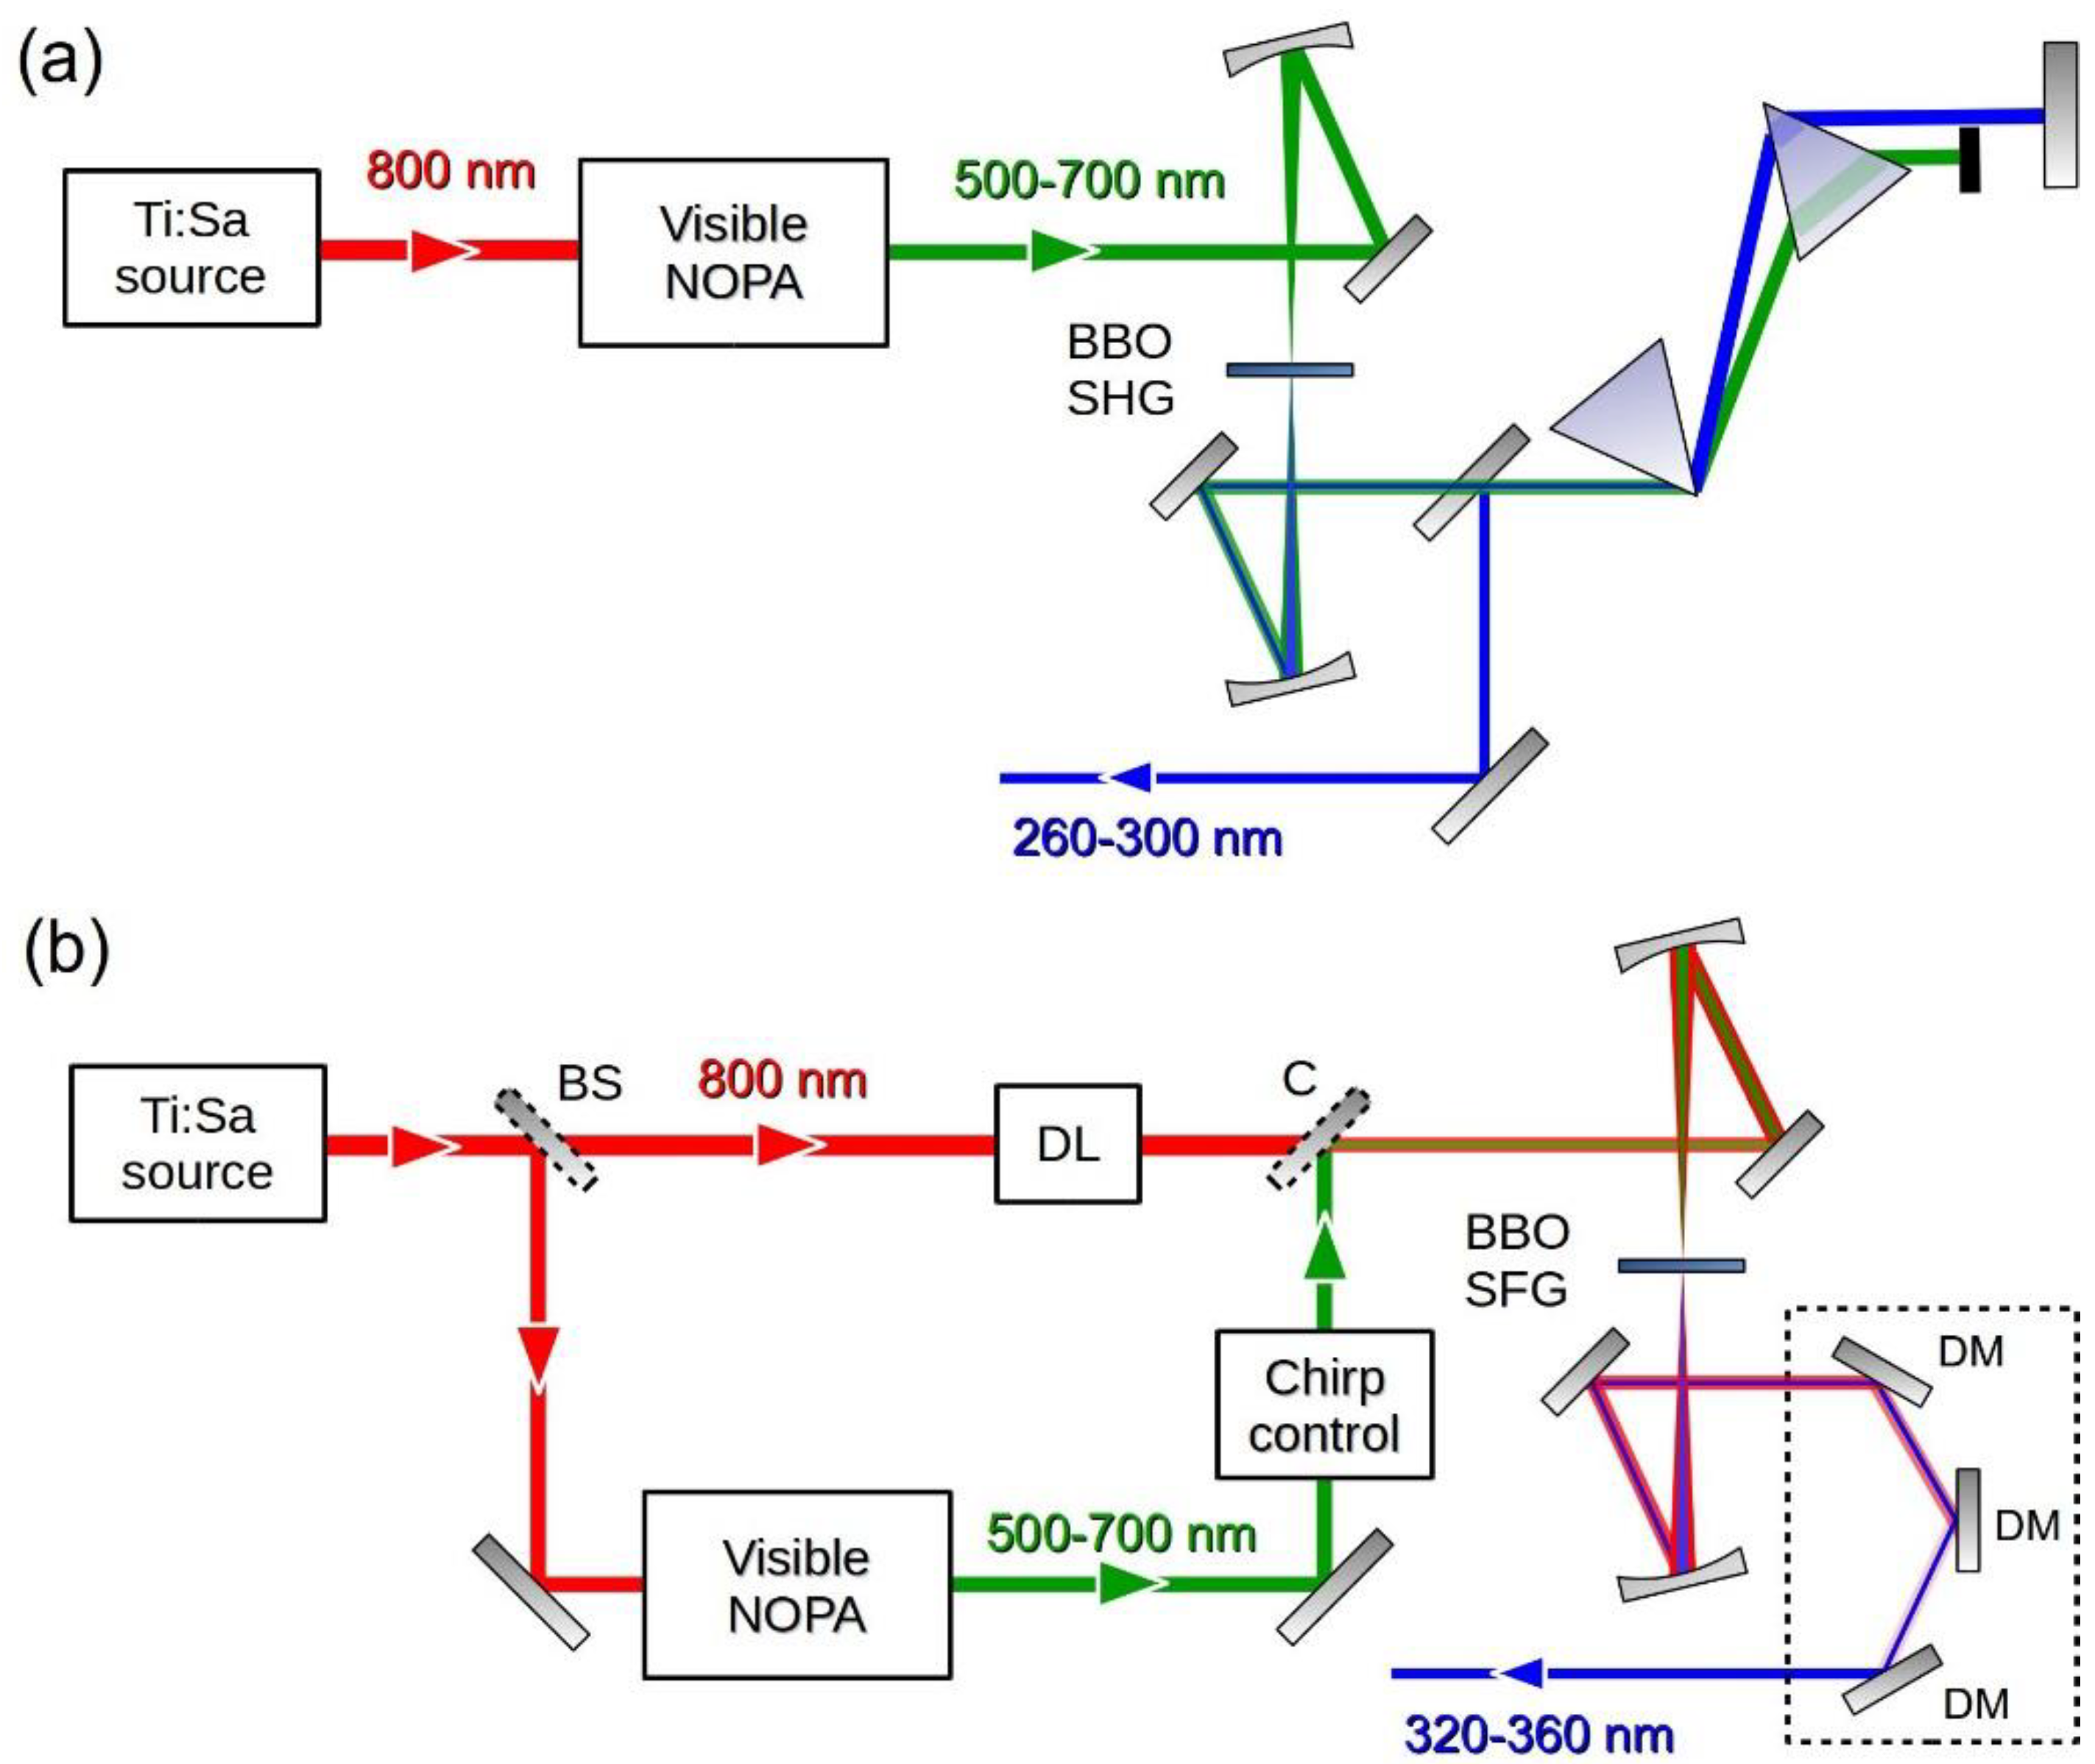
In our TA setup we generate short UV pulses by frequency up-conversion of a broadband NOPA [71,72,73], which is a source of few-optical-cycle visible pulses with moderate energy (a few μJs) and high shot-to-shot stability. The experimental setup for the generation of the UV pump pulses is shown in Figure 1. The system starts with a regeneratively amplified Ti:sapphire laser (Libra, Coherent, Santa Clara, CA, USA), which delivers vertically polarized 100-fs pulses at 1 kHz repetition rate and at 800 nm wavelength. A 500-μJ fraction of the laser light drives a single-pass visible NOPA [74], pumped by the SH and seeded by a WLC generated in a 2-mm-thick sapphire plate. This NOPA produces vertically polarized broadband pulses with a spectrum extending from 525 to 700 nm, corresponding to a transform-limited (TL) pulse duration of 6.2 fs, and with energy of the order of 10 μJ. The NOPA pulses are compressed by 12 reflections onto a pair of dispersion-matched dielectric double-chirped mirrors (DCMs) until nearly flat spectral phase is achieved. For SHG (Figure 1a) the vertically polarized NOPA pulses are focused by an f = 250 mm spherical mirror onto a 20-μm-thick free-standing Type I BBO crystal cut at θ = 42.4° which produces horizontally polarized UV pulses. Subsequently FW and SH pulses are collimated by an identical spherical mirror and sent to a Brewster-cut MgF2 prism pair (tip to tip distance: 215 mm) which serves the dual purpose of filtering out the FW light and of compensating the dispersion introduced by air and by the cuvette window on the pump beam path. By adjusting the tilt angle of the BBO crystal and simultaneously the NOPA bandwidth, it is possible to tune the carrier wavelength of the UV pulses from 260 to 300 nm, maintaining in all cases a pulse energy of 40–50 nJ at the prism pair output.
For SFG (Figure 1b) a 30-μJ fraction of the laser FW is split off, sent through a half-wave plate which rotates its polarization to horizontal, synchronized by a delay line and collinearly combined with the compressed NOPA output by a dichroic mirror, which reflects the NOPA and transmits the FW. The collinear FW and NOPA pulses are focused by a f = 250 mm mirror to a 50-μm-thick BBO crystal (Type II, eoe, θ = 46.8°), recollimated by a mirror and sent to a set of three identical UV dielectric mirrors, which filter out the FW of the laser and of the NOPA. Typical pulse energies of up to 1 μJ are obtained.
3.2. UV Pulse Characterization
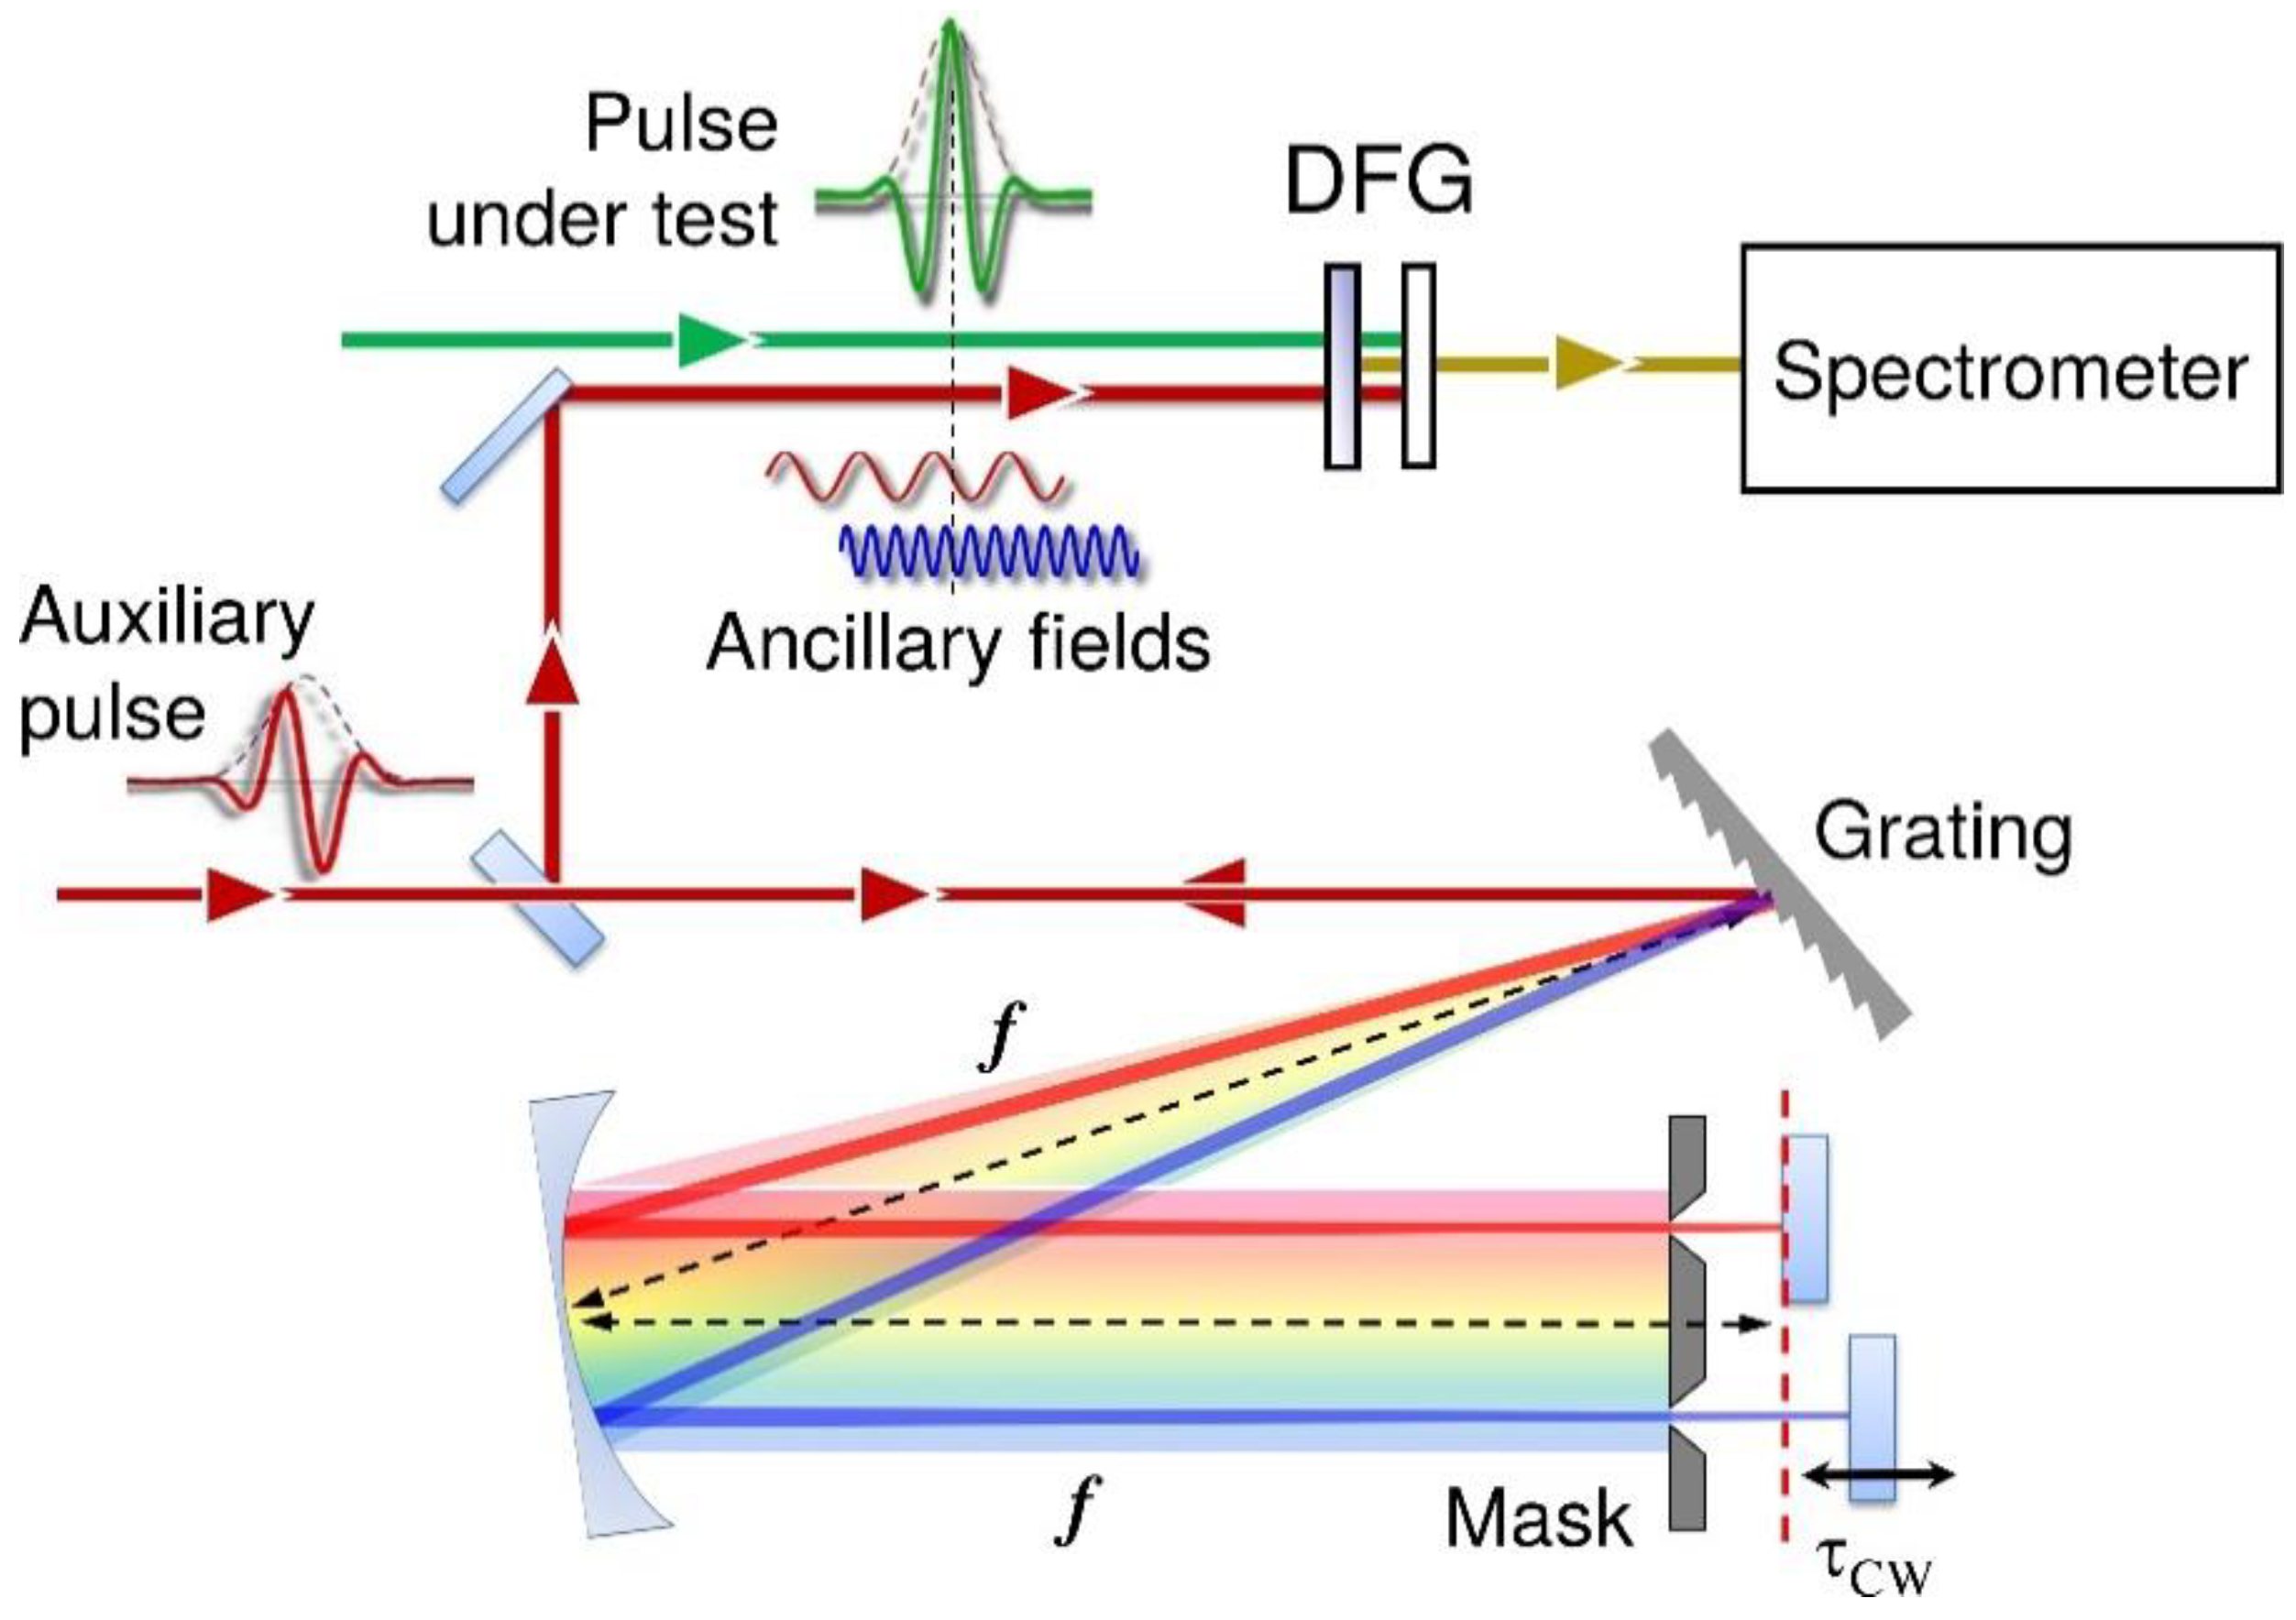
In TA spectroscopy with WLC probe and broadband detection, the time resolution is determined essentially by the duration of the pump pulse [11]; for this reason, it is crucial to precisely characterize its temporal profile. For this purpose, we adopt a modified scheme of two-dimensional spectral shearing interferometry (2DSI), recently developed by some of the authors [75], which is suitable for the full characterization of UV pulses. The 2DSI method [76,77] relies on spectral shearing interferometry with zero delay; with respect to the SPIDER technique, which encodes phase as a sensitively calibrated fringe in the spectral domain, 2DSI robustly encodes phase along a second dimension. In traditional 2DSI, the pulse under test is nonlinearly mixed with two collinear fields, named ancillae, sheared by a frequency Ω, resulting in two co-propagating replicas and , which give rise to a spectral interference pattern. If one of the ancillae, at angular frequency ωCW, is delayed by τCW, the corresponding interferogram can be written as:
where is the spectral phase of the pulse under test. By recording the spectra as a function of τCW, one obtains a 2D map which displays, for each value of ω, interference fringes along the τCW axis with phase: , from which one obtains by integration the spectral phase as:
Equation (2) shows that a precise knowledge of the spectral shear Ω is critical for an accurate retrieval of the spectral phase. In traditional 2DSI the two sheared ancillae are generated by passing a strongly chirped pulse (which may be a replica of the pulse under test or an auxiliary pulse) through an unbalanced Michelson interferometer which creates two delayed replicas, and which is also used to scan the delay τCW. This configuration requires an indirect determination of the spectral shear based on the chirp of the pulse and the delay of the replicas. Our 2DSI scheme, on the other hand, produces the sheared ancillae by spectral filtering, which allows the direct measurement of Ω with a spectrometer. The experimental setup is shown in Figure 2: a fraction of the FW is split off and sent to a 4f zero-dispersion pulse shaper [78], using a 2000 lines/mm diffraction grating as dispersive element. The two nearly monochromatic ancillae, with adjustable bandwidth and spectral shear, are produced by a double-slit mask placed close to the Fourier plane of the pulse shaper. Finally, the folding mirror of the shaper is replaced by two independent mirrors, one of which is mounted on a precision translation stage which allows the scanning of τCW. The two collinear ancillae are then synchronized with the pulse under test, and both beams are non-collinearly focused onto a nonlinear crystal for DFG (10-μm-thick BBO cut for Type I phase matching with θ = 29°). The nonlinear signal is then coupled to a spectrometer, and its spectrum is recorded as a function of τCW, giving the 2DSI map, from which the spectral phase of the pulse is extracted. The correctness of the calibration of the shear is typically checked by characterizing the dispersion introduced by materials of known thickness and comparing it to tabulated values.
3.3. Broadband TA Spectrometer
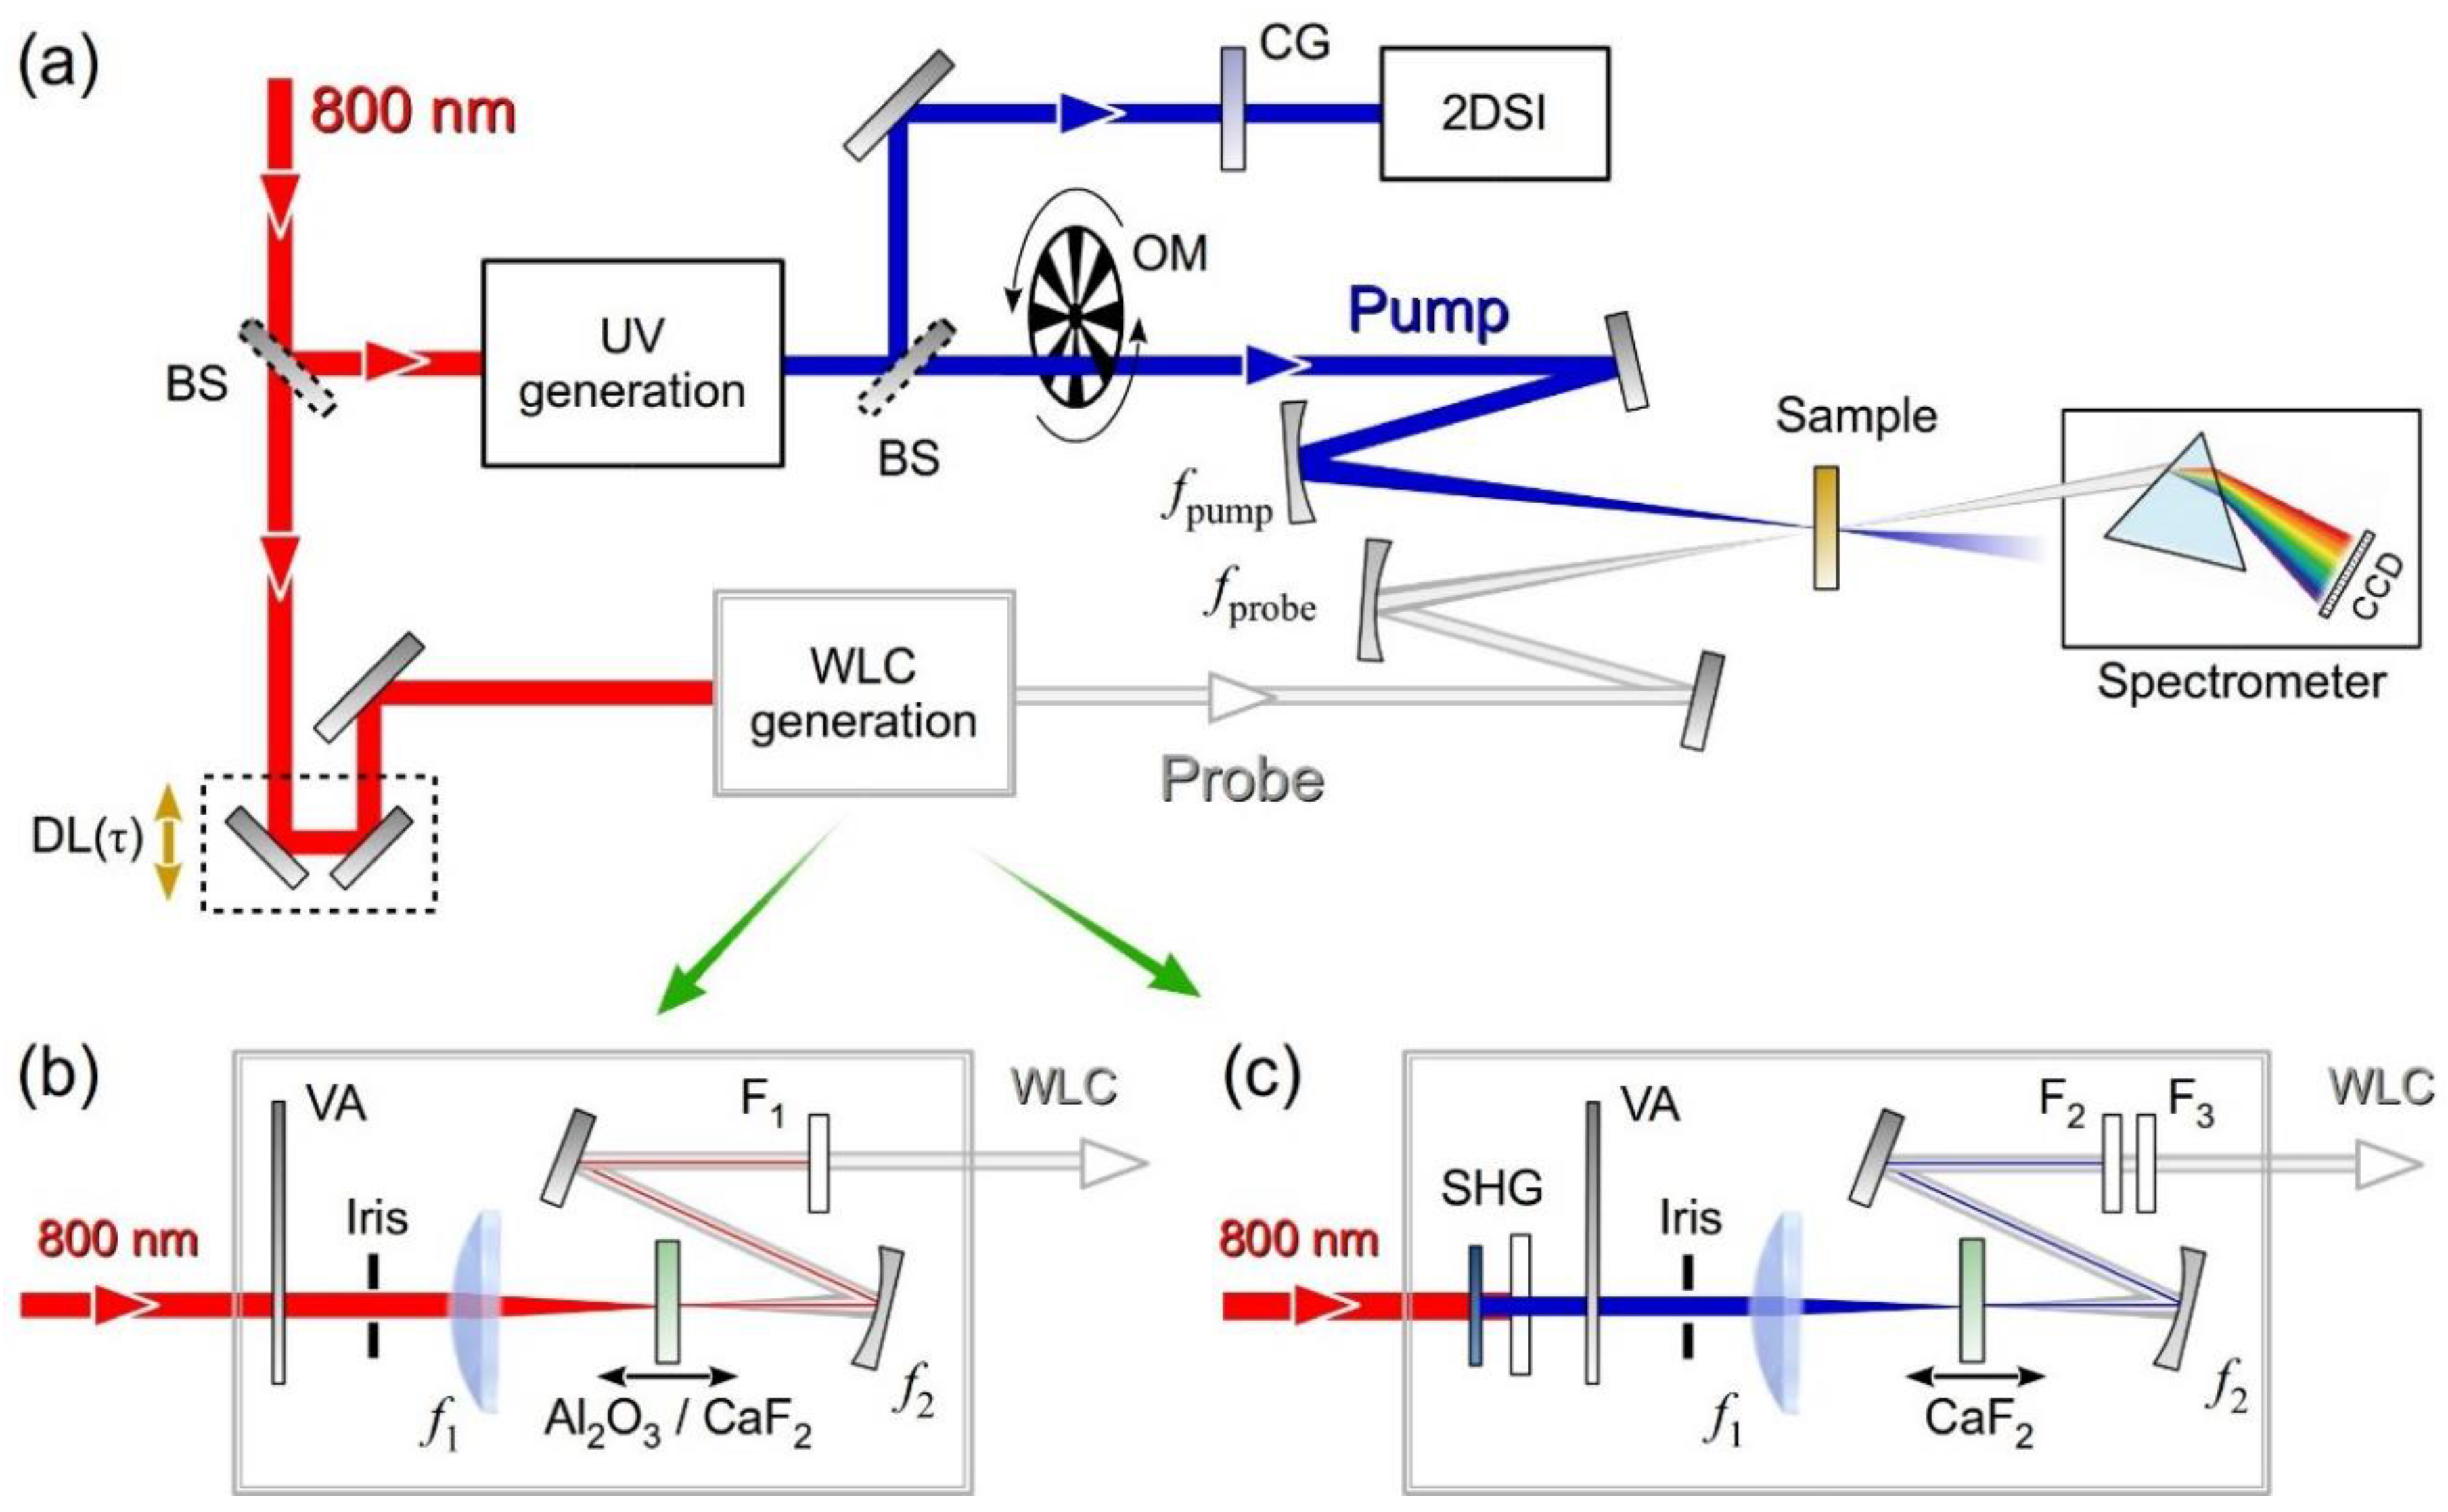
Figure 3a shows the experimental setup of the high time resolution broadband TA spectrometer in the UV. Most of the laser energy is used for the UV pump pulse generation, according to the scheme reported in Figure 1. A flip mirror is used to deviate the pump pulse to the 2DSI setup displayed in Figure 2, for its accurate characterization before the measurement. To take into account the effect of air dispersion, which is not negligible at UV wavelengths, the path-length leading to the nonlinear crystal in the 2DSI is made equal to the path to the sample. For measurements performed in a flow cell, a 200 μm-thick compensating fused silica window, identical to the entrance window of the cell, is placed in front of the 2DSI.
A 35-μJ fraction of the laser output is sent to a computer-controlled delay line, which serves the dual purpose of synchronizing the pump and probe pulses and varying their delay, which is followed by the WLC generation stage. Figure 3b,c show the experimental setups used for WLC generation driven by the FW or by the SH. In both cases the energy for WLC generation is adjusted to ~1 μJ. The driving pulse is focused by a lens with focal length f1 = 75 mm and the WLC is recollimated by a spherical mirror with focal length f2 = 50 mm used under the smallest possible incidence angle (θ = 10°), followed by a pick-up mirror. An iris and a variable attenuator on the driving pulse path are used to vary the numerical aperture and the power of the beam; these parameters, together with the position of the nonlinear material in the focus, controlled by a precision translation stage, are finely tuned to optimize the stability of the generated WLC. Optionally, the WLC can be driven by the SH of Ti:sapphire, generated in a 1-mm-thick Type I BBO crystal (θ = 29°). Different setups and materials are used to cover the visible and UV ranges: a 2-mm-thick sapphire driven by the FW to cover the 440–710 nm range, a 3-mm-thick CaF2 driven by the FW to cover the 330–650m range and the same plate driven by the SH to cover the- UV (270–370 nm) range. For the case of CaF2, to avoid optical damage, a two-axis translation stage (Zaber Technologies, Vancouver, Canada, model T-LS28M) is used to slowly scan the plane in a plane perpendicular to the propagation direction [79].
The pump and the probe are separately and non-collinearly focused on the sample at approximately 5° by two UV enhanced aluminum spherical mirrors with focal lengths fpump = 250 mm and fprobe = 200 mm, to match their focal spots. The transmitted probe, selected by an iris, is focused on the entrance slit of a spectrometer (SP2300 Princeton Instruments, Acton, MA, USA) equipped with a CCD detector, with the spectral resolution of the order of 0.5 nm, and a read-out electronics (Stresing Entwicklungsbüro, Berlin, Germany) capable of single-shot readout of the probe spectrum at the full 1-kHz laser repetition rate [7]. The pump is modulated by a mechanical chopper at 500 Hz and the differential transmission (∆T/T) spectrum as a function of probe wavelength λpr and pump-probe delay τ is calculated as:
Please note that since consecutive laser pulses have the highest degree of correlation, the single-shot readout of the probe spectrum synchronous to the laser repetition rate contributes to the improvement of the S/N ratio. In addition, the spectral resolution of the spectrometer makes it equivalent to a narrowband filter. Hence, according to [11,12], independently from the chirp of the probe, the temporal resolution depends only on its TL duration. For this reason, the probe pulses are not compressed before the interaction with the sample. The chirp of the probe only results in a dispersion of the zero pump-probe time delay, which can be compensated for by numerical post-processing of the measured TA maps, without loss of the temporal resolution.
4. Experimental Results
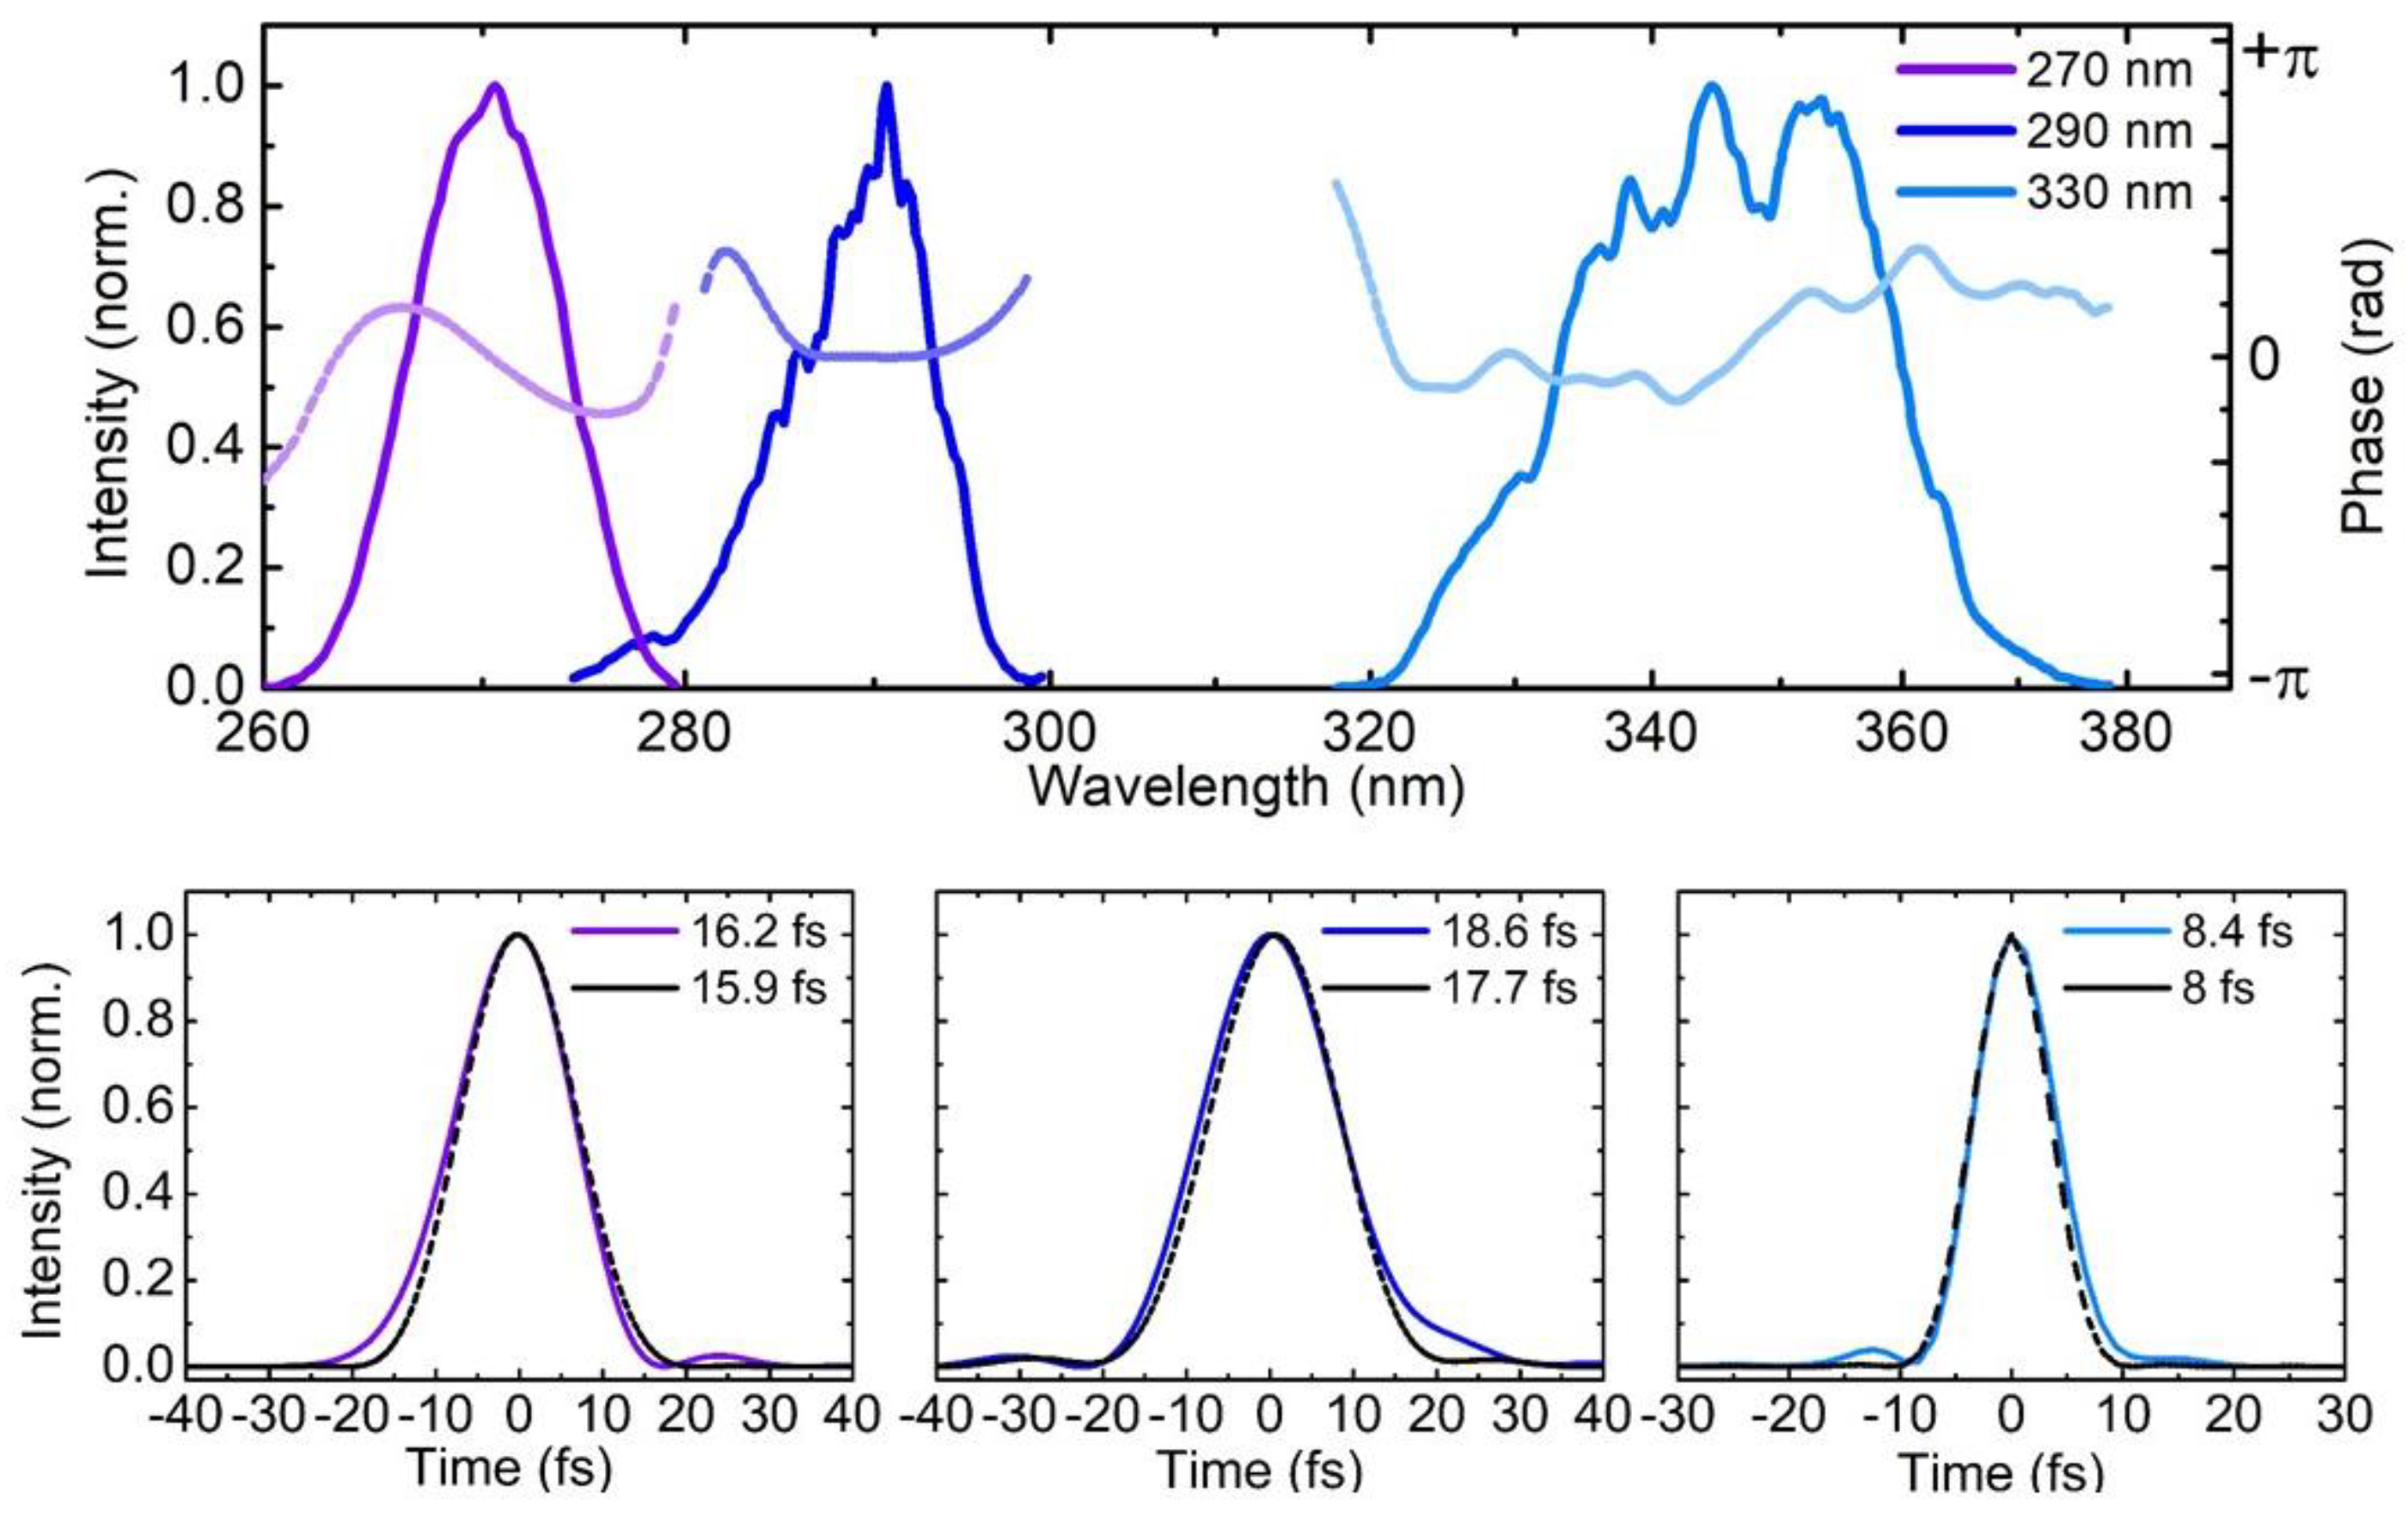
Figure 4a reports a sequence of UV pump pulses generated either by SHG or by SFG of the NOPA output, which cover a wavelength range from 260 to 370 nm (4.75 to 3.35 eV). The figure also plots the spectral phases of the pulses, retrieved by 2DSI, which are essentially flat: the corresponding temporal intensity profiles, shown as solid lines in Figure 4b–d, reveal sub-20-fs pulses, with a FWHM duration very close to that of the corresponding TL pulses (with intensity profiles shown as dashed lines): 16.2 fs for the 270-nm pulse, 18.6 fs for the 290-nm pulse and 8.4 fs for the 340-nm pulse.
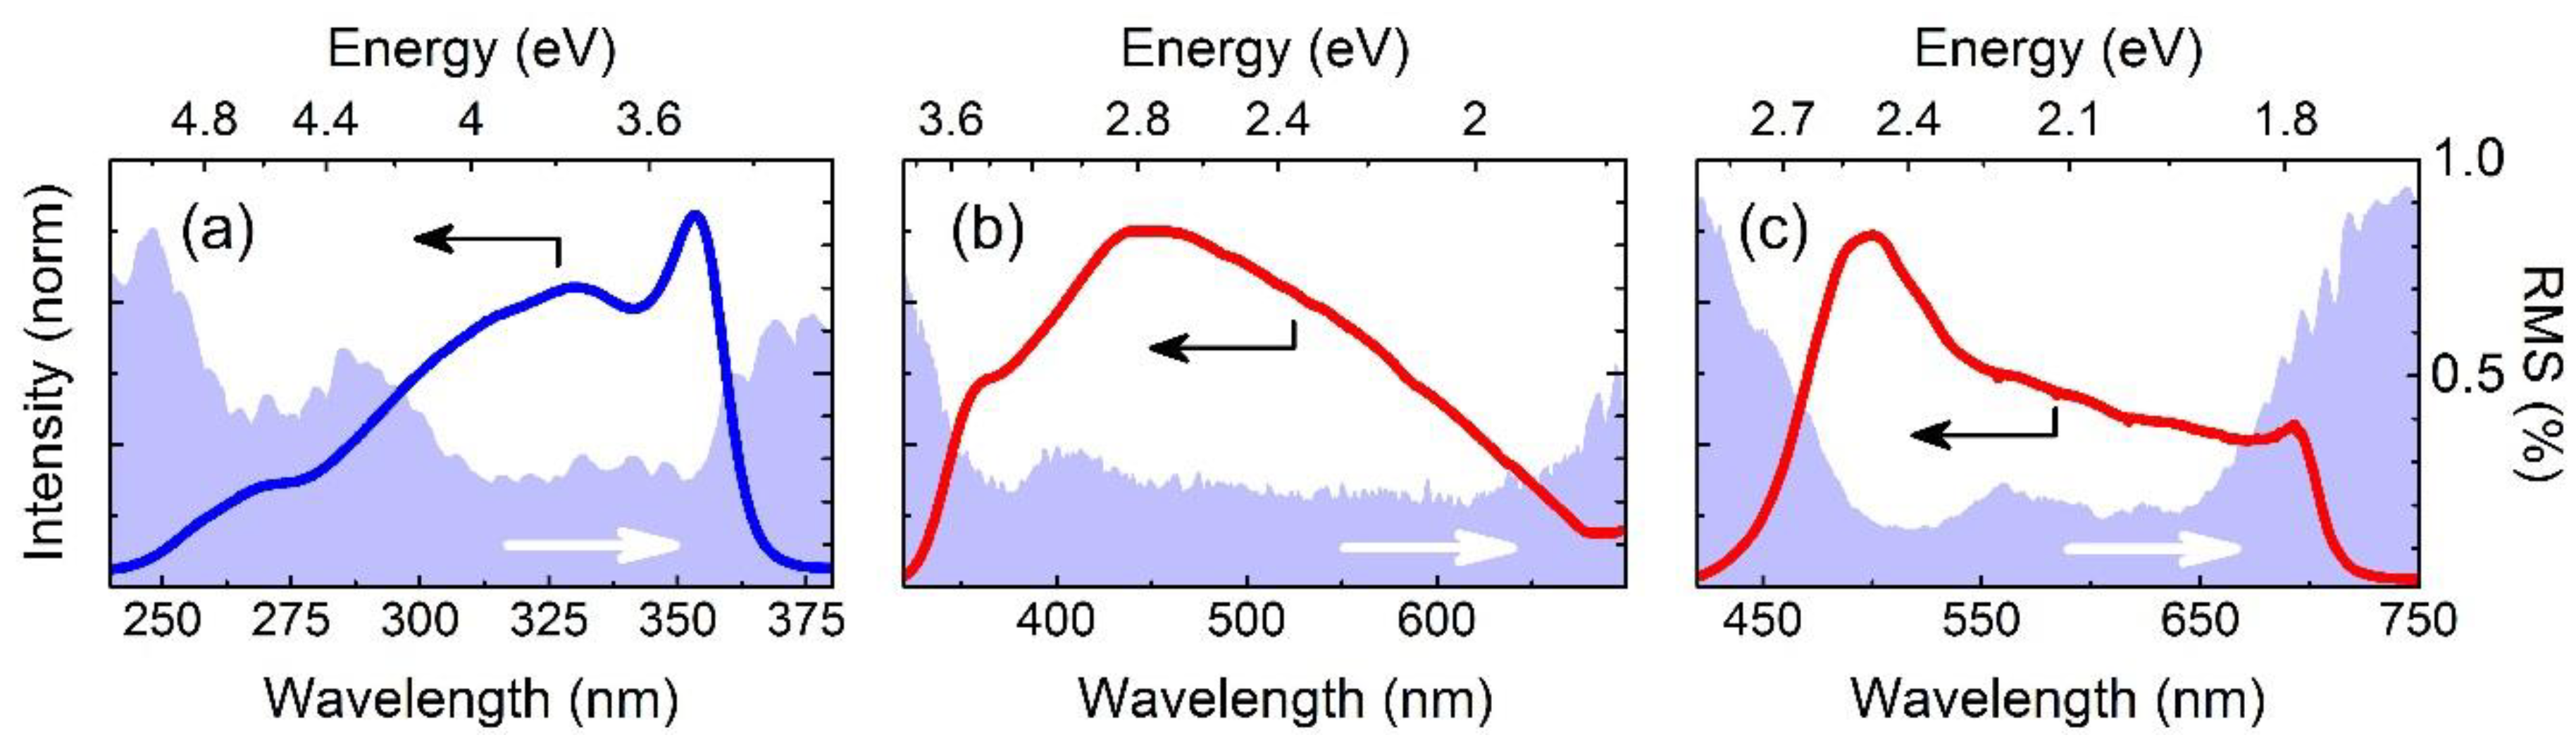
Figure 5 shows spectra of the WLC generated in the different materials pumping with the FW or with the SH, which -as previously discussed- cover different wavelength ranges. For each spectrum we calculated the wavelength dependent root-mean-square (rms) of fluctuations between consecutive pulses as:
where Si(λpr) is the signal measured by the spectrometer at a given probe wavelength for the i-th laser shot and is the average probe signal.
The wavelength dependent rms fluctuations of the WLC measured for N = 300 consecutive pulse pairs are reported in Figure 5 as shaded areas. One can see that the WLC generated in sapphire has the best noise properties, with fluctuations below 0.2% over most of the detection range; the WLC generated in CaF2 driven by the FW has slightly higher fluctuations but adds a very significant spectral interval from 330 to 450 nm; finally, the WLC generated in CaF2 driven by the SH displays higher but still acceptable fluctuations which are lower than 0.4% over most of the detection range.
The overall stability of the WLC is quite good: in fact, a 0.2% rms fluctuation corresponds to a noise <10−4 for the ∆T/T signal when averaged over 500 consecutive pulse pairs, which correspond to 1 second measurement time. This high stability of the probe is crucial for TA measurements with UV pump pulses; in water solvent, in fact, two-photon absorption of the pump can produce hydrated electrons [80], which display broad and long-lived absorption spectra in the visible [81]. To avoid or minimize such spurious signals, the pump fluence should be kept as low as possible, thus calling for a high sensitivity of the TA setup.
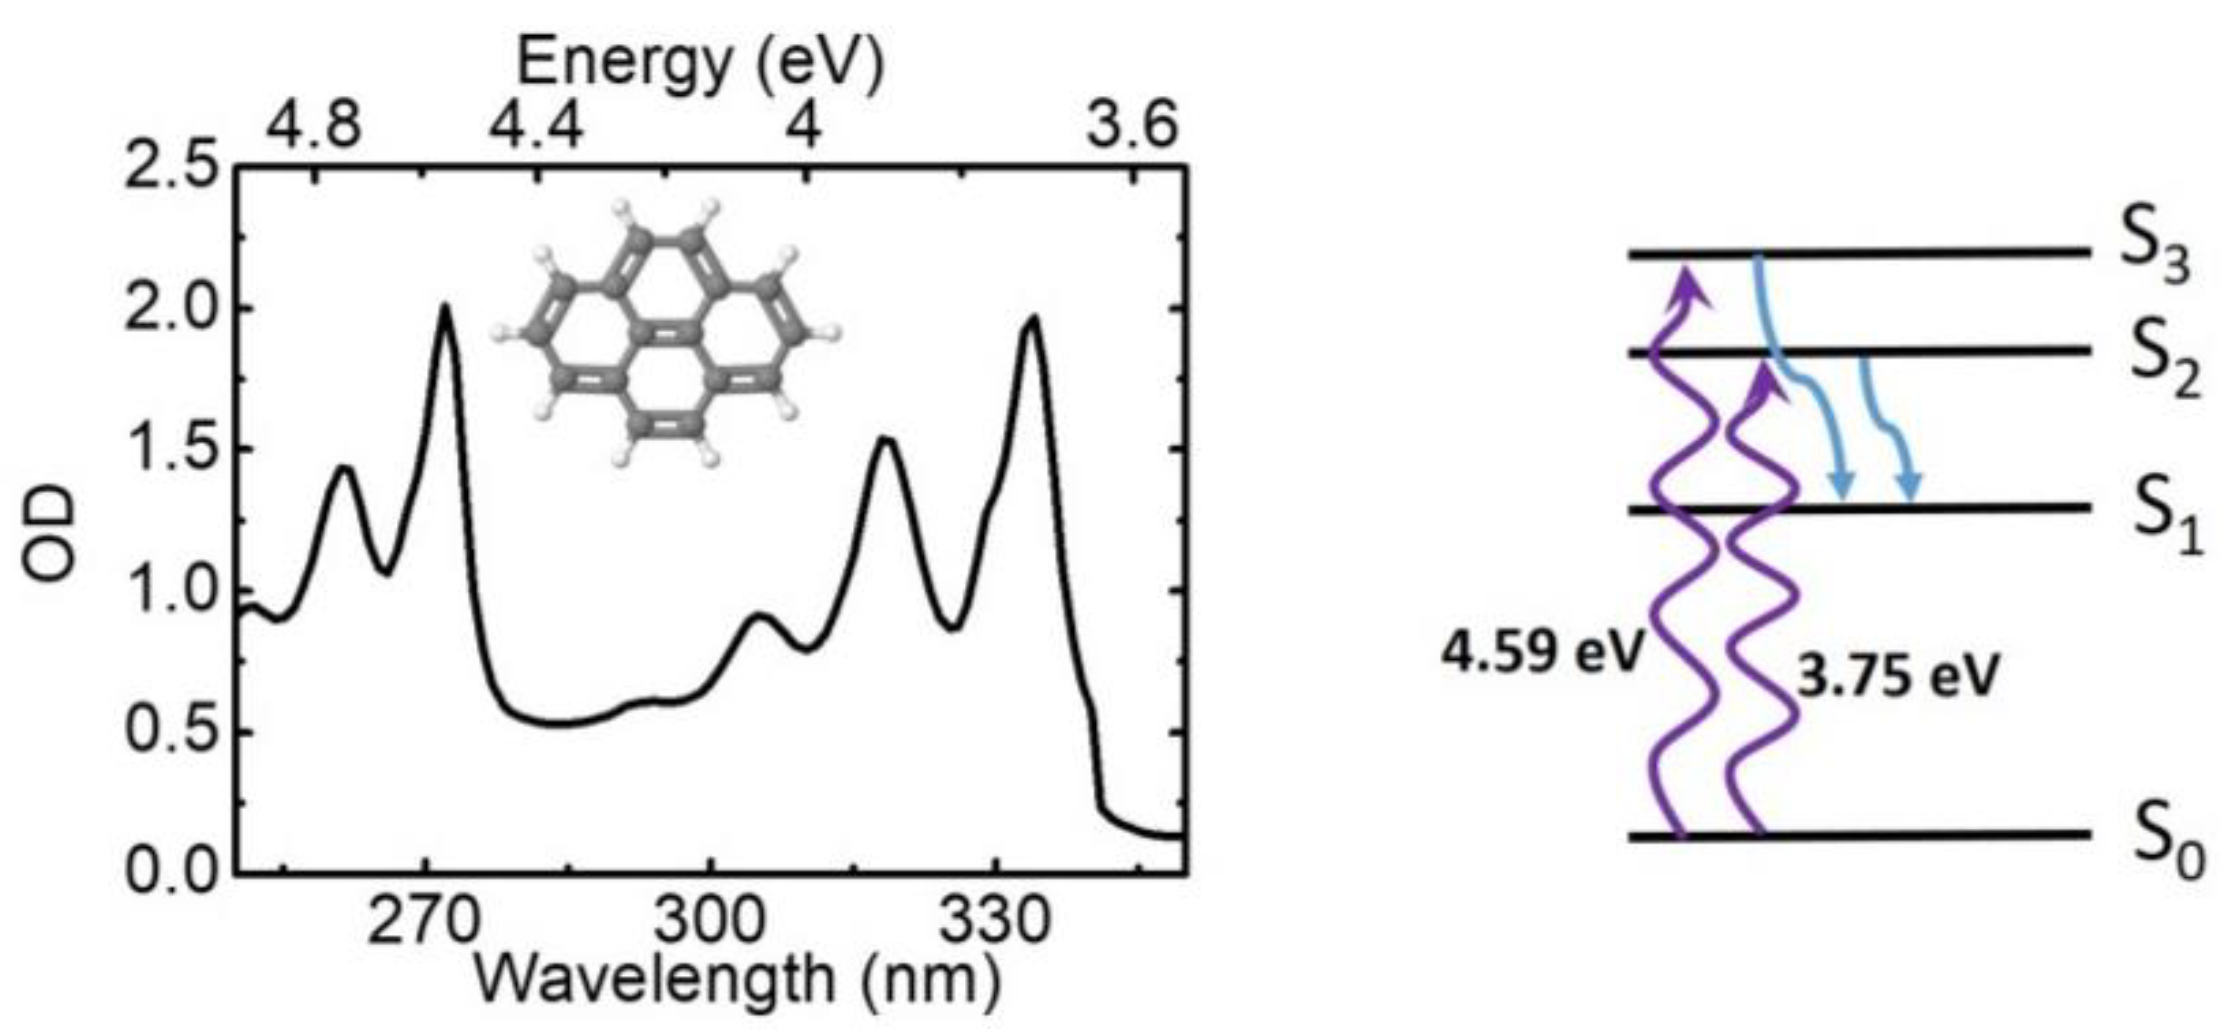
In the following we present a few examples of ultrafast TA spectroscopy results using our high time resolution apparatus. As exemplary molecular system we use pyrene (C16H10, chemical structure shown in Figure 6), a polycyclic aromatic hydrocarbon consisting of four benzene rings. Pyrene purchased from Sigma-Aldrich was used as received, dissolved in methanol, and flown in a 200-μm-thick cuvette with 200-μm-thick entrance and exit windows. The absorption spectrum of pyrene, reported in Figure 6, displays an intense band peaking at 3.7 eV (334 nm), with well-resolved vibronic replicas at 3.9 eV (319 nm) and 4.1 eV (306 nm), followed by a second band peaking at 4.6 eV (270 nm) with a well visible replica at 5 eV (250 nm). According to the well-known electronic structure of pyrene, the ground state has Ag symmetry (S0 or 11Ag state), while the first excited state has B3u symmetry(S1 or 11B3u state); however, the oscillator strength of the S0→S1 transition is very weak so that it is essentially optically forbidden [82]. The first “bright” excited singlet state of pyrene is of B2u symmetry (S2 or 11B2u state) and the S0→S2 transition peaks at 3.7 eV; a second bright excited state is the S3 state (or 21B2u state) with the S0→S3 transition peaking at 4.55 eV (270 nm). Following excitation of the bright S2 or S3 states, rapid internal conversion (IC) to the dark S1 state occurs, mediated by conical intersections. While the S2→S1 process has been studied in detail [83,84,85], the S3→S1 process is less explored. Here we exploit our tunable pump and broadband probe to follow the dynamics of both these processes.
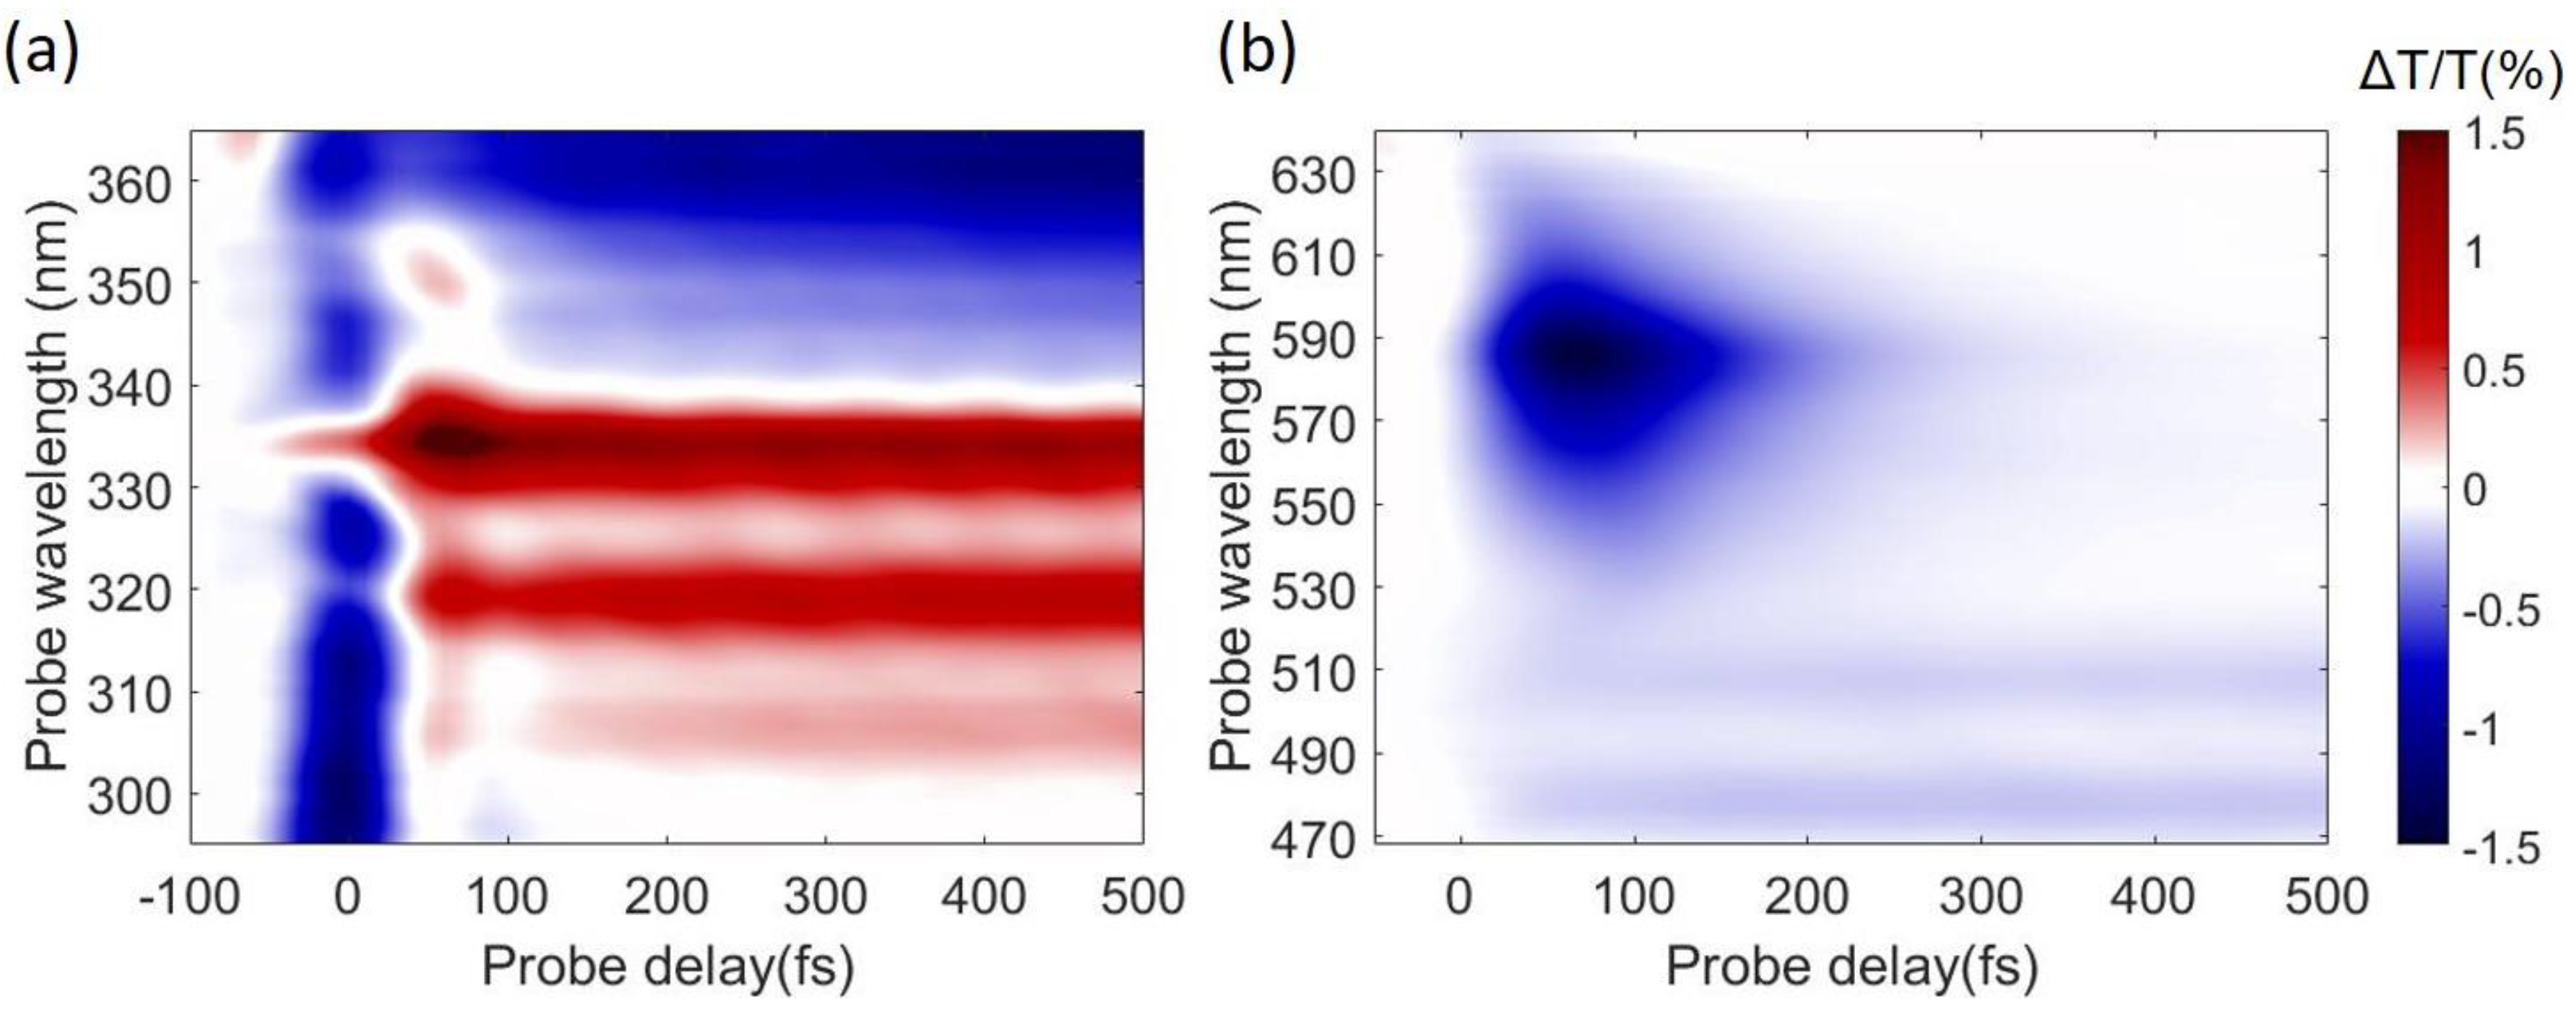
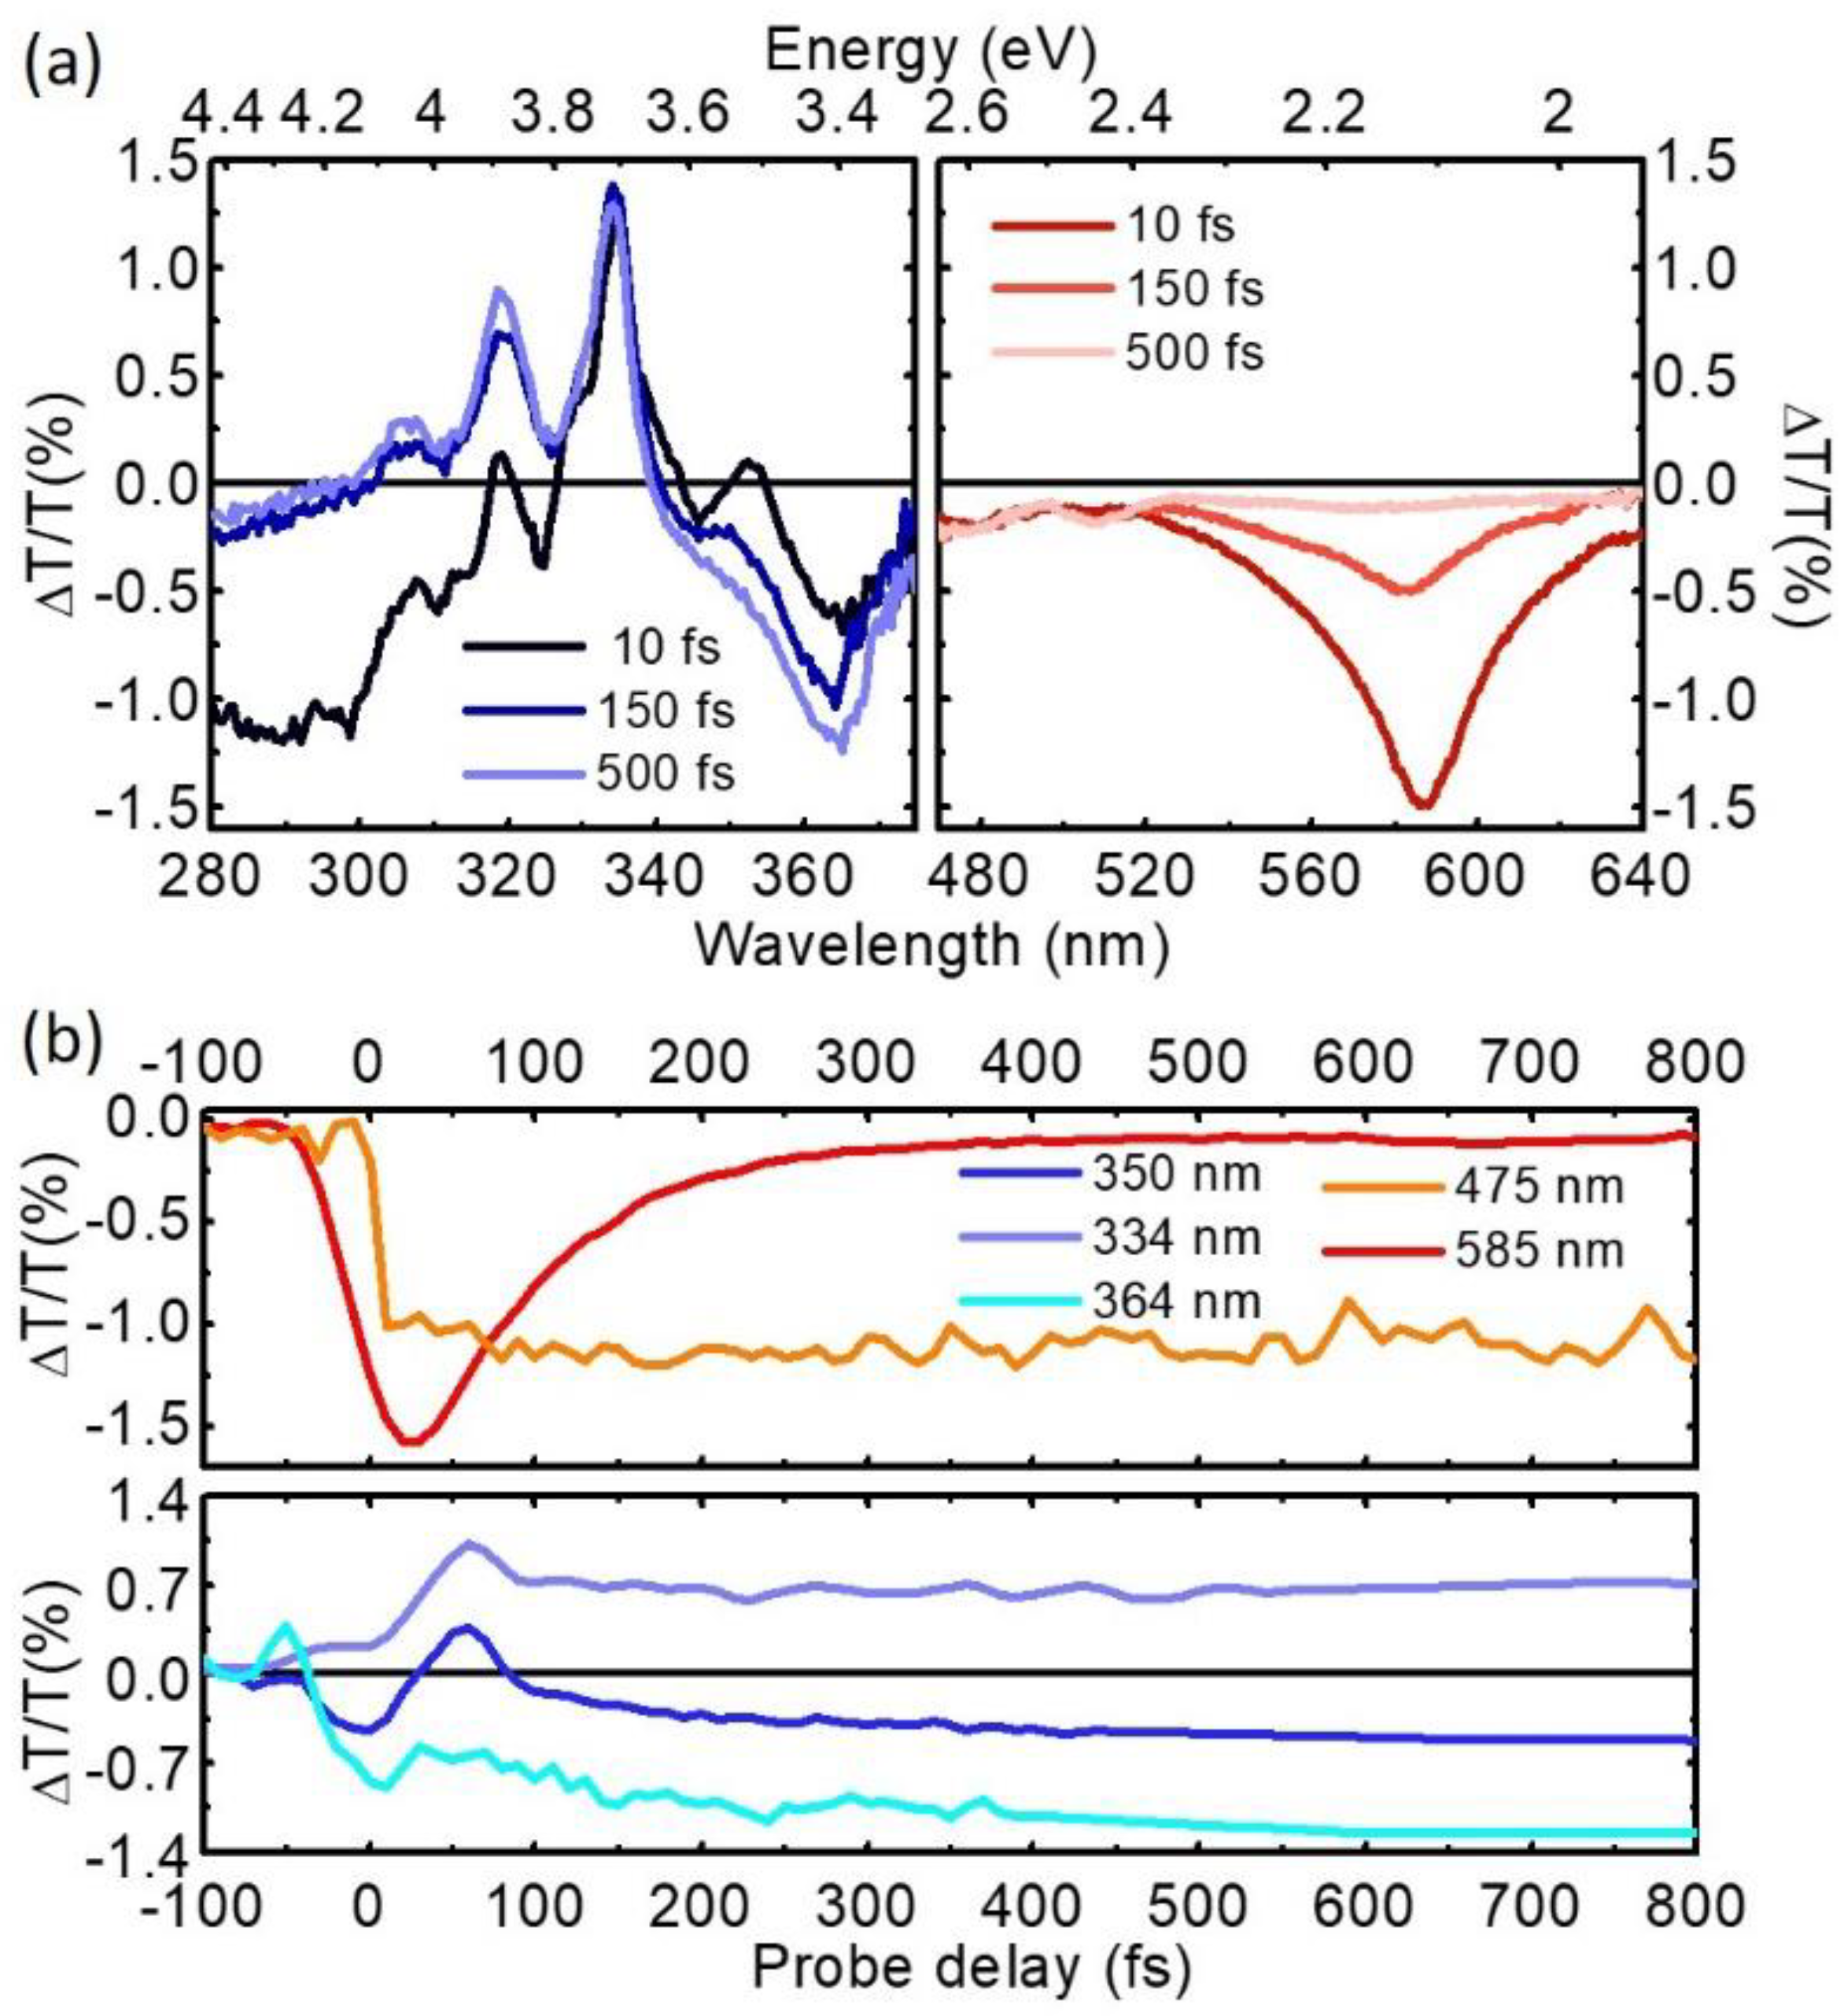
Figure 7 shows TA maps obtained by pumping with SFG at 340 nm and probing in the UV and in the visible range respectively. We start by discussing the UV range (Figure 7a). Around time zero we observe a short-lived signal that is assigned to the solvent response and is due to TPA of one pump and one probe photon. After this we note a strong positive peak at 334 nm, corresponding to photo-bleaching of the S0→S2 transition, resonant with our pump, with the well resolved vibronic replicas at 320 and 306 nm. At longer wavelengths around 360–370 nm we observe a photoinduced absorption (PA) band, assigned to the S1 state, which is not formed instantaneously, but rather grows on the 200-fs timescale. In the visible range we observe a PA band, assigned to the S2 state, which peaks at 580 nm, forms instantaneously and decays on the 200 fs timescale, and two long-lived PA bands peaking at 515 and 470 nm, assigned to S1. Taken together, these data confirm ultrafast IC from the photoexcited S2 to the S1 state; the S2 PA dynamics at 585 nm, displayed in Figure 8b, shows a decay with ≈85-fs time constant, in very good agreement with previous results [83,84,85].
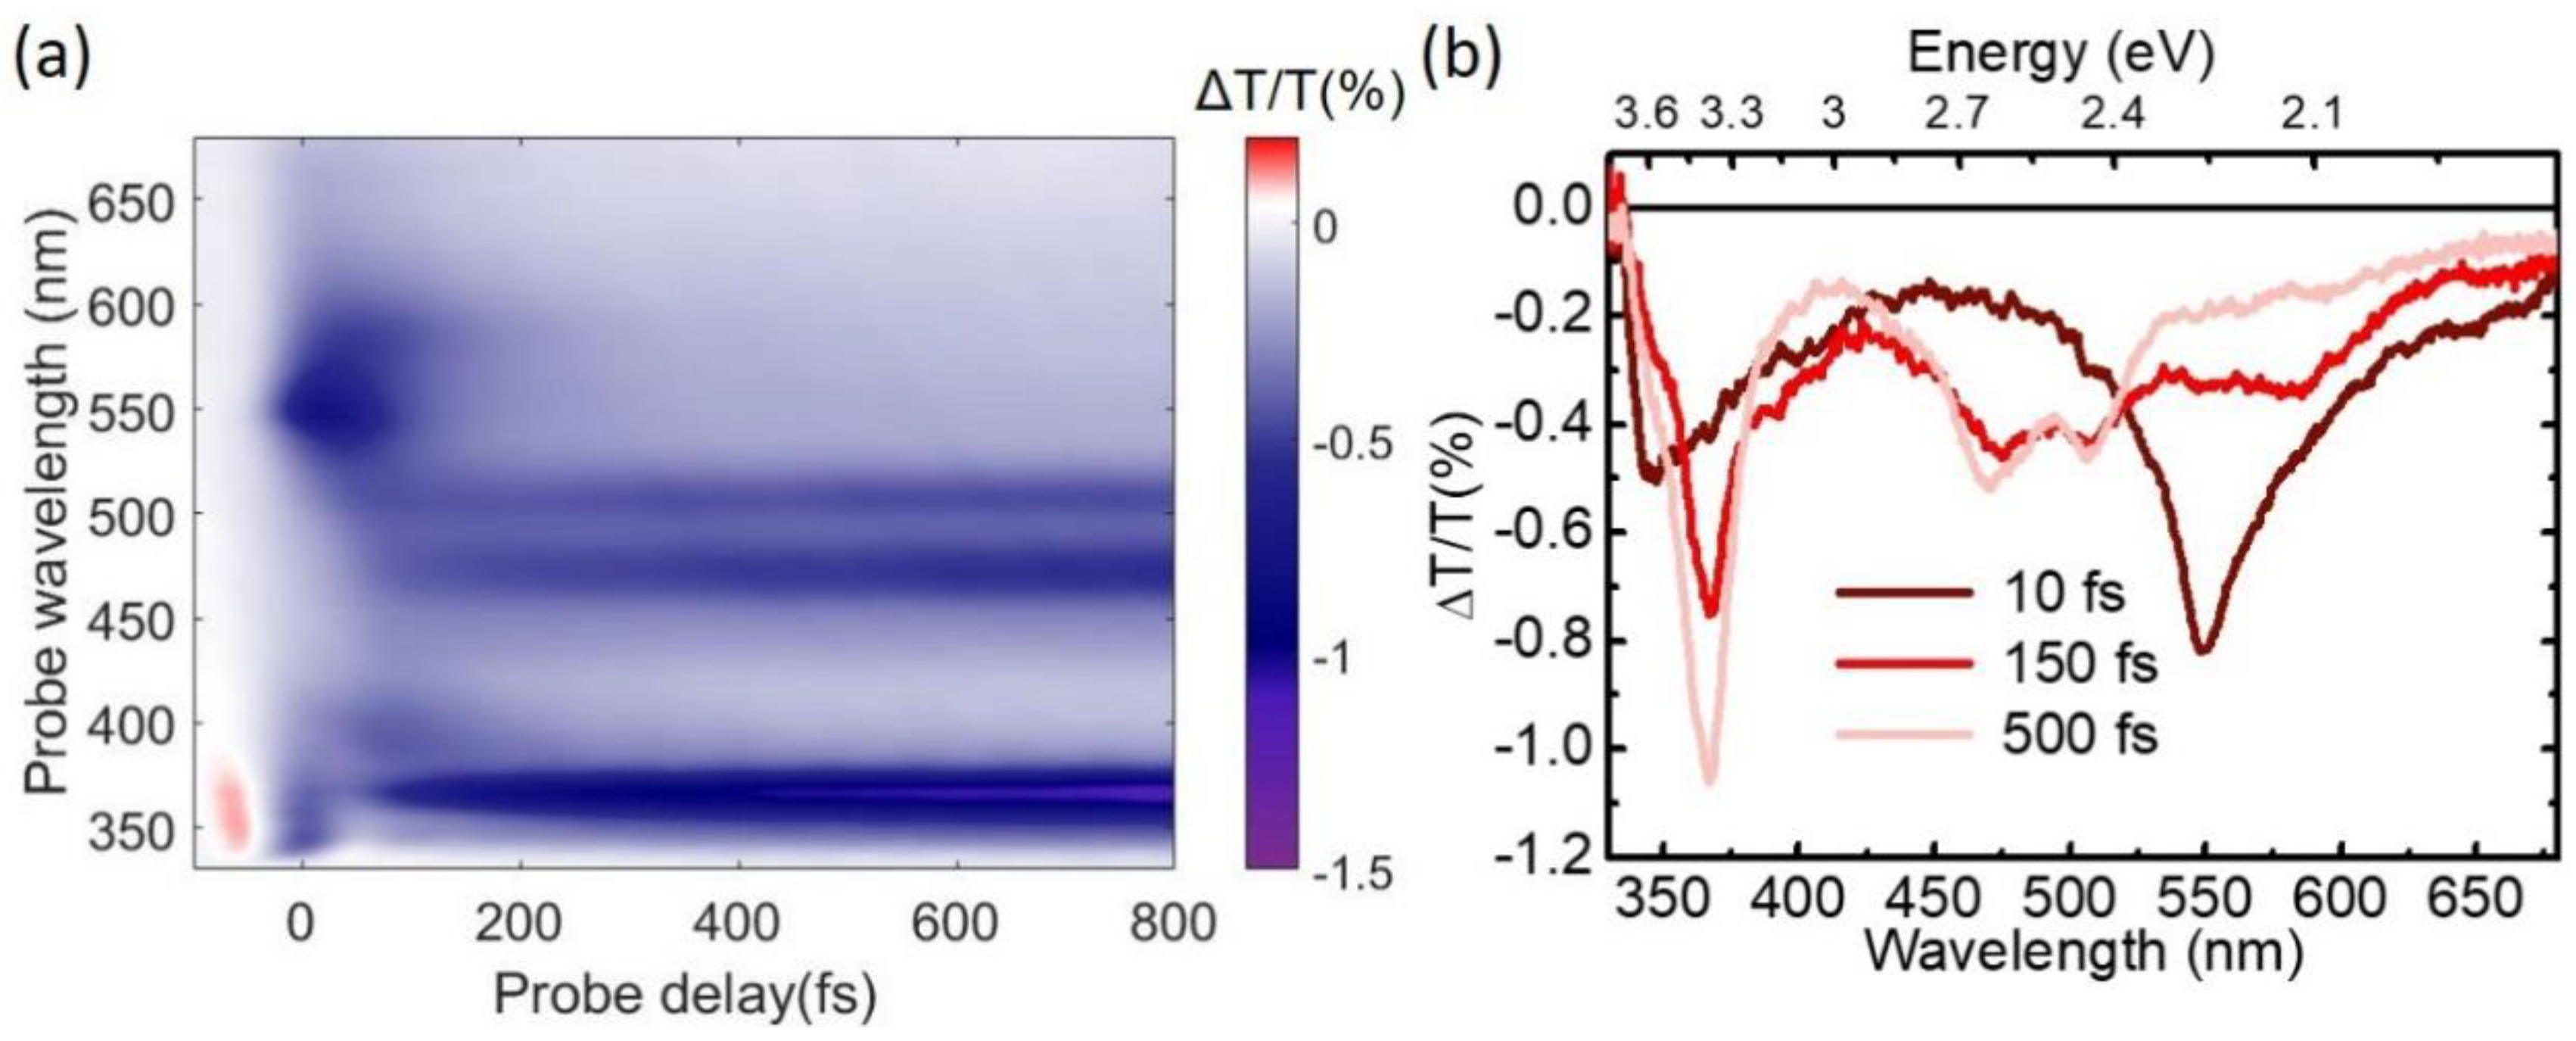
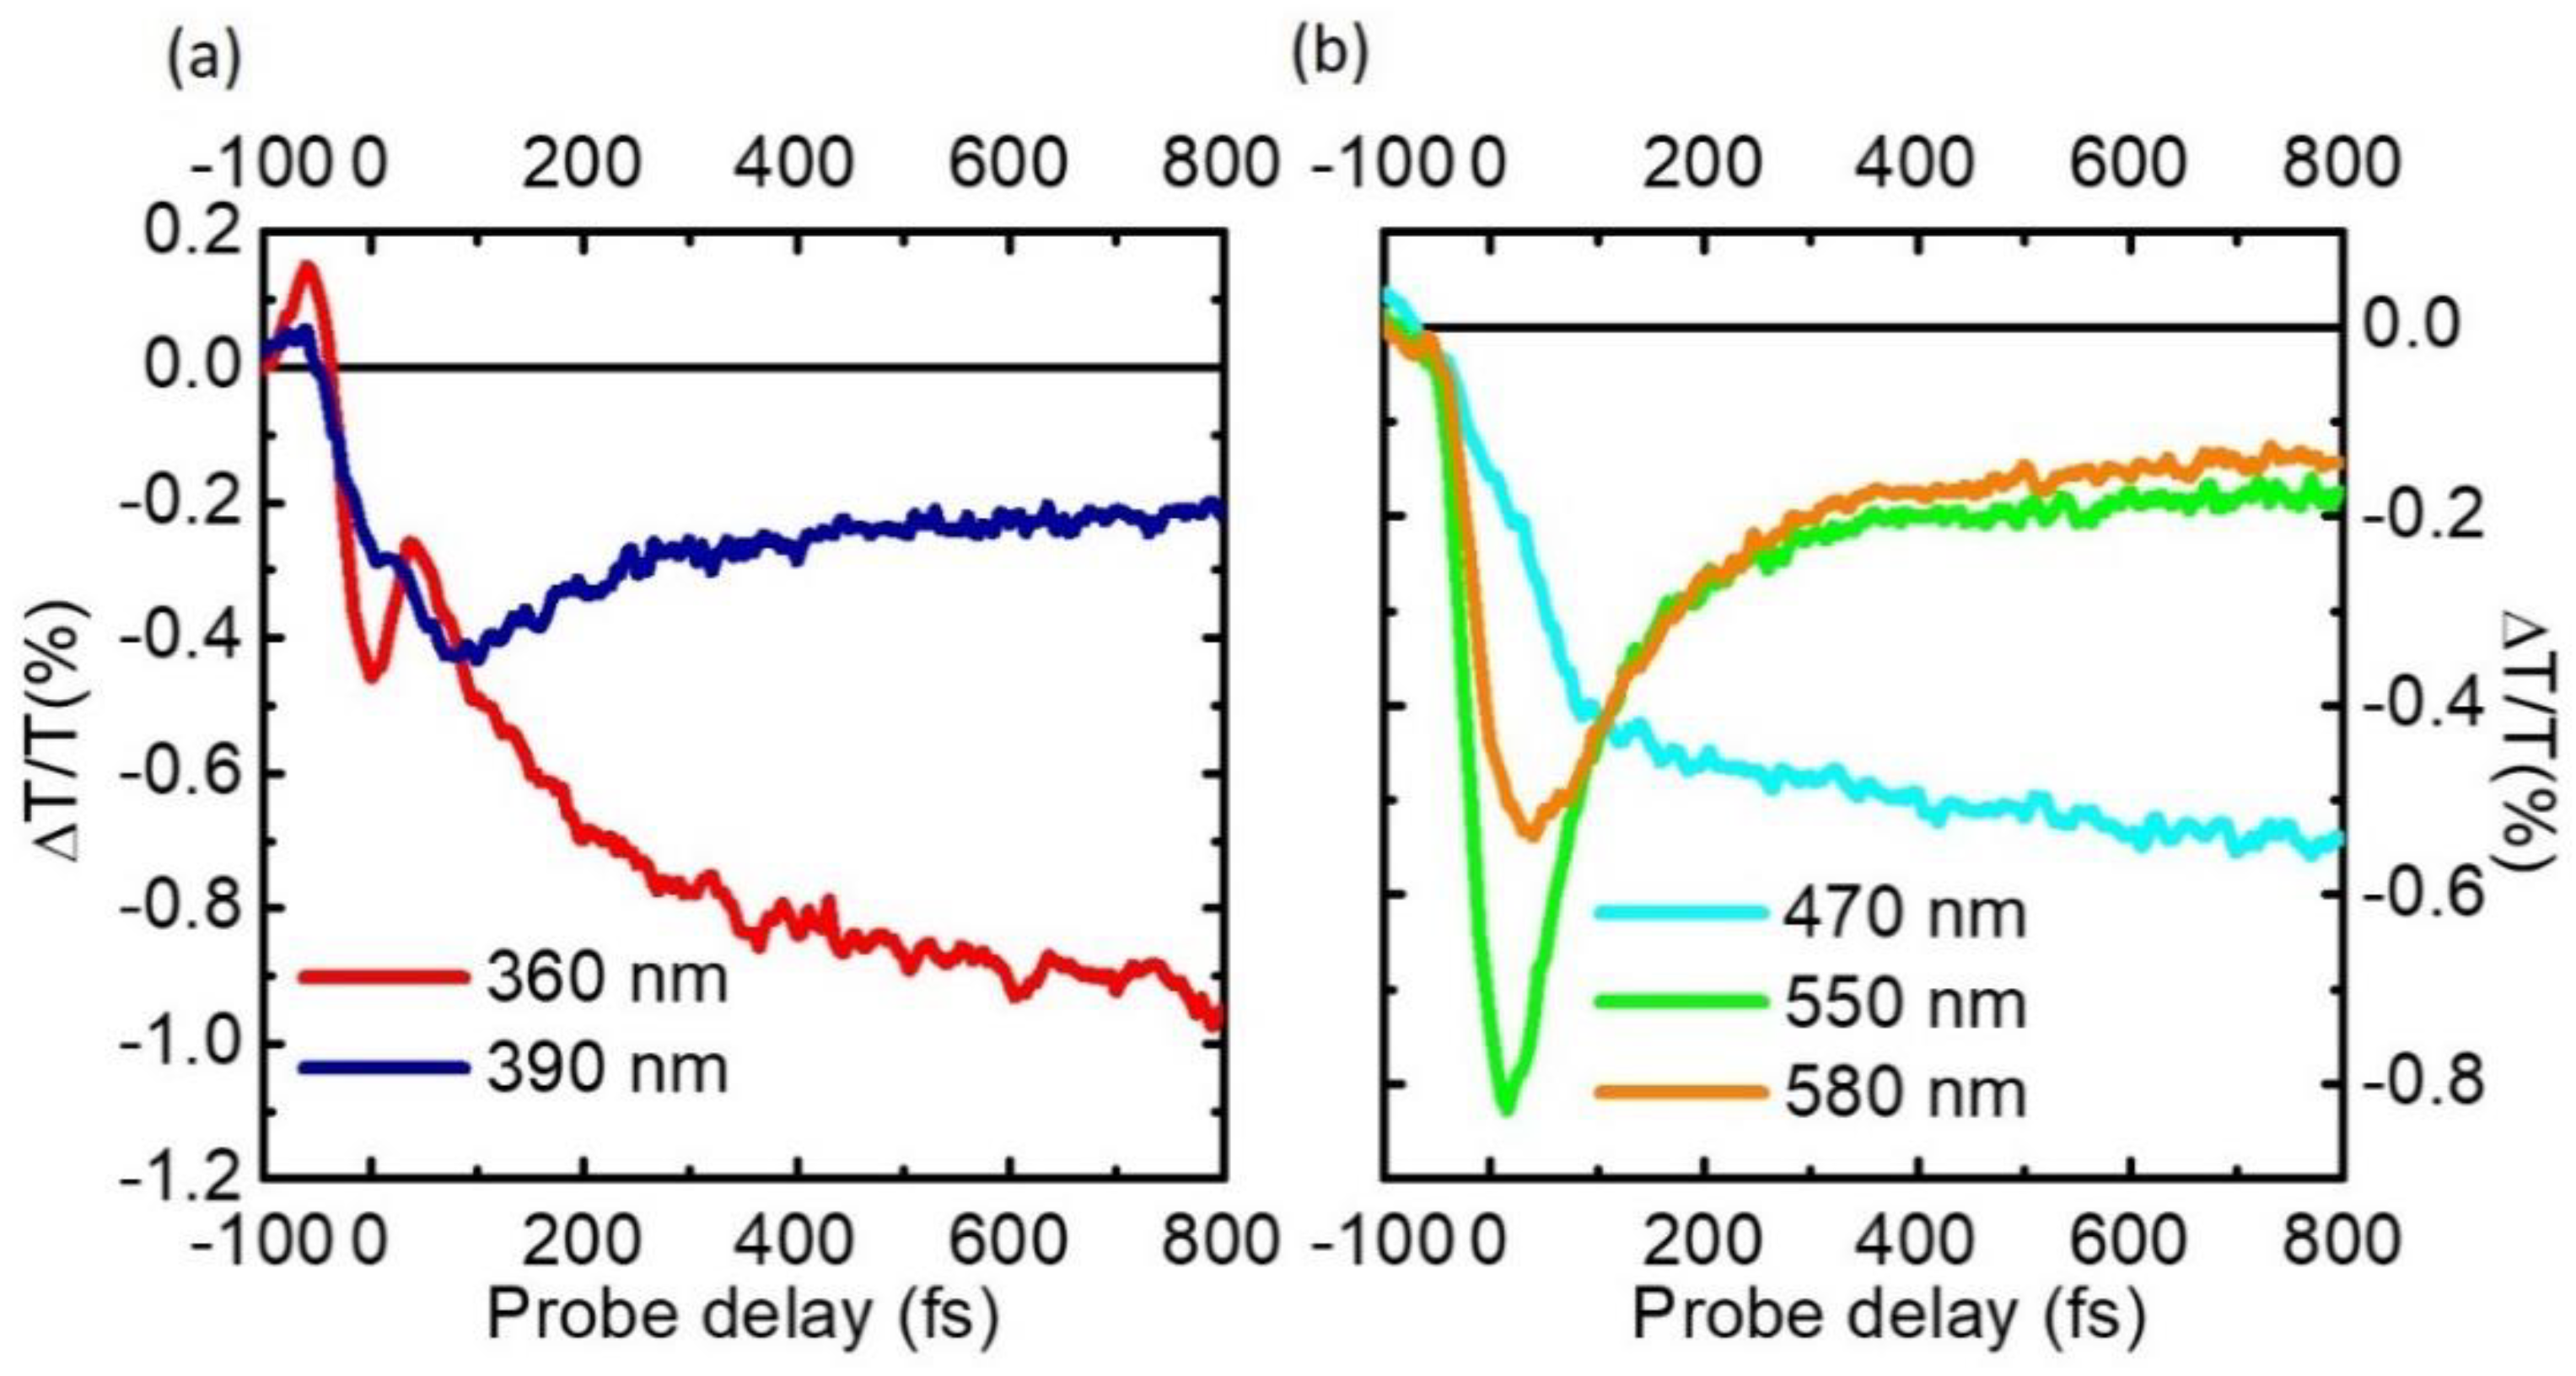
Figure 9a shows the 2D TA map, as a function of probe wavelength and delay, following excitation of the S3 state at 270 nm. At early times we observe a negative ∆T/T signal which peaks at 550 nm and is assigned to a PA from the photoexcited S3 state; this band rapidly shifts to the red at 580 nm (red spectrum in Figure 9b), matching the PA band of S2; at longer delays, the PA spectrum of S1 reappears, with characteristic peaks at 370, 470 and 515 nm. These data are consistent with a two-step S3→S2→S1 IC process; the TA dynamics, displayed in Figure 10, show that this cascaded process occurs, as expected, on a longer 500 fs timescale.
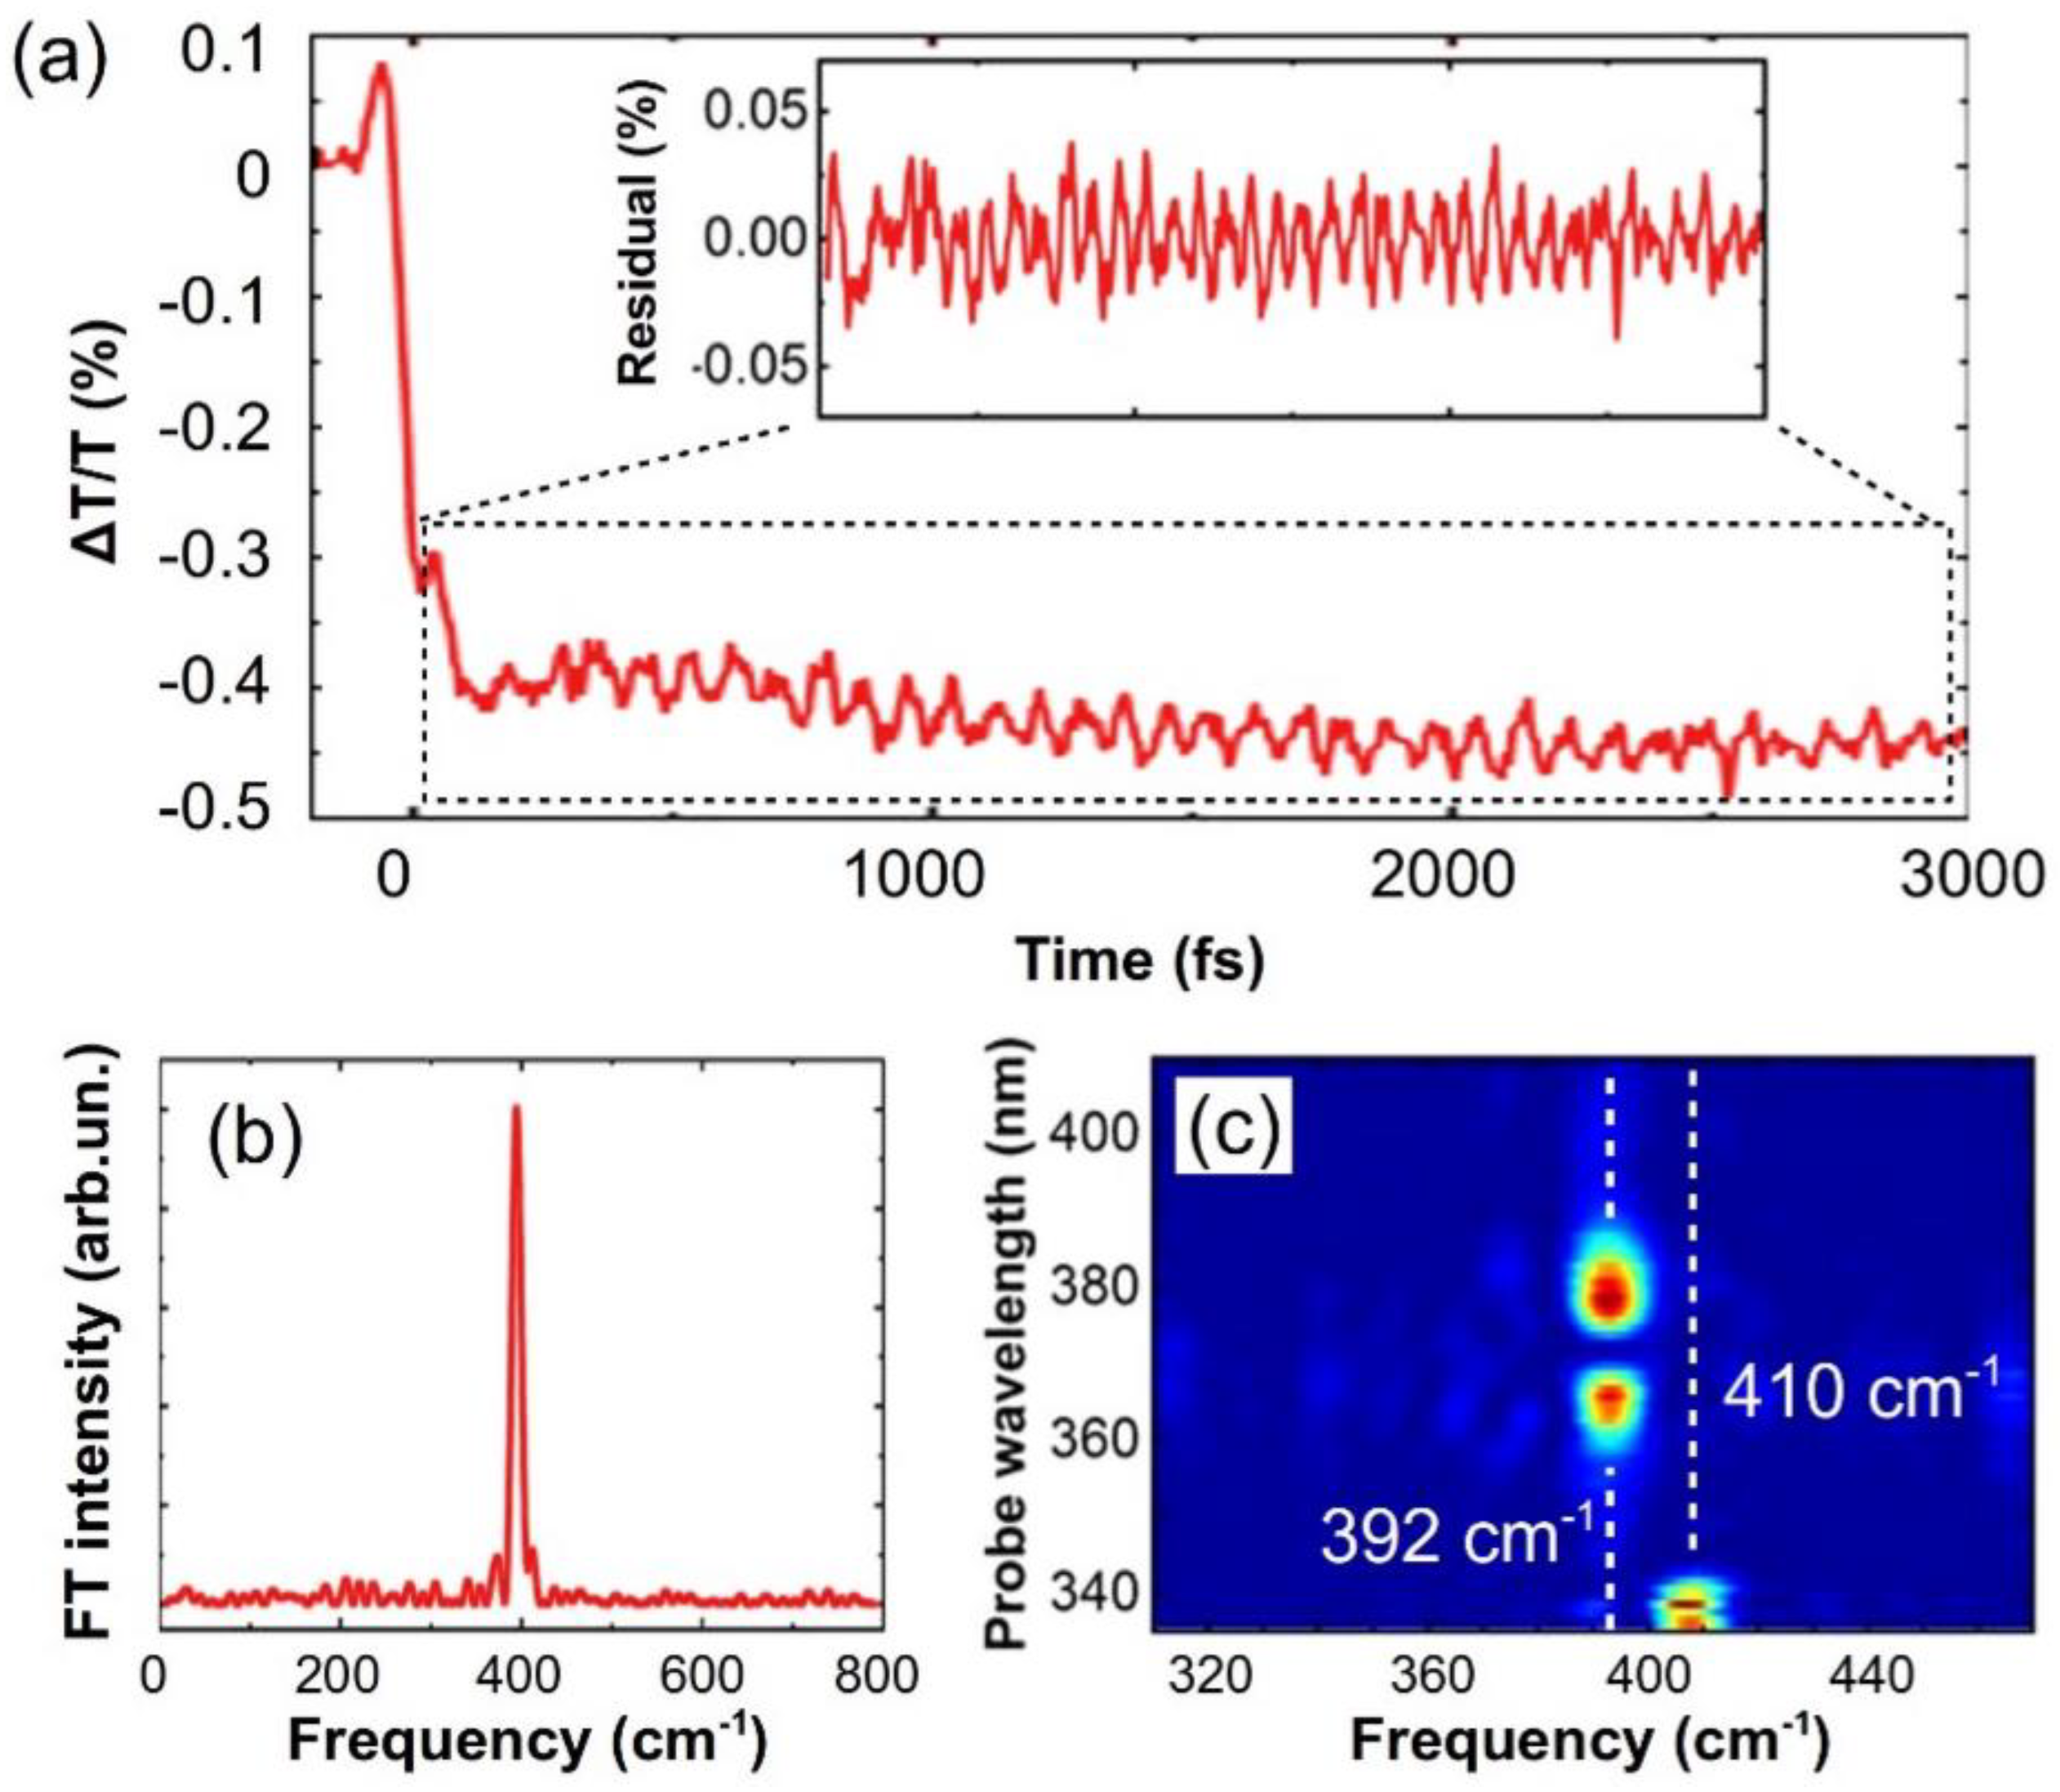
Finally, Figure 11a shows the ∆T/T dynamics at 385 nm, corresponding to the PA from the S1 state; the signal is clearly modulated by a long-lived oscillation, with 85-fs period (corresponding to a 392 cm-1 frequency, as evidenced in panel (b)), which is observed thanks to the high temporal resolution of our setup. A wavelength dependent Fourier transform (panel (c)) reveals a second mode at 410 cm-1 at wavelengths between 335 and 342 nm, which closely matches the Raman ground state mode of 408 cm−1 [86]. Since the 392 cm-1 mode shows a clear amplitude minimum at a wavelength of 370 nm, which corresponds to the peak of the S1 PA band, we assign the oscillation to a vibrational wavepacket on the S1 state, which survives the IC process and is indicative of a vibrationally coherent photophysics in pyrene [87,88,89,90].
5. Conclusions
In this paper, we described a TA spectroscopy system in the UV spectral range, for the study of the ultrafast optical response of biomolecules. The setup, which is driven by a 100-fs regeneratively amplified Ti:sapphire laser, combines sub-20-fs UV pump pulses with broadband white-light-continuum probe pulses. The ultrashort UV pump pulses are generated by frequency up-conversion (SHG or SFG) of a visible ultrashort NOPA output, and are tunable in the 260–370 nm range. Direct frequency-doubling of the ultrashort visible light delivers broadband UV pulses with carrier wavelength from 260 to 290 nm. SFG between the NOPA pulses and a fraction of the laser fundamental wavelength produces pulses with bandwidth in the 320–370 nm range. After suitable compression stages, the pulse duration ranges from 8.4 fs (for the 340 nm pulse) to 18.6 fs (for the 290 nm pulse).
The broadband probe pulses are obtained by white-light continuum generation in sapphire or CaF2 plates, and cover the spectral ranges from 270 to 710 nm with energy fluctuations of 0.2–0.4% rms, corresponding to a noise <10−4 for the ∆T/T signal averaged over 1 s. The ultrashort duration of the pump pulses and the broad bandwidth of the probe pulses determine the extremely high temporal resolution of the pump-probe measurement.
The TA spectroscopy system was applied to study ultrafast processes in pyrene in methanol. After excitation of the bright optical transitions S0→ S2 (occurring at 3.7 eV) and S0→S3 (at 4.6 eV), the system undergoes ultrafast internal conversion from either S2 or S3 to the dark S1 state. Thanks to the ultrashort duration of the pump pulses and the ultrabroad bandwidth of the probe pulses, we could successfully track the internal conversion process, which occurs on hundreds of femtoseconds timescale. In addition, the temporal resolution allowed resolving an impulsively excited molecular vibration, with 85-fs period, which survives the internal conversion process, pointing to a vibrationally coherent photochemistry in pyrene.
The tunability of the pump pulses in the UV spectral range, the sub-20-fs temporal resolution and the broad spectral coverage of the probe contribute to make this TA system a unique, powerful, and versatile tool for the study of many biomolecules, which exhibit absorption in the 250–350 nm wavelength range. This system will allow tracking fundamental biochemical processes such as the photoprotection mechanisms in DNA and the secondary structure of proteins based on the response of aromatic amino acids.
Author Contributions
Investigation, R.B.-V. and L.G.; Methodology, G.C. and C.M.
Funding
The authors acknowledge support by the H2020 Grant Agreement number 765266 (LightDyNAmics), European Research Council Advanced Grant STRATUS (ERC-2011-AdG No. 291198) and the Marie Curie actions (FP7-PEOPLE-IEF-2012).
Conflicts of Interest
The authors declare no conflict of interest.
References
- Steinmeyer, G.; Sutter, D.; Gallmann, L.; Matuschek, N.; Keller, U. Frontiers in Ultrashort Pulse Generation: Pushing the Limits in Linear and Nonlinear Optics. Science 1999, 286, 1507–1512. [Google Scholar] [CrossRef] [PubMed] [Green Version]
- Zewail, A.H. Femtochemistry: Atomic-Scale Dynamics of the Chemical Bond. J. Phys. Chem. A 2000, 104, 5660–5694. [Google Scholar] [CrossRef]
- Sundström, V. Femtobiology. Annu. Rev. Phys. Chem. 2008, 59, 53–77. [Google Scholar] [CrossRef] [PubMed]
- Mukamel, S. Principles of Nonlinear Optical Spectroscopy; Oxford University Press on Demand: Oxford, UK, 1999. [Google Scholar]
- Fuller, F.D.; Ogilvie, J.P. Experimental Implementations of Two-Dimensional Fourier Transform Electronic Spectroscopy. Annu. Rev. Phys. Chem. 2015, 66, 667–690. [Google Scholar] [CrossRef] [PubMed]
- Cerullo, G.; Manzoni, C.; Lüer, L.; Polli, D. Time-resolved methods in biophysics. 4. Broadband pump–probe spectroscopy system with sub-20 fs temporal resolution for the study of energy transfer processes in photosynthesis. Photochem. Photobiol. Sci. 2007, 6, 135–144. [Google Scholar] [CrossRef] [PubMed]
- Polli, D.; Lüer, L.; Cerullo, G. High-time-resolution pump-probe system with broadband detection for the study of time-domain vibrational dynamics. Rev. Sci. Instrum. 2007, 78. [Google Scholar] [CrossRef] [PubMed]
- Megerle, U.; Pugliesi, I.; Schriever, C.; Sailer, C.F.; Riedle, E. Sub-50 fs broadband absorption spectroscopy with tunable excitation: Putting the analysis of ultrafast molecular dynamics on solid ground. Appl. Phys. B 2009, 96, 215–231. [Google Scholar] [CrossRef]
- Riedle, E.; Bradler, M.; Wenninger, M.; Sailer, C.F.; Pugliesi, I. Electronic transient spectroscopy from the deep UV to the NIR: Unambiguous disentanglement of complex processes. Faraday Discuss. 2013, 163, 139–158. [Google Scholar] [CrossRef] [PubMed]
- Vardeny, Z.; Tauc, J. Picosecond coherence coupling in the pump and probe technique. Opt. Commun. 1981, 39, 396–400. [Google Scholar] [CrossRef]
- Polli, D.; Brida, D.; Mukamel, S.; Lanzani, G.; Cerullo, G. Effective temporal resolution in pump-probe spectroscopy with strongly chirped pulses. Phys. Rev. A 2010, 82, 53809. [Google Scholar] [CrossRef]
- Kovalenko, S.A.; Dobryakov, A.L.; Ruthmann, J.; Ernsting, N.P. Femtosecond spectroscopy of condensed phases with chirped supercontinuum probing. Phys. Rev. A 1999, 59, 2369–2384. [Google Scholar] [CrossRef]
- Few-Cycle Laser Pulse Generation and Its Applications; Kärtner, F.X. (Ed.) Springer: Berlin/Heidelberg, Germany, 2004; Volume 95, Topics in Applied Physics; ISBN 978-3-540-20115-1. [Google Scholar]
- Brixner, T.; Stenger, J.; Vaswani, H.M.; Cho, M.; Blankenship, R.E.; Fleming, G.R. Two-dimensional spectroscopy of electronic couplings in photosynthesis. Nature 2005, 434, 625–628. [Google Scholar] [CrossRef] [PubMed]
- Polli, D.; Altoè, P.; Weingart, O.; Spillane, K.M.; Manzoni, C.; Brida, D.; Tomasello, G.; Orlandi, G.; Kukura, P.; Mathies, R.A.; et al. Conical intersection dynamics of the primary photoisomerization event in vision. Nature 2010, 467, 440–443. [Google Scholar] [CrossRef] [PubMed]
- De Vivie-Riedle, R.; De Waele, V.; Kurtz, L.; Riedle, E. Ultrafast Excited-State Proton Transfer of 2-(2′-Hydroxyphenyl)benzothiazole: Theoretical Analysis of the Skeletal Deformations and the Active Vibrational Modes. J. Phys. Chem. A 2003, 107, 10591–10599. [Google Scholar] [CrossRef]
- Nenov, A.; Borrego-Varillas, R.; Oriana, A.; Ganzer, L.; Segatta, F.; Conti, I.; Segarra-Marti, J.; Omachi, J.; Dapor, M.; Taioli, S.; et al. UV-Light-Induced Vibrational Coherences: The Key to Understand Kasha Rule Violation in trans -Azobenzene. J. Phys. Chem. Lett. 2018, 9, 1534–1541. [Google Scholar] [CrossRef] [PubMed]
- Crespo-Hernández, C.E.; Cohen, B.; Hare, P.M.; Kohler, B. Ultrafast excited-state dynamics in nucleic acids. Chem. Rev. 2004, 104, 1977–2019. [Google Scholar] [CrossRef] [PubMed]
- Markovitsi, D. UV-induced DNA Damage: The Role of Electronic Excited States. Photochem. Photobiol. 2016, 92, 45–51. [Google Scholar] [CrossRef] [PubMed] [Green Version]
- Middleton, C.T.; de La Harpe, K.; Su, C.; Law, Y.K.; Crespo-Hernández, C.E.; Kohler, B. DNA Excited-State Dynamics: From Single Bases to the Double Helix. Annu. Rev. Phys. Chem. 2009, 60, 217–239. [Google Scholar] [CrossRef] [PubMed]
- Improta, R.; Santoro, F.; Blancafort, L. Quantum Mechanical Studies on the Photophysics and the Photochemistry of Nucleic Acids and Nucleobases. Chem. Rev. 2016, 116, 3540–3593. [Google Scholar] [CrossRef] [PubMed]
- Jiang, J.; Mukamel, S. Two-Dimensional Ultraviolet (2DUV) Spectroscopic Tools for Identifying Fibrillation Propensity of Protein Residue Sequences. Angew. Chem. Int. Ed. 2010, 49, 9666–9669. [Google Scholar] [CrossRef] [PubMed] [Green Version]
- Nenov, A.; Rivalta, I.; Cerullo, G.; Mukamel, S.; Garavelli, M. Disentangling Peptide Configurations via Two-Dimensional Electronic Spectroscopy: Ab Initio Simulations beyond the Frenkel Exciton Hamiltonian. J. Phys. Chem. Lett. 2014, 5, 767–771. [Google Scholar] [CrossRef] [PubMed]
- Ell, R.; Morgner, U.; Kärtner, F.X.; Fujimoto, J.G.; Ippen, E.P.; Scheuer, V.; Angelow, G.; Tschudi, T.; Lederer, M.J.; Boiko, A.; et al. Generation of 5-fs pulses and octave-spanning spectra directly from a Ti:sapphire laser. Opt. Lett. 2001, 26, 373. [Google Scholar] [CrossRef] [PubMed]
- Nisoli, M.; De Silvestri, S.; Svelto, O.; Szipöcs, R.; Ferencz, K.; Spielmann, C.; Sartania, S.; Krausz, F. Compression of high-energy laser pulses below 5 fs. Opt. Lett. 1997, 22, 522. [Google Scholar] [CrossRef] [PubMed]
- Baltuška, A.; Wei, Z.; Pshenichnikov, M.S.; Wiersma, D.A. Optical pulse compression to 5 fs at a 1-MHz repetition rate. Opt. Lett. 1997, 22, 102. [Google Scholar] [CrossRef] [PubMed]
- Brida, D.; Manzoni, C.; Cirmi, G.; Marangoni, M.; Bonora, S.; Villoresi, P.; De Silvestri, S.; Cerullo, G. Few-optical-cycle pulses tunable from the visible to the mid-infrared by optical parametric amplifiers. J. Opt. 2010, 12, 13001. [Google Scholar] [CrossRef]
- Baltuška, A.; Fuji, T.; Kobayashi, T. Visible pulse compression to 4 fs by optical parametric amplification and programmable dispersion control. Opt. Lett. 2002, 27, 306. [Google Scholar] [CrossRef] [PubMed]
- Szatmári, S. High-brightness ultraviolet excimer lasers. Appl. Phys. B Laser Opt. 1994, 58, 211–223. [Google Scholar] [CrossRef]
- Nagy, T.; Simon, P. Generation of 200-μJ, sub-25-fs deep-UV pulses using a noble-gas-filled hollow fiber. Opt. Lett. 2009, 34, 2300. [Google Scholar] [CrossRef] [PubMed]
- Tzankov, P.; Fiebig, T.; Buchvarov, I. Tunable femtosecond pulses in the near-ultraviolet from ultrabroadband parametric amplification. Appl. Phys. Lett. 2003, 82, 517–519. [Google Scholar] [CrossRef]
- Backus, S.; Peatross, J.; Zeek, Z.; Rundquist, A.; Taft, G.; Murnane, M.M.; Kapteyn, H.C. 16-fs, 1-μJ ultraviolet pulses generated by third-harmonic conversion in air. Opt. Lett. 1996, 21, 665. [Google Scholar] [CrossRef] [PubMed]
- Graf, U.; Fiess, M.; Schultze, M.; Kienberger, R.; Krausz, F.; Goulielmakis, E. Intense few-cycle light pulses in the deep ultraviolet. Opt. Express 2008, 16, 18956–18963. [Google Scholar] [CrossRef] [PubMed]
- Reiter, F.; Graf, U.; Schultze, M.; Schweinberger, W.; Schröder, H.; Karpowicz, N.; Azzeer, A.M.; Kienberger, R.; Krausz, F.; Goulielmakis, E. Generation of sub-3 fs pulses in the deep ultraviolet. Opt. Lett. 2010, 35, 2248–2250. [Google Scholar] [CrossRef] [PubMed]
- Kosma, K.; Trushin, S.A.; Schmid, W.E.; Fuss, W. Vacuum ultraviolet pulses of 11 fs from fifth-harmonic generation of a Ti:sapphire laser. Opt. Lett. 2008, 33, 723–725. [Google Scholar] [CrossRef] [PubMed]
- Durfee, C.G., III; Backus, S.; Murnane, M.M.; Kapteyn, H.C. Ultrabroadband phase-matched optical parametric generation in the ultraviolet by use of guided waves. Opt. Lett. 1997, 22, 1565–1567. [Google Scholar] [CrossRef]
- Durfee, C.G.; Backus, S.; Kapteyn, H.C.; Murnane, M.M.; Durfee, C.G., III; Backus, S.; Kapteyn, H.C.; Murnane, M.M.; Durfee, C.G.; Backus, S.; et al. Intense 8-fs pulse generation in the deep ultraviolet. Opt. Lett. 1999, 24, 697–699. [Google Scholar] [CrossRef] [PubMed]
- Beutler, M.; Ghotbi, M.; Noack, F. Generation of intense sub-20-fs vacuum ultraviolet pulses compressed by material dispersion. Opt. Lett. 2011, 36, 3726. [Google Scholar] [CrossRef] [PubMed]
- Kida, Y.; Liu, J.; Kobayashi, T. Single 10-fs deep-ultraviolet pulses generated by broadband four-wave mixing and high-order dispersion compensation. Appl. Phys. B Lasers Opt. 2011, 105, 675–679. [Google Scholar] [CrossRef]
- Kida, Y.; Okamura, K.; Liu, J.; Kobayashi, T. Sub-10-fs deep-ultraviolet light source with stable power and spectrum. Appl. Opt. 2012, 51, 6403–6410. [Google Scholar] [CrossRef] [PubMed]
- Jiang, Y.; Zhao, B.; Sueda, K.; Miyanaga, N.; Kobayashi, T. Tunable sub-40 fs ultraviolet pulses from non-collinear four-wave mixing in CaF2 crystal. Chin. Opt. Lett. 2011, 9, s10604. [Google Scholar] [CrossRef]
- Kobayashi, T.; Kida, Y. Ultrafast spectroscopy with sub-10 fs deep-ultraviolet pulses. Phys. Chem. Chem. Phys. 2012, 14, 6200–6210. [Google Scholar] [CrossRef] [PubMed]
- Xue, B.; Yabushita, A.; Kobayashi, T. Ultrafast dynamics of uracil and thymine studied using a sub-10 fs deep ultraviolet laser. Phys. Chem. Chem. Phys. 2016, 18, 17044–17053. [Google Scholar] [CrossRef] [PubMed]
- Liu, J.; Yabushita, A.; Taniguchi, S.; Chosrowjan, H.; Imamoto, Y.; Sueda, K.; Miyanaga, N.; Kobayashi, T. Ultrafast time-resolved pump-probe spectroscopy of PYP by a sub-8 fs pulse laser at 400 nm. J. Phys. Chem. B 2013, 117, 4818–4826. [Google Scholar] [CrossRef] [PubMed]
- Horio, T.; Spesyvtsev, R.; Suzuki, T. Generation of sub-17 fs vacuum ultraviolet pulses at 133 nm using cascaded four-wave mixing through filamentation in Ne. Opt. Lett. 2014, 39, 6021. [Google Scholar] [CrossRef] [PubMed] [Green Version]
- Marangoni, M.; Brida, D.; Quintavalle, M.; Cirmi, G.; Pigozzo, F.M.; Manzoni, C.; Baronio, F.; Capobianco, A.D.; Cerullo, G. Narrow-bandwidth picosecond pulses by spectral compression of femtosecond pulses in a second-order nonlinear crystal. Opt. Express 2007, 15, 174–180. [Google Scholar] [CrossRef]
- Beutler, M.; Ghotbi, M.; Noack, F.; Brida, D.; Manzoni, C.; Cerullo, G. Generation of high-energy sub-20 fs pulses tunable in the 250–310 nm region by frequency doubling of a high-power noncollinear optical parametric amplifier. Opt. Lett. 2009, 34, 710–712. [Google Scholar] [CrossRef] [PubMed]
- Szabó, G.; Bor, Z. Broadband frequency doubler for femtosecond pulses. Appl. Phys. B Photophys. Laser Chem. 1990, 50, 51–54. [Google Scholar] [CrossRef]
- Martinez, O.E. Achromatic phase matching for second harmonic generation of femtosecond pulses. IEEE J. Quantum Electron. 1989, 25, 2464–2468. [Google Scholar] [CrossRef]
- Baum, P.; Lochbrunner, S.; Riedle, E. Generation of tunable 7-fs ultraviolet pulses: Achromatic phase matching and chirp management. Appl. Phys. B Lasers Opt. 2004, 79, 1027–1032. [Google Scholar] [CrossRef]
- Baum, P.; Lochbrunner, S.; Riedle, E. Tunable sub-10-fs ultraviolet pulses generated by achromatic frequency doubling. Opt. Lett. 2004, 29, 1686–1688. [Google Scholar] [CrossRef] [PubMed]
- Zhao, B.; Jiang, Y.; Sueda, K.; Miyanaga, N.; Kobayashi, T. Sub-15fs ultraviolet pulses generated by achromatic phase-matching sum-frequency mixing. Opt. Express 2009, 17, 17711–17714. [Google Scholar] [CrossRef] [PubMed]
- Varillas, R.B.; Candeo, A.; Viola, D.; Garavelli, M.; De Silvestri, S.; Cerullo, G.; Manzoni, C.; De Silvestri, S.; Cerullo, G.; Manzoni, C. Microjoule-level, tunable sub-10 fs UV pulses by broadband sum-frequency generation. Opt. Lett. 2014, 39, 3849–3852. [Google Scholar] [CrossRef] [PubMed]
- Walmsley, I.A.; Dorrer, C. Characterization of ultrashort electromagnetic pulses. Adv. Opt. Photonics 2009, 1, 308. [Google Scholar] [CrossRef]
- Streltsov, A.M.; Ranka, J.K.; Gaeta, A.L. Femtosecond ultraviolet autocorrelation measurements based on two-photon conductivity in fused silica. Opt. Lett. 1998, 23, 798–800. [Google Scholar] [CrossRef] [PubMed]
- Takagi, Y. Simple autocorrelator for ultraviolet pulse-width measurements based on the nonlinear photoelectric effect. Appl. Opt. 1994, 33, 6328. [Google Scholar] [CrossRef] [PubMed]
- Hutchinson, M.H.R.; McIntyre, I.A.; Gibson, G.N.; Rhodes, C.K. Measurement of 248-nm, subpicosecond pulse durations by two-photon fluorescence of xenon excimers. Opt. Lett. 1987, 12, 102. [Google Scholar] [CrossRef] [PubMed]
- Trushin, S.A.; Fuss, W.; Kosma, K.; Schmid, W.E. Widely tunable ultraviolet sub-30-fs pulses from supercontinuum for transient spectroscopy. Appl. Phys. B 2006, 85, 1–5. [Google Scholar] [CrossRef]
- Homann, C.; Krebs, N.; Riedle, E. Convenient pulse length measurement of sub-20-fs pulses down to the deep UV via two-photon absorption in bulk material. Appl. Phys. B 2011, 104, 783–791. [Google Scholar] [CrossRef]
- Reuther, A.; Laubereau, A.; Nikogosyan, D.N. A simple method for the in situ analysis of femtosecond UV pulses in the pump-probe spectroscopy of solutions. Opt. Commun. 1997, 141, 180–184. [Google Scholar] [CrossRef]
- Dadap, J.I.; Focht, G.B.; Reitze, D.H.; Downer, M.C. Two-photon absorption in diamond and its application to ultraviolet femtosecond pulse-width measurement. Opt. Lett. 1991, 16, 499. [Google Scholar] [CrossRef] [PubMed]
- Jailaubekov, A.E.; Bradforth, S.E. Tunable 30-femtosecond pulses across the deep ultraviolet. Appl. Phys. Lett. 2005, 87, 21107. [Google Scholar] [CrossRef]
- Möhring, J.; Buckup, T.; Motzkus, M. Shaper-assisted ultraviolet cross correlator. Opt. Lett. 2010, 35, 1816. [Google Scholar] [CrossRef] [PubMed]
- Kane, D.J.; Trebino, R. Characterization of Arbitrary Femtosecond Pulses Using Frequency-Resolved Optical Gating. IEEE J. Quantum Electron. 1993, 29, 571–579. [Google Scholar] [CrossRef]
- Kane, D.J.; Trebino, R. Single-shot measurement of the intensity and phase of an arbitrary ultrashort pulse by using frequency-resolved optical gating. Opt. Lett. 1993, 18, 823–825. [Google Scholar] [CrossRef] [PubMed]
- Linden, S.; Giessen, H.; Kuhl, J. XFROG—A New Method for Amplitude and Phase Characterization of Weak Ultrashort Pulses. Phys. Status Solidi 1998, 206, 119–124. [Google Scholar] [CrossRef]
- Seidel, M.T.; Zhang, Z.Y.; Yan, S.X.; Wells, K.L.; Tan, H.S. Characterization of polarization shaped ultraviolet femtosecond laser pulses. J. Opt. Soc. Am. B Opt. Phys. 2011, 28, 2718–2725. [Google Scholar] [CrossRef]
- Li, H.; Liu, J.; Feng, Y.; Chen, C.; Pan, H.; Wu, J.; Zeng, H. Temporal and phase measurements of ultraviolet femtosecond pulses at 200 nm by molecular alignment based frequency resolved optical gating. Appl. Phys. Lett. 2011, 99. [Google Scholar] [CrossRef]
- Kacprowicz, M.; Wasilewski, W.; Banaszek, K. Complete characterization of weak ultra-short near-UV pulses by spectral interferometry. Appl. Phys. B Lasers Opt. 2008, 91, 283–286. [Google Scholar] [CrossRef] [Green Version]
- Iaconis, C.; Walmsley, I. Self-referencing spectral interferometry for measuring ultrashortoptical pulses. IEEE J. Quantum Electron. 1999, 35, 501–509. [Google Scholar] [CrossRef]
- Shirakawa, A.; Sakane, I.; Kobayashi, T. Pulse-front-matched optical parametric amplification for sub-10-fs pulse generation tunable in the visible and near infrared. Opt. Lett. 1998, 23, 1292. [Google Scholar] [CrossRef] [PubMed]
- Wilhelm, T.; Piel, J.; Riedle, E. Sub-20-fs pulses tunable across the visible from a blue-pumped single-pass noncollinear parametric converter. Opt. Lett. 1997, 22, 1494. [Google Scholar] [CrossRef] [PubMed]
- Cerullo, G.; Nisoli, M.; De Silvestri, S. Generation of 11 fs pulses tunable across the visible by optical parametric amplification. Appl. Phys. Lett. 1997, 71, 3616–3618. [Google Scholar] [CrossRef]
- Zavelani-Rossi, M.; Cerullo, G.; De Silvestri, S.; Gallmann, L.; Matuschek, N.; Steinmeyer, G.; Keller, U.; Angelow, G.; Scheuer, V.; Tschudi, T. Pulse compression over a 170-THz bandwidth in the visible by use of only chirped mirrors. Opt. Lett. 2001, 26, 1155. [Google Scholar] [CrossRef] [PubMed]
- Borrego-Varillas, R.R.; Oriana, A.; Branchi, F.; De Silvestri, S.; Cerullo, G.; Manzoni, C. Optimized ancillae generation for ultra-broadband two-dimensional spectral-shearing interferometry. J. Opt. Soc. Am. B 2015, 32, 1851–1855. [Google Scholar] [CrossRef]
- Birge, J.R.; Crespo, H.M.; Kärtner, F.X. Theory and design of two-dimensional spectral shearing interferometry for few-cycle pulse measurement. J. Opt. Soc. Am. B 2010, 27, 1165. [Google Scholar] [CrossRef] [Green Version]
- Birge, J.R.; Ell, R.; Kärtner, F.X. Two-dimensional spectral shearing interferometry for few-cycle pulse characterization and optimization. In Ultrafast Phenomena XV, Proceedings of the 15th International Conference, Pacific Grove, USA, 30 July–4 August 2006; Springer Series in Chemical Physics; Springer: Berlin/Heidelberg, Germany, 2007; Volume 88, pp. 160–162. [Google Scholar]
- Weiner, A.M. Femtosecond pulse shaping using spatial light modulators. Rev. Sci. Instrum. 2000, 71, 1929–1960. [Google Scholar] [CrossRef]
- Huber, R.; Satzger, H.; Zinth, W.; Wachtveitl, J. Noncollinear optical parametric amplifiers with output parameters improved by the application of a white light continuum generated in CaF2. Opt. Commun. 2001, 194, 443–448. [Google Scholar] [CrossRef]
- Pecourt, J.-M.L.; Peon, J.; Kohler, B. DNA Excited-State Dynamics: Ultrafast Internal Conversion and Vibrational Cooling in a Series of Nucleosides. J. Am. Chem. Soc. 2001, 123, 10370–10378. [Google Scholar] [CrossRef] [PubMed]
- Jou, F.-Y.; Freeman, G.R. Temperature and isotope effects on the shape of the optical absorption spectrum of solvated electrons in water. J. Phys. Chem. 1979, 83, 2383–2387. [Google Scholar] [CrossRef]
- Baba, M.; Saitoh, M.; Kowaka, Y.; Taguma, K.; Yoshida, K.; Semba, Y.; Kasahara, S.; Yamanaka, T.; Ohshima, Y.; Hsu, Y.C.; et al. Vibrational and rotational structure and excited-state dynamics of pyrene. J. Chem. Phys. 2009, 131. [Google Scholar] [CrossRef] [PubMed] [Green Version]
- Foggi, P.; Pettini, L.; Santa, I.; Righini, R.; Califano, S. Transient absorption and vibrational relaxation dynamics of the lowest excited singlet state of pyrene in solution. J. Phys. Chem. 1995, 99, 7439–7445. [Google Scholar] [CrossRef]
- Neuwahl, F.V.R.; Foggi, P. Direct Observation of S2–S1 Internal Conversion in Pyrene by Femtosecond Transient Absorption. Laser Chem. 1999, 19, 375–379. [Google Scholar] [CrossRef]
- Raytchev, M.; Pandurski, E.; Buchvarov, I.; Modrakowski, C.; Fiebig, T. Bichromophoric interactions and time-dependent excited state mixing in pyrene derivatives. A femtosecond broad-band pump-probe study. J. Phys. Chem. A 2003, 107, 4592–4600. [Google Scholar] [CrossRef]
- Shinohara, H.; Yamakita, Y.; Ohno, K. Raman spectra of polycyclic aromatic hydrocarbons. Comparison of calculated Raman intensity distributions with observed spectra for naphthalene, anthracene, pyrene, and perylene. J. Mol. Struct. 1998, 442, 221–234. [Google Scholar] [CrossRef]
- Wang, Q.; Schoenlein, R.; Peteanu, L.; Mathies, R.; Shank, C. Vibrationally coherent photochemistry in the femtosecond primary event of vision. Science 1994, 266, 422–424. [Google Scholar] [CrossRef] [PubMed]
- Pugliesi, I.; Krebs, N.; Riedle, E. Coherent internal conversion of pyrene revealed by pump-probe and ultrabroad 2D-UV spectroscopy. In Proceedings of the 2013 Conference on Lasers & Electro-Optics Europe & International Quantum Electronics Conference CLEO EUROPE/IQEC, Munich, Germany, 12–16 May 2013; Volume 782, p. 1. [Google Scholar]
- Borisevich, N.A.; Kazberuk, D.A.; Mel’nichuk, S.V.; Tikhomirov, S.A.; Tolstorozhev, G.B. Picosecond dynamics of intramolecular charge transfer in benzophenone amino derivatives. J. Appl. Spectrosc. 1995, 62, 441–446. [Google Scholar] [CrossRef]
- Zhang, J.; Han, F.; Kong, W. Zero Kinetic Energy Photoelectron Spectroscopy of Pyrene. J. Phys. Chem. A 2010, 114, 11117–11124. [Google Scholar] [CrossRef] [PubMed]
Figure 1.
Experimental setup for the generation of few-optical-cycle UV pulses, based on: (a) SHG of the NOPA pulse and (b) SFG between the NOPA pulse and a fraction of the FW laser source. DL: delay line; DM: dichroic mirror; C: combiner.
Figure 1.
Experimental setup for the generation of few-optical-cycle UV pulses, based on: (a) SHG of the NOPA pulse and (b) SFG between the NOPA pulse and a fraction of the FW laser source. DL: delay line; DM: dichroic mirror; C: combiner.

Figure 2.
Modified scheme of the 2DSI technique used for the characterization of the UV pulses.

Figure 3.
(a) Experimental setup of the broadband UV TA spectrometer. (b) WLC generation driven by the FW of the laser source; (c) WLC generation driven by the SH of the laser source. BS: beam splitter; OM: optical modulator; CG: compensating glass; VA: variable attenuator; F1, F2, F3: short-pass filters.

Figure 4.
Upper panel: Spectra of UV pulses centered at 270 nm, 290 nm and 345 nm and corresponding spectral phases obtained using the modified 2DSI technique described in Section 3.2. Lower panel: corresponding retrieved pulse temporal profiles together with the TL profiles (dashed black lines).
Figure 4.
Upper panel: Spectra of UV pulses centered at 270 nm, 290 nm and 345 nm and corresponding spectral phases obtained using the modified 2DSI technique described in Section 3.2. Lower panel: corresponding retrieved pulse temporal profiles together with the TL profiles (dashed black lines).

Figure 5.
Solid lines: spectra of the WLC generated in CaF2 with the SH pump (a), in CaF2 with the FW pump (b) and in sapphire with the FW pump (c). Shaded areas: shot-to-shot wavelength dependent rms of the WLC fluctuations.
Figure 5.
Solid lines: spectra of the WLC generated in CaF2 with the SH pump (a), in CaF2 with the FW pump (b) and in sapphire with the FW pump (c). Shaded areas: shot-to-shot wavelength dependent rms of the WLC fluctuations.

Figure 6.
Chemical structure (inset) and linear absorption spectrum of pyrene dissolved in methanol; schematic of energy level structure of pyrene, and the internal conversion processes after excitation in the UV.
Figure 6.
Chemical structure (inset) and linear absorption spectrum of pyrene dissolved in methanol; schematic of energy level structure of pyrene, and the internal conversion processes after excitation in the UV.

Figure 7.
Pyrene TA maps acquired after 340-nm excitation, and probing in the UV (a) and visible (b) range.
Figure 7.
Pyrene TA maps acquired after 340-nm excitation, and probing in the UV (a) and visible (b) range.

Figure 8.
(a) TA spectra of pyrene following excitation at 340 nm at different probe delays; (b) TA dynamics at probe wavelengths in the UV and visible range. For ease of comparison, the traces at 475 and 334 nm have been multiplied by a factor 10 and 0.5 respectively.
Figure 8.
(a) TA spectra of pyrene following excitation at 340 nm at different probe delays; (b) TA dynamics at probe wavelengths in the UV and visible range. For ease of comparison, the traces at 475 and 334 nm have been multiplied by a factor 10 and 0.5 respectively.

Figure 9.
(a) TA map of pyrene as a function of probe wavelength and delay following excitation at 270 nm; (b) TA spectra at different pump-probe delays.
Figure 9.
(a) TA map of pyrene as a function of probe wavelength and delay following excitation at 270 nm; (b) TA spectra at different pump-probe delays.

Figure 10.
TA dynamics of pyrene following excitation at 270 nm, at UV (a) and visible (b) probe wavelengths.
Figure 10.
TA dynamics of pyrene following excitation at 270 nm, at UV (a) and visible (b) probe wavelengths.

Figure 11.
(a) Dynamics at 385 nm (main panel) and residuals (inset) after subtraction of a multi-exponential fit; (b) Fourier transform of the residual from panel (a); (c) The Fourier intensity of the oscillatory component as a function of the probe wavelength.
Figure 11.
(a) Dynamics at 385 nm (main panel) and residuals (inset) after subtraction of a multi-exponential fit; (b) Fourier transform of the residual from panel (a); (c) The Fourier intensity of the oscillatory component as a function of the probe wavelength.

© 2018 by the authors. Licensee MDPI, Basel, Switzerland. This article is an open access article distributed under the terms and conditions of the Creative Commons Attribution (CC BY) license (http://creativecommons.org/licenses/by/4.0/).
Share and Cite
MDPI and ACS Style
Borrego-Varillas, R.; Ganzer, L.; Cerullo, G.; Manzoni, C. Ultraviolet Transient Absorption Spectrometer with Sub-20-fs Time Resolution. Appl. Sci. 2018, 8, 989. https://doi.org/10.3390/app8060989
AMA Style
Borrego-Varillas R, Ganzer L, Cerullo G, Manzoni C. Ultraviolet Transient Absorption Spectrometer with Sub-20-fs Time Resolution. Applied Sciences. 2018; 8(6):989. https://doi.org/10.3390/app8060989
Chicago/Turabian StyleBorrego-Varillas, Rocío, Lucia Ganzer, Giulio Cerullo, and Cristian Manzoni. 2018. "Ultraviolet Transient Absorption Spectrometer with Sub-20-fs Time Resolution" Applied Sciences 8, no. 6: 989. https://doi.org/10.3390/app8060989
Note that from the first issue of 2016, this journal uses article numbers instead of page numbers. See further details here.