Study of the Wave Energy Propagation Patterns in the Western Black Sea


Department of Mechanical Engineering, Faculty of Engineering, “Dunărea de Jos” University of Galati, 47 Domneasca Street, 800008 Galati, Romania
Appl. Sci. 2018, 8(6), 993; https://doi.org/10.3390/app8060993
Submission received: 26 May 2018
/
Revised: 12 June 2018
/
Accepted: 15 June 2018
/
Published: 17 June 2018
(This article belongs to the Special Issue Sustainable Energy Systems Planning, Integration and Management)
Abstract
:The most relevant patterns of the wave energy propagation in the western side of the Black Sea were assessed in the present work. The emphasis was put on the western side because this is also the most energetic part of the Black Sea. The assessments performed relate some recent results provided by a numerical wave modeling system based on the spectrum concept. The SWAN model (acronym for Simulating Waves Nearshore) was considered. This was implemented over the entire sea basin and focused with increasing resolution in the geographical space towards the Romanian nearshore. Furthermore, some data assimilation techniques have also been implemented, such that the results provided are accurate and reliable. Special attention was paid to the high, but not extreme, winter wave energy conditions. The cases considered are focused on the coastal waves generated by distant storms, which means the local wind has not very high values in the targeted areas. This also takes into account the fact that the configuration of the environmental matrix in the Black Sea is currently subjected to significant changes mainly due to the climate change. From this perspective, the present work illustrates some of the most recent patterns of wave energy propagation in the western side of the Black Sea, considering eight different SWAN computational domains. According to most of the recent evaluations, the nearshore of the Black Sea is characterized by an average wave power lower than 6 kW/m. The results of the present work show that there is a real tendency of the wave energy enhancement. This tendency, especially concerns the western side of the basin, where in the high conditions considered, values of the wave power about 10 times greater than the average have been noticed.
1. Introduction
Without a doubt, conversion of wave energy into electricity represents one of the greatest challenges of the 21st century. Wave energy is abundant and it has a higher density and predictability than wind or solar energy. Furthermore, there is a wide variety of ways to harness the waves, although the technologies associated with the wave energy conversion are not yet mature enough and none of the existing solutions can be considered now as being the best and the most efficient. Thus, in the struggle against the CO2 emissions about 100 GW of the ocean energy capacity is expected to be installed by 2050 [1]. From this perspective, ocean energy is expected to play a significant role in the future EU energy system, and by 2050 its potential contribution should cover about 10% of the EU power demand.
An important step forward in extracting renewable energy resources in the marine environment is represented by the recent dynamics of the offshore wind industry. Thus, by receiving momentum from the onshore wind, the development of the offshore wind has had a spectacular advance in the last years. The wind is stronger and steadier offshore, and moreover, while the land is almost saturated, in the marine environment there is practically unlimited space to deploy large wind farms. Furthermore, despite some initial difficulties related to the high cost of installation and operating conditions in the harsh marine environment, very high dynamics in increasing the efficiency of the offshore wind can be also noticed. This is measured, especially through the levelized cost of energy (LCOE), which reached a record value of about 7 c€/kWh in 2017, or less. Thus, 5.5 c€/kWh have been reported at the 700 MW Borssele (The Netherlands) due to government tender and size, and 5c €/kWh (without transmission) at the 600 MW Kriegers Flak (Denmark) [2]. This means the offshore wind becomes now not only the cheapest marine renewable energy resource, but it is also cheaper than some traditional resources. For example, the current average LCOE for atomic energy is still about 11 c€/kWh, or greater [3].
Various studies [4,5,6,7] showed that the wind energy resources along the coasts of the Black Sea, and especially in its western side, are comparable with those from many offshore wind farms that are already operational [8,9,10,11]. Thus, it is expected that the high dynamics of the offshore wind industry will have as a result also the implementation of some wind farm projects in the nearshore of the Black Sea, in general and in its western side, which is more energetic, in special. Furthermore, most of the studies [12,13,14,15] indicate that the climate change will induce significant enhancements of the wind speed in the Mediterranean and Black Sea basins.
On the other hand, although the potential of wave energy in the Black Sea is not comparable with that from the ocean [16,17,18], the expected advances of the WEC (Wave Energy Converters) technologies may make this coastal environment interesting also for the implementation of the marine energy farms, especially as regards the hybrid wind-wave projects. Many coastal areas in the Black Sea are subjected to high erosion processes and the future nearshore farms can play an important role in the coastal protection, because they extract (or dissipate) part of the wave energy before the waves arriving to the shore [19,20,21,22,23,24]. Furthermore, this is a general problem for many coastal environments and the marine energy farms, besides providing electricity, can become an effective solution in the struggle against the coastal erosion [25,26,27].
From this perspective, the present work has as a main objective to assess the most recent wave energy propagation patterns in the western side of the Black Sea. This considers also the fact that there is an obvious dynamics of the wave climate in the Black Sea having as a consequence important changes in the actual patterns of the nearshore wave propagation and inducing significant enhancements of the wave power. For this purpose, a wave modeling system based on the SWAN (Simulating Waves Nearshore) spectral model [28] has been implemented in the Black Sea basin and focused on the Romanian nearshore in a multilevel modeling system with increasing resolution towards the cost.
2. Materials and Methods
2.1. Theory of SWAN Spectral Model
SWAN is a spectral phase averaged wave model that integrates the action balance equation in time, in the geographical space and in the spectral space, which is defined by the relative frequency () and the wave direction (θ) [29,30]:
The wave action (N) is considered in the above equation since in the presence of the currents the action density is conserved while the energy spectrum is not. The wave action is equal to the energy density (E) divided by the relative frequency. For larger scale, the geographical space is represented in spherical coordinates, longitude and latitude , and the operator has the expression:
For coastal applications the Cartesian coordinates (x) and (y) are mostly used and the operator becomes in this case:
The left side of the governing Equation (1) represents the kinematic part, which indicates the propagation of the wave action in time, geographical and spectral spaces considering also the effect of some relevant phenomena as wave diffraction or refraction. On the right hand side is the source (S) expressed in terms of energy density. In deep water, three components are more relevant, corresponding to the atmospheric input (Sin), nonlinear quadruplet interactions (Snl) and whitecapping dissipation (Sdiss). In intermediate and shallow water some additional terms, corresponding the finite depth effects (Sfd) and including phenomena as bottom friction, depth-induced wave-breaking or triad nonlinear wave—wave interactions, may become significant and in this case the total source becomes:
As regards the wave power components (expressed in W/m, i.e., energy transport per unit length of wave front), they are computed in the spectral wave models, with the relationships [31]:
In the above equation x, y are the problem coordinate system and cx, cy are the propagation velocities of the wave energy in the geographical space (absolute group velocity components) defined as:
Thus, the absolute value of the energy transport (denoted also as wave power) will be:
2.2. Computational Levels Defined
A multilevel, SWAN-based wave prediction system has been implemented and focused on the western side of the sea in a downscaling process [32,33,34,35]. Various sensitivity tests and validations have been carried out for each computational level [36], taking into account also the computational strategies adopted in other coastal environments where the model results have been intensively validated against in situ measurements and remotely sensed data [37]. A special attention was paid to the coastal areas with more complex coastal dynamics, as for example the mouths of the Danube River where strong interactions occur between the waves and currents generated by the Danube River outflow [38,39].
From this perspective, four SWAN computational levels have been defined in the present work, performing model simulations in eight different areas. The first three levels correspond to the spherical coordinates and their characteristics are provided in Table 1. In this table Δλ and Δφ represent the spatial resolution, Δt the time resolution, nf number of frequencies, nθ number of directions, nλ number of grid points in longitude, nφ number of grid points in latitude, and np total number of grid points. Thus, the first computation level (L1) corresponds to the generation area, which comprises the entire basin of the Black Sea and the corresponding SWAN domain was denoted as Sph1 and has the resolution in the geographical space 0.08° × 0.08°. The second level (L2) reflects the SWAN domain (Sph2) defined to drive the coastal wave transformation in the Romanian nearshore, located on the western side of the basin. The resolution in the geographical space is in this case 0.02° × 0.02°. Finally, the third level defined considering the spherical coordinates (L3) comprises three different SWAN domains (denoted as Sph3, Sph4 and Sph5), all of them having the resolution in the geographical space 0.01° × 0.01°. Sph3 is focused on the area at the mouths of the Danube River, while Sph4 and Sph5 is focused on the southern part of the Romanian nearshore—they are denoted as Southern RO1 and Southern RO2. The reason for considering two domains, one larger and another one smaller, focused on the same area in the nearshore of the main Romanian littoral cities is that for the domain Southern RO1 a local multiparameter data assimilation scheme has been implemented [40,41] considering the in situ measurements from the Gloria drilling unit, which is located close to the western boundary of the computational domain. On the other hand, from operational considerations, it was also found useful to define another SWAN domain, computationally more effective, which is focused especially on the Romanian littoral cities. The geographical spaces corresponding to these five computational domains (Sph1–Sph5) are illustrated in Figure 1.
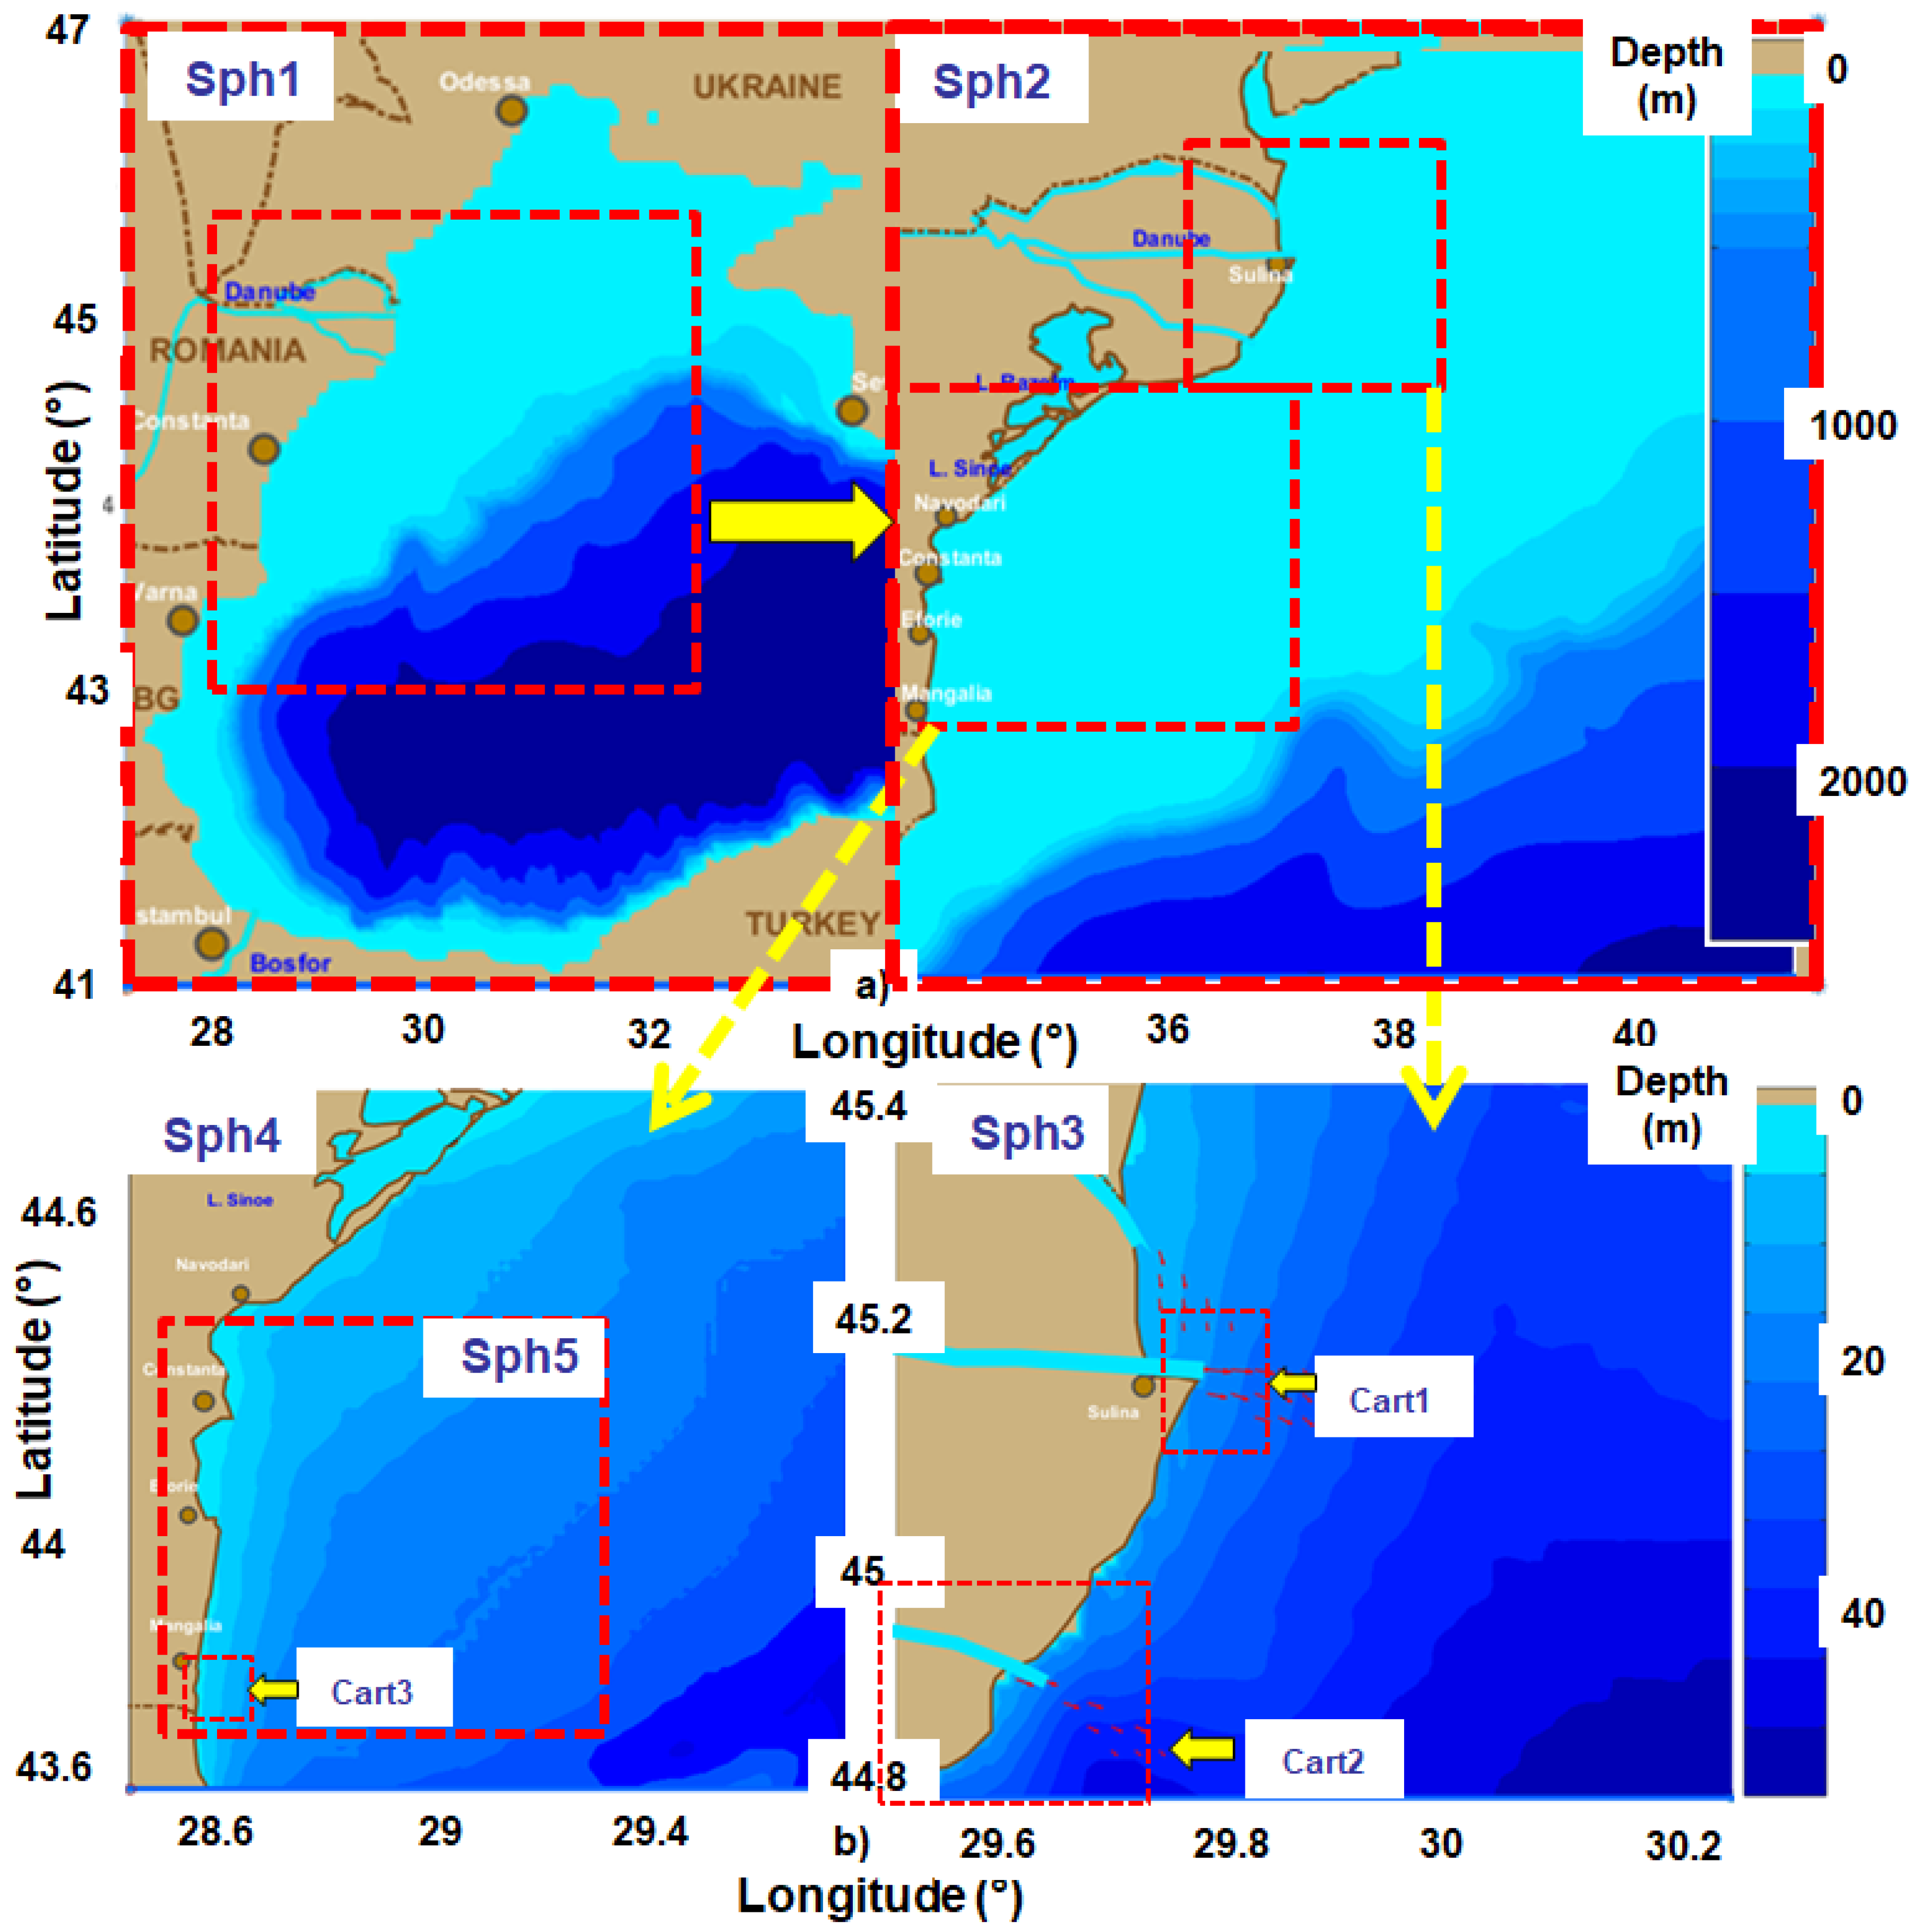
The fourth computational level (L4) is related to three Cartesian SWAN domains (Cart1, Cart2 and Cart3). The characteristics of these Cartesian areas are given in Table 2. The first two correspond to the high resolution coastal areas in front of the Sulina and Saint George arms of the Danube, while the third to the coastal environment close to Mangalia city, located in the extreme south of the Romanian nearshore.
The physical processes activated in the SWAN simulations, corresponding to the eight computational domains considered are presented in Table 3. In this table: Wave indicates the wave forcing, Tide the tide forcing, Wind the wind forcing, Curr the current field input, Gen generation by wind, Wcap the whitecapping process, Quad—the quadruplet nonlinear interactions, Triad the triad nonlinear interactions, Diff diffraction process, Bfric bottom friction, Set up wave-induced setup, and Br depth-induced wave breaking. For each computational level the most relevant processes have been considered as presented in Table 3.
The geographical spaces corresponding to these three Cartesian computational domains (Cart1–Cart3) are illustrated in Figure 2.
2.3. SWAN Model Validations and Implementation of Data Assimilation Techniques
Extensive calibrations and validations have been carried out for the wave modeling system against both ‘in situ’ and remotely sensed measurements [16,33,34,35,36]. While the validations against the satellite data considered only the significant wave height, those carried out against in situ measurements, besides this wave parameter, considered also the mean wave period and the wave direction [15,16,17,32,33,34,35]. As it is known, an increased wave period leads to higher celerity, enhancing as a consequence the wave power. From this perspective a brief discussion will be focused next on the model capability in predicting with an acceptable accuracy this important wave parameter. Since the Black Sea is an enclosed basin, the fetch is significantly smaller than in the ocean environment. This means that the value of the mean period is not so large, an average value for the western coast of the Black Sea being about 4 s. This is almost half the average value of the mean period close to the European oceanic coasts [18]. The results presented in [15,16,17,32,33,34,35], considering validations and calibration studies against data provided by two directional buoys: Gelendzhik (37.98° E, 44.51° N) and Hopa (41.38° E, 41.42° N), show that the wave modeling system implemented predict the mean wave period with a reasonable accuracy, in some statistical parameters, as for example the scatter index the results being systematically better than for the significant wave height. Furthermore, also on the west coast of the Black Sea, a comparison of the SWAN results with the data measured at the Gloria drilling platform, which operates in the western sector (44.31° N, 29.34° E) at a location where the water depth is about 50 m shows also a relatively good accuracy of the model predictions in terms of mean wave periods.
Furthermore, for increasing the accuracy and reliability of the wave predictions, techniques for assimilating the satellite data have been designed and implemented for the first two computational levels corresponding to the SWAN domains Sph1 and Sph2 [42,43,44]. These assimilation techniques are based on the optimal interpolation method [45]. The main idea behind these assimilation techniques is to combine the information coming from measurements with the results of the numerical models into an optimal estimation of the field of interest. For these two computational domains, the assimilation of the wave data has been performed in terms of the significant wave height (Hs).
It has to be highlighted that the satellite observations provided by the multimission system were considered for data assimilation. These comprise measurements from seven satellites. Thus, the data coming from the satellites: ERS-2 (European Remote Sensing), Poseidon, JASON-1, JASON-2 and GEOSAT (GEOdetic SATellite) Follow-On (GFO) were considered in the assimilation process, while the data from ENVISAT (Environmental Satellite) and TOPEX (TOPography Experiment) were used for validations.
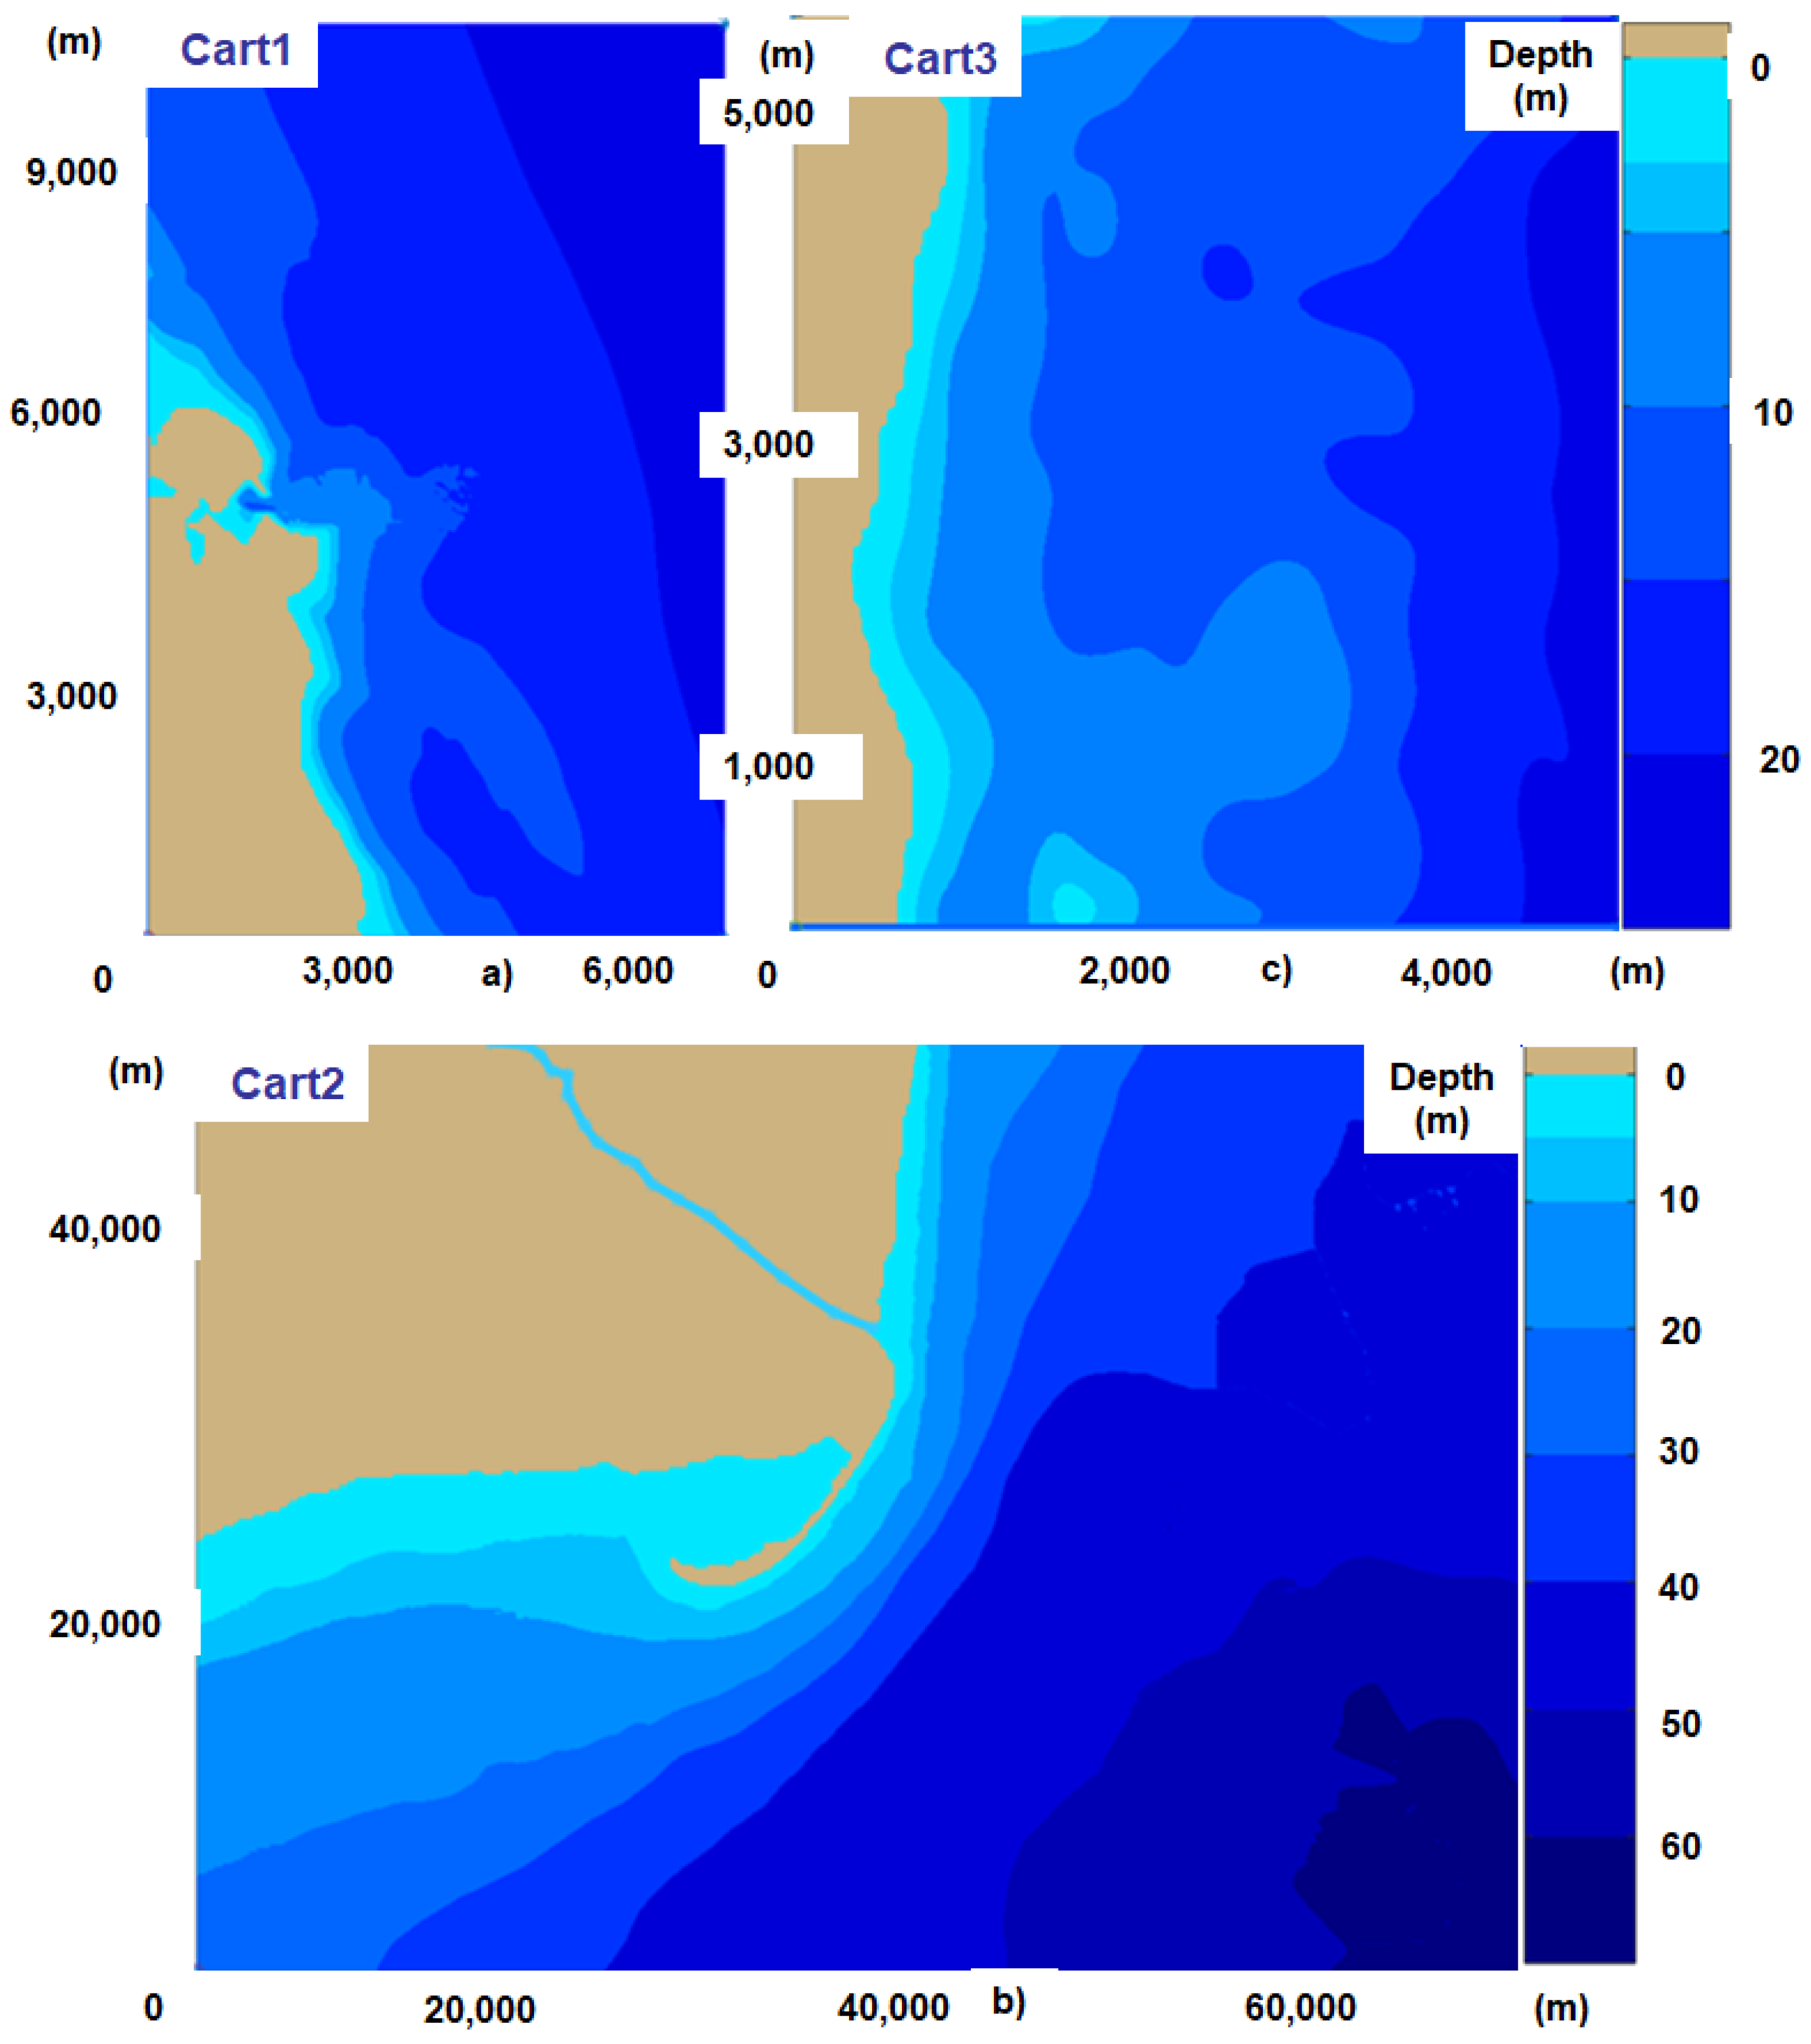
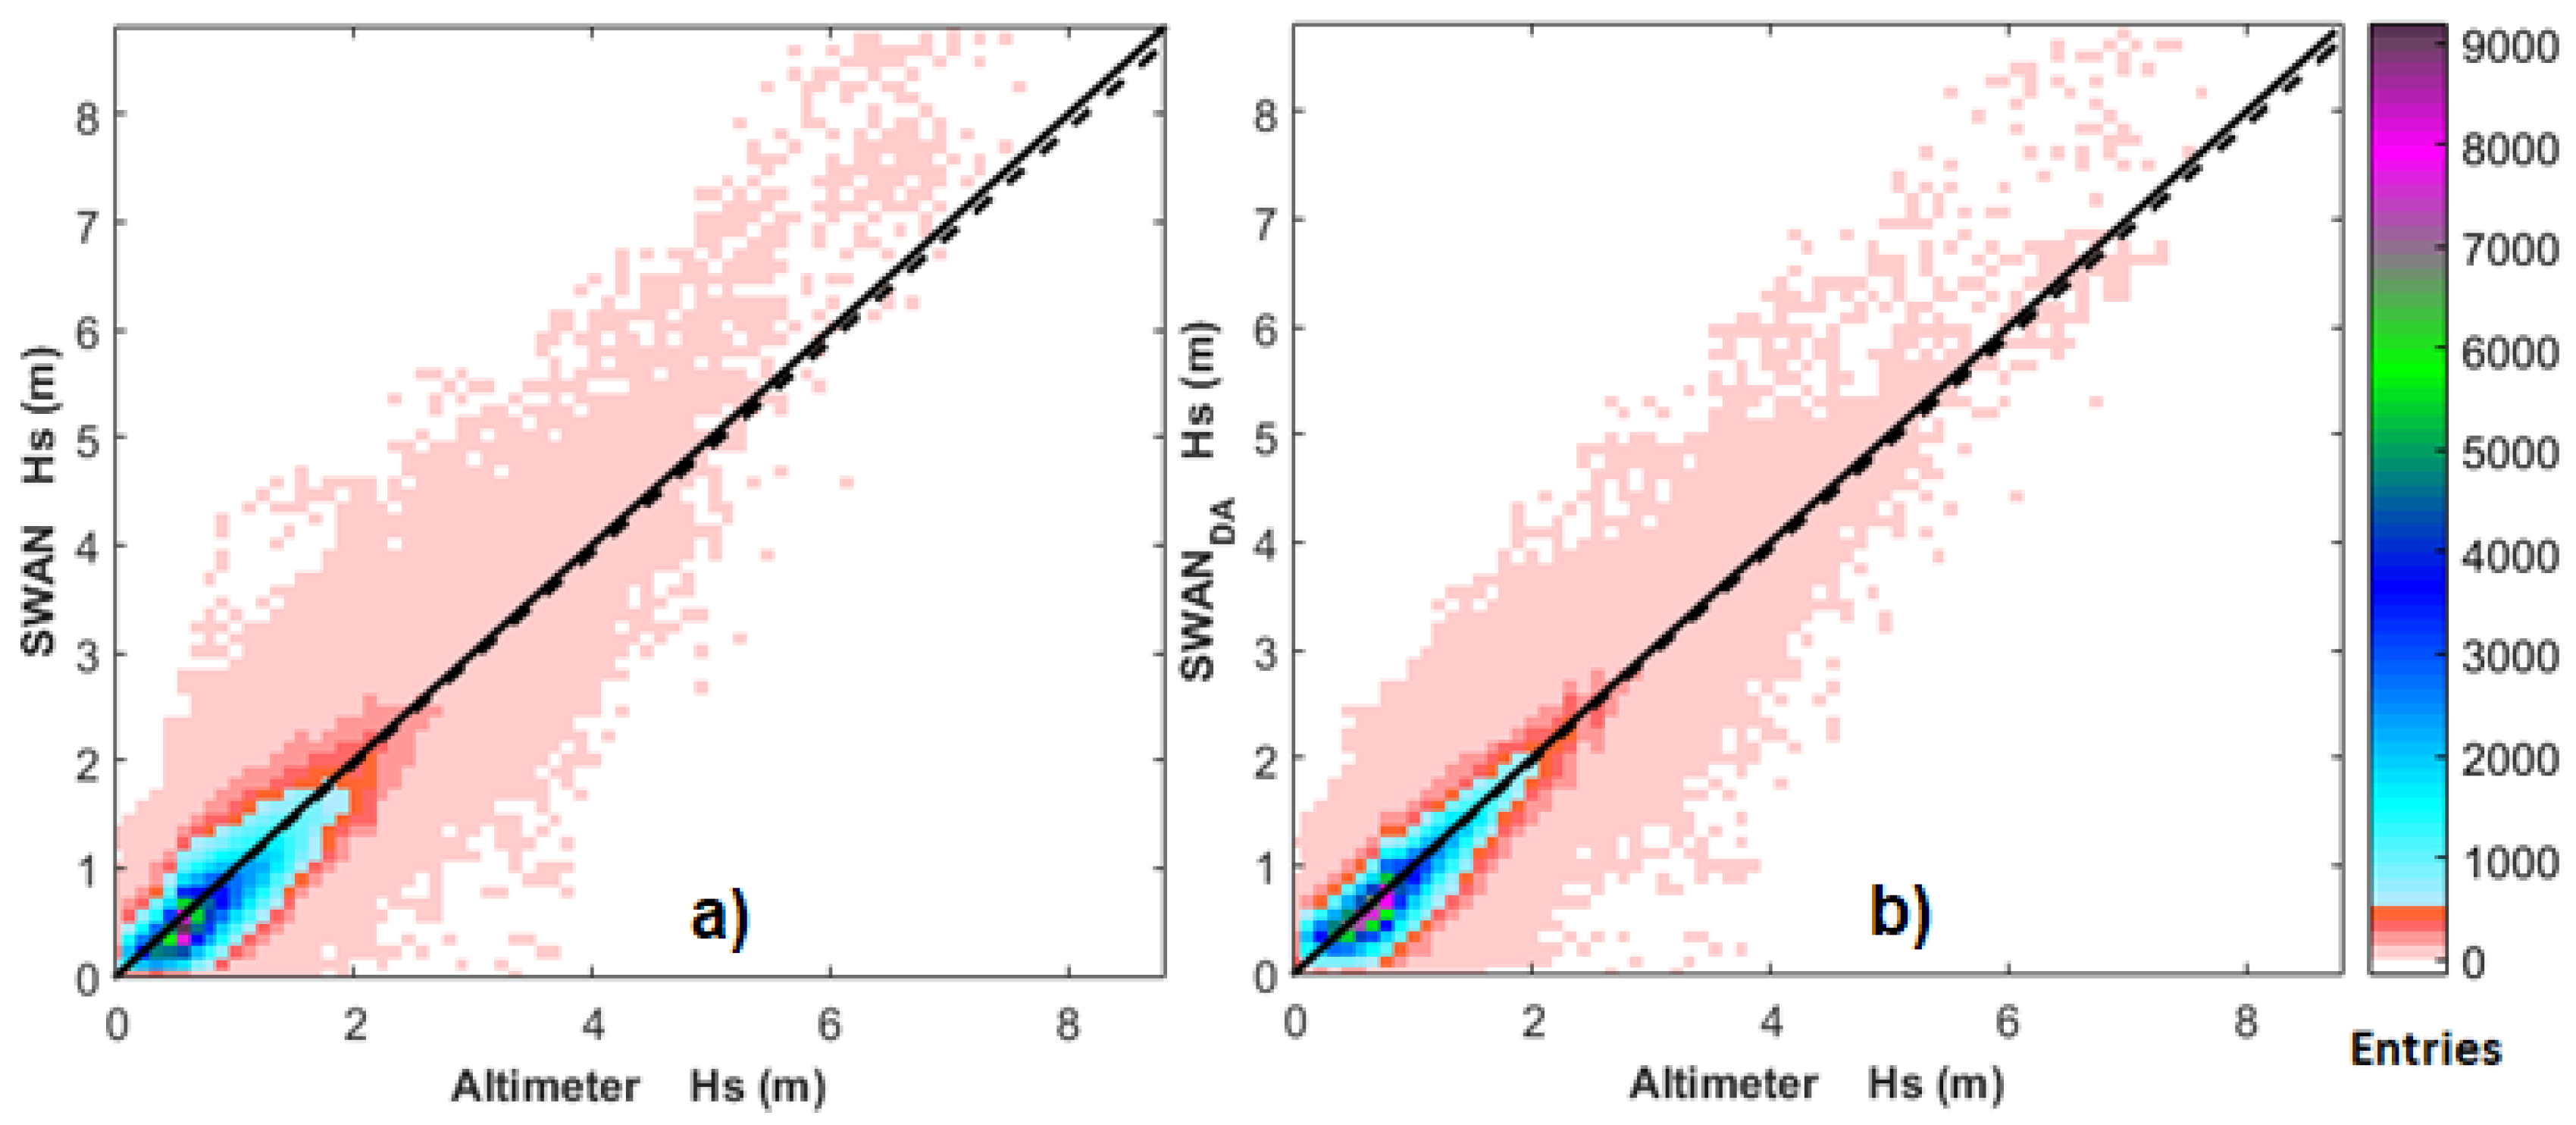
From this perspective, Table 4 presents the statistical results obtained for the Hs values simulated with SWAN and the Hs values obtained after the application of the data assimilation method, against the altimeter measurements used for validation across the Black Sea. The results correspond to the 15-year time interval 1999–2013. The parameters presented in Table 4 are: mean measured and simulated values of the significant wave height, bias, mean absolute error, RMS (root mean square) error, scatter index (SI), correlation coefficient (R), and the regression slope (S), all of them being computed according to their standard definitions. In Table 4, N represents the number of data points considered in the statistical analysis. As it is known the bias, mean absolute error, RMS error and scatter index are better when the values are smaller, while the correlation coefficient and the regression slope are better when they are closer to the unity. From this perspective, it can be seen from Table 4 that the results with data assimilation appeared improved for all parameters. Figure 3 illustrates the corresponding scatter diagrams (the 15-year time interval 1999–2013) for the significant wave height. On the left side of this figure, the results of the SWAN model without data assimilation are presented while on the right side the results after performing the assimilation of the satellite data are given. The results presented in Figure 3 also indicate a clear improvement in the case when the data assimilation technique is used. Detailed information concerning the techniques considered for assimilating satellite data in the Black Sea wave modeling is given in [17,42,43,44].
Finally, as previously mentioned, an alternative multi parameter assimilation scheme was also designed, especially for the computational domain Sph4, considering in the assimilation process the in situ measurements carried out at the Gloria drilling unit [40,41]. In this case three different wave parameters have been assimilated. These are significant wave height, mean period and mean wave direction. This approach is based on the successive correction method (SCM) and its main advantage consists in the fact that the corrections are not limited to the significant wave height but operate on other two important wave parameters, which are wave direction and period. As shown in [40,41] this assimilation method improves the reliability of the wave predictions. On the other hand, the main inconvenience in relationship with the assimilation of the satellite data consists in the fact that it is directly related to a permanent source for in situ measurements. That is why from the computational domains considered in the present work, the above assimilation approach is effective only for Sph4 and the subsequent domains Sph5 and Cart3.
3. Results and Discussion
Model system simulations have been performed for the entire year 2017. The emphasis was given to the analysis of the high, but not extreme, wintertime conditions, where wintertime was considered the six-month period from January to March and from October to December. The wind fields considered are those provided by the US National Centres for Environmental Prediction (NCEP). The spatial resolution of the wind data is 0.325 degrees in both latitude and longitude while the temporal resolution is 3 h.
Some of the most relevant results of the simulations performed with the SWAN model for the year 2017 are analyzed and discussed next. These consider the eight computational domains (corresponding to four different levels) defined before. Also, for each domain the physical parameterizations presented in Table 4 have been activated in the model setting. The discussion focuses on the high wave energy conditions.
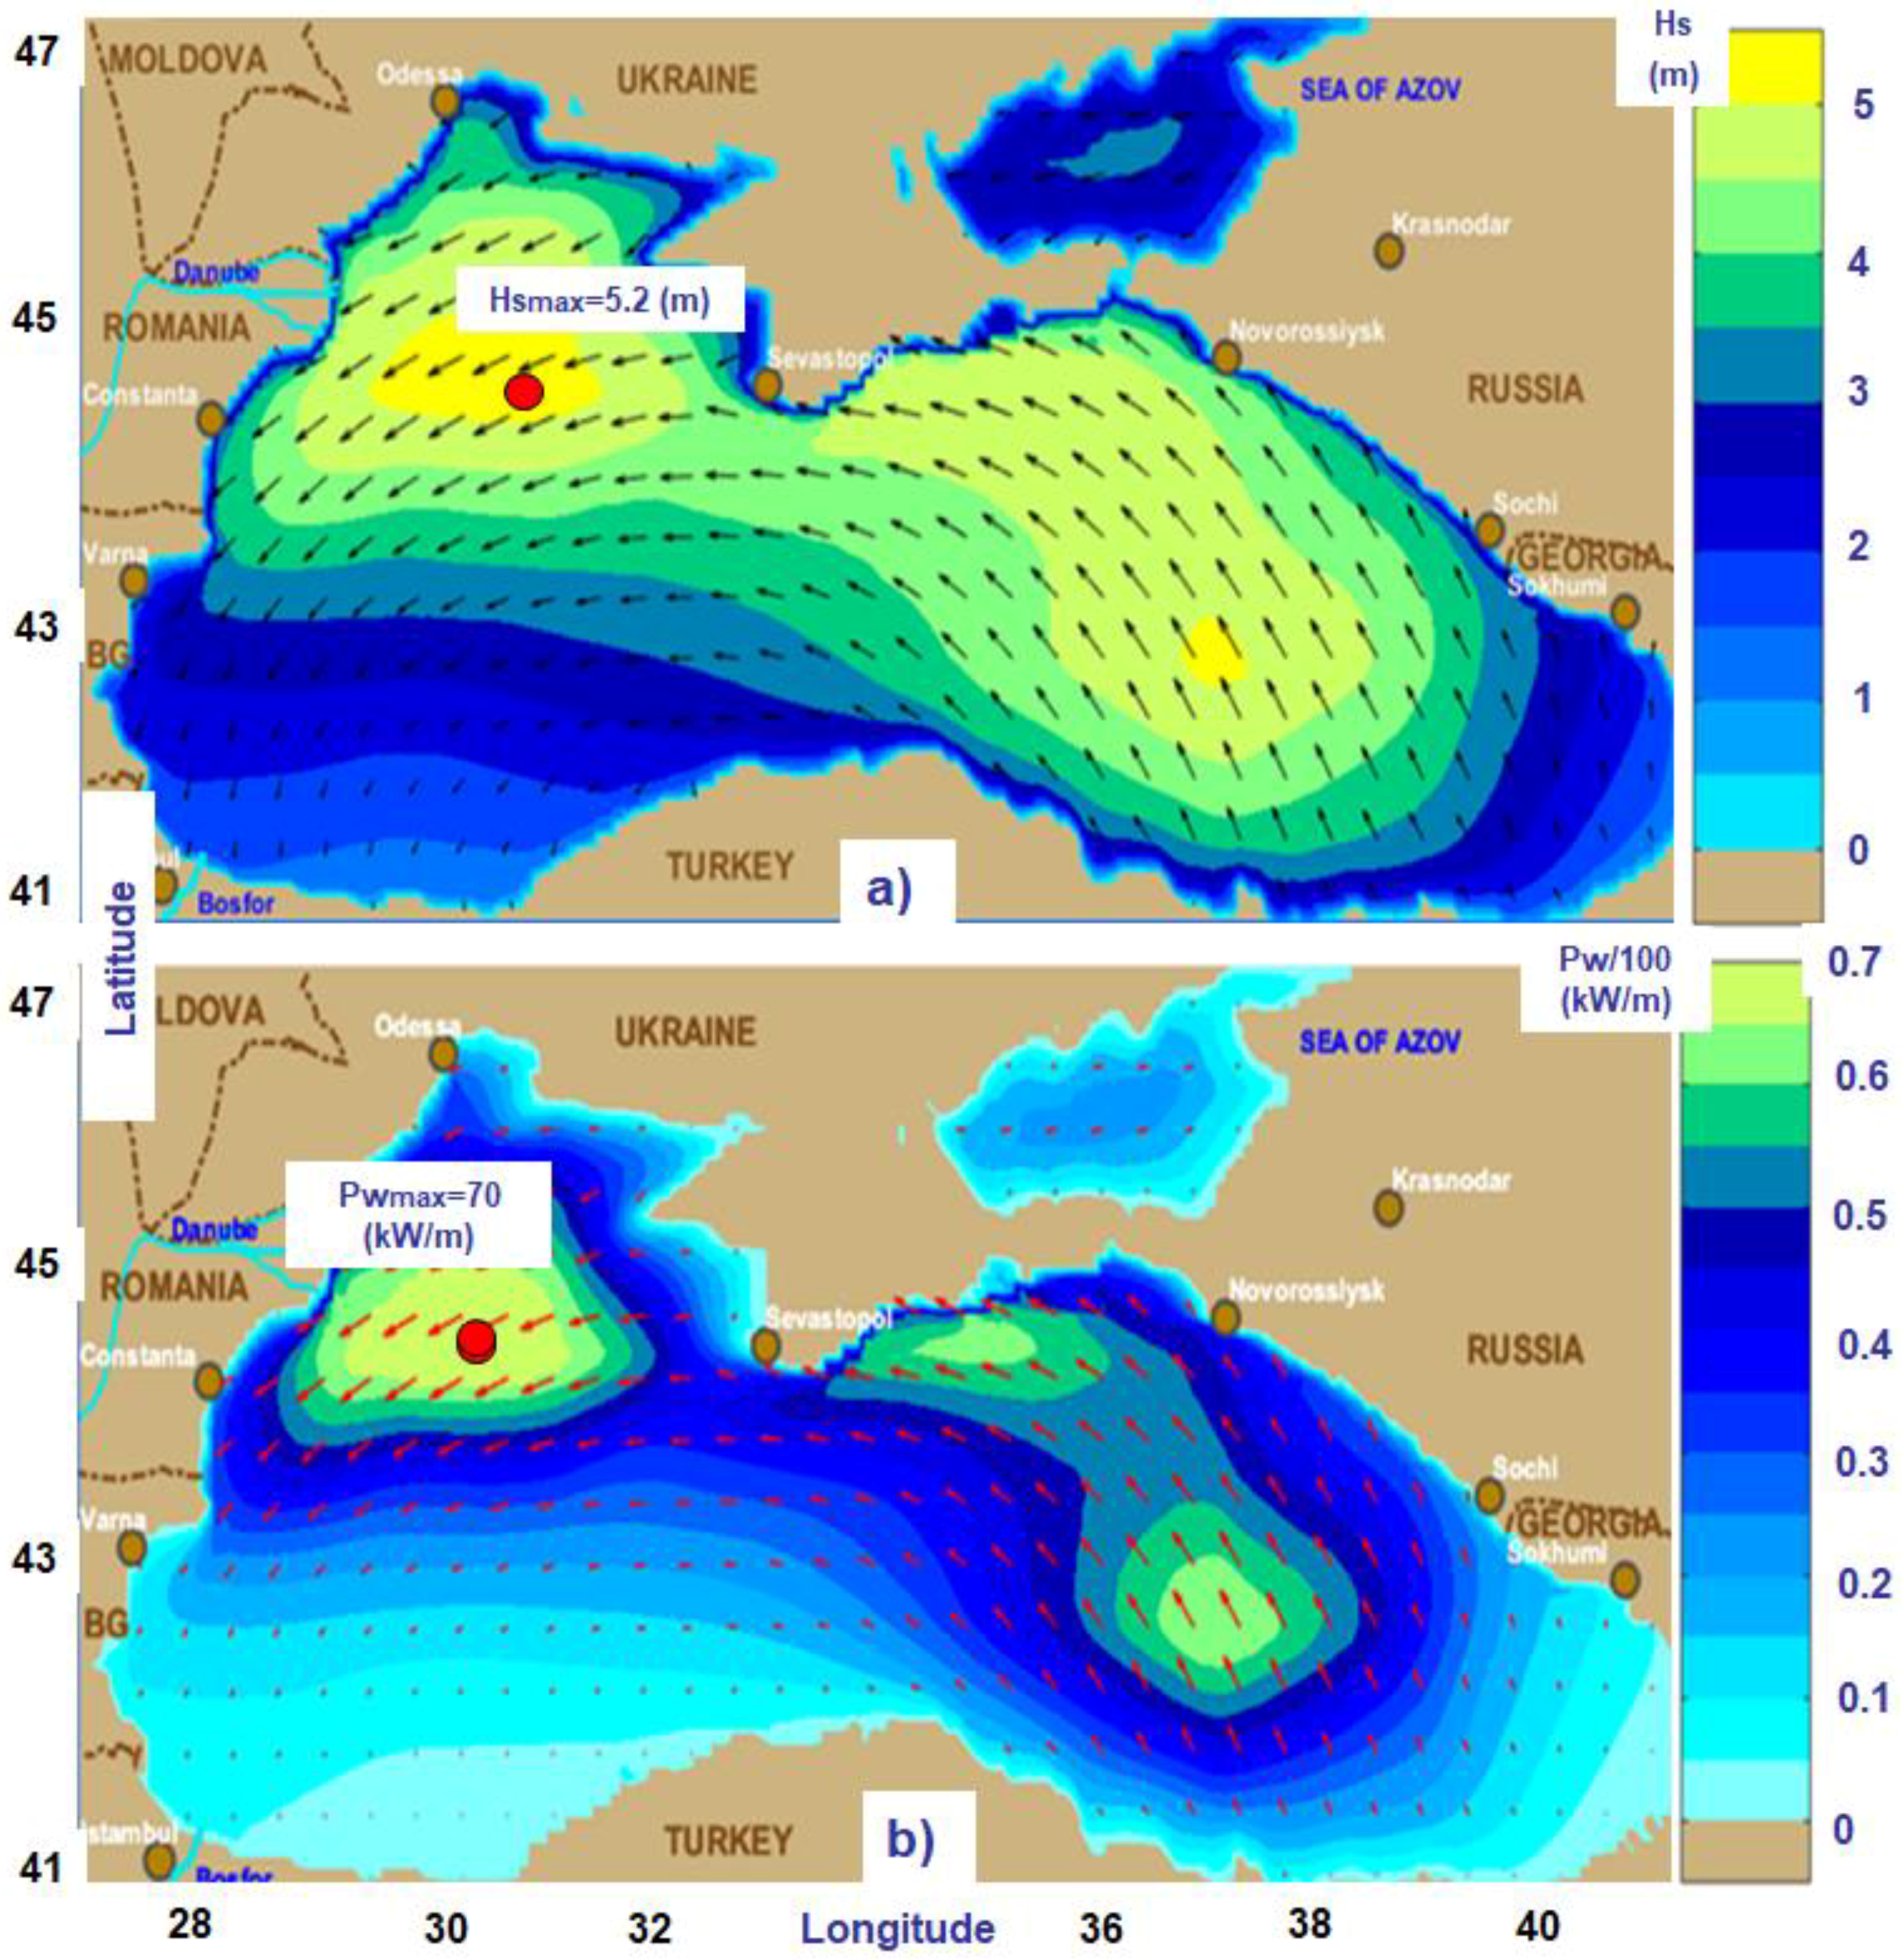
From this perspective, Figure 4 illustrates high wave conditions in the entire basin of the Black Sea (computational domain Sph1). These model results correspond to the time frame 8 January 2017. Figure 4a presents the significant wave height scalar fields (Hs) and the wave vectors and Figure 4b the wave power scalar fields (Pw) and the energy transport vectors. The maximum values of the significant wave height and wave power are also indicated, they are: Hsmax = 5.2 m and Pwmax = 70 kW/m. These correspond to two different locations offshore the Danube Delta, which are very close. At this point, it has to be highlighted that the case study presented in Figure 4 corresponds to one of the most common patterns concerning the spatial distribution of the wave energy in the basin of the Black Sea. According to this pattern, the tendency of the wave energy is to concentrate in the western part of the basin in the Black Sea. This is also related to the characteristics of the atmospheric circulation, according to which the strongest winds blowing over the Black Sea are usually from the northeast.
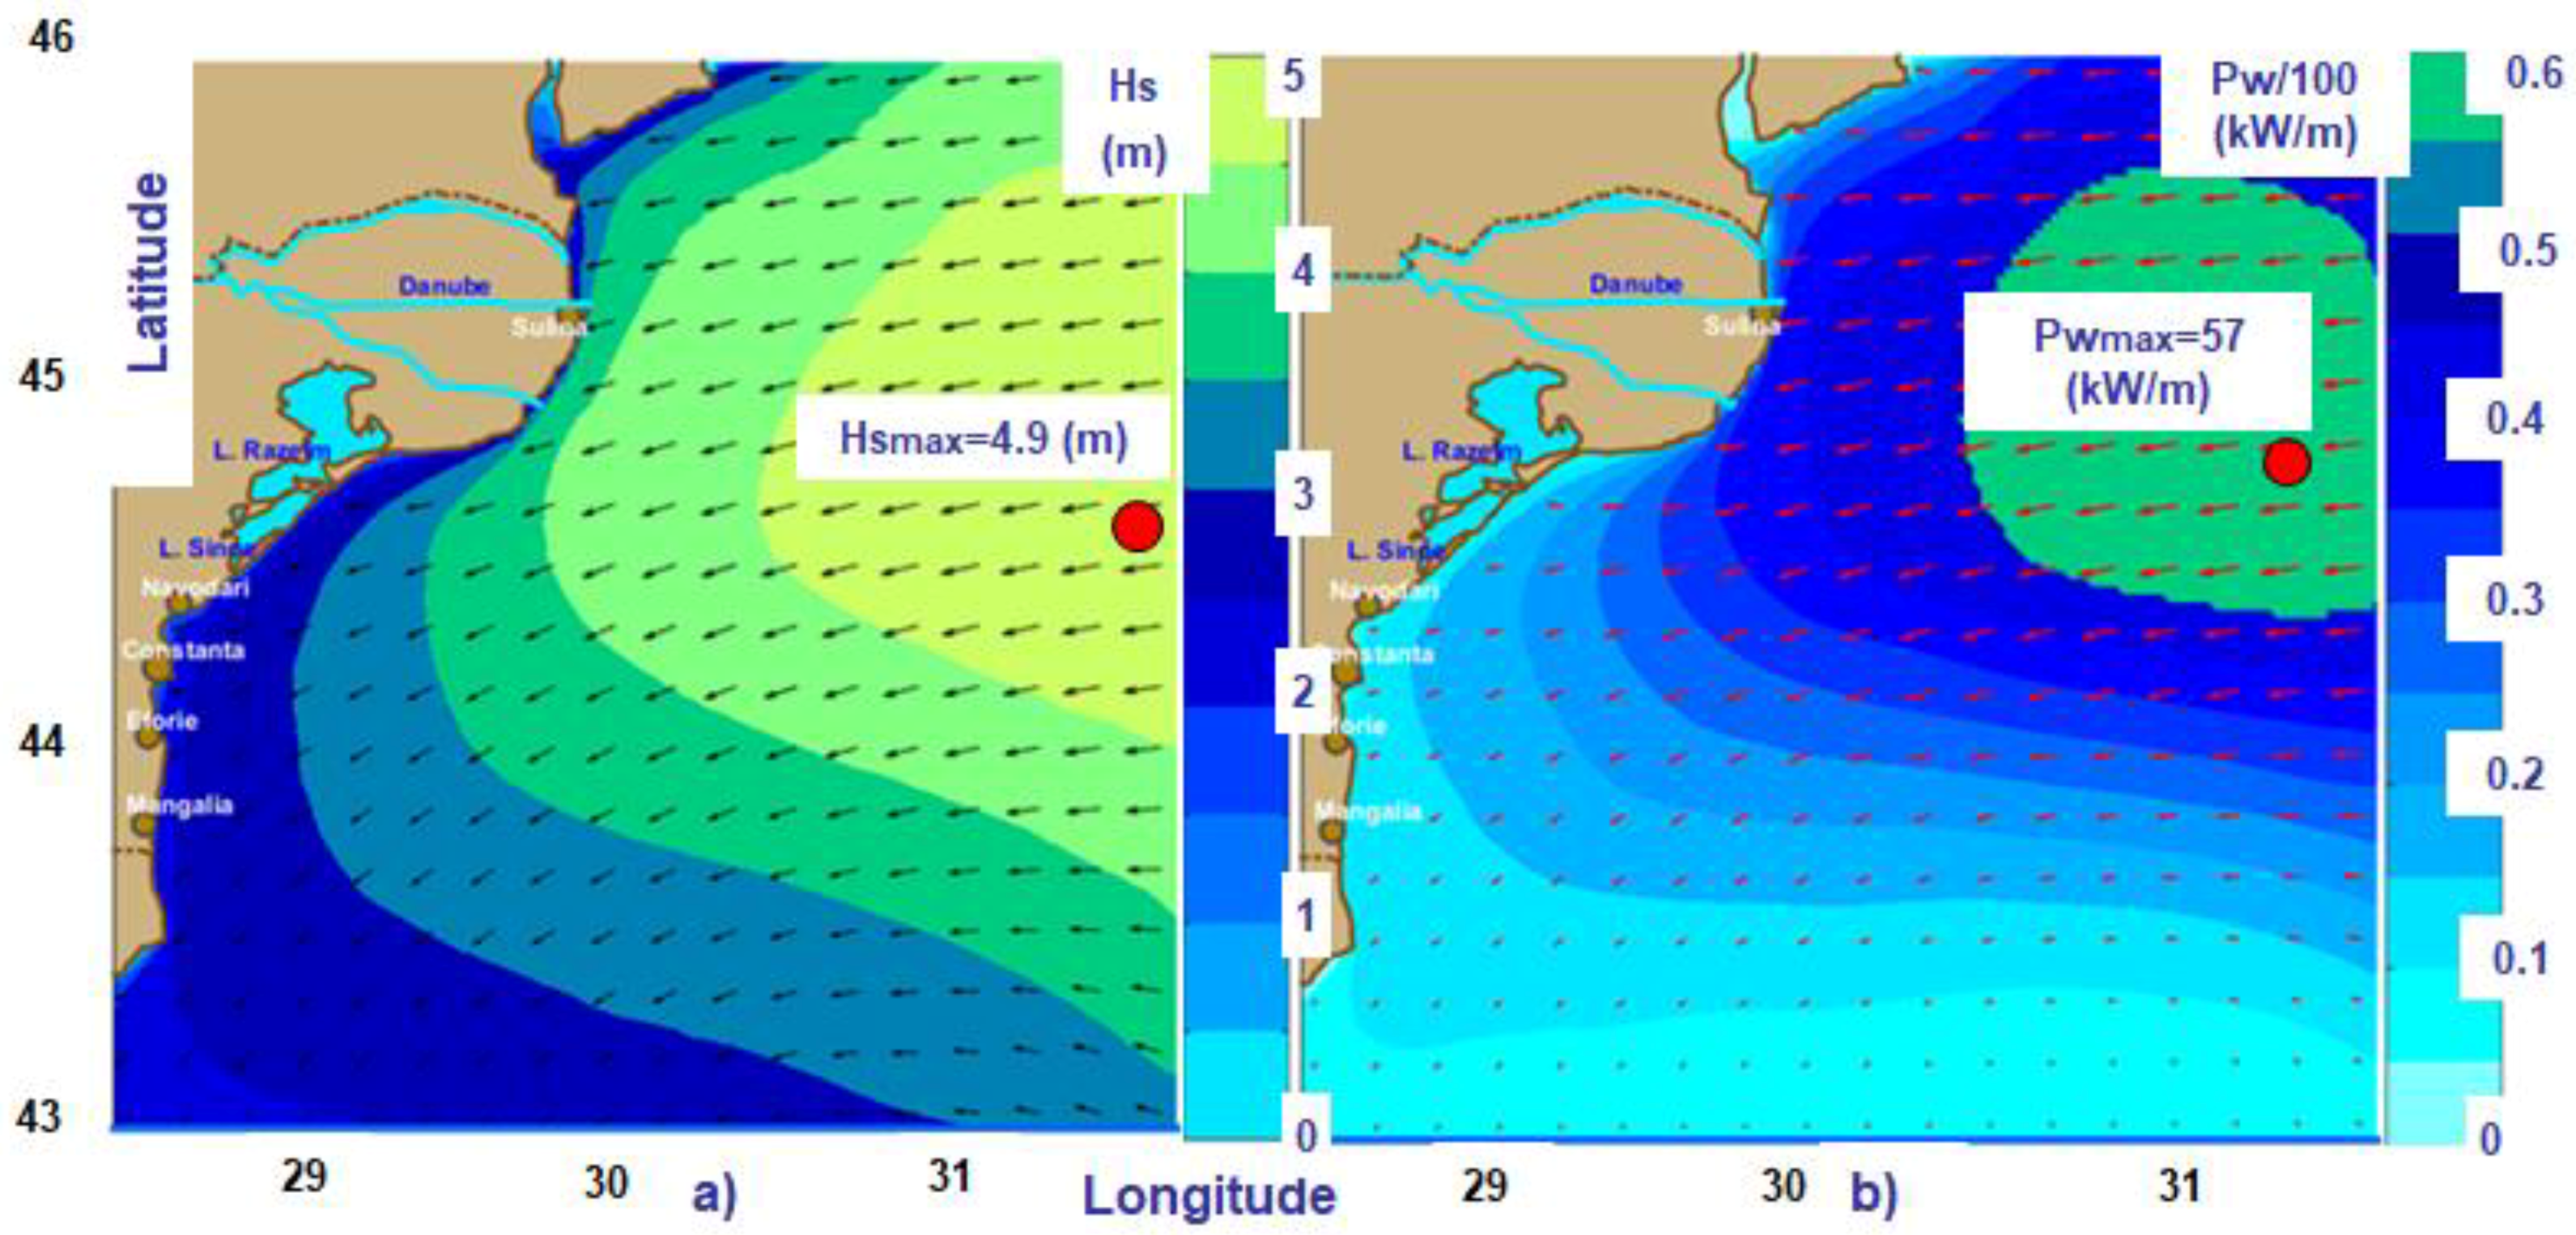
Going to the second level (corresponding to the spherical computational domain Sph2), Figure 5 presents high, but not extreme, wave conditions in the western Black Sea. The model results correspond in this case to the time frame 4 February 2017. Figure 5a illustrates the significant wave height scalar fields and wave vectors while Figure 5b the wave power scalar fields and energy transport vectors. The maximum values of the significant wave height and wave power are Hsmax = 4.9 m and Pwmax = 57 kW/m. As shown in the figure, these maximums are located in two different points, both close the eastern boundary approximately in the center of the computational domain.
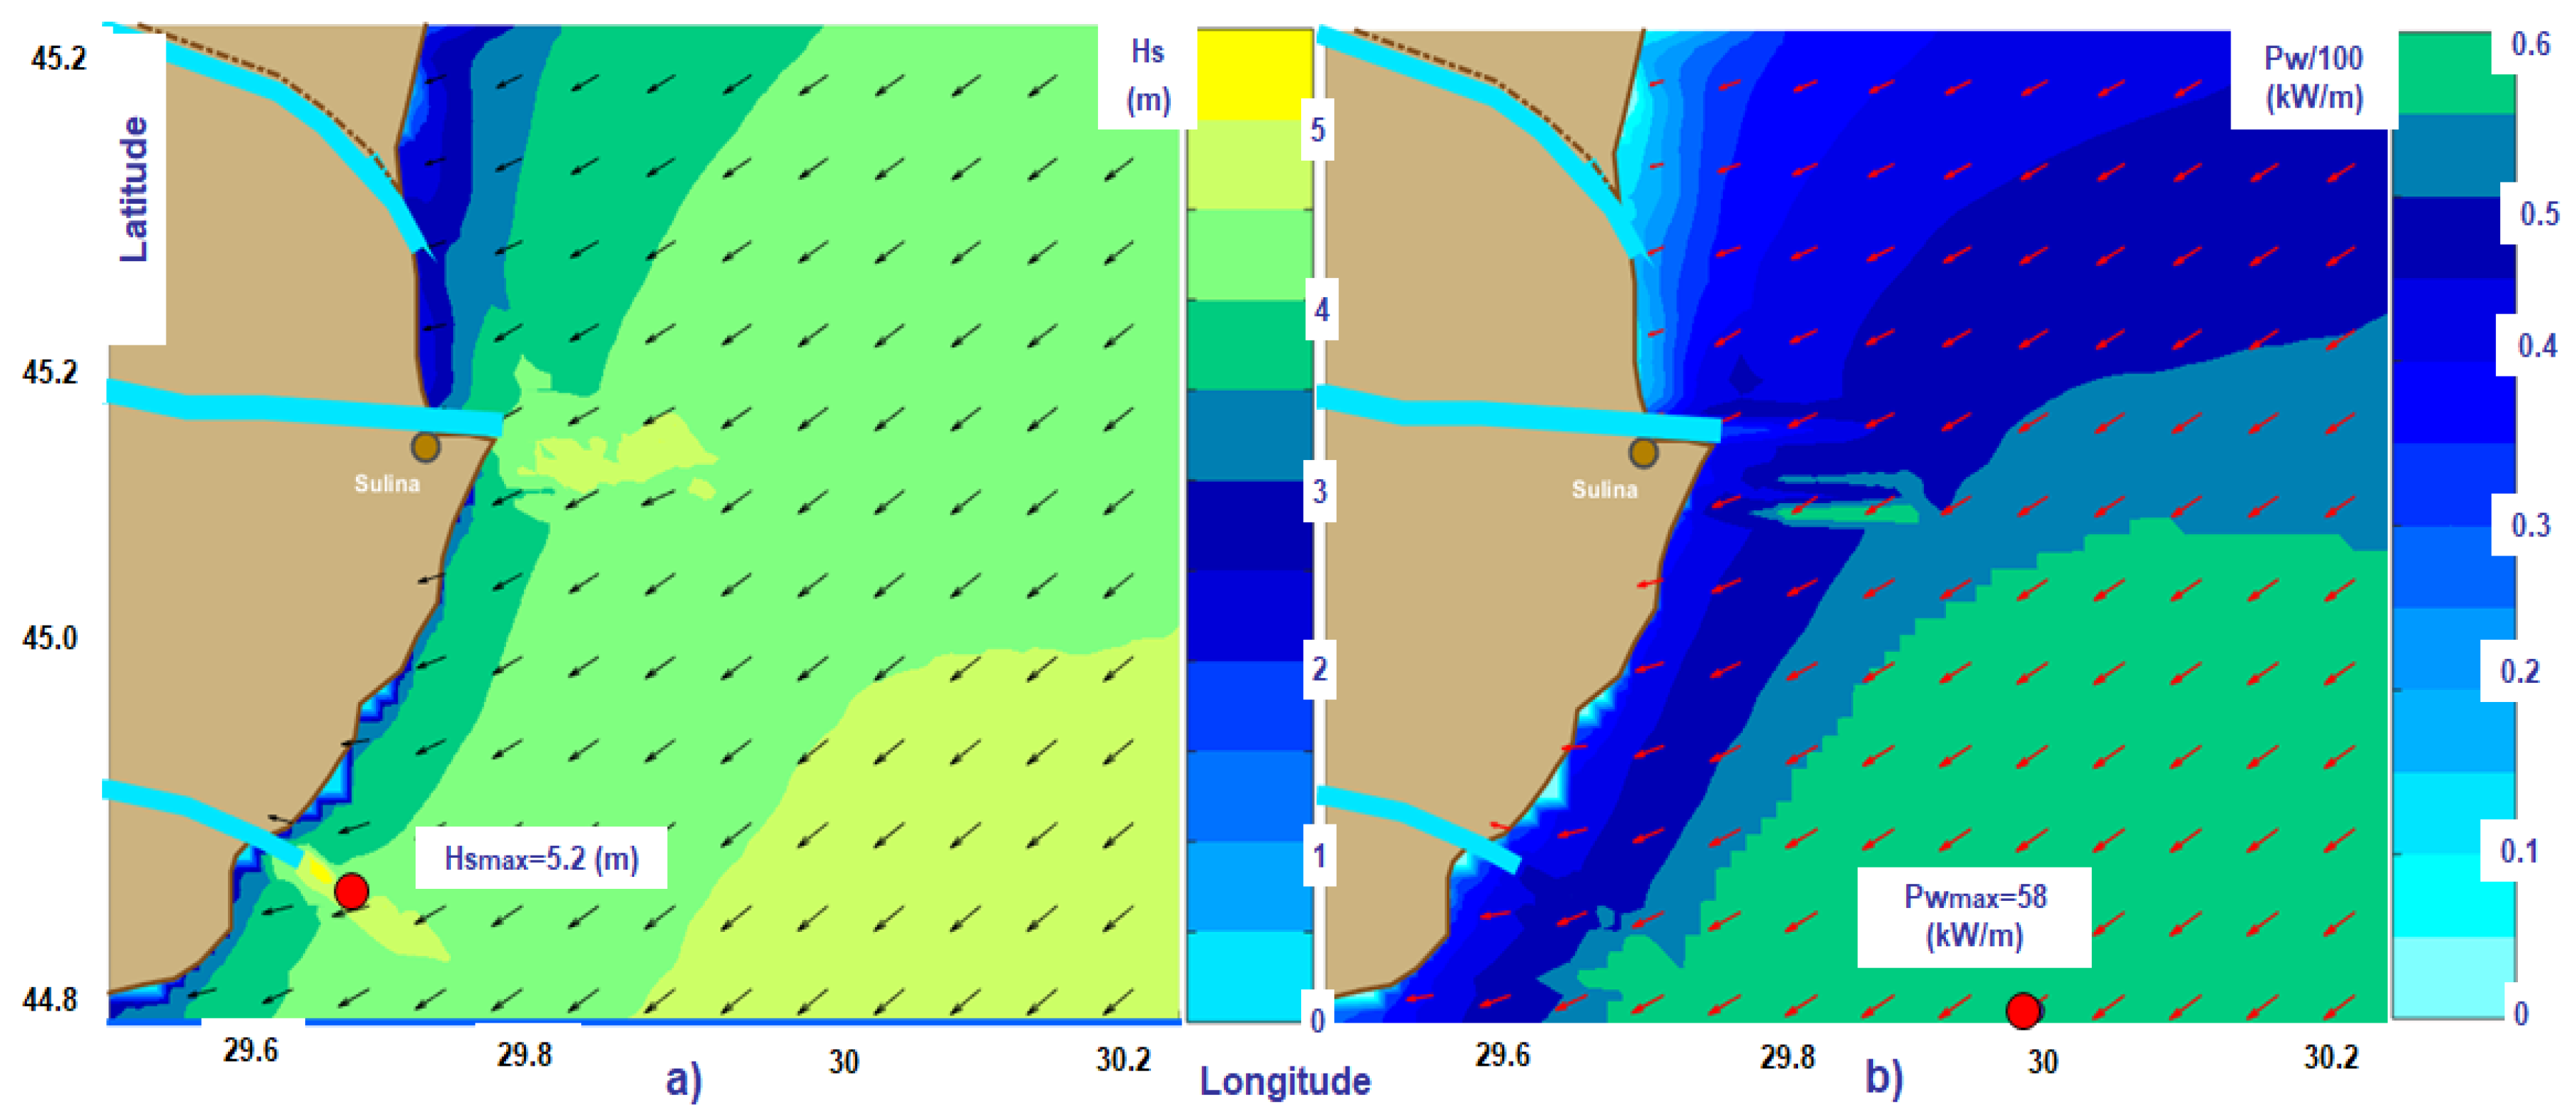
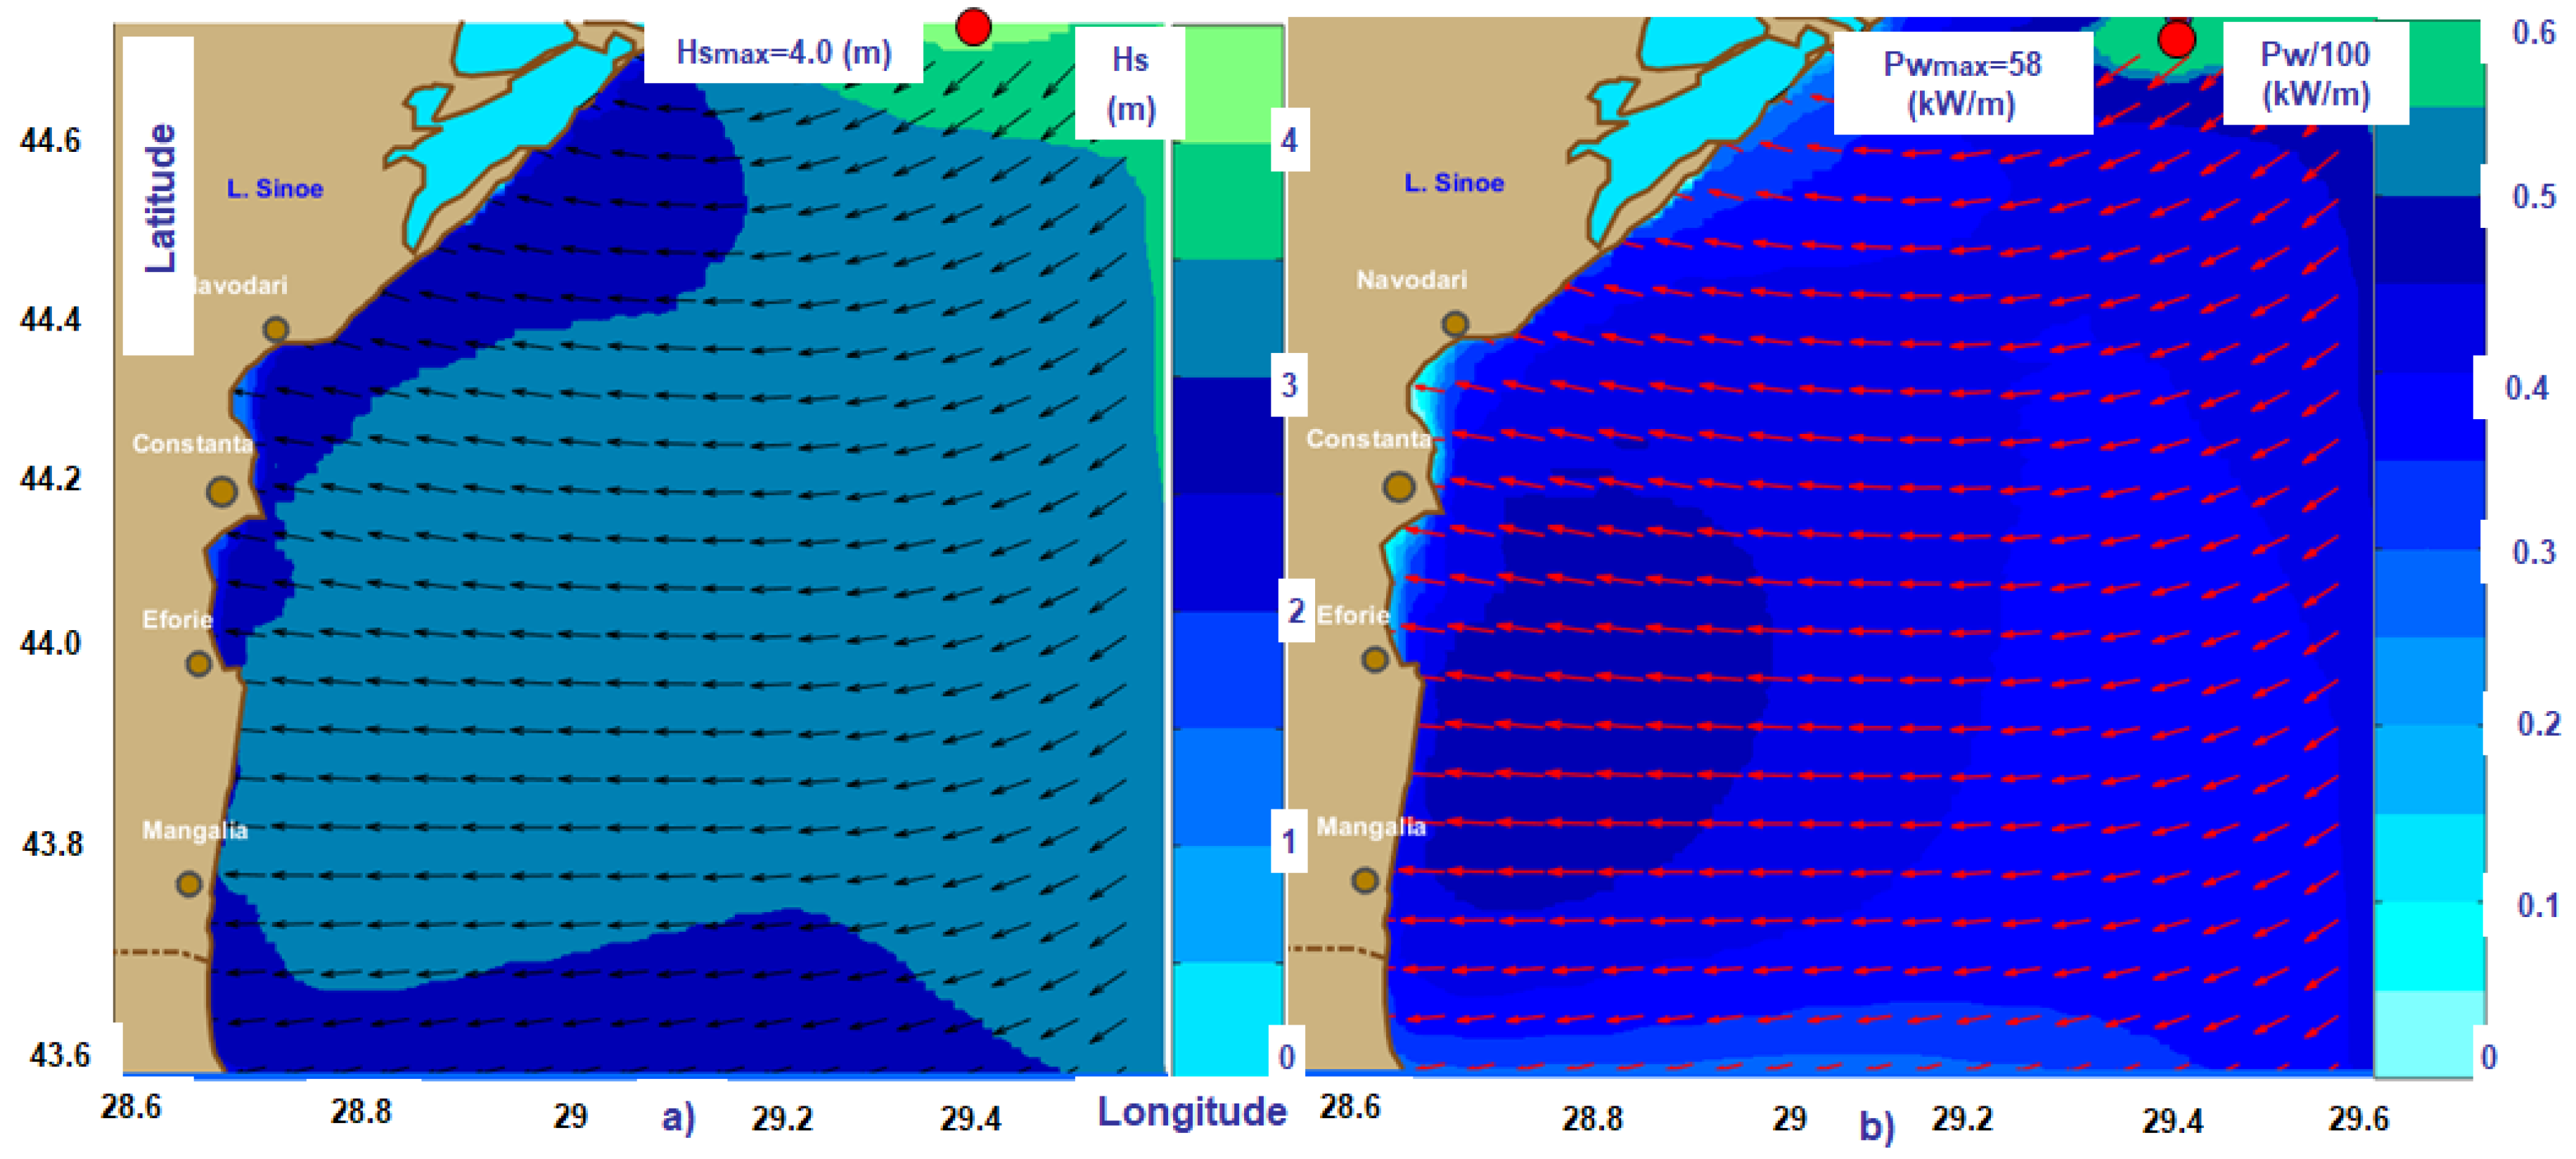
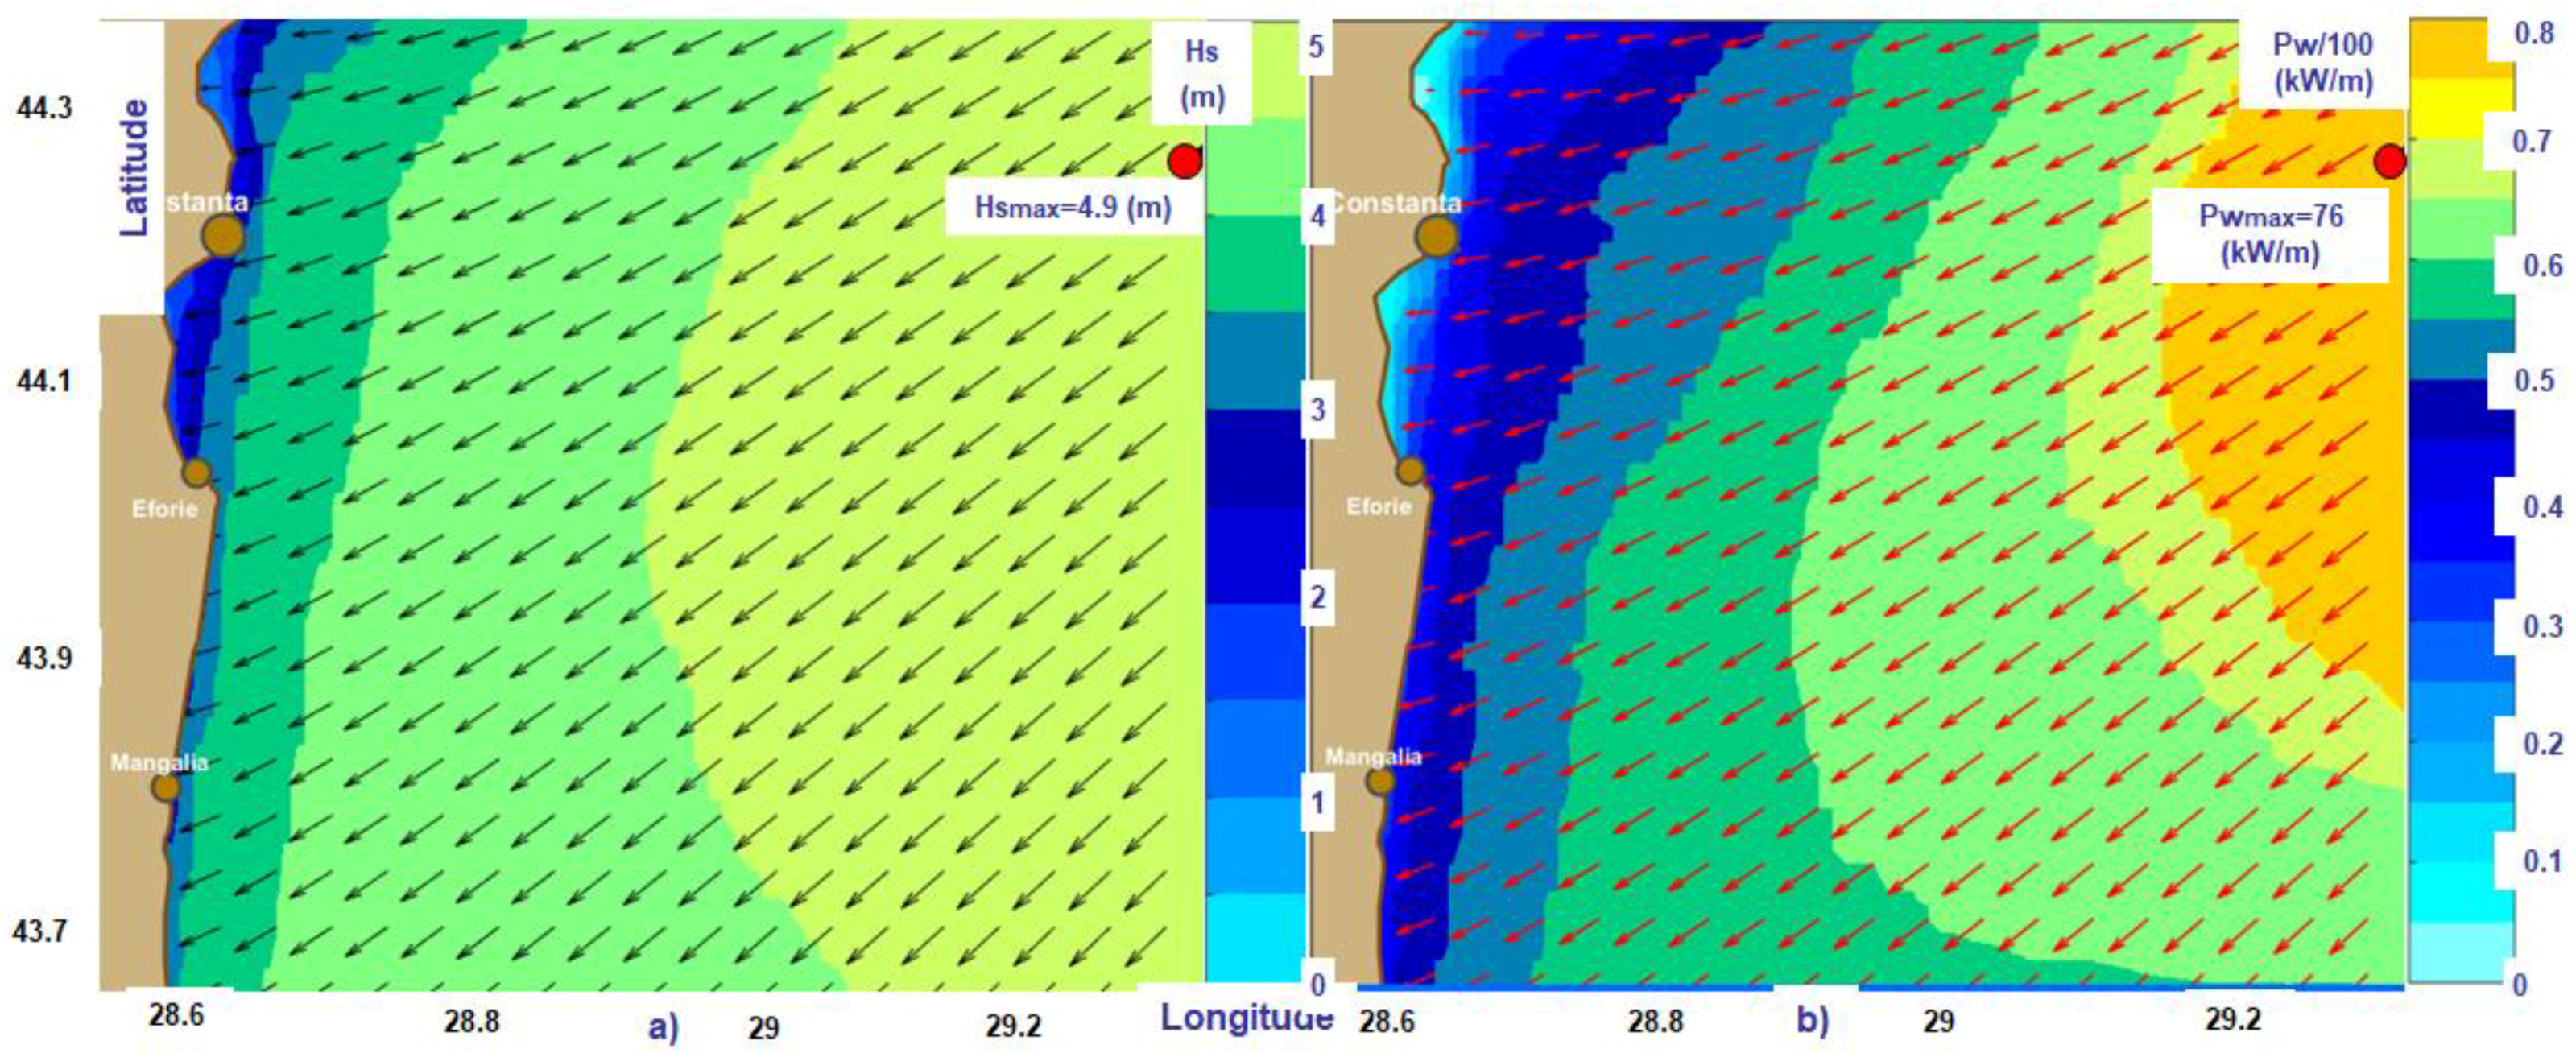
Regarding now level 3, Figure 6 presents high wave conditions at the mouths of the Danube River (computational domain Sph3). The model results correspond to the time frame 22 March 2017. Figure 6a illustrates the significant wave height scalar fields and wave vectors while Figure 6b the wave power scalar fields and energy transport vectors. The maximum values of the significant wave height and wave power are Hsmax = 5.2 m and Pwmax = 58 kW/m. Although they are both located in the southern side of the domain, their positions are different this time. Thus, the significant wave height has the highest value at the mouth of the Saint George arm while the point with the maximum wave power is located about 0.35 degrees offshore, close to the southern boundary of the SWAN domain. The next two areas defined for this level (L3) are illustrated in Figure 7 and Figure 8 and they correspond to the computational domains Sph4—Southern RO1 and Sph5—Southern RO2, respectively. Thus, Figure 7 presents the model results for the time frame 7 October 2017 and Figure 8 those for the time frame 25 October 2017. The maximum values of the significant wave height and wave power are Hsmax = 4.0 m and Pwmax = 58 kW/m, for the case presented in Figure 7 and Hsmax = 4.9 m and Pwmax = 76 kW/m, for the case presented in Figure 8. In both cases the significant wave height and wave power have the maximum values in the same point, which is located in the northeastern side of the SWAN computational domain.
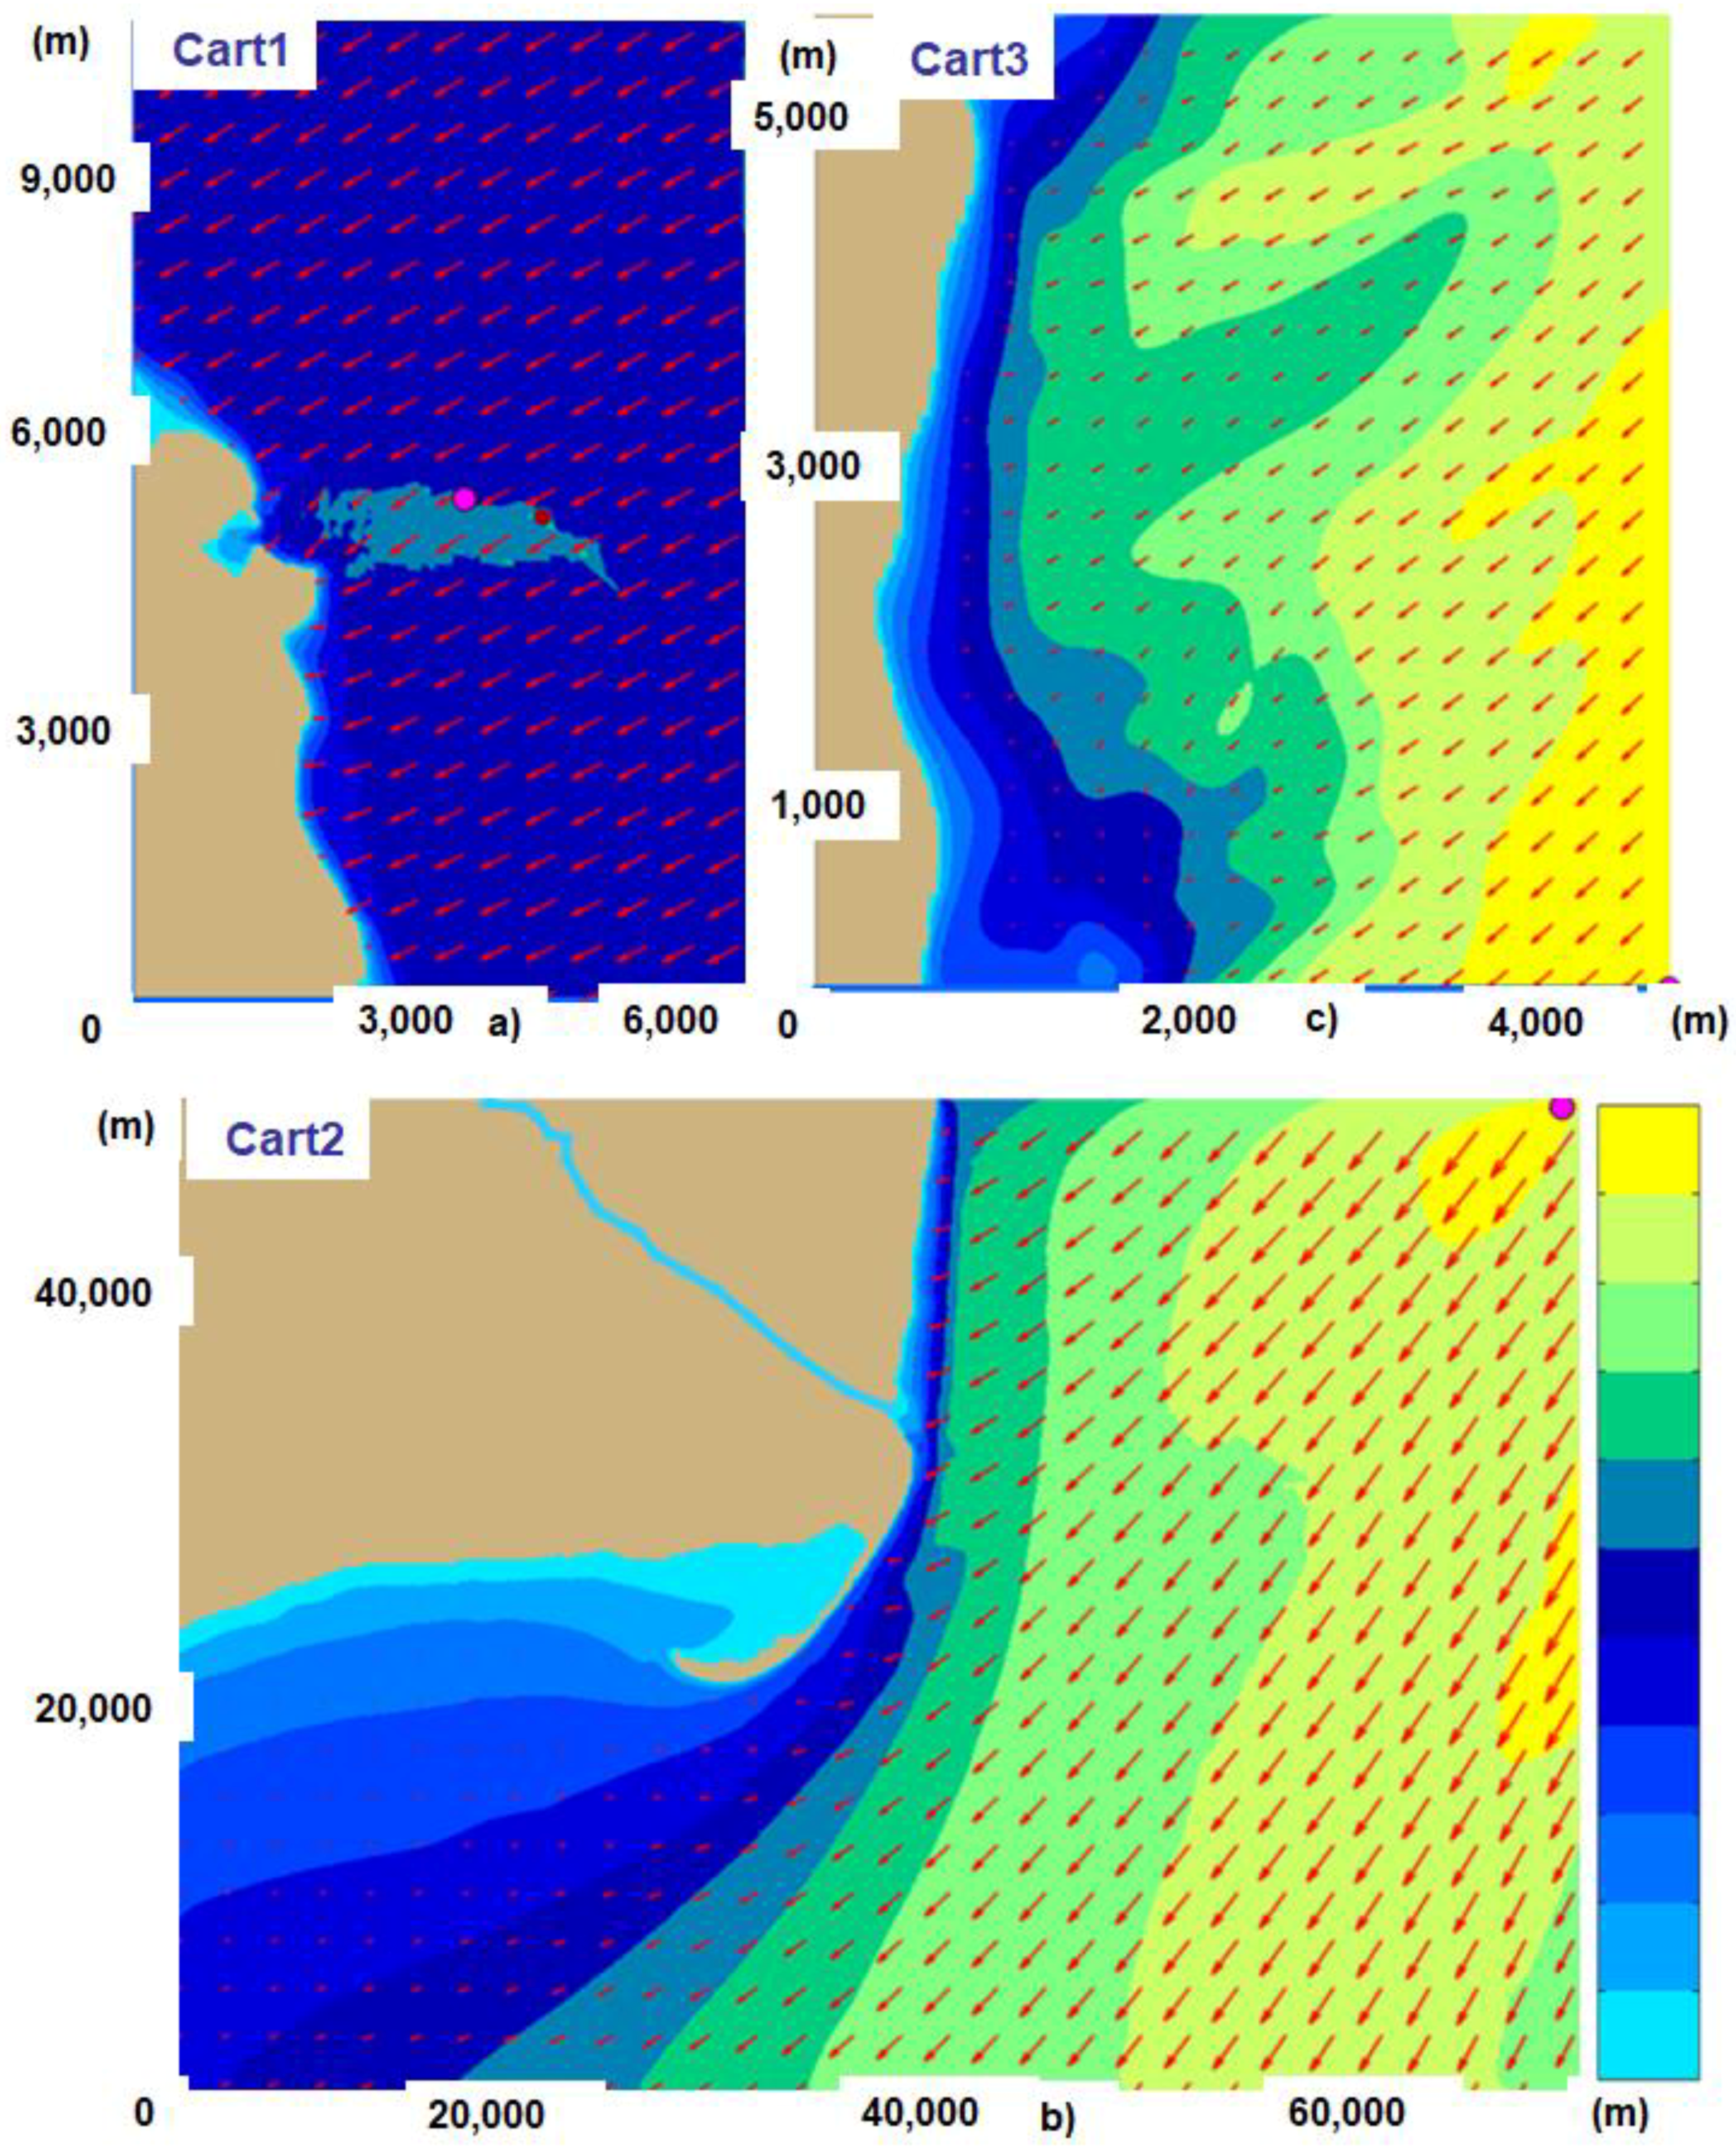
Finally, Figure 9 presents the wave power scalar fields and energy transport vectors in the high resolution Cartesian domains (Cart1–Cart3). Thus, Figure 9a presents an average to high wave energy situation in the computational domain Cart1 corresponding to the time frame 8 November 2017. The maximum values of the significant wave height and wave power are Hsmax = 4.3 m and Pwmax = 54 kW/m. The points of maximum are located both in front of the Sulina bar, but that corresponding to the maximum wave power is closer to the nearshore. An important characteristic of the SWAN model simulations in this computational domain is related to the higher values of the Benjamin-Feir Index (BFI). BFI, or the steepness-over-randomness ratio, has been introduced formally by Jansen [43] and is defined as:
where St represents the integral wave steepness and is computed as the ration between the significant wave height and the wavelength and Qp represents the peakedness of the wave spectrum and it is defined as:
This parameter is related to the occurrences of the high waves (the risks for the rogue waves apparition). Hence, BFI is a spectral shape parameter that can be related to the kurtosis of the wave height distribution. In particular, for Gaussian-shaped spectra in the narrow band approximation Jansen [46] showed that the kurtosis depends on the square of BFI. Furthermore, various experimental results show that for BFI = 0.2 the maximum wave heights are very well-described by the Rayleigh distribution while for values of BFI greater than 0.9 the ratio Hmax/Hs is substantially underestimated. From this perspective, [36] showed that the highest BFI values occur in this area between the two points of maximum wave power and significant wave height, respectively, indicated in Figure 9a for significant wave heights of about 3 m and wave directions of 90 degrees (BFI = 1.87). This indicates a very high probability of the rogue wave occurrence with very high wave energy. The importance of mentioning the rogue waves in this context is that besides the very high wave power, which they possess, they are also very dangerous for the human activities. These include the operational activities related to the maintenance of the devices, but also devices themselves might be put in danger by such very high and unexpected waves.
Figure 9b illustrates a high wave energy situation in the computational domain Cart2 corresponding to the time frame 8 November 2017. The maximum values of the significant wave height and wave power are Hsmax = 5.1 m and Pwmax = 78 kW/m. The points of maximum are located both on the northern boundary, but in different places. Finally, Figure 9c illustrates also a high wave energy situation in the computational domain Cart3 (the coastal environment close to the Romanian city Mangalia) corresponding to the time frame 18 December 2017. The maximum values of the significant wave height and wave power are in this case Hsmax = 5.3 m and Pwmax = 71 kW/m. These maximums correspond both to the same point, located in the southern right corner of the computational domain.
Some observations can be made at the end of this section. First of all, as already mentioned, the cases presented are related to high winter time wave conditions. They were selected as representative, but at the same time, although cannot be considered very usual, they do not represent unusual situations since such wave energy conditions are encountered with a certain frequency in the winter period. Another observation is related to the fact that usually the maximum values of the significant wave height and of the wave power do not occur exactly in the same point, but they are very often in closer positions from a geographical perspective. Finally, although there is a direct relationship between the wave power and the significant wave height, a certain significant wave height does not automatically indicates the value of the wave power. Thus, according to the results presented in Figure 4 (for the domain Sph1), a Hsmax = 5.2 m corresponds a Pwmax = 70 kW/m. On the other hand, as Figure 6 shows (for the domain Sph3), a Hsmax = 5.2 m corresponds a Pwmax = 58 kW/m, while according to Figure 8 (related to the domain Sph3), a Hsmax = 4.9 m corresponds to a Pwmax = 76 kW/m. The explanation of these differences can be found in the definition of the wave power components (Equation (5)). Thus, the components of the wave power depend not only on the energy spectrum, but also on the velocity of the wave group. This means that for the same significant wave height, if the waves travel faster, they will have a higher energy.
Finally, at the end of this section it can be highlighted that, although the results of this work are focused on the coastal environment of the Black Sea, most of them reflect the general trends encountered in the coastal environment, indicating the fact that the effects of the climate change is rather similar in many nearshore areas [47,48].
4. Conclusions
This work illustrates some recent results related to the energy propagation patterns in the western side of the Black Sea basin, especially focused on the Romanian nearshore. Thus, simulations with the SWAN spectral phase averaged wave model have been performed for the entire year 2017 and some of the corresponding results have been presented and analyzed. This modeling system was previously validated at various scales, and furthermore, some data assimilation schemes have been also implemented, so that its results can be considered both accurate and reliable. Four computational levels comprising eight different SWAN domains have been considered in the present work. Five of them were defined in spherical coordinates (Sph1–Sph5), while the other three in Cartesians (Cart1–Cart3). The emphasis was given to the high, but not extreme, wave energy conditions generated by distant storms. This means that the local wind has not very high values, the maximum wind speed being usually less than 10 m/s in the nearshore areas considered. The present study also takes into account the fact that, mainly due to the climate change, the configuration of the environmental matrix in the Black Sea is currently subjected to significant changes and such high wave energy conditions may occur now with an increased frequency.
From the analysis of the results, some conclusions will be briefly drawn. In order to have references for comparisons, the results of some studies [16,17] related to the wave energy conditions previously observed in the basin of the Black Sea have been also considered. Thus, it can be first noticed that the general patterns regarding the spatial distribution of the wave energy in the basin of the Black Sea do not substantially change. This means that the western side of the sea still remains its most energetic part. Furthermore, a general enhancement of the wave energy is noticed and it appears that this enhancement is relatively higher in the western side. Although the present study was focused on the high wave energy conditions, the results of the model simulations show that the incidence of the strong storms increases in the last year. At the same time, this feature enhances the incidence of the higher wave energy conditions (that were especially targeted in the present work) followed by the general enhancement of the wave energy, which was already mentioned. Another important observation coming from the analysis of the results coming from the present work, when compared with the previous studies, relates the relatively higher values of the wave power for similar values of the significant wave height. This indicates an enhancement in terms of the wave group velocity, which means that there is a tendency for the waves to travel faster along the Black Sea.
Many previous studies, related to the wind energy potential [4,5,6,7,8,9,10], showed that the coastal environment of the Black Sea, and especially its northern and western side, is fully appropriate for the implementation of offshore wind projects. Furthermore, various studies have been also carried out related to the climate change impacts on wind energy potential in the Black Sea [49,50]. According to these, it can be noticed a clear tendency of the wind power enhancement in the western side of the basin. This is expected to be reflected also in an enhancement of the wave power, which will be more significant in the western side of the Black Sea. Furthermore, this western part was also found in previous studies [16,17] to be more energetic. At this point, it has to be also noticed that similar climate change effects are expected also in the Mediterranean Sea [12]. Even so, as regards the waves, it is obvious that the potential in the western side of the Black Sea is lower than in the ocean environment, the total average wave power values being usually lower than 6 kW/m in the western coastal environment of the Black Sea. However, the expected advances in the WEC technologies, coupled with the visible enhancement of wave power, may also give momentum to the wave energy extraction in this part of the sea. This especially concerns the collocation of the wave farms in the vicinity of the future wind projects, so that to benefit from important cost reductions related to the grid connection and to the operational expenditures (OPEX). Furthermore, an important additional argument in favor of marine energy farms is that they may play a significant role in coastal protection [25,26,27]. At this point, it has to be highlighted that the western side of the Black Sea is currently subjected to high erosion processes that need very expensive periodical investments. From this perspective, the advantage of marine farms is that they diminish the cause (the nearshore wave energy) and not the effect, as most of the other solutions considered for coastal protection.
Funding
This research was funded by the Romanian Executive Agency for Higher Education, Research, Development and Innovation Funding—UEFISCDI, grant number PN-III-P4-IDPCE-2016-0017, associated to the research project REMARC (Renewable Energy extraction in MARine environment and its Coastal impact).
Acknowledgments
The author would like to express his gratitude to the reviewers for their suggestions and observations that helped in improving the present work.
Conflicts of Interest
The author declares no conflicts of interest.
References
- SET Plan—Declaration of Intent on Strategic Targets in the Context of an Initiative for Global Leadership in Ocean Energy. 2016. Available online: https://setis.ec.europa.eu/system/files/integrated_set-plan/declaration_of_intent_ocean_0.pdf (accessed on 4 April 2018).
- Jensen, P.H.; Chaviaropoulos, T.; Natarajan, A. Outcomes from the INNWIND.EU Project, LCOE Reduction for the Next Generation Offshore Wind Turbines. 2017. Available online: file:///C:/Users/erusu/Downloads/Innwind-final-printing-version.pdf (accessed on 4 April 2018).
- Nuclear Power Economics and Project Structuring. April 2016. World Nuclear Association. Available online: http://www.world-nuclear.org/information-library/economic-aspects/economics-of-nuclear-power.aspx (accessed on 4 April 2018).
- Onea, F.; Rusu, E. Wind energy assessments along the Black Sea basin. Meteorol. Appl. 2014, 21, 316–329. [Google Scholar] [CrossRef]
- Onea, F.; Rusu, E. Evaluation of the wind energy in the north-west of the Black Sea. Int. J. Green Energy 2014, 11, 465–487. [Google Scholar] [CrossRef]
- Global Wind Energy Council (GWEC). Global Wind Energy Outlook; GWEC: Brussels, Belgium, 2016. [Google Scholar]
- Onea, F.; Raileanu, A.; Rusu, E. Evaluation of the Wind Energy Potential in the Coastal Environment of two Enclosed Seas. Adv. Meteorol. 2015. [Google Scholar] [CrossRef]
- Tong, W. Fundamentals of wind energy. In Wind Power Generation and Wind Turbine Design; WIT Press: Southampton, UK, 2010; Volume 44, p. 112. [Google Scholar]
- Raileanu, A.B.; Onea, F.; Rusu, E. Evaluation of the Offshore Wind Resources in the European Seas Based on Satellite Measurements. In Proceedings of the International Multidisciplinary Scientific GeoConferences SGEM, Albena, Bulgaria, 16–25 June 2015. [Google Scholar]
- Onea, F.; Rusu, E. Efficiency assessments for some state of the art wind turbines in the coastal environments of the Black and the Caspian seas. Energy Explor. Exploit. 2016, 34, 217–234. [Google Scholar] [CrossRef] [Green Version]
- Onea, F.; Raileanu, A.; Rusu, E. Evaluation of the wave energy potential in some locations where European offshore wind farms operate. In Maritime Technology and Engineering 3; Taylor & Francis Group: London, UK, 2016; pp. 1119–1124. [Google Scholar]
- Makris, C.; Galiatsatou, P.; Tolika, K. Climate change effects on the marine characteristics of the Aegean and Ionian Seas. Ocean Dyn. 2016, 66, 1603–1635. [Google Scholar] [CrossRef]
- Ganea, D.; Amortila, V.; Mereuta, E.; Rusu, E. A Joint Evaluation of the Wind and Wave Energy Resources Close to the Greek Islands. Sustainability 2017, 9, 1025. [Google Scholar] [CrossRef]
- Onea, F.; Rusu, L. A long-term assessment of the Black Sea wave climate. Sustainability 2017, 9, 1875. [Google Scholar] [CrossRef]
- Gasparotti, C.; Rusu, E. Methods for the risk assessment in maritime transportation in the Black Sea basin. J. Environ. Prot. Ecol. 2012, 13, 1751–1759. [Google Scholar]
- Rusu, E. Wave energy assessments in the Black Sea. J. Mar. Sci. Technol. 2009, 14, 359–372. [Google Scholar] [CrossRef]
- Rusu, L. Assessment of the wave energy in the Black Sea based on a 15-year hindcast with data assimilation. Energies 2015, 8, 10370–10388. [Google Scholar] [CrossRef]
- Rusu, E.; Soares, C.G. Wave Energy Assessments in the Coastal Environment of Portugal Continental. In Proceedings of the 27th International Conference on Offshore Mechanics and Arctic Engineering, Estoril, Portugal, 15–20 June 2008; Volume 6, pp. 761–772. [Google Scholar]
- Zanopol, A.; Onea, F.; Rusu, E. Evaluation of the coastal influence of a generic wave farm operating in the Romanian nearshore. J. Environ. Prot. Ecol. 2014, 5, 597–605. [Google Scholar]
- Zanopol, A.; Onea, F.; Rusu, E. Coastal impact assessment of a generic wave farm operating in the Romanian nearshore. Energy 2014, 72, 652–670. [Google Scholar] [CrossRef]
- Diaconu, S.; Rusu, E. The environmental impact of a Wave Dragon array operating in the Black Sea. Sci. World J. 2013. [Google Scholar] [CrossRef] [PubMed]
- Zanopol, A.T.; Onea, F.; Rusu, E. Wave farm influences on the Mangalia nearshore wave pattern. Int. Multidiscip. Sci. Geoconf. 2014, 1, 621–628. [Google Scholar]
- Omer, I.; Mateescu, R.; Vlasceanu, E. Hydrodynamic regime analysis in the shore area taking into account the new master plan implementation for the coastal protection at the Romanian shore, Water Resources, Forest, Marine and Ocean Ecosystems. SGEM 2015, 2, 651–657. [Google Scholar]
- Niculescu, D.M.; Rusu, E.V.C. Evaluation of the new coastal protection scheme at Mamaia Bay in the nearshore of the Black Sea. Ocean Syst. Eng. Int. J. 2018, 8, 1–20. [Google Scholar]
- Bergillos, R.J.; López-Ruiz, A.; Medina-López, E.; Moñino, A.; Ortega-Sánchez, M. The role of wave energy converter farms on coastal protection in eroding deltas, Guadalfeo, southern Spain. J. Clean. Prod. 2018, 171, 356–367. [Google Scholar] [CrossRef]
- Rodríguez-Delgado, C.; Bergillos, R.J.; Ortega-Sánchez, M.; Iglesias, G. Protection of gravel-dominated coasts through wave farms: Layout and shoreline evolution. Sci. Total Environ 2018, 636, 1541–1552. [Google Scholar] [CrossRef]
- Rodríguez-Delgado, C.; Bergillos, R.J.; Ortega-Sánchez, M.; Iglesias, G. Wave farm effects on the coast: The alongshore position. Sci. Total Environ. 2018, 640–641, 1176–1186. [Google Scholar] [CrossRef]
- Booij, N.; Ris, R.C.; Holthuijsen, L.H. A third generation wave model for coastal regions. Part 1: Model description and validation. J. Geophys. Res. 1999, 104, 7649–7666. [Google Scholar] [CrossRef]
- Holthuijsen, H. Waves in Oceanic and Coastal Waters; Cambridge University Press: Cambridge, UK, 2007; p. 387. [Google Scholar]
- Rusu, E. Strategies in using numerical wave models in ocean/coastal applications. J. Mar. Sci. Technol. Taiwan 2011, 19, 58–75. [Google Scholar]
- SWAN Team. Scientific and Technical Documentation; SWAN Cycle III; Delft University of Technology, Department of Civil Engineering: Delft, The Netherlands, 2017. [Google Scholar]
- Rusu, L.; Bernardino, M.; Soares, C.G. Wind and wave modeling in the Black Sea. J. Oper. Oceanogr. 2014, 7, 5–20. [Google Scholar] [CrossRef]
- Rusu, L.; Ivan, A. Modelling wind waves in the Romanian coastal environment. Environ. Eng. Manag. J. 2010, 9, 547–552. [Google Scholar]
- Rusu, L.; Butunoiu, D. Evaluation of the wind influence in modeling the Black Sea wave conditions. Environ. Eng. Manag. J. 2014, 13, 305–314. [Google Scholar]
- Rusu, L.; Butunoiu, D.; Rusu, E. Analysis of the extreme storm events in the Black Sea considering the results of a ten-year wave hindcast. J. Environ. Prot. Ecol. 2014, 15, 445–454. [Google Scholar]
- Butunoiu, D.; Rusu, E. Sensitivity tests with two coastal wave models. J. Environ. Prot. Ecol. 2012, 13, 1332–1349. [Google Scholar]
- Rusu, E.; Soares, C.V.; Rusu, L. Computational strategies and visualisation techniques for the wave modeling the Portuguese nearshore. Marit. Transp. Exp. Ocean Coast. 2005, 2, 1129–1136. [Google Scholar]
- Ivan, A.; Gasparotti, C. Influence of the interactions between waves and currents on the navigation at the entrance of the Danube Delta. J. Environ. Prot. Ecol. 2012, 13, 1673–1682. [Google Scholar]
- Ivan, A.; Rusu, E. Assessment of the navigation conditions in the coastal sector at the entrance of the Danube Delta. Int. Multidiscip. Sci. Geoconf. 2012, 3, 935–942. [Google Scholar]
- Rusu, E.; Raileanu, A. A multi parameter data assimilation approach for wave predictions in coastal areas. J. Oper. Oceanogr. 2016, 9, 13–25. [Google Scholar] [CrossRef]
- Butunoiu, D.; Rusu, E. Wave Modeling with Data Assimilation to Support the Navigation in the Black Sea Close to the Romanian Ports. In Proceedings of the 2nd ICTTE Conference, Belgrade, Serbia, 27–28 November 2014; pp. 180–187. [Google Scholar]
- Butunoiu, D.; Rusu, E. A Data Assimilation Scheme to Improve the Wave Predictions in the Black Sea. In OCEANS 2015-Genova; IEEE Xplore Digital Library: Genoa, Italy, 2015. [Google Scholar]
- Rusu, L. A data assimilation scheme to improve the wave predictions in the western side of the Black Sea, Geoconference on Water Resources, Forest, Marine and Ocean Ecosystems. SGEM 2014, 2, 539–545. [Google Scholar]
- Raileanu, A.; Rusu, L.; Rusu, E. Data assimilation Methods to Improve the Wave Predictions in the Romanian Coastal Environment. In Proceedings of the 16th SGEM Conference, Albena, Bulgaria, 30 June–6 July 2016; pp. 855–862. [Google Scholar]
- Kalnay, E. Atmospheric Modeling, Data Assimilation and Predictability; Cambridge University Press: Cambridge, UK, 2003; p. 341. [Google Scholar]
- Janssen, P.A.E.M. Nonlinear four-wave interactions and freak waves. J. Phys. Oceanogr. 2003, 33, 863–883. [Google Scholar] [CrossRef]
- Rusu, E. Numerical Modeling of the Wave Energy Propagation in the Iberian Nearshore. Energies 2018, 11, 980. [Google Scholar] [CrossRef]
- Rusu, E.; Onea, F. Estimation of the wave energy conversion efficiency in the Atlantic Ocean close to the European islands. Renew. Energy 2016, 85, 687–703. [Google Scholar] [CrossRef]
- Davy, R.; Gnatiuk, N.; Pettersson, L.; Bobylev, L. Climate change impacts on wind energy potential in the European domain with a focus on the Black Sea. Renew. Sustain. Energy Rev. 2018, 81, 1652–1659. [Google Scholar] [CrossRef] [Green Version]
- Divinsky, B.V.; Kosyan, R.D. Spatiotemporal variability of the Black Sea wave climate in the last 37 years. Cont. Shelf Res. 2017, 136, 1–19. [Google Scholar] [CrossRef]
Figure 1.
The computational domains defined in spherical coordinates: (a) Sph1—Black Sea basin and Sph2 (right side)—western coastal driver; (b) Sph3—nearshore area at the mouths of the Danube River (right side); Sph4 and Sph5 (left side)—Southern RO1 and RO2. The positions of the three Cartesian domains are also indicated.
Figure 2.
The computational domains defined in Cartesian: (a) Cart1—the nearshore in front of Sulina arm of the Danube River; (b) Cart2—Sacalin Peninsula and the Saint George arm of the Danube River; (c) coastal environment close to Mangalia city, the south of the Romanian nearshore.
Figure 2.
The computational domains defined in Cartesian: (a) Cart1—the nearshore in front of Sulina arm of the Danube River; (b) Cart2—Sacalin Peninsula and the Saint George arm of the Danube River; (c) coastal environment close to Mangalia city, the south of the Romanian nearshore.

Figure 3.
Hs scatter diagrams: a) SWAN without DA and b) SWAN with DA (right), results corresponding to the 15-year time interval 1999–2013.
Figure 3.
Hs scatter diagrams: a) SWAN without DA and b) SWAN with DA (right), results corresponding to the 15-year time interval 1999–2013.

Figure 4.
High wave conditions in the Black Sea (computational domain Sph1), model results corresponding to the time frame 8 January 2017. (a) Significant wave height scalar fields and wave vectors (represented by black arrows); (b) wave power scalar fields and energy transport vectors (represented by red arrows). The maximum values of the significant wave height and wave power are also indicated.

Figure 5.
High wave conditions in the western Black Sea (computational domain Sph2), model results corresponding to the time frame 4 February 2017. (a) Significant wave height scalar fields and wave vectors (represented by black arrows); (b) wave power scalar fields and energy transport vectors (represented by red arrows).

Figure 6.
High wave conditions at the mouths of the Danube River (computational domain Sph3), model results corresponding to the time frame 22 March 2017. (a) Significant wave height scalar fields and wave vectors (represented by black arrows); (b) wave power scalar fields and energy transport vectors (represented by red arrows).

Figure 7.
Average to high wave conditions in the southern side of the Romanian nearshore (computational domain Sph4—Southern RO1), model results corresponding to the time frame 7 October 2017. (a) Significant wave height scalar fields and wave vectors (represented by black arrows); (b) wave power scalar fields and energy transport vectors (represented by red arrows).

Figure 8.
High wave conditions in the southern side of the Romanian nearshore (computational domain Sph5—Southern RO2), model results corresponding to the time frame 25 October 2017. (a) Significant wave height scalar fields and wave vectors (represented by black arrows); (b) wave power scalar fields and energy transport vectors (represented by red arrows).

Figure 9.
Wave power scalar fields and energy transport vectors (represented by red arrows) in the high resolution Cartesian domains defined: (a) Cart1—Sulina bar, average to high wave energy situation corresponding to the time frame 8 November 2017; (b) Cart2—Sacalin Peninsula, high wave conditions, time frame 28 November 2017. (c) Cart3—Mangalia nearshore, high wave conditions, time frame 18 December 2017.


Table 1.
Characteristics of the computational domains defined in spherical coordinates for the Simulating Waves Nearshore (SWAN) model simulations focused on the western side of the Black Sea.
Table 1.
Characteristics of the computational domains defined in spherical coordinates for the Simulating Waves Nearshore (SWAN) model simulations focused on the western side of the Black Sea.
| Spherical Domains | Δλ × Δφ | Δt (min) | nf | nθ | ngλ × ngφ = np |
|---|---|---|---|---|---|
| Sph1—Black Sea (L1) | 0.08° × 0.08° | 10 non-stat | 24 | 36 | 176 × 76 = 13,376 |
| Sph2—Coastal driver (L2) | 0.02° × 0.02° | 10 non-stat | 24 | 36 | 141 × 141 = 19,881 |
| Sph3—Danube mouths (L3) | 0.01° × 0.01° | 10 non-stat | 24 | 36 | 71 × 61 = 4331 |
| Sph4—Southern RO1 (L3) | 0.01° × 0.01° | 10 non-stat | 24 | 36 | 221 × 221 = 48,821 |
| Sph5—Southern RO2 (L3) | 0.01° × 0.01° | 10 non-stat | 24 | 36 | 161 × 141 = 22,701 |
Table 2.
Characteristics of the Cartesian computational domains considered for the SWAN model simulations focused on the western side of the Black Sea.
Table 2.
Characteristics of the Cartesian computational domains considered for the SWAN model simulations focused on the western side of the Black Sea.
| Cartesian Domains | Δx × Δy (m) | Δt (min) | nf | nθ | ngx × ngy = np |
|---|---|---|---|---|---|
| Cart1—Sulina (L4) | 50 × 50 | 60 stat | 30 | 36 | 135 × 216 = 29,160 |
| Cart2—Sacalin (L4) | 200 × 200 | 60 stat | 30 | 36 | 353 × 251 = 88,603 |
| Cart3—Mangalia (L4) | 50 × 50 | 60 stat | 30 | 36 | 96 × 107 = 10,172 |
Table 3.
Physical processes activated in the SWAN simulations, corresponding to the eight computational domains defined. X—process activated, 0—process inactivated.
Table 3.
Physical processes activated in the SWAN simulations, corresponding to the eight computational domains defined. X—process activated, 0—process inactivated.
| Input/Process | Wave | Wind | Tide | Curr | Gen | Wcap | Quad | Triad | Diffr | Bfric | Set up | Br |
|---|---|---|---|---|---|---|---|---|---|---|---|---|
| Domains | ||||||||||||
| Sph1 | 0 | X | 0 | 0 | X | X | X | 0 | 0 | X | 0 | X |
| Sph2 | X | X | 0 | 0 | X | X | X | X | 0 | X | 0 | X |
| Sph3 | X | X | 0 | X | X | X | X | X | X | X | 0 | X |
| Sph4 | X | X | 0 | 0 | X | X | X | X | 0 | X | 0 | X |
| Sph5 | X | X | 0 | 0 | X | X | X | X | X | X | 0 | X |
| Cart1 | X | X | 0 | X | X | X | X | X | X | X | X | X |
| Cart2 | X | X | 0 | X | X | X | X | X | X | X | X | X |
| Cart3 | X | X | 0 | 0 | X | X | X | X | X | X | X | X |
Table 4.
Statistical results obtained for the Hs values simulated with SWAN and the Hs values obtained after the application of the DA (data assimilation) method, against altimeter measurements used for validation across the Black Sea, results corresponding to the 15-year time interval (1999–2013).
Table 4.
Statistical results obtained for the Hs values simulated with SWAN and the Hs values obtained after the application of the DA (data assimilation) method, against altimeter measurements used for validation across the Black Sea, results corresponding to the 15-year time interval (1999–2013).
| Parameter | MeanObs (m) | MeanSim (m) | Bias (m) | MAE (m) | RMSE (m) | SI | R | S | N |
|---|---|---|---|---|---|---|---|---|---|
| SWAN Hs (m) | 1.04 | 0.97 | −0.07 | 0.27 | 0.35 | 0.35 | 0.88 | 0.98 | 316,920 |
| SWANDA Hs (m) | 1.00 | −0.04 | 0.21 | 0.29 | 0.28 | 0.91 | 0.99 |
© 2018 by the author. Licensee MDPI, Basel, Switzerland. This article is an open access article distributed under the terms and conditions of the Creative Commons Attribution (CC BY) license (http://creativecommons.org/licenses/by/4.0/).
Share and Cite
MDPI and ACS Style
Rusu, E. Study of the Wave Energy Propagation Patterns in the Western Black Sea. Appl. Sci. 2018, 8, 993. https://doi.org/10.3390/app8060993
AMA Style
Rusu E. Study of the Wave Energy Propagation Patterns in the Western Black Sea. Applied Sciences. 2018; 8(6):993. https://doi.org/10.3390/app8060993
Chicago/Turabian StyleRusu, Eugen. 2018. "Study of the Wave Energy Propagation Patterns in the Western Black Sea" Applied Sciences 8, no. 6: 993. https://doi.org/10.3390/app8060993
Note that from the first issue of 2016, this journal uses article numbers instead of page numbers. See further details here.