Article

Shear Wave Elastography Measures of the Achilles Tendon: Influence of Time of Day, Leg Dominance and the Impact of an Acute 30-Minute Bout of Running

Sport and Exercise Science and Sports Medicine Research Group, University of Brighton, Carlisle Road, Eastbourne BN20 7SN, UK
*
Author to whom correspondence should be addressed.
Appl. Sci. 2018, 8(7), 1170; https://doi.org/10.3390/app8071170
Submission received: 27 June 2018 / Revised: 13 July 2018 / Accepted: 16 July 2018 / Published: 18 July 2018
(This article belongs to the Special Issue Ultrasound Elastography)

Abstract

:
The mechanical properties of human tendons are likely to be influenced by factors known to affect elastic structures, including patterns of loading and unloading during the day. However, the exact scale and relevance of these variables to tendon stiffness remains unclear. The aim of this study was to (1) measure Achilles tendon (AT) stiffness over the course of the day, (2) examine AT stiffness between dominant and non-dominant standing leg tendons and (3) assess the impact of previous activity on AT stiffness. To assess the impact of time of day and leg dominance, 15 healthy participants (6 females, 9 males; mean age 28 ± 4 year, mean VISA-A score 99.0 ± 1.2) had shear wave elastography (SWE) measures taken at 08:00 h, 12:30 h and 17:00 h on both dominant and non-dominant legs. To assess the impact of exercise, 24 tendons were analysed (7 females, 5 males; mean age 27 ± 4 year, mean VISA-A Score 99.1 ± 1.1) with participants randomly assigned to either a control (CONT) group or a running (RUN) group. The RUN group performed a 30-min run at a subjective intensity of 13–15 on rating of perceived exertion (RPE) scale and had SWE measures taken before, immediately after, 6 h 24 h, 48 h and 72 h following the run. There were no significant differences in AT stiffness over the course of a day or between dominant and non-dominant leg. Significant increases in AT stiffness were noted pre-post run (0.27 m/s, 2.95%, p = 0.037). Leg dominance does not affect SWE values from asymptomatic ATs or change throughout a day, but a 30-min run significantly increases AT stiffness. Leg dominance and timing of clinical appointments are unlikely to affect SWE results, however a prior bout of physical activity may cause changes within the AT resulting in a significantly different SWE measure. Clinicians and researchers should be cautious of interpreting SWE results if weight bearing exercise has been performed beforehand.

1. Introduction

The mechanical properties of human tendons are likely to be influenced by factors known to affect elastic structures, including patterns of loading and unloading during the day. The scale and relevance of these variables to tendon structure and function remain relatively unclear [1] and there are few systematic reports on how the stiffness of a human tendon alters throughout the course of a day [2,3]. Periods of sleep, rest and activity throughout a day will cause altered loading and unloading at differing frequencies and intensities on tendons, which will impact their stiffness. The research available into the effect of time of day on tendon structures in vivo has been conducted using the patella tendon, with tendon stiffness estimated using an isokinetic dynamometer to measure force and B-mode ultrasound to measure length [2]. This research measured a decrease in tendon stiffness of 20.2 ± 9.5% between the testing times of 08:00 h and 18:00 h [2]. No research has yet assessed the impact of time of day on tendon stiffness using shear wave elastography (SWE).
The term mechanotransduction refers to the processes converting mechanical loading, such as exercise, into measurable cellular responses that may result in structural or functional change [4]. Exercise has been shown capable of altering both the structural and chemical makeup of human tendon by inducing increases in its cross-sectional area and increasing the concentration of metabolic enzymes to increase collagen turnover and prostaglandin production [5,6]. Mechanical stimulus is also postulated to initiate changes within the extracellular matrix of tendon that results in a more damage resistant tissue with optimal force transmission properties [7]. The early adaptive responses to mechanotransduction can initiate longer term alterations in the mechanical properties of a tendon [8], however the majority of alterations brought about by mechanotransduction are noted as the result of repeated exercise (loading) programmes. This could be because the adaptation in the mechanical properties of tendons takes a long time, or the impact of acute bouts of exercise have not yet been extensively studied. Regardless, the exact influence of acute bouts of specific forms of exercise on the mechanical properties of healthy human tendon remains relatively unclear [1,9]. Long term exercise training such as running may increase the mass, collagen content, ultimate tensile strength and load to failure of a tendon [5], but changes in relation to acute exercise bouts are less well understood.
A systematic review of the immediate effect of exercise on AT properties was conducted in 2013 [10]. The conclusion of this paper was that acute bouts of exercise impact AT mechanical properties in a manner dependent on both mode and dose of exercise as the differences in tendon stress-strain characteristics, such as rate, duration and frequency, between different types of exercise will cause varying changes to the mechanical properties of tendons over time [10]. Of the papers included in the review by Obst et al. (2013), 14 assessed AT stiffness with 12 of these using data obtained from ultrasonography and dynamometry [11,12,13,14,15,16,17,18,19,20,21,22]. Whilst the remaining two studies also utilised ultrasonography, they used either a force platform or a force transducer to obtain measures of force [23,24]. Six papers reported a decrease in AT stiffness following exercise, one reported a significant increase and the remaining seven reported no differences [10]. Of the articles that found a decrease in AT stiffness, four assessed the effect of stretching, whilst others assessed isometric or concentric muscle contractions and not specifically running. One study found a significant increase in tendon stiffness post 10 minutes of static stretching with stiffness calculated using ultrasonography and isokinetic dynamometry [18]. Only two articles included in the review assessed tendon stiffness after running, one study found no difference in AT stiffness post running [23]. The other study found no significant difference in stiffness, however, it only looked at changes after a 6-min warm up jog and stretching [19]. Also noted in the Obst et al. (2013) paper was the lack of studies evaluating the mechanical properties of the ‘free’ AT [10], with ‘free’ AT referring to the part of the tendon without any other attachment to either bony or muscular structures. This current study therefore aims to focus on the ‘free’ portion of the AT to address this gap in the literature.
Although not directly assessing stiffness, research using ultrasound tissue characterisation (UTC) has assessed the structure of the human in vivo AT before and after exercise. The results of studies using UTC suggest there were changes in tendon structure and integrity following a bout of exercise, including a decrease in aligned tendon fibrils and an increase in the separation and waviness of fibrils, both of which returned to baseline over the following 72 h [25]. A decrease in the alignment of the tendon fibres may result in decreased tendon stiffness. Habitual running of long distances (>80 km/week for >3 years) results in a marked increase in the cross-sectional area of the AT of approximately 22% in comparison with a non-running control group [26]. This increase in cross-sectional area may be a compensatory mechanism as pathological tendons can compensate for significant areas of disorganised fibres by increasing thickness to reduce stress and maintain structural homeostasis to ensure adequate load bearing [27,28]. Despite a large body of work surrounding the effects of habitual running, studies exploring the impact of a single acute bout of running on stiffness measures of normal, healthy human ATs in vivo remain scarce [10,19].
Most research into tendon stiffness utilise direct methods of calculating stiffness using ultrasound to measure change in tendon length and a dynamometer to measure force. This can produce accurate results, but is time consuming, requires complex procedures and a lot of equipment and space to run. Hence, a quick, easy and non-invasive measure of tendon stiffness is required. This study proposes to measure shear wave velocity (SWV), a surrogate measure of stiffness, in the AT in vivo using shear wave elastography (SWE). The relatively recent introduction of SWE offers a novel way to quantitatively assess tendon stiffness by measuring SWV through a tissue, providing information on tissue stiffness [29]. In recent years, there have been several studies published using SWE to assess tendon stiffness [30,31,32,33,34] and many reporting the reliability and validity of SWE [33,35,36]. Despite this, the reported information on the many variables that potentially influence SWE measurements remain unclear [32]. It is necessary to understand normal variation in AT stiffness with relation to leg dominance [37], as ATs have been shown to be significantly different between dominant and non-dominant legs [38] having different mechanical properties attributed to different loading profiles of both legs during daily activity due to foot dominance [39]. No studies have examined differences in AT stiffness with leg dominance using SWE or the alterations in SWE measurements experienced within a healthy human AT in vivo, in response to the time of day or an acute bout of running.
It is important to understand the normal variation in SWV measures within the AT in vivo and the influence of external loads on these values. Without such information, abnormal or clinically relevant values cannot be decided upon and accurate interpretation is not possible. The aim of this study is three-fold. Firstly, it will measure the stiffness of the AT using SWE in the morning (08:00 h), afternoon (12:30 h) and evening (17:00 h) to see whether any measurable differences are apparent dependent on time of day. Secondly, it will examine SWE measures obtained in ATs in vivo bi-laterally to assess measurable differences between dominant and non-dominant standing leg tendons. Thirdly, this study will use SWE to assess measures of stiffness taken before, immediately after, 6 h, 24 h, 48 h and 72 h after an acute 30-min bout of running to trace the time course of SWV alterations in the AT in vivo after exercise.

2. Materials and Methods

2.1. Participants

To assess the impact of time of day and leg dominance, 15 healthy participants were examined (6 females, 9 males; mean age 28 ± 4 year, mean VISA-A score 99.0 ± 1.2). To determine foot dominance, participants were asked to identify which foot they would kick a ball with [40,41,42]. To assess the impact of a 30-min bout of running, 24 tendons from 12 participants were analysed (7 females, 5 males; mean age 27 ± 4 year, mean VISA-A Score 99.1 ± 1.1). Inclusion criteria was set as both males and females over the age of 18 years old who achieved a minimum score of 96/100 on the VISA-A to rule out subjectively symptomatic tendons. Exclusion criteria included previous diagnosis of Achilles tendinopathy, history of pain in the AT area lasting for more than 24 h, pregnancy, previous medical or surgical intervention on the AT or abnormal features consistent with Achilles Tendinopathy on conventional 2D ultrasound.
Participants were recruited by word of mouth from the University department where the testing took place. All participants provided written informed consent to participate in the study and all procedures performed involving human participants were commenced following ethical approval for the study being obtained from the University of Brighton ethics committee, in line with the 1964 Helsinki declaration and its later amendments.

2.2. Methods

To assess the impact of time of day, all participants were scanned three times throughout the course of their normal working day. Firstly, between 08:00–08:30 h, secondly between 12:30–13:00 h and lastly between 17:00–17:30 h. To assess the impact of leg dominance, SWE measures were taken on both the dominant and non-dominant legs. Participants were asked to maintain any daily walking activity they deemed normal but refrain from any other exercise for 48 h before testing and during the testing period.
To assess the impact of an acute bout of running, participants were randomly placed into the intervention group of running (RUN) or the control (CONT) group. If assigned to the CONT group, participants were asked to remain seated in the examination room for a period of at least 30 min, and no more than 40 min during their testing session. The participants were asked to remain seated keeping their legs still during this period and not move around, the experimenter was always present to ensure this occurred. Following assignment to each intervention group, the measures outlined below were taken from each participant immediately before and immediately after their sitting or running intervention. Subsequent follow up measures were also taken at 6 h, 24 h, 48 h and 72 h post intervention. In the RUN group, participants were given the possibility to warm up on the treadmill for no more than 5 min. Following the warm up, they were asked to keep the incline on the treadmill at 1% and increase the speed of the treadmill to a pace they felt comfortable with, and to run for a period of 30 min. A Rating of Perceived Exertion (RPE) scale [43] was placed in the direct eye line of the participants and they were asked to maintain an RPE of at least 13 (representing an intensity of somewhat hard), but below 15 (hard). The participants were asked every 5 min to rate their current RPE value and were encouraged by the experimenter to maintain an RPE of between 13 and 15 if it was outside of these values. The participants were able to alter their speed during their 30-min run to maintain RPE between these boundaries. Following 30 min of running, participants could complete a cool down at a walking speed of their choice for a period of no more than 5 min.

2.3. Scanning Techniques

During all measures, participants lay prone with both feet hanging clear of an examination table and an amount of ultrasound gel sufficient to maintain good contact between the ultrasound probe and the skin was applied. All measures were taken with a Siemens ACUSON S3000™ HELX EVOLUTION Ultrasound System (Siemens Medical Solutions, Mountain View, CA, USA). Measures obtained were shear wave velocity (SWV) which was used for analysis without converting to Young’s modulus.

2.4. Conventional Ultrasound Technique

During each measurement, extended field of view ‘SieScape’ images were taken on grey scale ultrasound by a single operator (CP), with three years imaging experience, using a 14L5SP probe to visualize the ‘free’ AT length, between insertion of the AT the calcaneus to the lowest fibres of soleus, following previous methodology [44]. Tendon mid-point was calculated as half AT length and used as the reference point for all subsequent measures to ensure all were taken at the tendon mid-point, relative to each participant.
Measures of maximum anterior-posterior (max AP) diameter were calculated at the tendon mid-point relative to each participant using a 14L5 probe. A transverse image of the AT was captured from the tendon mid-point and the ultrasound software used to measure the maximum distance in millimetres (mm) from the anterior border of the tendon to the posterior border of the tendon. As used in previous research [45], three consecutive measures were taken, ensuring all measures fell within 5 mm of each other, with the mean of the three measurements taken to represent max AP diameter.

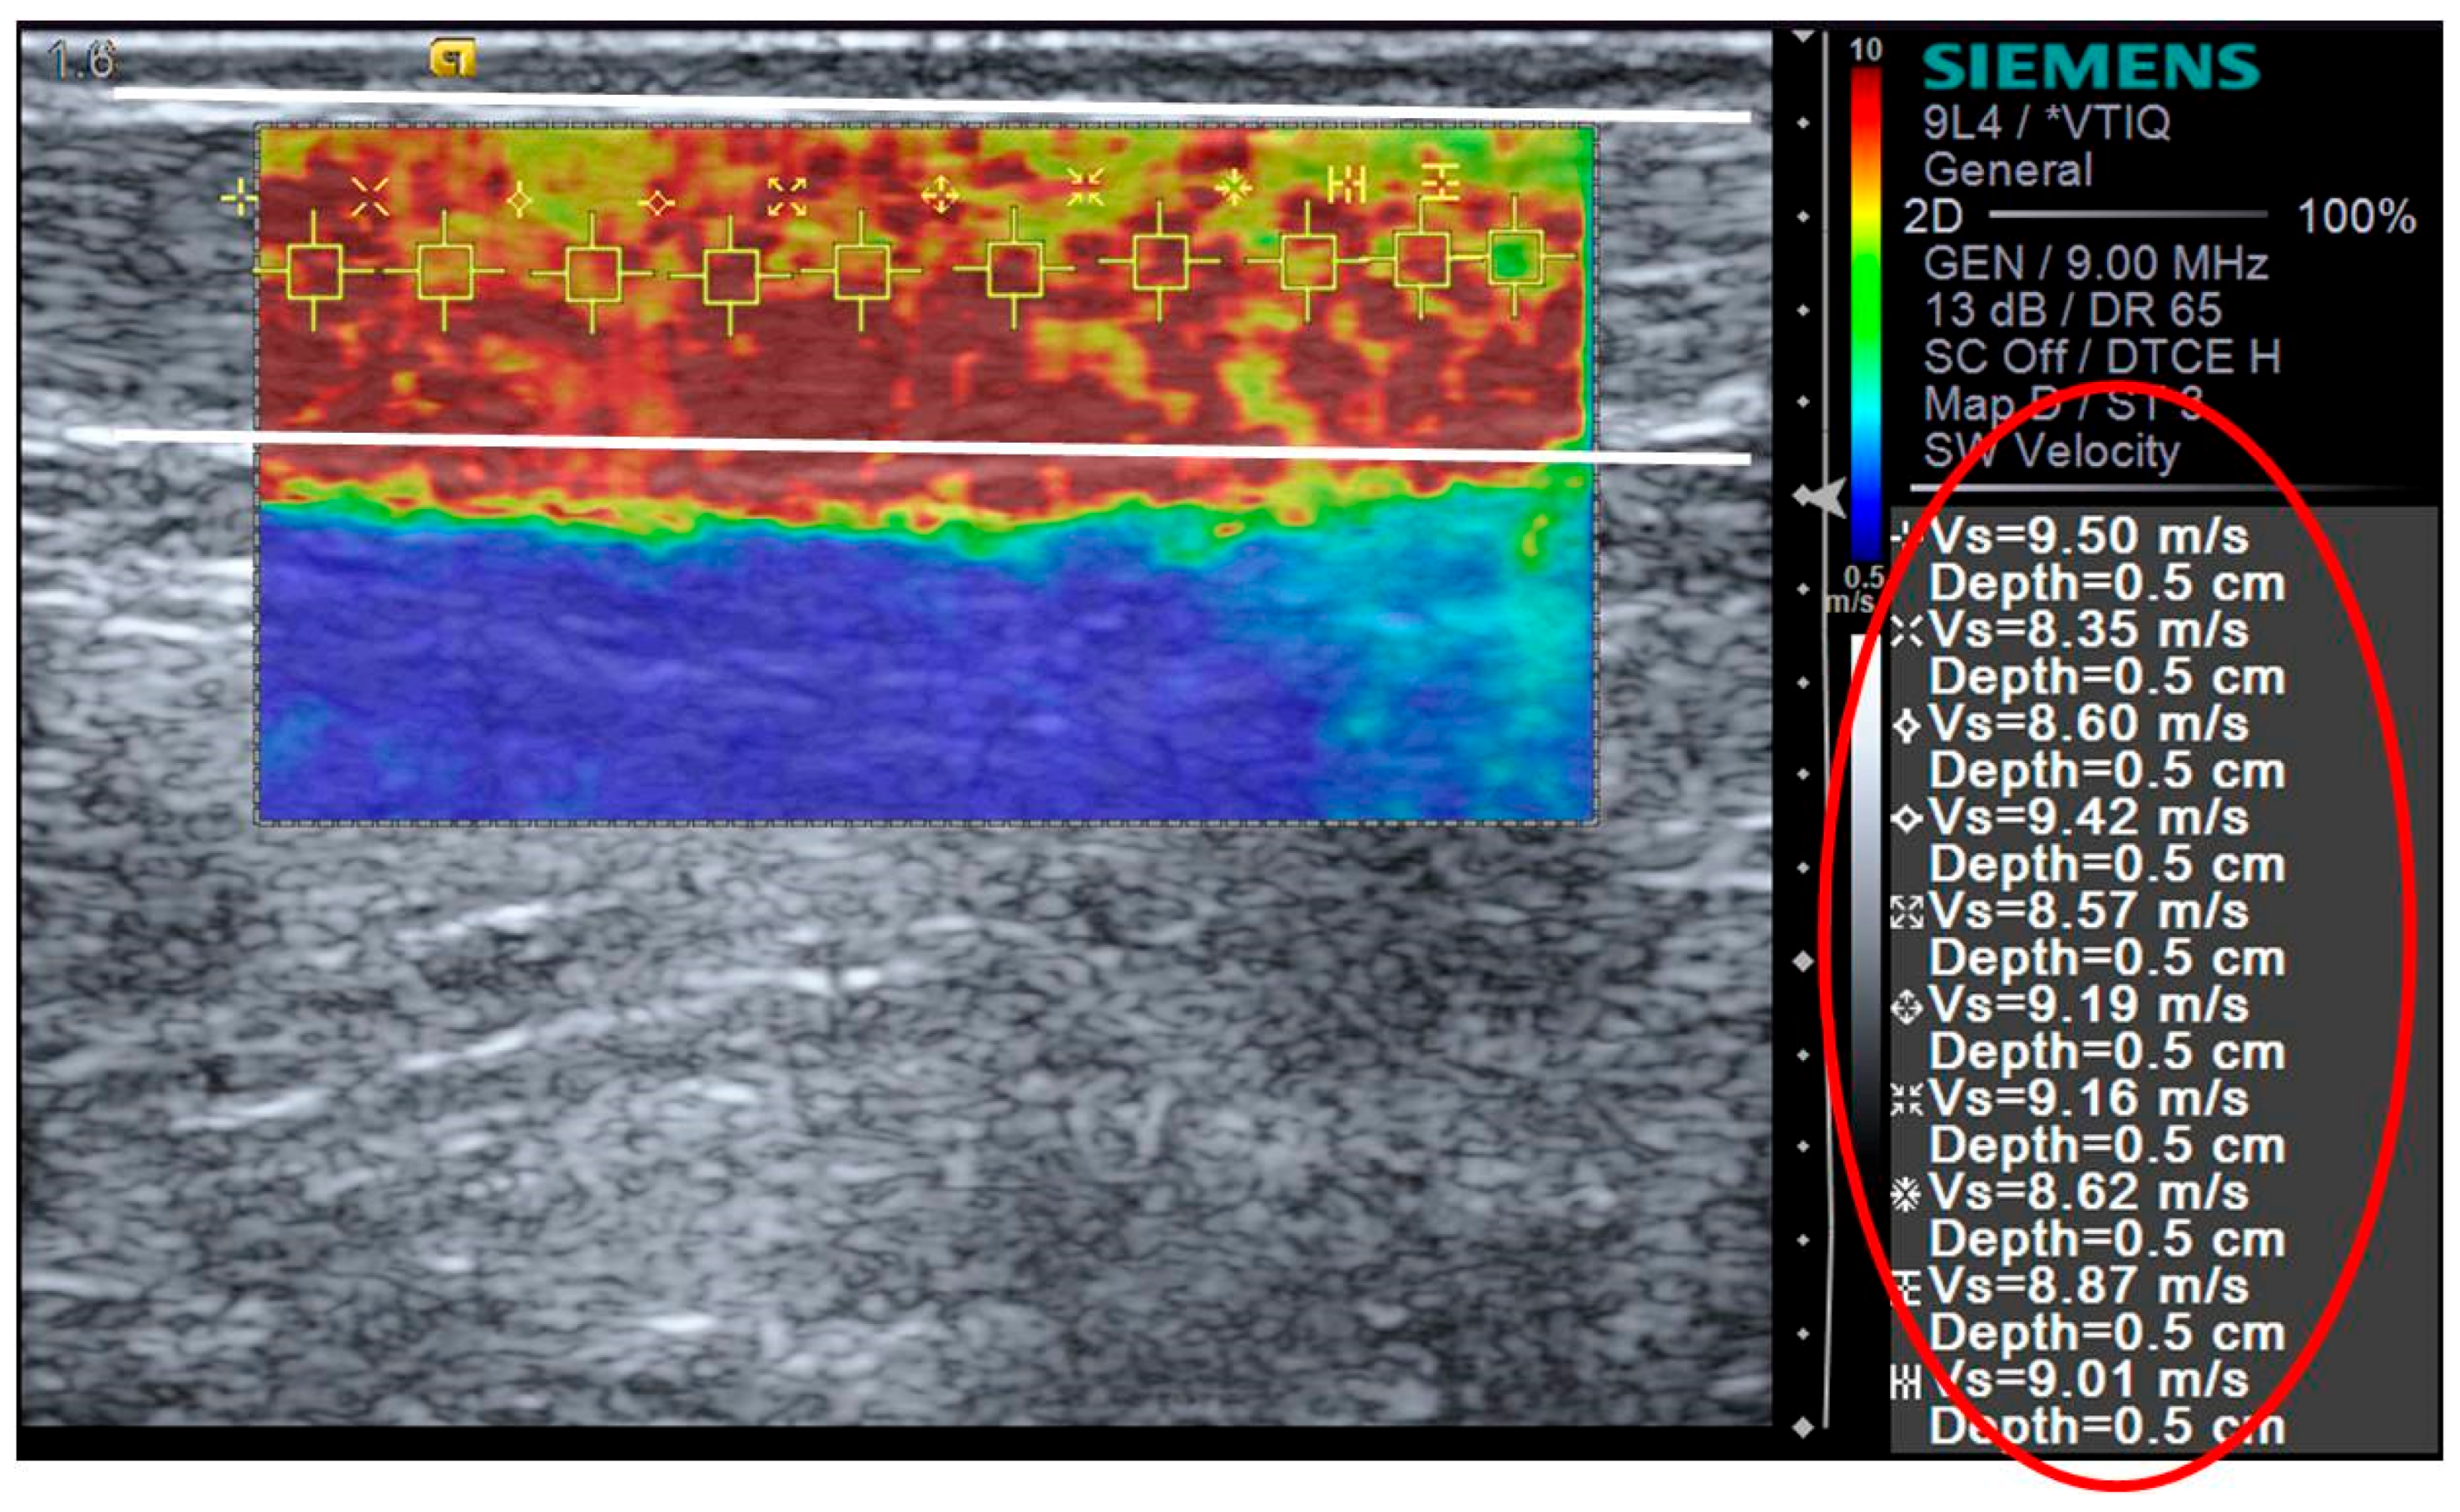
2.5. Shear Wave Elastography

Following conventional ultrasound, the system was placed into Virtual Touch IQ (VTIQ) mode, an acoustic radiation force-based method that produces both qualitative and quantitative maps of SWV ranging between 0.5 and 10.0 m/s [46,47]. Images were obtained by the same operator (CP) using a linear-array 9L4 transducer probe. Due to the saturation limit of the technology, a SWV value measured above 10 m/s was returned by the software as ‘High’. Only 4 of these were returned throughout the course of the study and when they did occur, they were discounted from the study. Image quality was closely monitored throughout examination, tissue compression was avoided. Quality maps were assessed to ensure images conformed to a high level of quality, specifically checking for a quality map all green in colour, which indicates that a correct amount of pressure was used. All elastograms were taken in a longitudinal plane with the foot in a relaxed foot position, as this has been demonstrated to provide the most reproducible measures [44].
Ten set size and shape regions of interest (ROI) were placed manually in the same order on longitudinal elastograms, at a standardised depth of 0.5 cm, along the tendon length, starting proximally and working distally (See Figure 1).

2.6. Statistical Analysis

All statistical analysis was performed using SPSS version 22 (SPSS, Chicago, IL, USA.). Basic measurements of the participants were expressed as mean ± standard deviation. Distribution of groups was analysed using the Shapiro-Wilk test. A one-way repeated measures ANOVA assessed any change to SWV over the three measured time points. A paired sample t-tests was used to examine whether measures taken on the dominant and non-dominant sides of the participants were significantly different from each other. A two-way repeated measures ANOVA (Time (6) and Group (2)) assessed differences in SWV following exercise. To establish where the differences lay, separate one-way repeated measures ANOVA’s were completed for the RUN and CONT groups with findings followed up using the Bonferonni post hoc test. Data was checked for sphericity with the Huynh-Feldt correction applied if necessary and alpha level was set at p < 0.05 throughout.

3. Results

3.1. Time of Day

There were no significant differences shown to exist over the three measured time points for either AT length (p = 0.411) or max AP diameter (p = 0.286) in the dominant ATs or in the non-dominant ATs (p = 0.062 and p = 0.322, respectively).
In relation to time of day, there were no significant differences (p > 0.05) over the three measured time points in the SWV within either the participants’ dominant AT (p = 0.094) or non-dominant AT (p = 0.143). Alterations in the group mean of the SWV measures within the dominant AT did not experience significant alterations throughout the day. There was a small reduction in measured stiffness throughout the morning, between 08:00 h and 12:30 h of −2.07% and an increase between 12:30 h and 17:00 h of 0.63%. Overall, between 08:00–17:00 h, the decrease in SWV was −1.45%. None of these alterations were shown to be significant.

3.2. Leg Dominance

When compared to each other, there were no significant differences between dominant and non-dominant ATs with regards to AT length at 08:00 h (p = 0.789), 12:30 h (p = 0.718) or 17:00 h (p = 0.727). There were no significant differences between dominant and non-dominant ATs with regards to AT max AP diameter at 08:00 h (p = 0.608), 12:30 h (p = 0.681) or 17:00 h (p = 0.714). There were no significant differences in the SWV measures in the dominant AT compared to the non-dominant AT (p > 0.05) at 08:00 h (p = 0.176), 12:30 h (p = 0.402) and 17:00 h (p = 0.915). The mean SWV measured in the dominant AT of both male (mean = 9.61 ± 0.21; range 9.24–9.88 m/s) and female (mean = 9.76 ± 0.23; range 9.31–9.92 m/s) participants were very similar (p = 0.203) indicating no significant differences between the SWE measures within the AT of male and female participants.

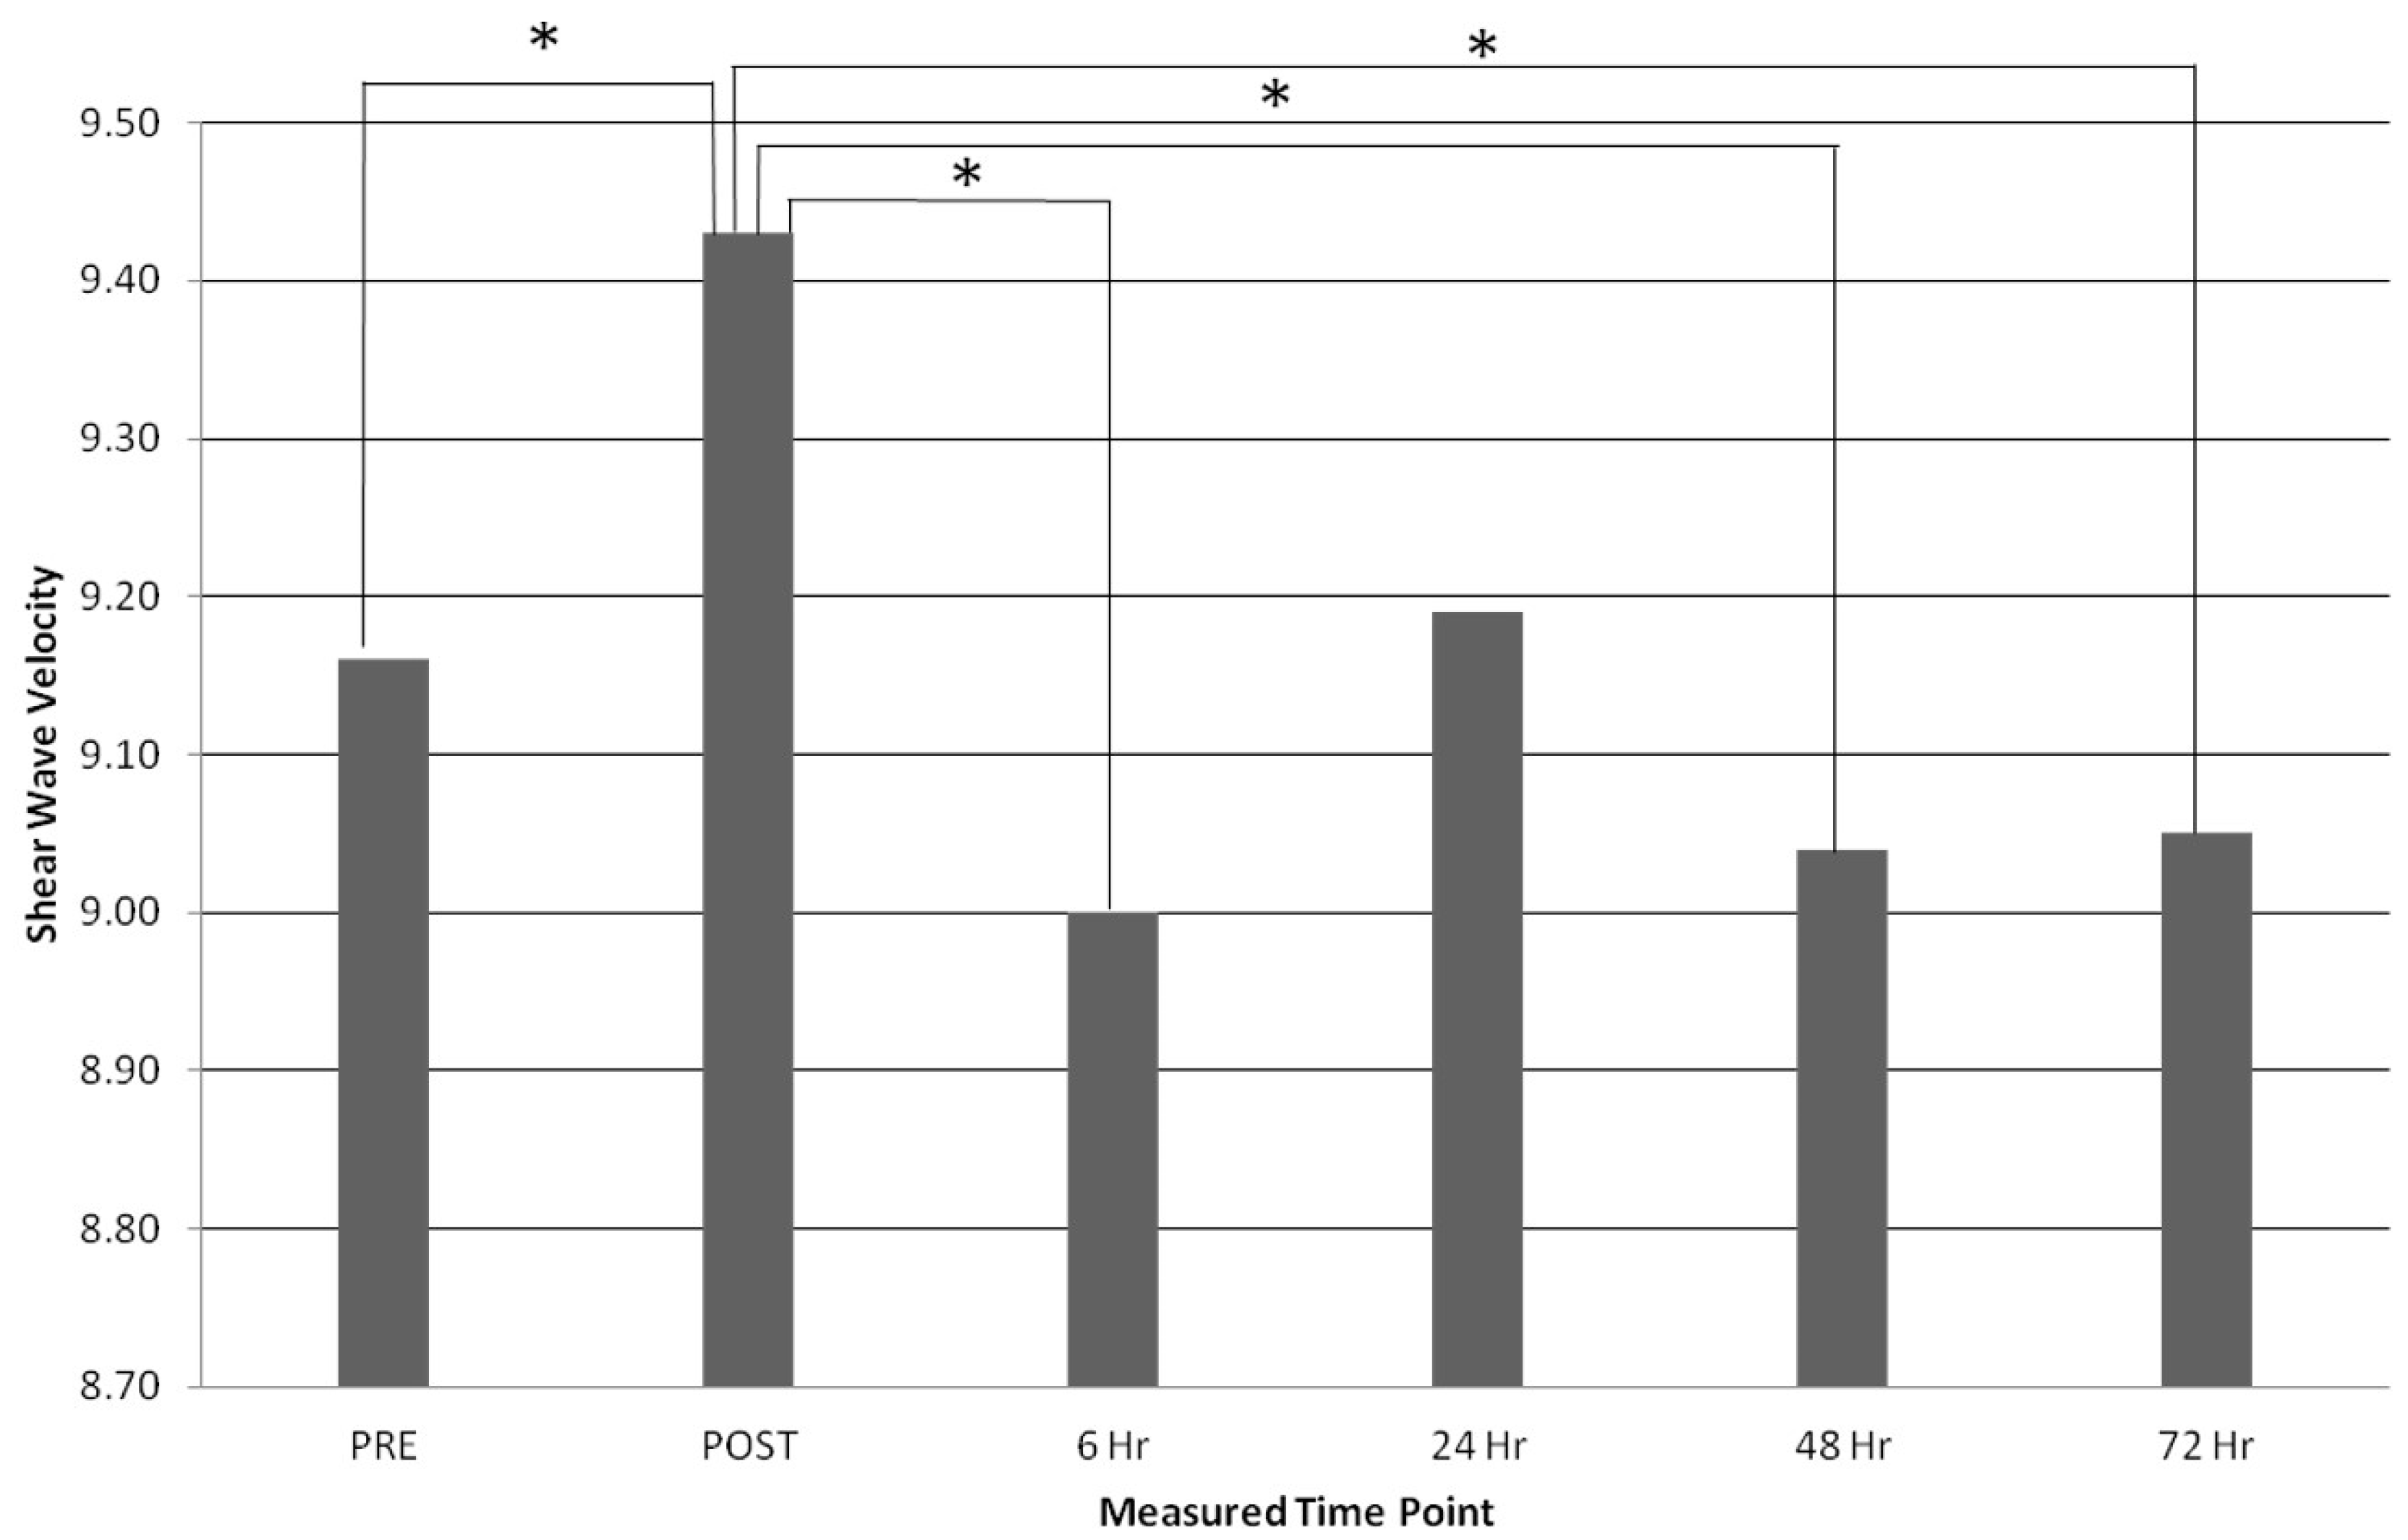
3.3. Acute Bout of Exercise

The basic measurements obtained from the participants over the measured time points are displayed in Table 1.
When considering the effect of the exercise bout, measurements of AT length for both the RUN and the CONT group remain stable over the six measured time points with no significant differences apparent over time (p > 0.05). In the CONT group, no significant differences occurred over the time points for either max AP or SWV. In contrast, the RUN group experienced significant changes (p < 0.05) in max AP and SWV.
The results demonstrated significant differences in the data for the RUN group in relation to the max AP diameter. The absolute difference, % difference and the significance of the significant differences in max AP diameter are shown in Table 2.
With regards to measures of SWV, the results demonstrated a significant main effect of Time (p = 0.001), no significant differences between the groups (p > 0.05) but a significant interaction effect of time × group (p = 0.003), implying a significant difference between the measured time points depending on which group a participant was in. The absolute differences and significance values for the SWV data is shown in Table 3 and the mean alterations in SWV for the RUN group are shown in Figure 2. There were no significant differences in the time points for the CONT group (p = 0.614) implying that the SWV data collected for all the participants in the CONT group did not vary significantly over the measured time points and therefore remained stable.
The largest changes in the SWV values were in the RUN group where SWV increased pre-post by 0.27 m/s (2.95%). After this, the SWV decreased by approximately −4.5%, before once again increasing by just over 2%. In contrast to the above changes noted in the RUN group, the largest percentage change experienced in the CONT group was just 0.44%. If considering all the measured time points in relation to the PRE-values, the largest change again was an almost 3% increase measured in the RUN group between pre and post. However, as the POST measure is the only measure to be significantly different from PRE, it would suggest that the SWV measures return to normal after a period of 6 h following an acute 30-min bout of running. The mean increase in SWV following the exercise bout was 0.27 m/s, followed by a decrease between the post measure and 6 h measure of −0.43 m/s with the range of increase being between 0.05–0.81 m/s.
The largest changes in the SWV values were in the RUN group in the POST measure which was taken immediately after the 30 min run, with SWV increasing by 0.27 m/s (2.95%). The SWV value appears to rise immediately after exercise followed by a compensatory drop of −0.43 m/s (−4.56%), 6 h after exercise compared to the measure taken at POST. The SWV measure in the RUN group taken at 6 h post exercise is below that taken prior to exercise (as seen in Figure 1), but as it is not significantly different from the PRE value, it can be said that SWV values return to baseline levels after a period of 6 h following 30-min of running.

4. Discussion

This study is the first to trace the stiffness of the human AT in vivo over the course of a normal working day using SWE and to compare SWE results between dominant and non-dominant legs. This study also examined whether an acute bout of running for a period of 30 min leads to any significant alterations in SWV values experienced in the AT in vivo as measured using SWE. The main findings of this study advance our understanding of SWE by showing that measures taken on healthy asymptomatic ATs experience no significant alterations in the SWV (and hence stiffness) measured in either the dominant or non-dominant AT of participants. The data also demonstrates that healthy ATs do not experience significant alterations in SWV (and hence stiffness) throughout the day indicating that time of day does not need to be considered when performing repeated scans of the AT in varying clinic appointment times. Our data also provides clear evidence that in comparison to a control group, a significant increase in SWV was apparent immediately after a 30 min run. The implications of these results are that a prior bout of physical activity may initiate changes within the physical properties of the AT that could result in a significantly different SWV measure. A clinician should be aware of the possibility of obtaining a significantly increased SWV measure from the AT using SWE if 30 min of weight bearing exercise has been performed within the previous 6 h. The responses to longer periods of tendon loading on SWV, and its time course have not been investigated and may merit further enquiry.
The purpose of assessing the impact of time of day on SWE measures was to examine whether time of day should be considered when performing repeated scans of the AT for diagnosis or during treatment. Although this study did not encompass a whole 24 h period, it does relate directly to times where most clinical assessment is likely to occur, providing direct significance for the clinical usage of SWE. This study examined the SWV experienced within healthy, asymptomatic ATs over the course of a working day using times similar to those used in previous research [2,3], with measures taken at 08:00 h, 12:30 h and 17:00 h. This study explicitly controlled for out of the ordinary, intense/heavy exercise both before and during the testing period and allowed insight into stiffness changes throughout the day. The results of this study will be important when considering the use of SWE for both early diagnosis and monitoring of recovery, which would likely have a clinical impact on not only long-term rehabilitation but also return to activities, specifically in high-level athletes [33].
Previous research has reported decreases in tendon stiffness throughout the course of the day to the magnitude of 20.2% and 21% [2,3]. It was hypothesised these decreases in stiffness were attributed to either hormonal changes or the action of general mobilisation throughout the day [2]. The results of this study however, were markedly different, with the individual changes showing no systematic change in stiffness and the magnitude of change in tendon stiffness was only approximately 2%. These changes were not statistically significant and therefore this study can report no change in tendon stiffness with time of day. The decrease in tendon stiffness noted above, between morning and evening, was only shown to be true when tendon stiffness was calculated at low force levels (calculated from the gradient of the tangent over force levels corresponding to 1205N). However, when tendon stiffness was calculated a high force levels (100% MVC), there was no significant change noted between morning and evening (p = 0.10). This finding was potentially attributed to the fact that when measured during MVC, the tendon was stretched to a position on its curve where stiffness is highest [2]. Differences between the previous research and this study which may provide some rationale for the differences in findings include the tendon being examined (patella vs AT), the method of obtaining stiffness measures (ultrasonography and isokinetic dynamometer vs SWE) and differences in populations studies (purely male cohort vs mixed sex cohort). SWE as a methodology has been validated against traditional tensile testing [36] and the results of this study showed no significant differences between the SWV of males and females, so the use of a differing cohort should not impact the results.
To assess the effect of leg dominance on SWE measures of the AT, the dominant and non-dominant ATs of each participant were identified [38], with the majority of people identifying their right foot as being dominant [39]. As an association between full rupture in the AT and micro-tear formation has been previously shown, it would indicate that the ATs of the dominant side will be more at risk of both micro-tear and full rupture [48]. This increase in micro-tears is hypothesised to result in tendon hypertrophy as the tendon constantly repairs and remodels itself [48], which would explain a higher cross-sectional area of tendon noted in athletes compared to the general population [26]. An increased thickness can also be a result of short-term injury which can result in tendon thickening in an attempt to reduce stress [28].
Some research has shown no significant variation in the length of the AT between dominant and non-dominant ankles [38], however in contrast, other authors have found the length of the free AT of the dominant leg to be significantly greater than the non-dominant leg [39]. These two studies also differ in their findings in relation to the cross-sectional area of the AT. One study found no significant difference in the average cross-sectional area of the free AT between legs [39] whereas others demonstrate cross-sectional area to be significantly larger in dominant ankles [38], which can impact stiffness. The Bohm et al. (2015) reported no significant differences between the sides in tendon stiffness (N/mm) [39] as found in this current study. In the present study, no noted significant differences (p > 0.05) in stiffness measures were obtained with SWE were found in healthy, asymptomatic subjects with no history of symptomatic Achilles tendinopathy, between dominant and non-dominant tendons.
The mean increase in SWV following the exercise bout was 0.27 m/s with the range of increase for all participants being between 0.05–0.81 m/s. This was followed by a decrease between the post measure and 6 h measure of −0.43 m/s. These alterations were shown to be statistically significant, therefore just 30 min of running was shown to significantly increase SWV by 0.27 m/s, and therefore increase AT stiffness. Studies using UTC have shown that exercise leads to a change in tendon structure in both race horses and humans [25,49] when tendons were measured prior to the bout of exercise, then again one, two and four days after the exercise bout. Changes in the structure of the tendon may be expected to affect its mechanical properties, e.g., tendon stiffness and this study adds some support to that notion as exercise resulted in a significantly increased measure of SWV, even after an acute bout of exercise lasting 30 min. In the UTC study involving human participants, the authors concluded that exercise resulted in a short-duration (72 h period) and fully reversible response of the tendon which occurred with no loss of integrity of the collagen matrix [25]. Alterations in the extra-cellular matrix of the tendon including an increase in cytoplasmic organelles for increased protein production, in particular proteoglycans, which are associated with an increase in bound water can result in an increase in cross-sectional area after exercise [28]. This study however, demonstrated that a 30-min acute bout of running exercise resulted in a decrease in maximum anterior-posterior tendon thickness (mm) following an acute bout of exercise. This decrease in tendon thickness has also been shown in other research and hypothesised to be attributed to a loss of fluid from the tendon to the peritendinous space caused by the mechanical load inducing increased hydrostatic pressure [10]. This temporary ‘dehydration’ within the tendon could be a potential cause of differences found in SWV, as it may affect tissue density.
Alterations in tendon mechanical properties including increases in stiffness may be the bodies response to a new level of loading and potentially aid in reducing tendon damage caused by mechanical fatigue [50]. An increased level of stiffness detected immediately after an acute mechanical load, may allow for less extension of the tendon [50] which potentially may help reduce macro-trauma risk. Previous research demonstrated that in young healthy ATs, an acute bout of eccentric exercise resulted in a significant increase in AT stiffness as measured with SWE [51]. Other studies however show that a single 30-min bout of running did not impact the stiffness of the AT and concluded that the mechanical properties of tendons remain constant throughout locomotion [23]. The research of Farris et al. utilised the same number of participants as in this study, but required participants to complete a 30-min run at a set pace of 12 km/ph. This speed was selected as being representative of a recreational run, as all participants said they were recreational runners, therefore the speed of the run between these studies could have varied. In contrast to Farris et al., this study utilised a self-paced run, asking participants to maintain an RPE level between 13–15 to ensure the run was the same subjective intensity for all participants. The mechanical properties of the ATs of each subject in the Farris study were recorded both before and after the run during a series of hops, with tendon stiffness estimated using the traditional format using AT length data obtained using an ultrasound probe secured to the participants leg using bandaging tape and AT force as measured using force plates [23]. In contrast, this study utilised SWE. Reductions in tendon stiffness following unaccustomed acute bouts of exercise may increase injury risk [10], however the participants in this study all self-reported as being moderately active on a regular basis in activities that involved running, and who therefore should have been accustomed to this dose and manner of exercise used.
This study is the first to use SWE to trace alterations in AT stiffness in vivo over the course of a day, the first to compare AT stiffness between dominant and non-dominant standing leg ATs and the first to use SWE to assess alterations in AT stiffness in vivo following an acute bout of running. As with all studies, it does carry some limitations including a saturation limit to the measures the Siemens ACUSON S3000™ HELX EVOLUTION Ultrasound System (Siemens Medical Solutions, USA) can obtain. SWVs above 10 m/s simply return a value of ‘High’. Although there were very few ‘High’ values noted throughout data collection, it is not possible to say how fast the SWV was for these measures, therefore any measures returned as ‘High’ were discounted from the study. This study examined variation in the AT of 15 healthy subjects to assess leg dominance and time of day, based on the numbers used in previous literature (range 8–12 subjects) as a guideline [2,3,52]. The impact of these variables on SWE data has not been previously examined and therefore replicating the number of subjects from previous research was the best starting place. The impact of exercise on SWE measures has also not been previously studied and therefore it is not possible to complete an accurate power analysis. Therefore 12 participants were analysed, to match the number used in very similar research [23]. However, this leads to a limitation of the study, that is, the use of a relatively small homogenous sample. Despite this, 10 data points (ROIs) were taken from each elastogram at each testing session and there were three testing sessions in the time of day section (08:00 h, 12:00 h and 17:00 h) and six in the exercise section. Therefore, the total numbers of measures taken from all participants over the course of the testing and included in the analysis for this study is over 1500 measures, a number much higher than that used in previous research. All participants were considered healthy and free of lower limb injury. This was considered important as until the normal variations within healthy tendons are established and some baseline clinical values recorded, it will be impossible to establish what is normal, acceptable change, versus pathological change and therefore, of concern. It is however not possible to generalize the results from this study to any symptomatic individuals with pathology or who fall outside the tested age range. Future research should define other populations based on age, sex or other covariates expected to influence stiffness as well as examining the results obtained from pathological samples. It is worth noting here the limitations of SWE with regards to anisotropy, as SWE utilises ultrasound to trace the propagation of generated shear waves, so with ultrasound scanning, a controlled angle of the transducer to the skin is crucial in obtaining an accurate image and obtaining reliable values for SWE. Shear waves propagate more readily along longitudinal fibres than they do across them [36] and therefore it has been noted that the transducer for SWE should be orientated parallel to the direction of the fibres being assessed to ensure the most accurate results [53]. Our own previous work [54] also demonstrated that certain protocols can be utilised when using SWE to assess the stiffness of the human Achilles tendon in vivo to standardise the measurements and obtain the most accurate results. These include using longitudinal images and keeping the foot in a relaxed position whilst scanning.
The exercise mode utilised in this study was running, however other modes of exercise such as stretching have been shown to also significantly alter tendon stiffness over short time periods [13]. It would be of great interest to look at the impact other types of exercise have on the SWV in the AT in comparison to those found with running. Lastly, whilst the results of this study and other similar research [25] would indicate that the running-induced increase in AT stiffness is a temporary effect, other research does link long term adaptation of tendons to long term exercise training. There are currently no studies that trace the stiffness of an AT from sedentary to long term duration running, and none that have studied the AT stiffness of a long-term runner who stops training and therefore future research could elaborate on this.
In conclusion, this is the first study to utilise SWE to assess differences in leg dominance, trace the stiffness of the human AT in vivo during a normal working day and assess the impact of an acute bout of running. The results indicate that leg dominance does not affect SWE results in asymptomatic, healthy tendons, therefore the contra-lateral tendon may be used as a comparison for clinical investigation for this population. The time of day that a SWE measure is taken does not significantly alter AT stiffness and does not influence the measured values by more than 2.07%. Therefore, clinical appointments can be scheduled between 08:00 h and 17:00 h without affecting the measures taken, improving appointment accessibility when using SWE. Lastly, this study has shown that a 30-min run has no impact on AT length, however it does result in significant decreases in max AP diameter and significant increases in SWV measures, a surrogate measure of stiffness. The measured max AP diameter and SWV measures return to PRE-like values when measured 6 h after the exercise. This knowledge is vital to clinicians and researchers who will need to consider the presence of previous exercise when scanning with SWE as activity may potentially lead to misleading results.

Author Contributions

Conceptualization, C.P.; Data curation, C.P.; Formal analysis, C.P.; Investigation, C.P.; Methodology, C.P., P.W. and N.W.; Project administration, C.P.; Resources, C.P.; Software, C.P.; Supervision, P.W. and N.W.; Validation, C.P.; Visualization, C.P.; Writing-original draft, C.P.; Writing-review and editing, C.P., P.W. and N.W.

Funding

This research was supported by the University of Brighton who funded the studentship and purchased the necessary equipment.

Conflicts of Interest

The authors declare no conflict of interest.

References

  1. Joseph, M.F.; Lillie, K.R.; Bergeron, D.J.; Deneqar, C.R. Measuring Achilles Tendon Mechanical Properties: A Reliable, Non-invasive method. J. Strength Cond. Res. 2012, 26, 2017–2020. [Google Scholar] [CrossRef] [PubMed]
  2. Pearson, S.J.; Onambele, G.N.L. Influence of time of day on tendon compliance and estimations of voluntary activation levels. Muscle Nerve 2006, 33, 792–800. [Google Scholar] [CrossRef] [PubMed]
  3. Onambele-Pearson, N.L.G.; Pearson, S.J. Time-of-day effect on patella tendon stiffness alters vastus lateralis fascicle length but not the quadriceps force-angle relationship. J. Biomech. 2007, 40, 1031–1037. [Google Scholar] [CrossRef] [PubMed]
  4. Khan, K.M.; Scott, A. Mechanotherapy: How physical therapists’ prescription of exercise promotes tissue repair. Br. J. Sports Med. 2009, 43, 247–252. [Google Scholar] [CrossRef] [PubMed]
  5. Tuite, D.J.; Renström, P.A.F.H.; O’Brien, M. The aging tendon. Scand. J. Med. Sci. Sports 2007, 7, 72–77. [Google Scholar] [CrossRef]
  6. Curwin, S. Rehabilitation after tendon injuries. In Tendon Injuries: Basic Science and Clinical Medicine; Maffulli, N., Renstrom, P., Leadbetter, W., Eds.; Springer International Publishing: London, UK, 2005; pp. 242–267. [Google Scholar]
  7. Kjaer, M. Role of extracellular matrix in adaptation of tendon and skeletal muscle to mechanical loading. Physiol. Rev. 2004, 84, 649–698. [Google Scholar] [CrossRef] [PubMed]
  8. Wang, J.H. Mechanobiology of tendon. J. Biomech. 2006, 39, 1563–1582. [Google Scholar] [CrossRef] [PubMed]
  9. Magnusson, S.P.; Narici, M.V.; Maganaris, C.N.; Kiaer, M. Human tendon behaviour and adaptation, in vivo. J. Physiol. 2008, 586, 71–81. [Google Scholar] [CrossRef] [PubMed] [Green Version]
  10. Obst, S.J.; Barrett, R.S.; Newsham-West, R. Immediate effect of exercise on achilles tendon properties: Systematic review. Med. Sci. Sports Exerc. 2013, 45, 1534–1544. [Google Scholar] [CrossRef] [PubMed]
  11. Burgess, K.E.; Graham-smith, P.; Pearson, S.J. Effect of Acute Tensile Loading on Gender-Specific Tendon Structural and Mechanical Properties. J. Orthop. Res. 2009, 27, 510–516. [Google Scholar] [CrossRef] [PubMed]
  12. Kato, E.; Kanehisa, H.; Fukunaga, T.; Kawakami, Y. Changes in ankle joint stiffness due to stretching: The role of tendon elongation of the gastrocnemius muscle. Eur. J. Sport Sci. 2010, 10, 111–119. [Google Scholar] [CrossRef]
  13. Morse, C.I.; Degens, H.; Seynnes, O.R.; Maqanaris, C.N.; Jones, D.A. The acute effect of stretching on the passive stiffness of the human gastrocnemius muscle tendon unit. J. Physiol. 2008, 586, 97–106. [Google Scholar] [CrossRef] [PubMed] [Green Version]
  14. Kubo, K.; Kanehisa, H.; Fukunaga, T. Effects of transient muscle contractions and stretching on the tendon structures in vivo. Acta Physiol. Scand. 2002, 175, 157–164. [Google Scholar] [CrossRef] [PubMed]
  15. Kay, A.D.; Blazevich, A.J. Isometric contractions reduce plantar flexor moment, Achilles tendon stiffness, and neuromuscular activity but remove the subsequent effects of stretch. J. Appl. Physiol. 2009, 107, 1181–1189. [Google Scholar] [CrossRef] [PubMed] [Green Version]
  16. Kay, A.D.; Blazevich, A.J. Concentric muscle contractions before static stretching minimize, but do not remove, stretch-induced force deficits. J. Appl. Physiol. 2010, 108, 637–645. [Google Scholar] [CrossRef] [PubMed] [Green Version]
  17. Kubo, K.; Kanehisa, H.; Kawakami, Y.; Fukunaga, T. Influence of static stretching on viscoelastic properties of human tendon structures in vivo. J. Appl. Physiol. 2001, 90, 520–527. [Google Scholar] [CrossRef] [PubMed]
  18. Nakamura, M.; Ikezoe, T.; Takeno, Y.; Ichihashi, N. Acute and prolonged effect of static stretching on the passive stiffness of the human gastrocnemius muscle tendon unit in vivo. J. Orthop. Res. 2011, 29, 1759–1763. [Google Scholar] [CrossRef] [PubMed] [Green Version]
  19. Park, D.Y.; Rubenson, J.; Carr, A.; Mattson, J.; Besier, T.; Chou, L.B. Influence of Stretching and Warm-Up on Achilles Tendon Material Properties. Foot Ankle Int. 2011, 32, 407–413. [Google Scholar] [CrossRef] [PubMed]
  20. Mademli, L.; Arampatzis, A.; Walsh, M. Effect of muscle fatigue on the compliance of the gastrocnemius medialis tendon and aponeurosis. J. Biomech. 2006, 39, 426–434. [Google Scholar] [CrossRef] [PubMed]
  21. Mademli, L.; Arampatzis, A. Mechanical and morphological properties of the triceps surae muscle-tendon unit in old and young adults and their interaction with a submaximal fatiguing contraction. J. Electromyogr. Kinesiol. 2008, 18, 89–98. [Google Scholar] [CrossRef] [PubMed]
  22. Mizuno, T.; Matsumoto, M.; Umemura, Y. Viscoelasticity of the muscle-tendon unit is returned more rapidly than range of motion after stretching. Scand. J. Med. Sci. Sports 2013, 23, 23–30. [Google Scholar] [CrossRef] [PubMed]
  23. Farris, D.J.; Trewartha, G.; McGuigan, M.P. The effects of a 30-min run on the mechanics of the human Achilles tendon. Eur. J. Appl. Physiol. 2012, 112, 653–660. [Google Scholar] [CrossRef] [PubMed]
  24. Peltonen, J.; Cronin, N.J.; Avela, J.; Finni, T. In vivo mechanical response of human Achilles tendon to a single bout of hopping exercise. J. Exp. Biol. 2010, 213, 1259–1265. [Google Scholar] [CrossRef] [PubMed] [Green Version]
  25. Rosengarten, S.D.; Cook, J.L.; Bryant, A.L.; Cordy, J.T.; Daffy, J.; Docking, S.I. Australian football players’ Achilles tendons respond to game loads within 2 days: An ultrasound tissue characterisation (UTC) study. Br. J. Sports Med. 2015, 49, 183–187. [Google Scholar] [CrossRef] [PubMed]
  26. Kongsgaard, M.; Aagaard, P. Structural Achilles tendon properties in athletes subjected to different exercise modes and in Achilles tendon rupture patients. J. Appl. Physiol. 2005, 99, 1965–1971. [Google Scholar] [CrossRef] [PubMed] [Green Version]
  27. Docking, S.I.; Cook, J. Pathological tendons maintain sufficient aligned fibrillar structure on ultrasound tissue characterization (UTC). Scand. J. Med. Sci. Sports 2015, 26, 1–9. [Google Scholar] [CrossRef] [PubMed]
  28. Cook, J.L.; Purdam, C.R. Is tendon pathology a continuum? A pathology model to explain the clinical presentation of load-induced tendinopathy. Br. J. Sports Med. 2009, 43, 409–416. [Google Scholar] [CrossRef] [PubMed]
  29. Hoskins, P.R. Principles of ultrasound elastography. Ultrasound 2012, 20, 8–15. [Google Scholar] [CrossRef]
  30. Aubry, S.; Risson, J.; Kastler, A.; Barbier-Brion, B.; Siliman, G.; Runge, M.; Kastler, B. Biomechanical properties of the calcaneal tendon in vivo assessed by transient shear wave elastography. Skelet. Radiol. 2013, 42, 1143–1150. [Google Scholar] [CrossRef] [PubMed]
  31. Arda, K.; Ciledag, N.; Aktas, E.; Aribas, B.K.; Köse, K. Quantitative assessment of normal soft-tissue elasticity using shear-wave ultrasound elastography. AJR Am. J. Roentgenol. 2011, 197, 532–536. [Google Scholar] [CrossRef] [PubMed]
  32. Kot, B.C.W.; Zhang, Z.J.; Lee, A.W.C.; Leung, V.Y.; Fu, S.N. Elastic modulus of muscle and tendon with shear wave ultrasound elastography: Variations with different technical settings. PLoS ONE 2012, 7, e44348. [Google Scholar] [CrossRef] [PubMed] [Green Version]
  33. Chen, X.; Cui, L.; He, P.; Shen, W.W.; Qian, Y.J.; Wang, J.R. Shear wave elastographic characterization of normal and torn achilles tendons a pilot study. J. Ultrasound Med. 2013, 32, 449–455. [Google Scholar] [CrossRef] [PubMed]
  34. Peltz, C.D.; Haladik, J.A.; Divine, G.; Siegal, D.; van Holsbeeck, M.; Bey, M.J. ShearWave elastography: Repeatability for measurement of tendon stiffness. Skelet. Radiol. 2013, 42, 1151–1156. [Google Scholar] [CrossRef] [PubMed]
  35. Miyamoto, N.; Hirata, K.; Kanehisa, H.; Yoshitake, Y. Validity of measurement of shear modulus by ultrasound shear wave elastography in human pennate muscle. PLoS ONE 2015, 10, e0124311. [Google Scholar] [CrossRef] [PubMed]
  36. Eby, S.F.; Song, P.; Chen, S.; Chen, Q.; Greenleaf, J.F.; An, K.N. Validation of shear wave elastography in skeletal muscle. J. Biomech. 2013, 46, 2381–2387. [Google Scholar] [CrossRef] [PubMed] [Green Version]
  37. Siu, W.; Chan, C.; Lam, C.; Lee, C.M.; Ying, M. Sonographic evaluation of the effect of long-term exercise on Achilles tendon stiffness using shear wave elastography. J. Sci. Med. Sport 2016, 19, 883–887. [Google Scholar] [CrossRef] [PubMed]
  38. Pang, B.; Ying, M. Sonographic measurement of Achilles tendons in asymptomatic subjects. J. Ultrasound Med. 2006, 25, 1291–1296. [Google Scholar] [CrossRef] [PubMed]
  39. Bohm, S.; Mersmann, F.; Marzilger, R.; Schroll, A.; Arampatzis, A. Asymmetry of Achilles tendon mechanical and morphological properties between both legs. Scand. J. Med. Sci. Sports 2015, 25, 124–132. [Google Scholar] [CrossRef] [PubMed]
  40. Purcell, S.B.; Schuckman, B.E.; Docherty, C.L.; Schrader, J.; Poppy, W. Differences in ankle range of motion before and after exercise in 2 tape conditions. Am. J. Sports Med. 2009, 37, 383–389. [Google Scholar] [CrossRef] [PubMed]
  41. Keles, S.B.; Sekir, U.; Gur, H.; Akova, B. Eccentric/concentric training of ankle evertor and dorsiflexors in recreational athletes: Muscle latency and strength. Scand. J. Med. Sci. Sports 2014, 24, e29–e38. [Google Scholar] [CrossRef] [PubMed]
  42. Wu, Y.-K.; Lien, Y.-H.; Lin, K.-H.; Shih, T.T.; Wang, T.G.; Wang, H.K. Relationships between three potentiation effects of plyometric training and performance. Scand. J. Med. Sci. Sports 2010, 20, e80–e86. [Google Scholar] [CrossRef] [PubMed]
  43. Borg, G. Psychophysical bases of perceived exertion. Med. Sci. Sport Exerc. 1982, 14, 377–381. [Google Scholar] [CrossRef]
  44. Payne, C.; Webborn, N.; Watt, P.; Cercianani, M. Poor reproducibility of compression elastography in the Achilles tendon: Same day and consecutive day measurements. Skelet. Radiol. 2017, 46, 889–895. [Google Scholar] [CrossRef] [PubMed]
  45. Beyer, R.; Kongsgaard, M.; Hougs Kjaer, B.; Øhlenschlæger, T.; Kjær, M.; Magnusson, S.P. Heavy Slow Resistance Versus Eccentric Training as Treatment for Achilles Tendinopathy: A Randomized Controlled Trial. Am. J. Sports Med. 2015, 43, 1704–1711. [Google Scholar] [CrossRef] [PubMed]
  46. Ianculescu, V.; Ciolovan, L.M.; Dunant, A.; Vielh, P.; Mazouni, C.; Delaloge, S.; Dromain, C.; Blidaru, A.; Balleyguier, C. Added value of Virtual Touch IQ shear wave elastography in the ultrasound assessment of breast lesions. Eur. J. Radiol. 2014, 83, 773–777. [Google Scholar] [CrossRef] [PubMed]
  47. Doherty, J.R.; Trahey, G.E.; Nightingale, K.R.; Palmeri, M.L. Acoustic radiation force elasticity imaging in diagnostic ultrasound. IEEE Trans. Ultrason. Ferroelectr. Freq. Control 2013, 60, 685–701. [Google Scholar] [CrossRef] [PubMed]
  48. Gibbon, W.W.; Cooper, J.R.; Radcliffe, G.S. Sonographic incidence of tendon microtears in athletes with chronic Achilles tendinosis. Br. J. Sports Med. 1999, 33, 129–130. [Google Scholar] [CrossRef] [PubMed] [Green Version]
  49. Docking, S.I.; Daffy, J.; van Schie, H.T.M.; Cook, J.L. Tendon structure changes after maximal exercise in the Thoroughbred horse: Use of ultrasound tissue characterisation to detect in vivo tendon response. Vet. J. 2012, 194, 338–342. [Google Scholar] [CrossRef] [PubMed]
  50. Buchanan, C.I.; Marsh, R.L. Effects of exercise on the biomechanical, biochemical and structural properties of tendons. Comp. Biochem. Physiol. A Mol. Integr. Physiol. 2002, 133, 1101–1107. [Google Scholar] [CrossRef]
  51. Leung, W.K.C.; Chu, K.L.; Lai, C. Sonographic evaluation of the immediate effects of eccentric heel drop exercise on Achilles tendon and gastrocnemius muscle stiffness using shear wave elastography. Peer J. 2017, 5, e3592. [Google Scholar] [CrossRef] [PubMed]
  52. Chino, K.; Akagi, R.; Dohi, M.; Fukashiro, S.; Takahashi, H. Reliability and validity of quantifying absolute muscle hardness using ultrasound elastography. PLoS ONE 2012, 7, e45764. [Google Scholar] [CrossRef] [PubMed]
  53. Brandenburg, J.E.; Eby, S.F.; Song, P.; Zhao, H.; Brault, J.S.; Chen, S.; An, K.N. Ultrasound elastography: The new frontier in direct measurement of muscle stiffness. Arch. Phys. Med. Rehabil. 2014, 95, 2207–2219. [Google Scholar] [CrossRef] [PubMed]
  54. Payne, C.; Watt, P.; Cercignani, M.; Webborn, N. Reproducibility of shear wave elastography measures of the Achilles tendon. Skelet. Radiol. 2017, 47, 1–6. [Google Scholar] [CrossRef]
Figure 1. Longitudinal shear wave elastogram of the right Achilles tendon taken from a 24-year-old male participant. The image shows 10 regions of interest (ROI’s) used to collect shear wave elastography data with the corresponding values in m/s shown to the right of the image highlighted in the red circle.
Applsci 08 01170 g001
Figure 2. Alterations in average SWV measures in the RUN group over the measured time points with significant differences included. * = p < 0.05.
Applsci 08 01170 g002
Table 1. AT Length (mm), AT maximum anterior-posterior (Max A-P) diameter (mm) and SWV at all measured time points for both RUN and CONT group.
PREPOST6 h POST24 h POST48 h POST72 h POST
RUN AT Length (mm)44.3 ± 11.245.0 ± 11.244.8 ± 11.344.1 ± 11.144.3 ± 11.144.1 ± 10.8
CONT AT Length (mm)29.9 ± 5.729.6 ± 6.230.0 ± 5.930.0 ± 5.630.2 ± 5.630.0 ± 5.2
RUN Max AP (mm)4.37 ± 0.274.08 ± 0.194.58 ± 0.294.38 ± 0.264.45 ± 0.314.34 ± 0.28
CONT Max AP (mm)4.66 ± 0.644.69 ± 0.634.63 ± 0.644.71 ± 0.614.63 ± 0.694.66 ± 0.63
RUN SWV (m/s)9.16 ± 0.399.43 ± 0.399.00 ± 0.429.19 ± 0.319.04 ± 0.369.05 ± 0.28
CONT SWV (m/s)9.11 ± 0.239.08 ± 0.229.04 ± 0.269.05 ± 0.229.06 ± 0.219.09 ± 0.22
Table 2. Absolute difference, % difference and p value for the significant differences shown in max AP diameter. * = p < 0.05, ** = p < 0.01.
Absolute Difference% DifferenceSignificance
Pre-Post−0.29 mm−6.64%p = 0.000 **
Pre-6 h0.21 mm4.81%p = 0.042 *
Post-6 h0.50 mm12.25%p = 0.000 **
Post-24 h0.30 mm7.35%p = 0.000 **
Post-48 h0.37 mm9.07%p = 0.000 **
Post-72 h0.26 mm6.37%p = 0.000 **
Post-6 h–Post-24 h−0.20 mm−4.37%p = 0.028 *
Table 3. Absolute difference, % difference and p value for the significant differences shown in SWV. * = p < 0.05.
Absolute Difference% DifferenceSignificance
Pre-Post−0.27 m/s−2.95%P = 0.037 *
Post-6 h−0.43 m/s−4.56%P = 0.019 *
Post-48 h−0.39 m/s−4.14%P = 0.015 *
Post-72 h−0.38 m/s−4.03%P = 0.013 *

