A Novel Bitrate Adaptation Method for Heterogeneous Wireless Body Area Networks
by
 , , and
Krzysztof K. Cwalina
* ,
,
Slawomir J. Ambroziak
,
Piotr Rajchowski
,
Jaroslaw Sadowski
and
Jacek Stefanski
Faculty of Electronics, Telecommunications and Informatics, Gdansk University of Technology, 80-233 Gdansk, Poland
*
Author to whom correspondence should be addressed.
Appl. Sci. 2018, 8(7), 1209; https://doi.org/10.3390/app8071209
Submission received: 6 July 2018
/
Revised: 16 July 2018
/
Accepted: 18 July 2018
/
Published: 23 July 2018
(This article belongs to the Special Issue Body Area Networks)
Abstract
:In the article, a novel bitrate adaptation method for data streams allocation in heterogeneous Wireless Body Area Networks (WBANs) is presented. The efficiency of the proposed algorithm was compared with other known algorithms of data stream allocation using computer simulation. A dedicated simulator has been developed using results of measurements in the real environment. The usage of the proposed adaptive data streams allocation method by transmission rate adaptation based on radio channel parameters can increase the efficiency of resources’ usage in a heterogeneous WBANs, in relation to fixed bitrates transmissions and the use of well-known algorithms. This increase of efficiency has been shown regardless of the mobile node placement on the human body.
1. Introduction
Wireless Body Area Networks (WBANs) can be classified according to the type of radio link between nodes, i.e., in-body, on-body, and off-body communication. In-body communication is realized in radio links, where at least one node is placed inside the human body. Many conducted research works on radio channel analysis in such networks investigate the impact of the internal structure of the human body on radio wave propagation, or the penetration of the radio wave into the human body. The on-body radio link considers communication between the nodes located close to the surface of the same human body. In this article, the research focuses on off-body communication, where the human body interacts with one side of the radio link and the other node is placed at a greater distance outside of the body. This is one of the out-of-body communication cases. The second one is body-to-body communication, where two nodes operate at a distance between two human bodies [1].
WBANs’ topology is usually formed in the so-called star topology, characterized by centralized management, low scalability, limited coverage, and a high failure rate. The failure of the coordinating node implies the malfunction of the entire managed subnet. The typical operational range of such a network is in the range of 3 m to 6 m, and, very rarely, even up to several dozen meters. The other characteristic factor of WBANs is the multiple access method to the transmission medium. The two main methods are: Carrier Sense Multiple Access with Collision Avoidance (CSMA/CA) and Time Division Multiple Access (TDMA). In this article, the TDMA method is considered, due to the assumption of periodic and organized data transmission between the nodes in the network [1,2,3,4,5].
Another type of WBAN classification factor can be the number of radio interfaces (RIs) used in the network node, known as homogeneous and heterogeneous WBANs. A heterogeneous network is defined as a network composed of nodes with many simultaneously operating RIs, where generated data streams should be allocated before transmission via available radio links. Considering this, the effective usage of available time-frequency resources during their work becomes one of the key aspects. The analyzed issue is characteristic not only for the WBANs, but also for Wireless Sensor Networks (WSNs), cellular networks, or cognitive radios [6,7,8,9,10,11,12,13].
In WSNs and WBANs, a static allocation of data streams with fixed physical layer parameters during the operation of the node is usually used. This ensures the reduction of control data redundancy exchanged between nodes in the network, and simplification of the medium access control protocols. Despite these advantages, it is known that the efficiency of using the available time-frequency resources can be increased, for example, by adaptation of transmission bitrate, depending on the variable radio channel parameters or the short-term packet error rate (PER) [14,15,16]. It should be noted that protocol solutions on the network level are already investigated and described in the literature, including dynamic time slots scheduling with distributed or centralized control methods. However, these investigations are limited to homogeneous radio links, which may limit their applicability in heterogeneous networks. Papers [17,18] focus on changes in the rules of timeslot’s assignment in the TDMA network, but without any changes in physical layer parameters, and are also limited to one radio interface only. In contrary, in this paper, the authors proposed an algorithm of adaptive data rate selection without changing the timeslot arrangement.
In the second section, the authors describe algorithms for the adaptive selection of the data rate. The three most commonly known algorithms are briefly presented, indicating their principle of operation and the key characteristics. Additionally, a modification of two algorithms is proposed to counter the consequences of the fast fading phenomenon and to increase their effectiveness.
In the third section, a novel method for adaptive data stream allocation is proposed. The method is dedicated for the heterogeneous WBANs, with at least two simultaneously operating radio interfaces, even if they have different characteristics.
In the fourth section, a heterogeneous WBAN network simulator is presented. It was developed based on real measurements carried out in a harsh environment, in this case, a ferryboat environment. Comparisons with existing simulation software, which is mainly designed for standardized homogeneous sensor networks (e.g., ZigBee or Bluetooth), reveal that the key feature of the developed software is an ability to simulate different characteristics of radio channels for two interfaces at the same time. In addition to the simulator concept, the derivation of its parameters, including statistical analysis of the measurement data, is widely presented.
In the fifth section, a simulation study of the proposed method and other well-known methods is presented. The authors analyzed the effectiveness of the data stream allocation in exemplary heterogeneous WBANs with narrowband (NB) and ultra-wide band (UWB) radio interfaces. It should be noted, that the simulation parameters corresponded to the possible real interfaces’ operation parameters for the WSNs. The higher efficiency of the proposed method was proved by an increased usage of the available resources, keeping the PER for the UWB interface at the same level as for the rest of the algorithms and minimizing it for the NB interface.
The research work is concluded in Section 6. A summary of the obtained research results carried out in the harsh environment is presented. In addition, the limitations of the proposed method and future works are briefly described in accordance to the obtained results from the simulation tool.
2. Related Work
Currently, the main goal of the conducted research is to increase the efficiency of time-frequency resources’ usage, mainly in homogeneous sensor networks or wireless communication networks compliant with the 802.11 standard [16]. Most available algorithms are adapted to use with CSMA/CA and are mainly associated with wireless local area networks. There are also few algorithms that allow a dynamic allocation of data streams in sensor networks that are compliant with the 802.15.4 standard. There are some protocol solutions that consider the dynamic change of bitrate, but their usability is limited only to selected types of networks and applications [16,17,18,19,20,21,22,23,24].
Based on the available literature, several known algorithms have been selected that adaptively allocate data streams in homogeneous networks by dynamic change of the transmission bitrate between pairs of nodes:
The choice of these algorithms was determined by the possibility of their implementation in the off-body WBAN with TDMA. The selected algorithms cover the possibilities of currently used methods of adaptive data rate selection, which are based on the short-term estimation of PER and the radio channel parameters, i.e., the received signal strength and the Link Quality Indicator (LQI) parameter. Similarly to the proposed method, all algorithms listed above are designed for networks with decentralized resource allocation.
The ARF algorithm is widely used in networks that are compliant with the IEEE 802.11 standard. The bitrate for the next transmission is selected based on a short-term estimation of the PER in the source node. The decision on packet loss is made in the case when no acknowledgment from the destination node was received. The bitrate change is performed stepwise, if one of two conditions are met:
- If two successive acknowledgment packets have not been received, the next transmission rate is decreased; and
- if ten consecutive packets have been received, the next transmission rate is increased.
The ALBS algorithm uses the LQI parameter, which can be used only in RI that are compliant with the IEEE 802.15.4 standard [25]. Similarly to the ARF algorithm, transmission with confirmations is required, and a feedback from the destination node affects the decision on the next transmission rate. The authors of the ALBS method defined the following algorithm for handling the transmissions rate in the network:
- (1)
- The source node (SN) starts sending the data with a nominal bitrate of kbps;
- (2)
- the destination node (DN), during the reception of the packet, estimates the quality of the radio link according to the IEEE 802.15.4 standard specification. If the LQI parameter is smaller than the adjusted threshold value, feedback information is sent to the SN, with the suggestion of reducing the bitrate for the next transmission;
- (3)
- the SN decides to reduce the throughput for the next transmissions based on the comparison of the number of feedback packets, , in the time window, with a predetermined threshold value, , of the packets’ number;
- (4)
- the SN decides to increase the throughput of subsequent transmissions if, in the time window, X, it has not received feedback with the suggestion of reducing the bitrate from the SN.
The authors of the ALBS algorithm do not specify the method for determining the algorithms’ parameters. However, their exemplary values have been indicated: , , and .
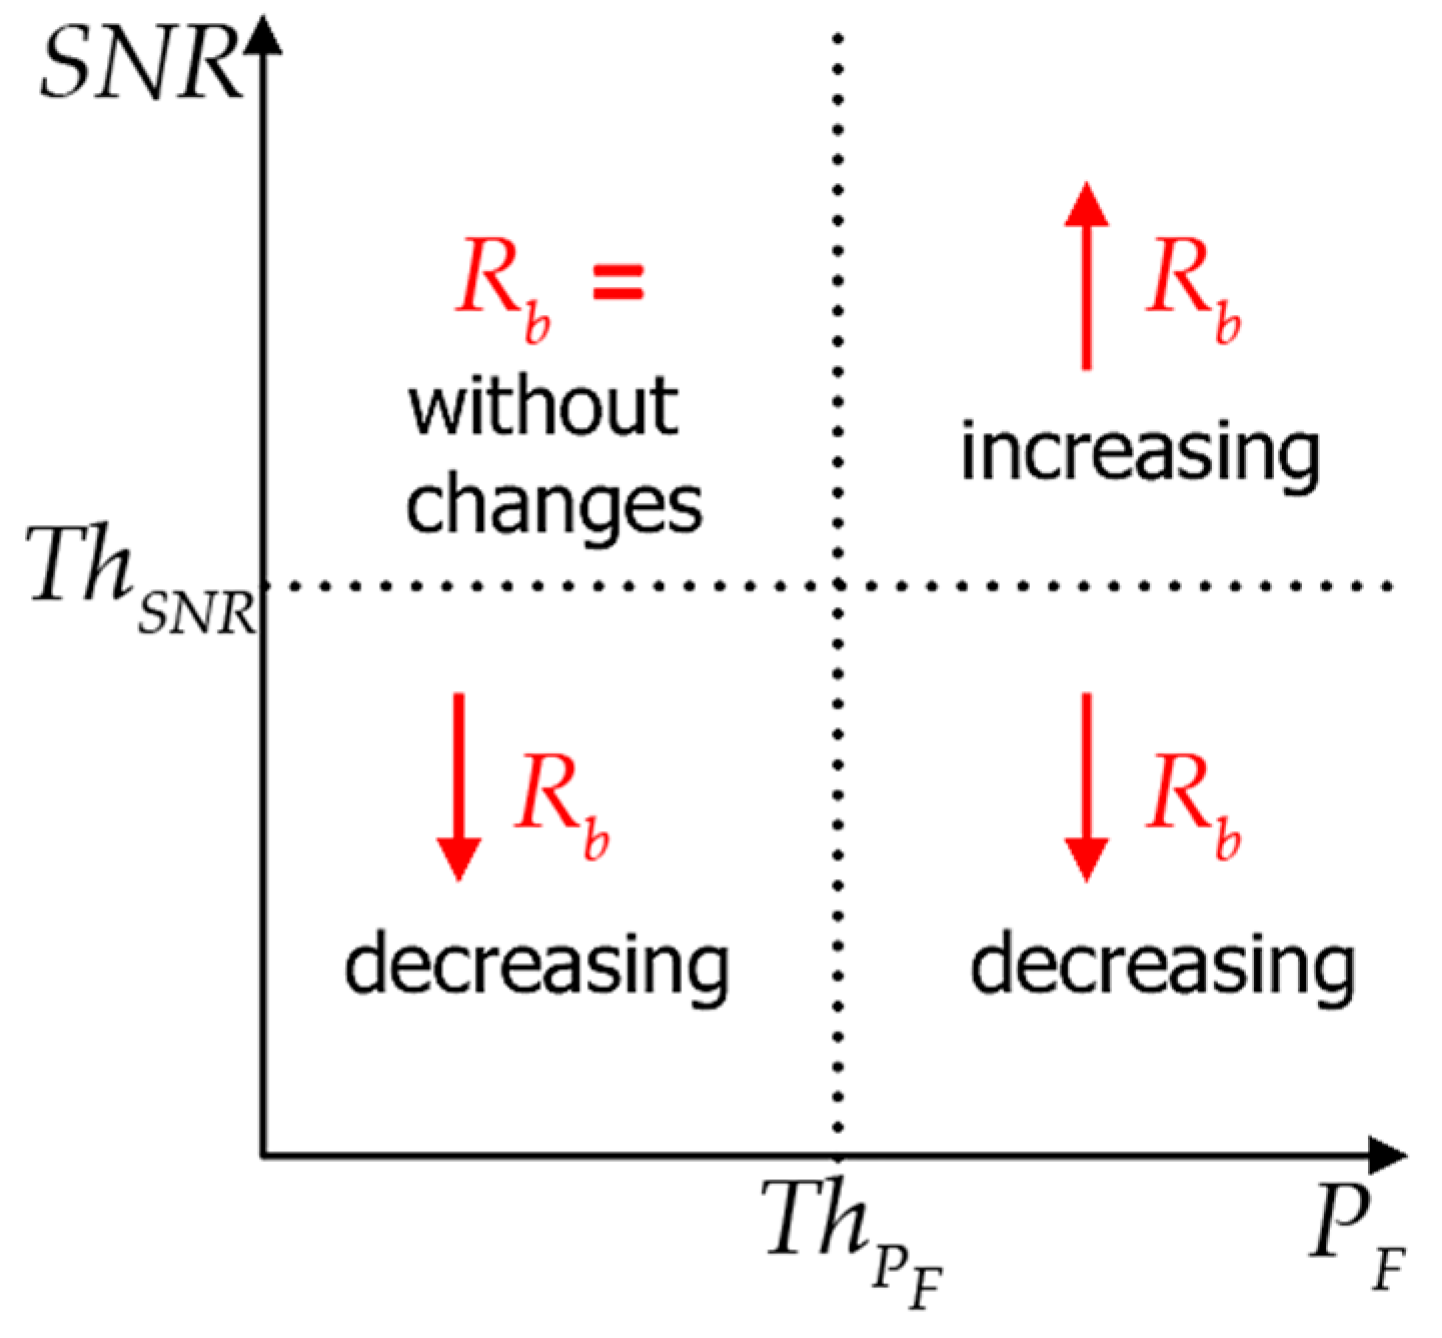
The last chosen algorithm is the LA algorithm, which is intended to work in the WBANs. It uses the probability of packet loss (short-term estimation of the PER) and an estimation of the radio channel quality parameter. The decision on the next transmission bitrate is made on the basis of a single value of the Signal-to-Noise Ratio (SNR) and short-term frame error rate.
The LA algorithm assumes that the SN estimates the SNR based on the received broadcast packets or a transmission confirmation packet. The decision to change the bitrate is made in two stages:
- (1)
- if the estimated SNR is below the specified threshold, then the next transmission rate is reduced;
- (2)
- otherwise, a short-term probability of the correct transmission of the packet, , is determined. It is defined as the ratio of the number of lost acknowledge packets to all sent packets in the 20-frame window. The calculated value is compared with the threshold value, and, based on the comparison result, the throughput for the next transmission may be increased. It is completed based on the assumption that, since the channel quality is good, the losses occur due to the interferences. Thus, to reduce the packet transmission time and the probability of collision, the bitrate should be increased.
As far as the threshold value is fixed during the network operation, the value must be changed depending on the RI parameters and the designated noise characteristics. It should be noted that the radio modems can usually estimate only the Received Signal Strength Indicator (RSSI) instead of the SNR. In this research, the RSSI parameter should be understood strictly as the value of the received signal power. In this case, the algorithm had to be adapted to the capabilities of the used radio module.
The principles of operation of the LA algorithm is presented in Figure 1.
Modification of the Known Methods for Adaptive Data Streams Allocation
In the ALBS and LA algorithms, the decision on the next transmission bitrate is based on the current LQI or RSSI values, which—in high frequency, fading environments—may lead to inefficient usage of the available resources by decreasing the bitrate. For this reason, an original modification of both algorithms, i.e., ALBS MOD and LA MOD, was proposed to counter the consequences of the fast fading phenomenon.
In the proposed modification, the principles of operation of the ALBS and LA algorithms have not been changed, besides the method of the input data processing. The modification is that a shift register, with a length of C, is created, and the output value is calculated as a mean of its current state. This operation is understood as a filtration of the instantaneous values of the LQI and RSSI values in the moving average filter (MAF) [26].
In the proposed modification, the determination of the length, , of the shift register is crucial. Too small of a value results in the final result being more influenced by sudden deviations of the input values, while the too large a length may cause an inertia of the algorithms’ operation. The behavior of the algorithms can be observed, especially, when rapid changes of instantaneous values occurs, for example, during switching between the Line-of-Sight (LOS) or the Non-Line-of-Sight (NLOS) conditions. It was empirically determined that the length of the MAF, , is an acceptable value from the analyzed WBAN point of view, where periodic transmission is assumed.
The results of comparative research on the effectiveness of time-frequency resources using the ALBS and LA algorithms, as well as the modified versions of the ALBS MOD and the LA MOD, are presented in Section 5 of this article. It should be noted that these methods are designed for homogeneous networks. Thus, they were tested in the heterogeneous simulator with independent bitrate adaptation for each RI.
3. Novel Rate Adaptation Method
Considering the limitations of the methods that can be used in heterogeneous WBANs with the TDMA, there is a need to develop a novel method for the allocation of data streams with simultaneously operating RIs.
3.1. The Goal and Assumptions of the Proposed Method
The main goal of the developed method is to increase the efficiency of the available time-frequency resources usage, which is achieved by a local estimation and prediction of the radio channel parameters in the network node. It is assumed that the WBAN works in the TDMA mode without a slot contention stage. Time slots are organized into the fixed-length frames and useful data are generated with a constant or variable bitrate, and they are transmitted periodically. The transmission bitrate control is decentralized, thus, no coordinating node in the network is distinguished. Each pair of nodes establishes the transmission throughput with the Best Effort (BE) model without any traffic classification and priorities. However, the proposed method can be modified for the different data stream classes’ usage. It is also assumed that nodes know a priori the power of signals transmitted by other nodes in the network. The transmitted power is understood as the power at the input of the transmitting antenna. Moreover, each node has two simultaneously operating RIs, i.e., the NB interface working at the 868 MHz frequency and the UWB one working at the 6489 MHz frequency. In the UWB interface, besides the main service, which is the data transmission, it is also possible to perform the radio distance measurements (RDMs) between network’s nodes.
The developed novel adaptive method for the data stream allocation (AMASD) assumes:
- time synchronization of both RIs;
- realization of the RDMs via the UWB interface at the beginning of the time slot;
- the estimation of user motion parameters; and
- the determination of the LOS or NLOS conditions, basing on the impulse response of the UWB channel.
The listed input data, due to the time synchronization of both RIs, are treated as coherent sources of information for both RIs. Information about the estimated channel parameters is obtained based on the acknowledgment packets in the NB interface and the RDMs packets for the UWB one.
Based on the current research and the analysis described in Section 4.2.5, it was decided that the LQI parameter will not be used in the proposed method. It was also experimentally determined that the memory of the AMASD method should not exceed 100 transmissions due to its potential implementation on microcontrollers without high computing power and a data memory. Also, the method itself is designed to operate in real time.
3.2. Proposed Novel Method for Data Streams Allocation
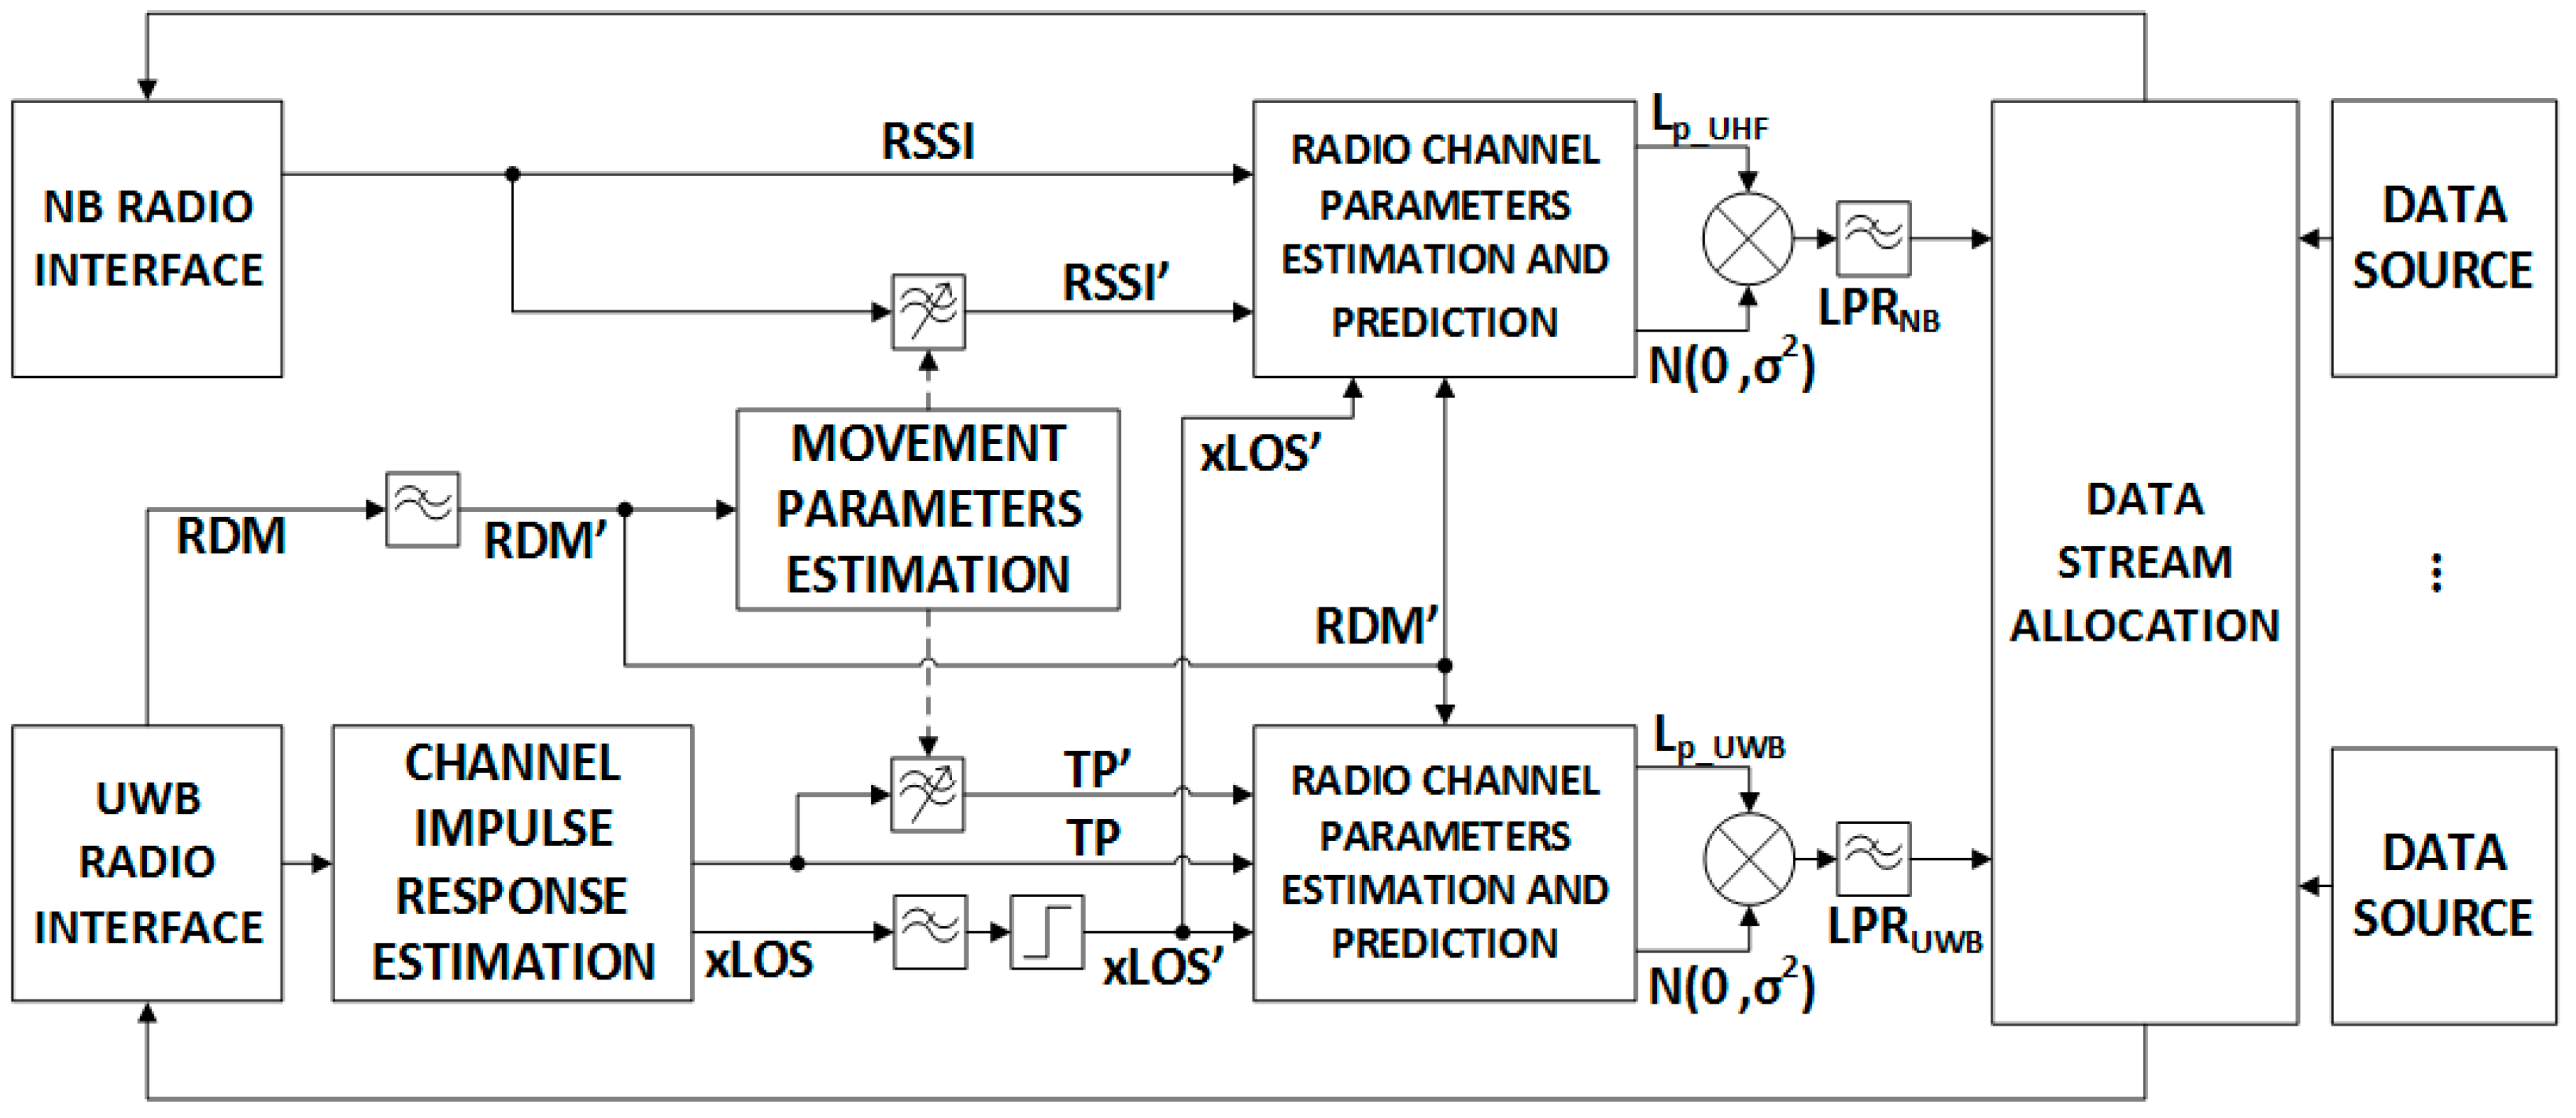
Considering the objectives and assumptions listed above, a new method, AMASD, was developed. The block diagram of the method is shown in the Figure 2.
The developed AMASD method presented in Figure 2 uses the following data for the estimation and prediction of the radio channel parameters:
- RSSI [dBm]) parameter obtained from the NB RI, with a minimum 1 dB measurement resolution required;
- total power (TP) [dBm] obtained from the UWB RI, with a minimum 1 dB measurement resolution required;
- parameter [dB] determines the condition of direct visibility of the radio link antennas, which is obtained based on the UWB channel impulse response (CIR); and
- RDM [m] obtained from the UWB RI, where the error of the distance estimation between the nodes should not exceed 2 m.
The CIR estimation allows the LOS/NLOS conditions to be determined based on the first path power (FPP) and TP. For this purpose, the parameter was defined as [27,28]:
The floating point value was low-pass filtered, which eliminates the false alarms about the change of LOS/NLOS conditions by minimizing the fluctuations of the signal power and the power of the first path difference. The filtration can be carried out using a linear MAF, which is a special case of the finite impulse response (FIR) filter, whose length, , was determined empirically. This filter can be described as follows:
where is the input data vector, and is the output data vector. The MAF, due to its drawbacks, i.e., filter delay, computational complexity, and operational memory demand, can also be replaced by the implementation of a single tap infinite impulse response (IIR) filter [29], expressed as:
where the parameter is the filter coefficient. According to ref. [26], there are many methods to calculate the value of the parameter based on the length of the MAF. One of them is to minimize the function:
Solving numerically Equation (4) for , the value, , that minimizes the function, , for the implementation of the MAF with the length, , is determined.
Then, a binary decision system is used, which is implemented in accordance with the dependence:
where is the binary information about the LOS/NLOS conditions used in the channel estimation and prediction block for grouping system loss data. It should be noted that system loss is understood as the difference in the power delivered to the terminals of the transmitting antenna and the power available at the terminals of the receiving antenna [30].
An innovative element of the developed method was the usage of RDMs for estimating the user motion parameters, and, consequently, performing the spatial filtration of the received power values and a dynamic system loss exponent determination. It was assumed that RDMs were realized at the beginning of the time slot, before sending the user data packet. This mechanism provides an additional function of the proposed algorithm, i.e., the minimization of the data loss probability. This means that if a packet of RDM procedure was lost (e.g., due to fading), user data was not sent in a given time slot due to the high probability of its loss in the same time slot.
The RDMs were performed by using the symmetrical double-sided two-way ranging (SDS-TWR) method, which is compliant with the IEEE 802.15.4-2011 standard [31,32,33]. Some of the physical layer parameters were experimentally adjusted to maximize the accuracy of the distance estimation, i.e., the preamble length: 256 symbols and the pulse repetition frequency (PRF) of 64 MHz [27,28,31,32,33]. The deviation of the RDMs values around the average value was additionally minimized by applying low-pass filtration (3) with .
The calculation of the differences in the results of successive RDMs, carried out with a constant and known repetition period, allows the speed component of the node to be determined (movement of the node with respect to the stationary one). Based on the speed value, the parameters of two low-pass filters for the RSSI and TP signals were determined. Output values of these filters were used to estimate the fading parameters of the radio channels. According to [34], the fading parameters of these signals can be determined based on the instantaneous system loss values by applying an appropriate filtration (2), where its length, , corresponds to 10λ, with λ as the wavelength. Since the developed method should work in real time, it was decided to choose the length of the filter to be equivalent to a single wavelength, λ. It causes a slight decrease in the accuracy of the spatial data filtration, but also a reduction in its delay.
By using (4) it is possible to determine the parameter of both filters as a function of the user’s speed for the selected transmission frequency. The speed of human motion is in the range from 0.5 mps to 1.5 mps, which implies the selection of 40 ms transmission time intervals, suitable for monitoring and tracking systems operating in indoor environments [35,36]. As the wavelength for the UWB interface is about 4.6 cm, it is over seven times shorter than for the NB interface (34.6 cm). As was expected, the value of the coefficient for the UWB RI is higher than for the NB one, and it is contained in a three-element set {0.382; 0.534; 1}. According to (3), should be interpreted as a lack of data filtration. For the NB RI, the value of the coefficient was in the range of [0.074; 0.208].
In the case when the user is standing or moving at a speed lower than 0.5 mps, the filtration parameter was set as follows: for the NB RI and for the UWB RI. This choice is determined by the fact that the errors of RDMs affects the estimated non-zero speed of the user’s movement, even when the user is standing, therefore, the minimum value was limited. For both values, it is possible to store several dozen values of filter coefficients for the estimated parameters of the person’s movement, which significantly reduces the computational complexity of the proposed AMASD method.
Then, the data sets are sent to separate blocks of channel parameters estimation and prediction. With the knowledge of the transmitted signal power, and according to [34,37,38,39,40], the system loss exponent, , and the mean system loss values can be determined according to the following formula:
where the distance, , is the result of RDMs. To determine these parameters, linear regression was used.
Since the implemented spatial filtration of the empirical data corresponds to a single wavelength, λ, it was assumed that system loss values, , were calculated for the RSSI’ and TP’ values after the filtration. It is equivalent to determining the channel parameters for empirical values, partially taking into account the radio shadowing effect [34]. However, for , the channel parameters were determined based on the empirical values that consider both the large-scale fading and the small-scale fading, which may adversely affect the obtained system loss prediction. In the next step, the difference, , of the instantaneous values of RSSI/TP and system loss given by (6) was calculated. Then, the variance of the normal distribution, , of was determined. The variance was calculated using the unbiased maximum likelihood estimator (MLE) [41], which can be expressed as follows:
where is the mean of the obtained values. Depending on the estimated conditions of the direct visibility, the data were grouped and the described methodology was applied to them, independently of each other. Consequently, the algorithm quickly reacts to the actual change of these conditions and adapts to them. The low-pass filtration before the data stream allocation block limits the impact of the small-scale fading on the system loss prediction, quickly reacting at the same time to the systematic changes of the attenuation, e.g., by the LOS/NLOS transition.
The last element of the AMASD method is the data stream allocation block, which is based on the number of current and previous data bytes from data sources, and on the information about predicted radio channel parameters. It selects the bitrate for the RIs and allocates data for transmission in another time slot in accordance to the designated noise characteristics of both RIs for a PER at a level of 10−3. For example, these characteristics can be approximated by the linear functions, i.e., the received power as a function of bitrate, then, the bitrate, , can be determined as follows:
where is the power of the transmitted signal, is the predicted value of the system loss, is the slope of the noise characteristic function, and is the intercept term of this function. If the noise characteristic is discontinuous, the obtained value calculated from (8), wherein , is compared with the values of this function and the maximum bitrate for the next transmission, satisfying the condition, is selected. The determined value of the bitrate () must be within a specified range, , depending on the given RI characteristic.
In summary, the proposed AMASD method uses global information about the distance between the nodes and the LOS/NLOS conditions in the RIs. The RDM’s are used to estimate the user’s movement parameters and, based on the results, the adaptive low-pass filtration of the received signal power estimators from RIs and the LOS/NLOS conditions parameter values is performed. The obtained values are analyzed in the radio channel parameters estimation and prediction block, where the system loss exponent is determined dynamically and separately for the LOS/NLOS conditions. The predicted system loss is then sent to the data stream allocation block, where the bitrate of the next transmission is determined based on the noise characteristics of each RI.
4. Heterogeneous WBAN Simulator
The analysis of the selected algorithms’ usefulness for the adaptive bitrate control requires the development of a reliable simulator of a heterogeneous WBAN for off-body communication. Reliable is understood as the most accurate representation of the real phenomena occurring in these types of networks, starting from the mean system loss, through distribution of fading, and ending with the distribution of RDMs values.
In current research, the efficiency analysis of the adaptive bitrate algorithms is carried out using simulators that enable the determination of channel parameters, deployment of network nodes, or the implementation of communication protocols. These simulators, e.g., OMNeT++, NetworkSimulator, enable effective multidimensional analysis of sensor networks for the same propagation environments, without a time-consuming implementation of individual algorithms on the real devices. It allows the comparison of all methods under the same conditions, which gives a reliable assessment of their usefulness and efficiency.
However, constantly evolving simulation software is mainly designed for standardized homogeneous sensor networks, e.g., ZigBee or Bluetooth. The implementation of a heterogeneous WBAN, which uses previously described methods of adaptive data streams allocation, would be very difficult. For this reason, the authors have taken the task of developing an original simulation tool. The results of the real measurements as the input parameters of the simulator were used. Thus, it enables a reliable reconstruction of the radio link specificity of a heterogeneous WBAN, including the radio channel parameters, variable user movement speed, corridor design, or simultaneous operation of the NB and UWB RIs.
4.1. Performance Evaluation Metrics
To analyze the efficiency of the chosen methods, metrics for assessing the effectiveness of the usage of the available time-frequency resources, including the root mean square (RMS), mean useful rate, , and PER, were determined.
RMS is expressed as follows:
where n is the number of transmissions, is the bitrate values representing the maximum use (bound) of available time-frequency resources, which is determined based on the knowledge of the radio channel parameters during the next transmission. The value of is the obtained useful rate expressed as follows:
where is the transmission rate when the packet is received correctly.
The mean useful rate, , metric is expressed as:
where is the obtained useful transmission rate in a single time slot and n is the number of slots.
The PER is defined as:
where is the number of lost packets, while the number of all transmitted packets.
4.2. The Results of Measurements Used in the Simulator
Most currently designed WBANs are used in indoor environments in which radio wave propagation is significantly disturbed compared to outdoor ones. This is mainly due to the stronger multipath propagation phenomena. For this reason, it was decided to carry out the measurements in a harsh environment, i.e., the passenger ferryboat.
Since the AMASD method is based on the radio channel characteristics, the determination of its parameters is the key element. However, developing a reliable WBAN simulator also requires consideration of other aspects that are related, in particular, to the used RIs. These are:
- The accuracy of RDMs,
- the probability of the correct detection of the LOS conditions,
- the dependence of the LQI on the RSSI,
- the noise characteristics of both RIs.
4.2.1. Measurement Stand and Scenarios
In [42], the measurement stand and measurement scenarios are presented in detail. In this section, only the key information will be highlighted. All measurement scenarios for off-body communication were implemented by attaching the stationary reference node (RN) to the corridor wall. A single mobile node (MN) was placed on the body of a moving person who was walking along the axis of a narrow corridor. The measurements were carried out for two dynamic scenarios (SCN), i.e., approaching (APR) and departing (DEP), with relation to the RN.
Each mobile and reference node was heterogeneous, in the sense that it had two simultaneously working, time synchronized radio interfaces:
From the many typically selected placements for wearable devices, three were selected as representative for WBAN applications, including heart rate monitors, multimedia glasses, wireless headphones, smartwatches, etc. [2,44]. These are: the right side of the head (HER), the front of the chest (TOF), and the left wrist (ABL).
4.2.2. System Loss Model
Based on the results presented in [42], the adapted system loss model can be expressed as follows:
where:
- —random variable with lognormal distribution, which represents the power of the large-scale fading, caused by the body shadowing effect, where and are the mean value and standard deviation of this distribution, respectively;
- —random variable with lognormal distribution, which represents the amplitude of the small-scale fading, caused by the multipath effect, where and are the mean value and standard deviation of this distribution, respectively.
In Table 1, the parameters for the LOS and NLOS conditions for both radio channels in the ferryboat environment are presented.
4.2.3. Accuracy of Radio Distance Measurements
It is known that the RDMs contain some measurement error [31,45]. Based on the results presented in [45], it was necessary to determine the RDM error function, which will compensate the mean error, based on all the results obtained in the NLOS conditions. The slope, , as well as the intercept term, , of the linear RDM error function were determined empirically. It is also important to define the distribution of the estimated distance error due to the usage of the RDM results in the proposed AMASD method.
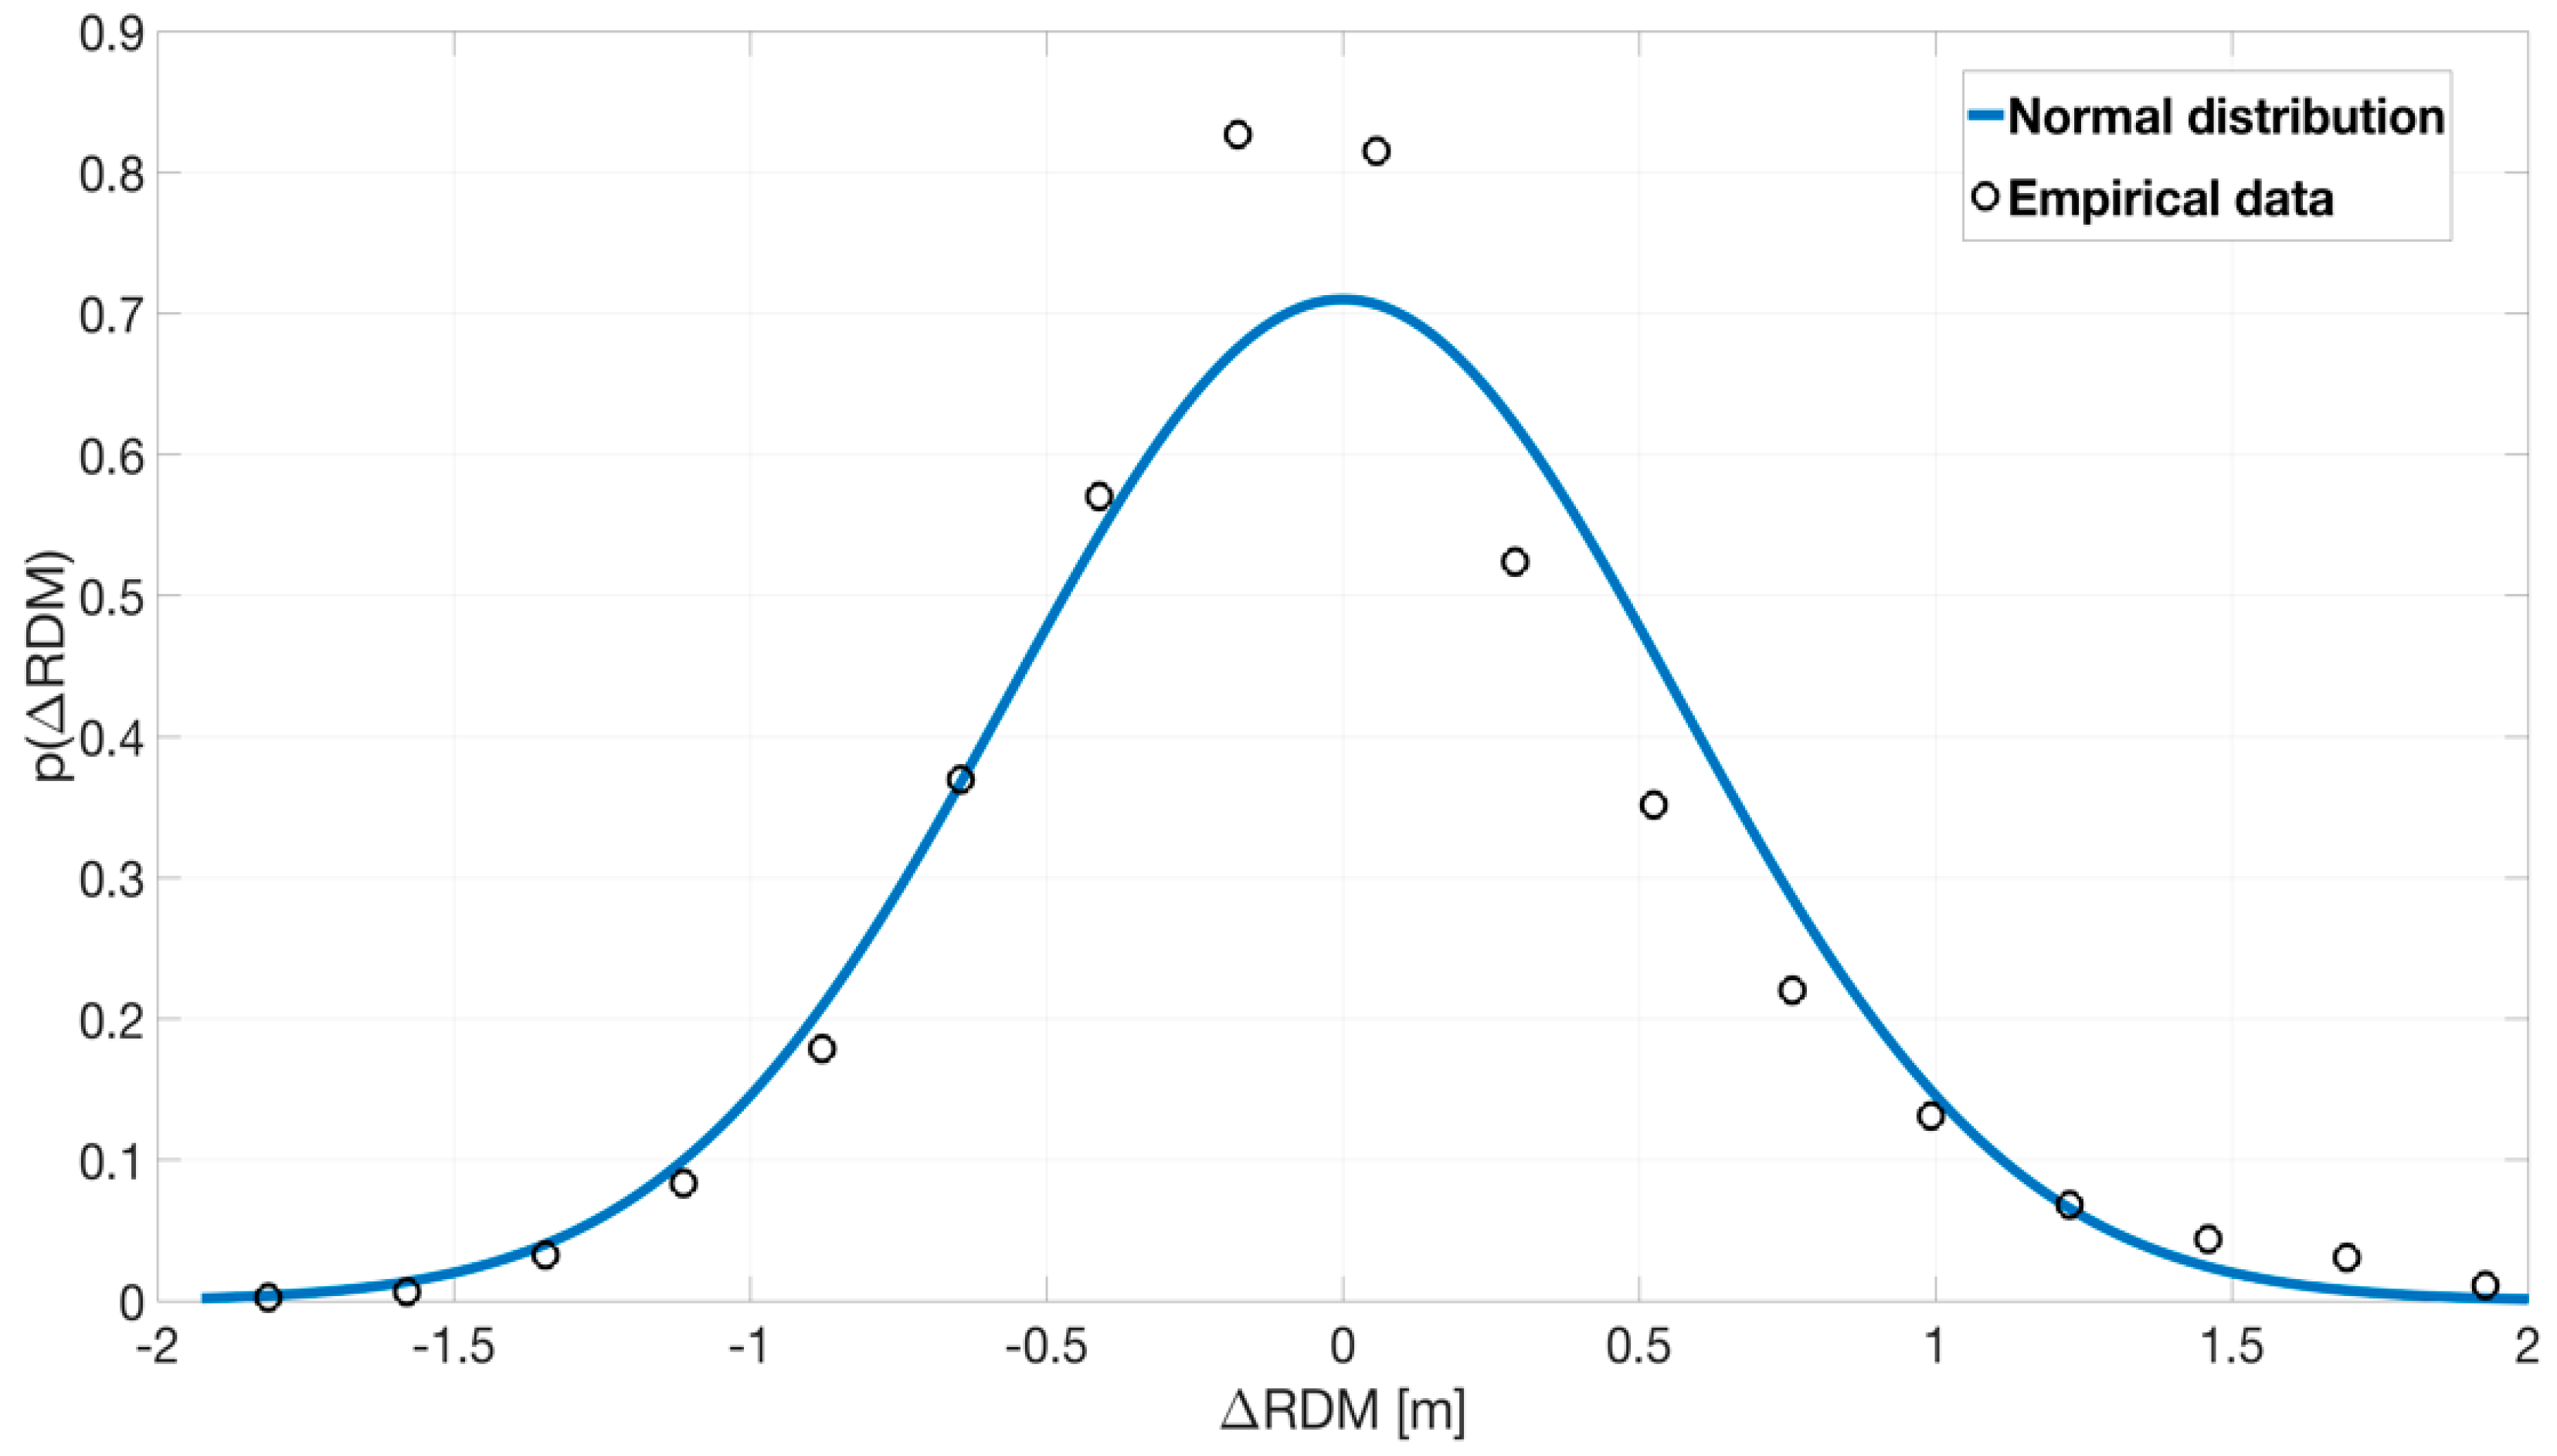
According to the measurement accuracy of the SDS-TWR method with the DWM1000 modules [31], the distribution of errors around the average value for stationary scenarios can be modelled by a normal distribution. It was assumed that for the analyzed off-body communication, and for dynamic scenarios, the distribution of this error could also be described with the Gaussian distribution, while the parameters will be different for each scenario. The error was determined by subtracting the empirical values of the RDMs from the output values of the MAF, with the length. In Figure 3, an example of an empirical error probability density function (PDF) around the average value with a fitted normal distribution for one of the measurement scenarios is presented.
The values of standard deviations, , of the fitted normal distributions to the empirical values of the distance estimation error for all measurement scenarios were determined and are presented in Table 2. The mean values for all analyzed cases are close to zero. However, the linear RDM error function (with and parameters mentioned earlier) should be considered during simulation of the distribution of the RDMs values in the NLOS conditions.
As expected, for all measurement scenarios, the RDMs error values are higher for the NLOS conditions. This is due to the very strong attenuation of the direct propagation component. The highest standard deviation value of 0.43 m in the LOS conditions was obtained for the chest placement of the MN, which can be explained by the full obstruction of the direct visibility of the MN and RN antennas by the human body. Similarly, the standard deviation equal to 0.66 m was obtained for the NLOS conditions.
4.2.4. The Probability of the Correct Detection of the Direct Visibility Conditions
According to (1), the difference in the estimated TP value and the estimated FPP value allows the determination of the conditions of direct visibility of the MN and the RN antennas. Determination of the LOS/NLOS condition is used as a factor for conditioning the assignment of other obtained parameters, e.g., the radio channel attenuation. In the real propagation environment, it is not possible to detect the LOS/NLOS conditions with 100% probability due to the fluctuations of the signal amplitudes, channel frequency selectivity, and the multipath phenomena. It was decided to compare this probability, which determines the quality of the AMASD method, based on the raw parameter, i.e., , and based on the filtered parameter, i.e., , as described in Section 3. In Table 3, the results of the probabilities for all the measurement scenarios estimated based on the known geometry of the corridor and the RDMs are presented.
In all cases, the probability of detecting the LOS/NLOS conditions, , based on the raw data is greater than 0.83. However, considering the importance of this data and the principle of operations of the AMASD method, this is a value below the 0.95 acceptability threshold set by the authors. Therefore, it was decided to apply a low-pass filtration (3) to minimize fluctuations in the TP and the FPP difference, which is affected by the rapid change of the propagation conditions. The filtration allows the acceptable probability values of to be obtained and, therefore, it was used in the proposed AMASD method presented in Figure 2.
4.2.5. Link Quality Indicator
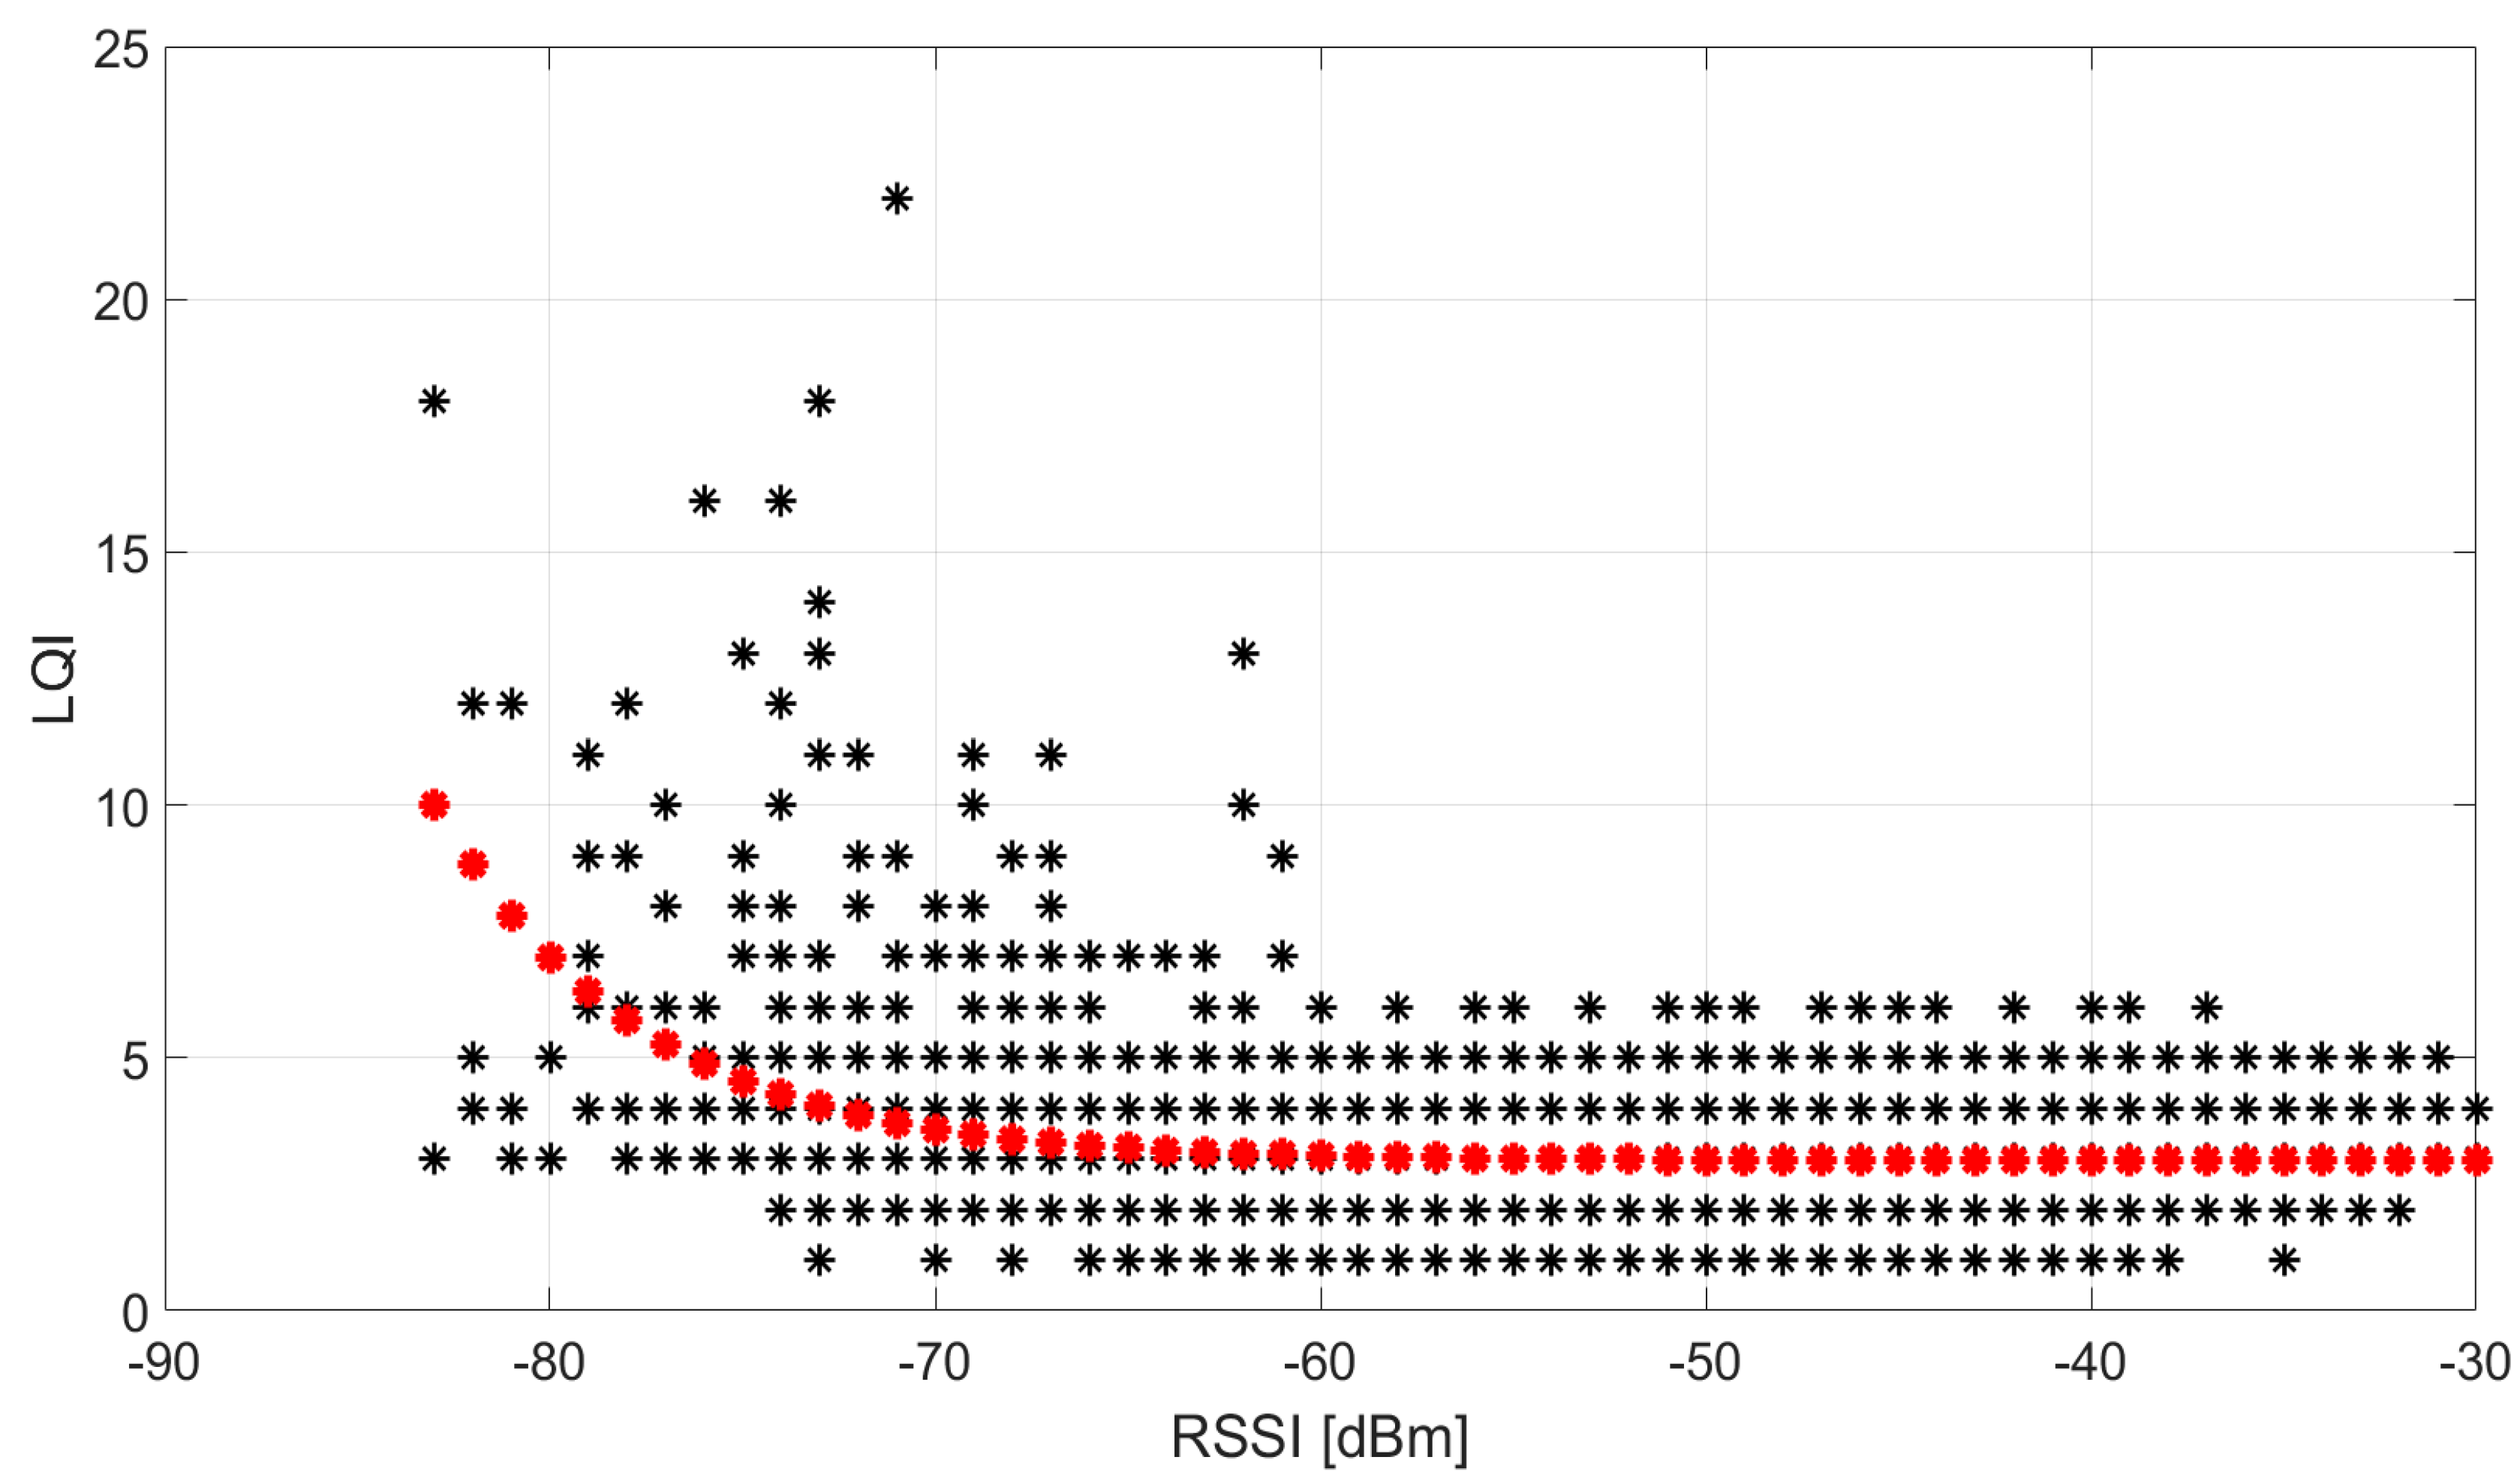
The LQI parameter, defined in the IEEE 802.15.4 standard, aims at a parametric evaluation of the power and/or quality of the received packet. From the current research, it appears that this parameter is very often coupled with the RSSI, and there is an exponential relationship between them [46].
The information about the LQI parameter, time synchronized with the RSSI value, was obtained from the NB interface. Therefore, an exponential regression function was fitted:
where b, c, and d are the parameters of this function. In Figure 4, a graph of the exponential regression function fitted (red) to the empirical measurement data (black) from all scenarios is presented.
The values of the LQI are not strongly dependent on the RSSI values. However, small changes in the case of low RSSI values in the NLOS conditions can be seen. The estimated parameters of the exponential function are: , , and . The LQI values’ distribution around the fitted regression function is described by the normal distribution, with an average value of and a standard deviation , which indicates a small dispersion of them around the fitted regression function.
The presented results confirm that, for the analyzed WBAN where there are no interferences from other networks, the LQI cannot be a parameter that determines the allocation of data streams in the NB interface. It is also expected that the ALBS algorithm using this parameter to allocate data streams will obtain worse results, in relation to the other methods, due to the lack of the LQI changes, regardless of the received signal power.
4.2.6. Noise Characteristics of the Radio Interfaces
Simulations of the WBANs or WSNs requires the determination of the signal power level, which implies the boundary correct reception of the packets [21,22]. The issue of adaptive allocation of the data streams by means of a dynamic change of transmission rate requires estimating the noise characteristics of the NB and UWB interfaces as a function of the bitrate. It was decided that these noise characteristics should be measured, without considering the values given by manufacturers [26,27,43]. This allowed a better representation of the real PER in the analyzed WBAN.
The measurements of both RIs were carried out in an indoor environment, obtaining about 50,000 values for the selected transmission rates, i.e.,
- 50 kbps, 100 kbps, and 200 kbps for the NB interface;
- 850 kbps and 6800 kbps for the UWB interface.
The measured data set allowed the noise characteristics of both RIs for PER at 10−3, 10−2, and 10−1 levels at selected transmission bitrates to be determined.
The NB interface is characterized by the possibility of a smooth change of bitrate in the range of 10 kbps–200 kbps. Therefore, the measured noise characteristic is represented by a liner function, which is determined using a linear regression, minimizing the SEE between the maximal points of normal distributions fitted to the empirical data obtained for selected bitrates. In Figure 5, the method for determining the noise characteristics of the NB interface from empirical measurements for an exemplary PER = 10−3 is presented.
However, the value of the slope of the determined linear function is , and the intercept term is dependent on the PER, i.e., for PER = 10−3, for PER = 10−2, and for PER = 10−1.
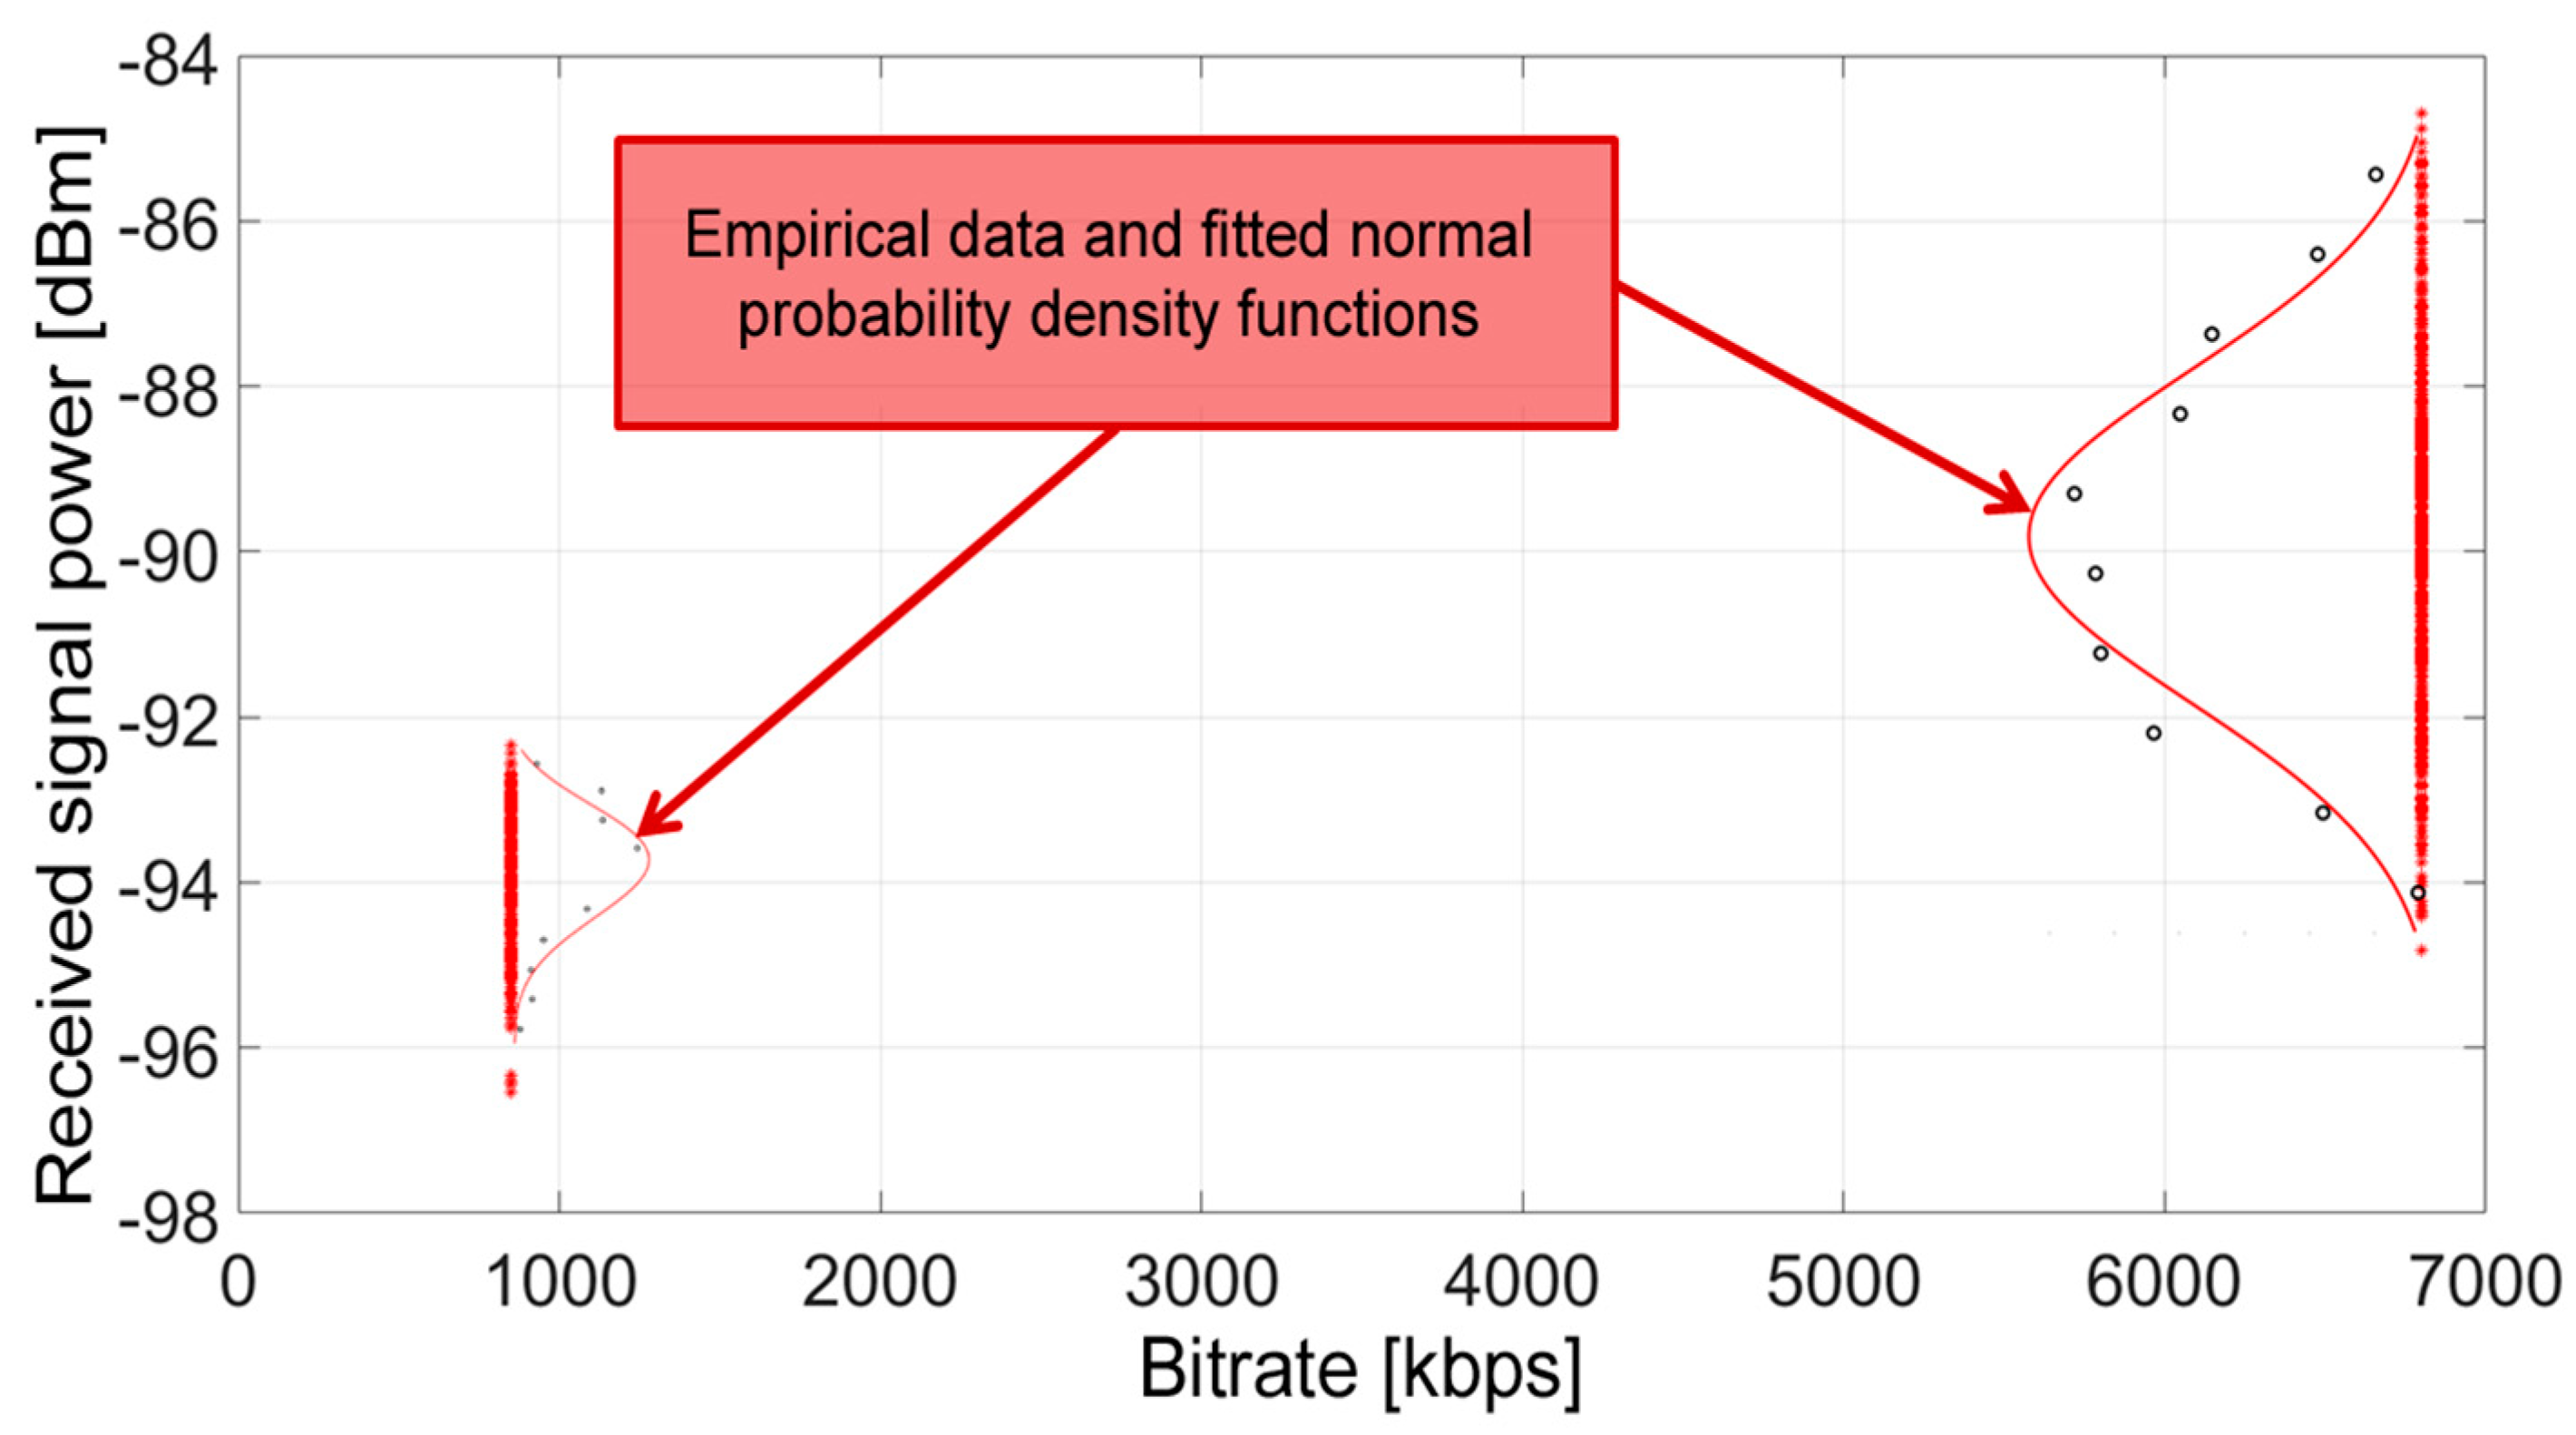
A similar method was used for the UWB interface—the only difference is that it takes only discrete values for two rates, in accordance with the capabilities of the DWM1000 module [27,28]. The average value, µ, of the fitted normal distribution to the empirical data was assumed as a threshold value for PER. This method, for an exemplary PER = 10−3, is graphically presented in Figure 6.
The obtained discrete noise characteristic values of the UWB interface are and for PER = 10−3, and for PER = 10−2, and and for PER = 10−1.
Descriptions of research works and simulations of WBANs and WSNs found in the literature often assume that the decision of the lost packet is based on a single threshold value of the interfaces’ noise characteristics. Thus, the probability of receiving the packet, , can be determined by:
where is the received signal strength, and the threshold value, , should be chosen from the set of determined noise characteristic values for the selected bitrate. This is because, in real conditions, the receipt of a packet with a certain power level is a random event, which is confirmed by different thresholds for different fixed PER levels. The differentiation in the packet received probability as a function of several power thresholds was proposed as follows:
where the threshold values, , , and , are obtained from the set of noise characteristics at a different PER level for the selected bitrate, and the functions, and , have a linear form, representing the probability distribution between the thresholds of the determined PERs. This way of modelling the probability of receiving a packet can be understood as a so-called fuzzy logic method. In this research, the threshold values, , , and , are calculated in accordance with the described noise characteristics values depending on the selected PER values related to the bitrate.
5. Simulation Studies and Analysis of the Obtained Results
To reliably determine the usefulness of the analyzed methods dedicated for WBANs operating in variable propagation conditions, a scenario representing a movement along an L-shaped corridor with both LOS and NLOS conditions was analyzed. The initial parameters of the WBAN included the transmitted signal power, the number of network nodes, and the duration of a single time slot. In addition, the initial throughputs for the NB interface and the number of available thresholds (an important parameter of known methods for adaptive data stream allocation, i.e., ARF, ALBS, LA) were set. As it was previously mentioned, for the UWB interface, there were only two bitrates available.
It was decided to determine the optimal value, in terms of the cumulative RMS value of the network throughput, of the bitrate threshold number that should be used to maximize the efficiency of the analyzed algorithms (besides the AMASD, which smoothly changes the bitrate in a determined range).
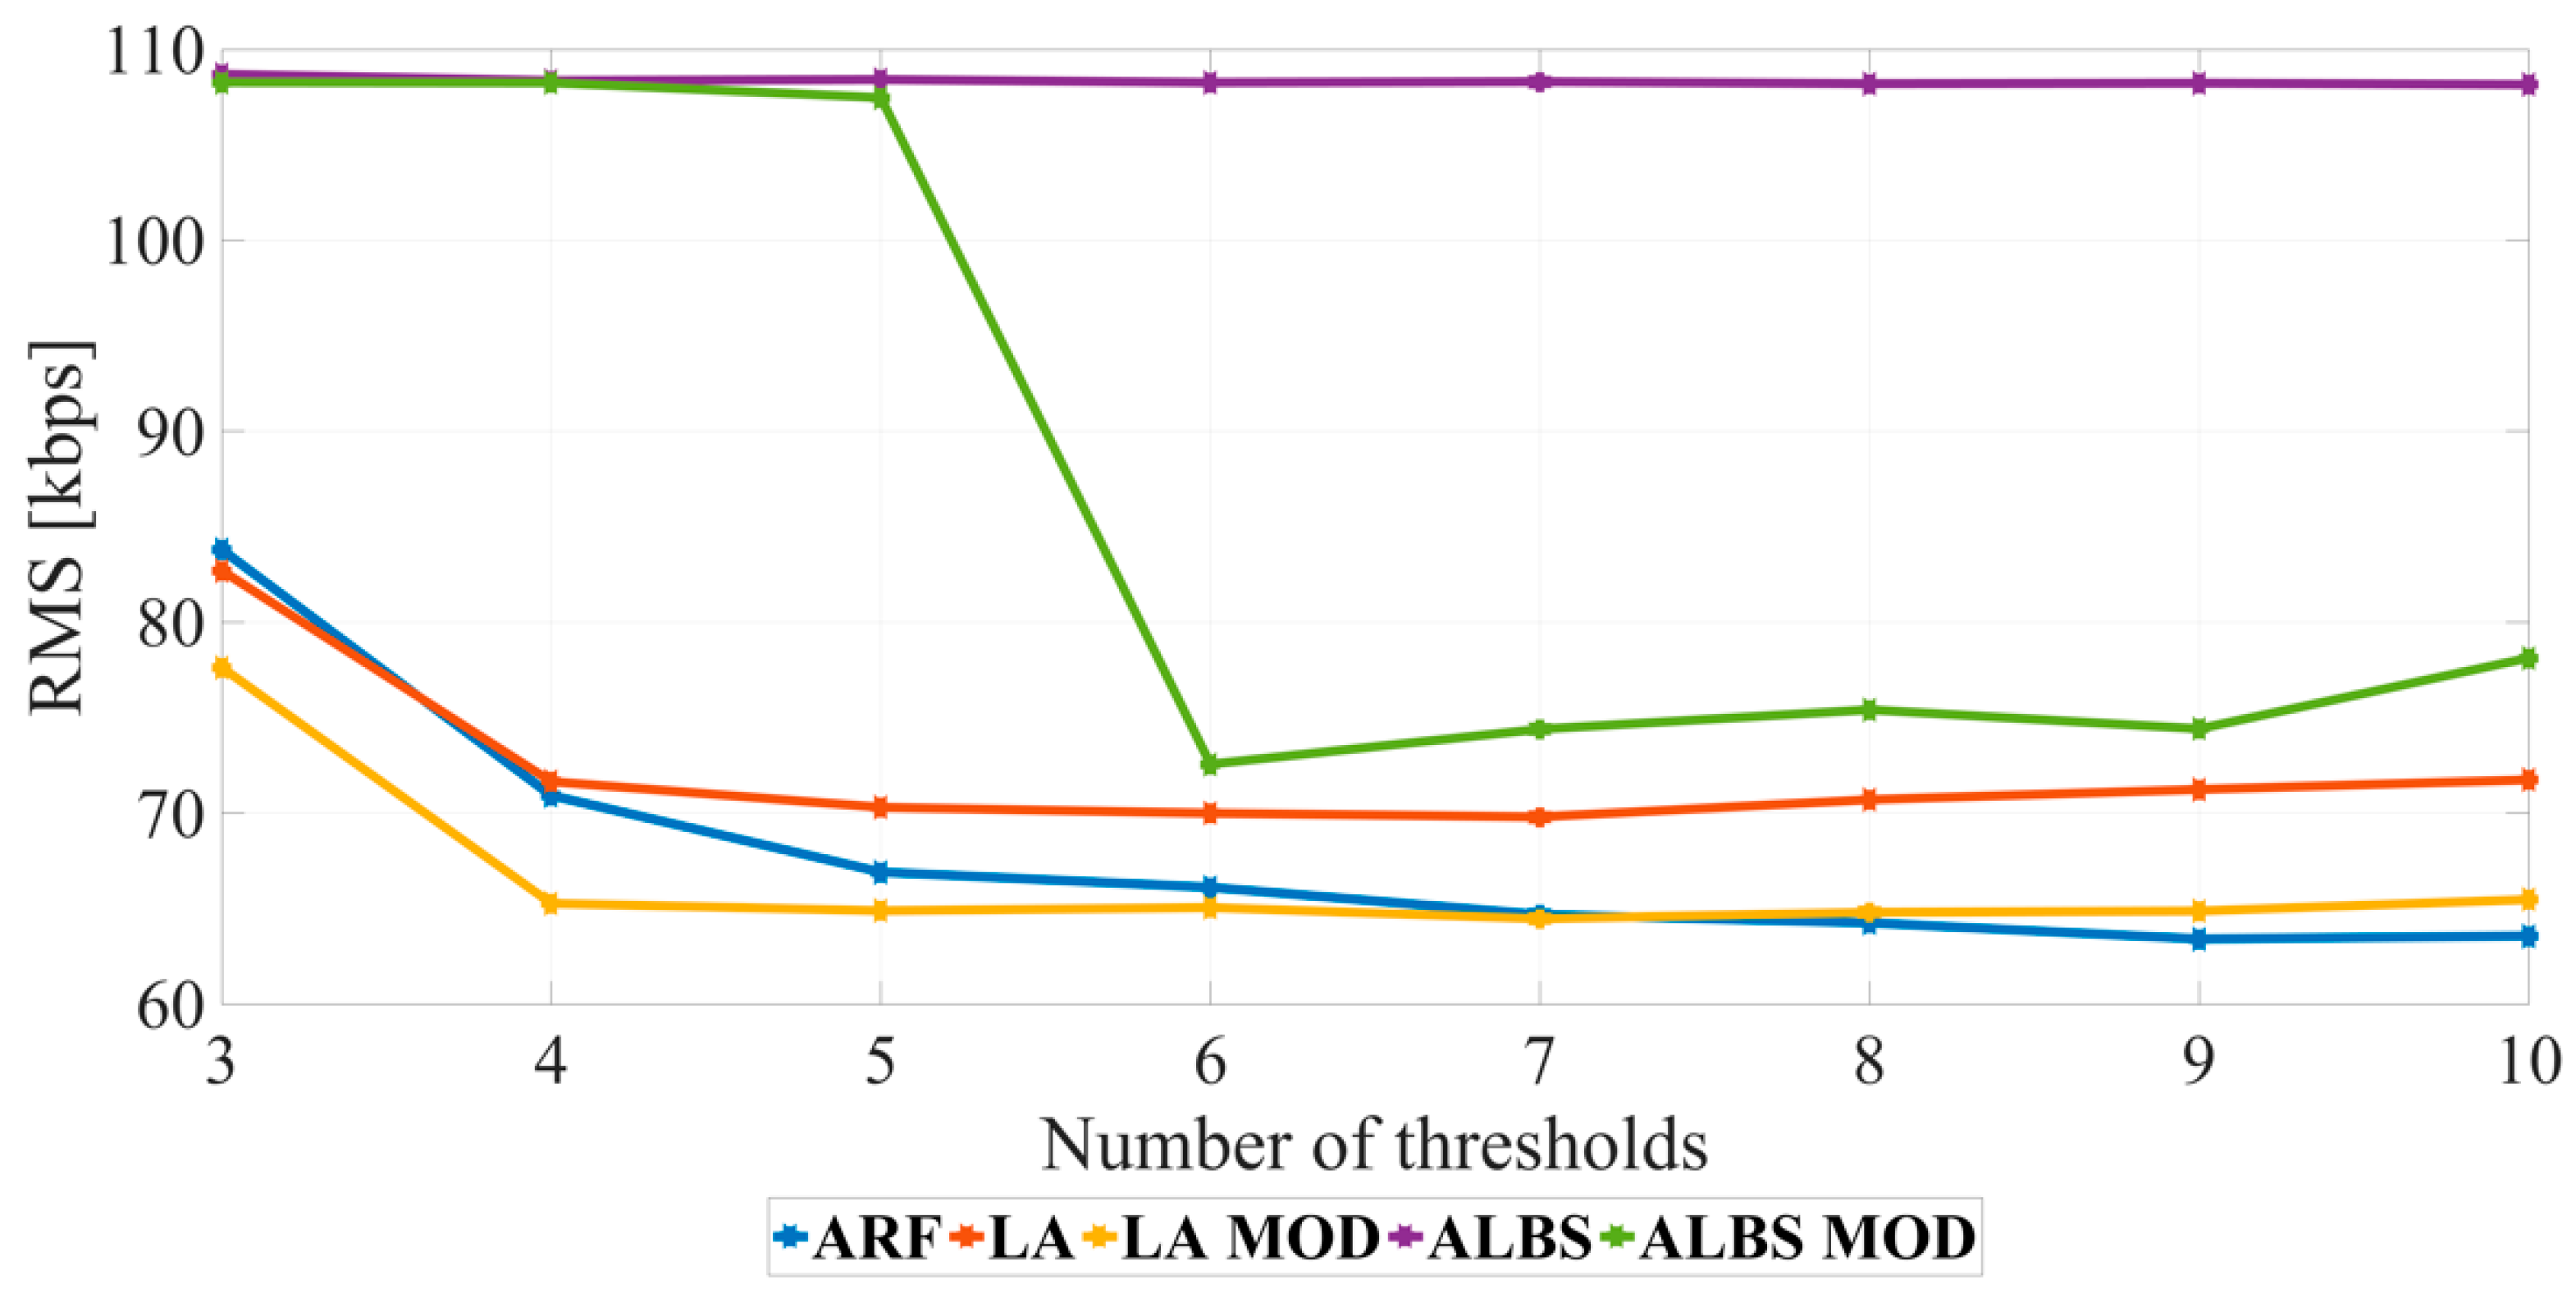
The impact of the number of threshold values on the efficiency of the methods was analyzed for the same data set, and the results were averaged for all montage locations of the MN. It must be noted that if the RMS value was closer to 0, the available algorithm used the resources more efficiently. To avoid a random factor, the probability of receiving the packet, , was calculated, as in (15). In Figure 7, the results of the analyzed methods’ effectiveness as a function of the deterministic number of threshold values are presented.
Based on the results, it was determined that the value of 6 available thresholds for bitrate adaptation is the optimal value for all algorithms, considering the smallest, cumulative RMS. It is also worth noting that the number of thresholds greater than 6 does not significantly increase the effectiveness of resource usage and even worsens it. This is due to too many changes in the data rates, which leads to an increased inertia of selected methods (through a slow bitrate change) and, consequentially. a packet’s loss at the sudden change of the parameters, e.g., due to the change in the LOS/NLOS conditions.
Due to the non-deterministic nature of the developed propagation model (13), radio distance measurements (Table 2), detection of the LOS conditions (Table 3), LQI (14), probability of packet reception (16), and the user’s motion with the MN, all scenarios were analyzed for 10 user walks, and for each MN montage location, for a time of about 6 min, which corresponds to about 9000 user data transmissions in 20 ms time slots. The time interval between the start of two successive slots to send user data was 40 ms. Such a number of transmissions enables a reliable assessment of the analyzed methods’ usefulness for adaptive data stream allocation in WBANs. In Table 4, the chosen parameters of the WBAN heterogeneous simulator are presented.
In addition to the values presented in Table 4, the results of other measurements, like the propagation model parameters, the RDMs error, etc., were also investigated. It is worth noting that the transmitted signal power in both RIs are adjusted in such a way that along the signal propagation path (along the corridor) there are changes in the received signal power, forcing the calculation of the probability of receiving the packet, , using the linear functions, , , according to the expression (16). This highlights the reasonability of using methods for adaptive data streams allocation by rate adaptation and differences in their operation.
5.1. Simulation Results
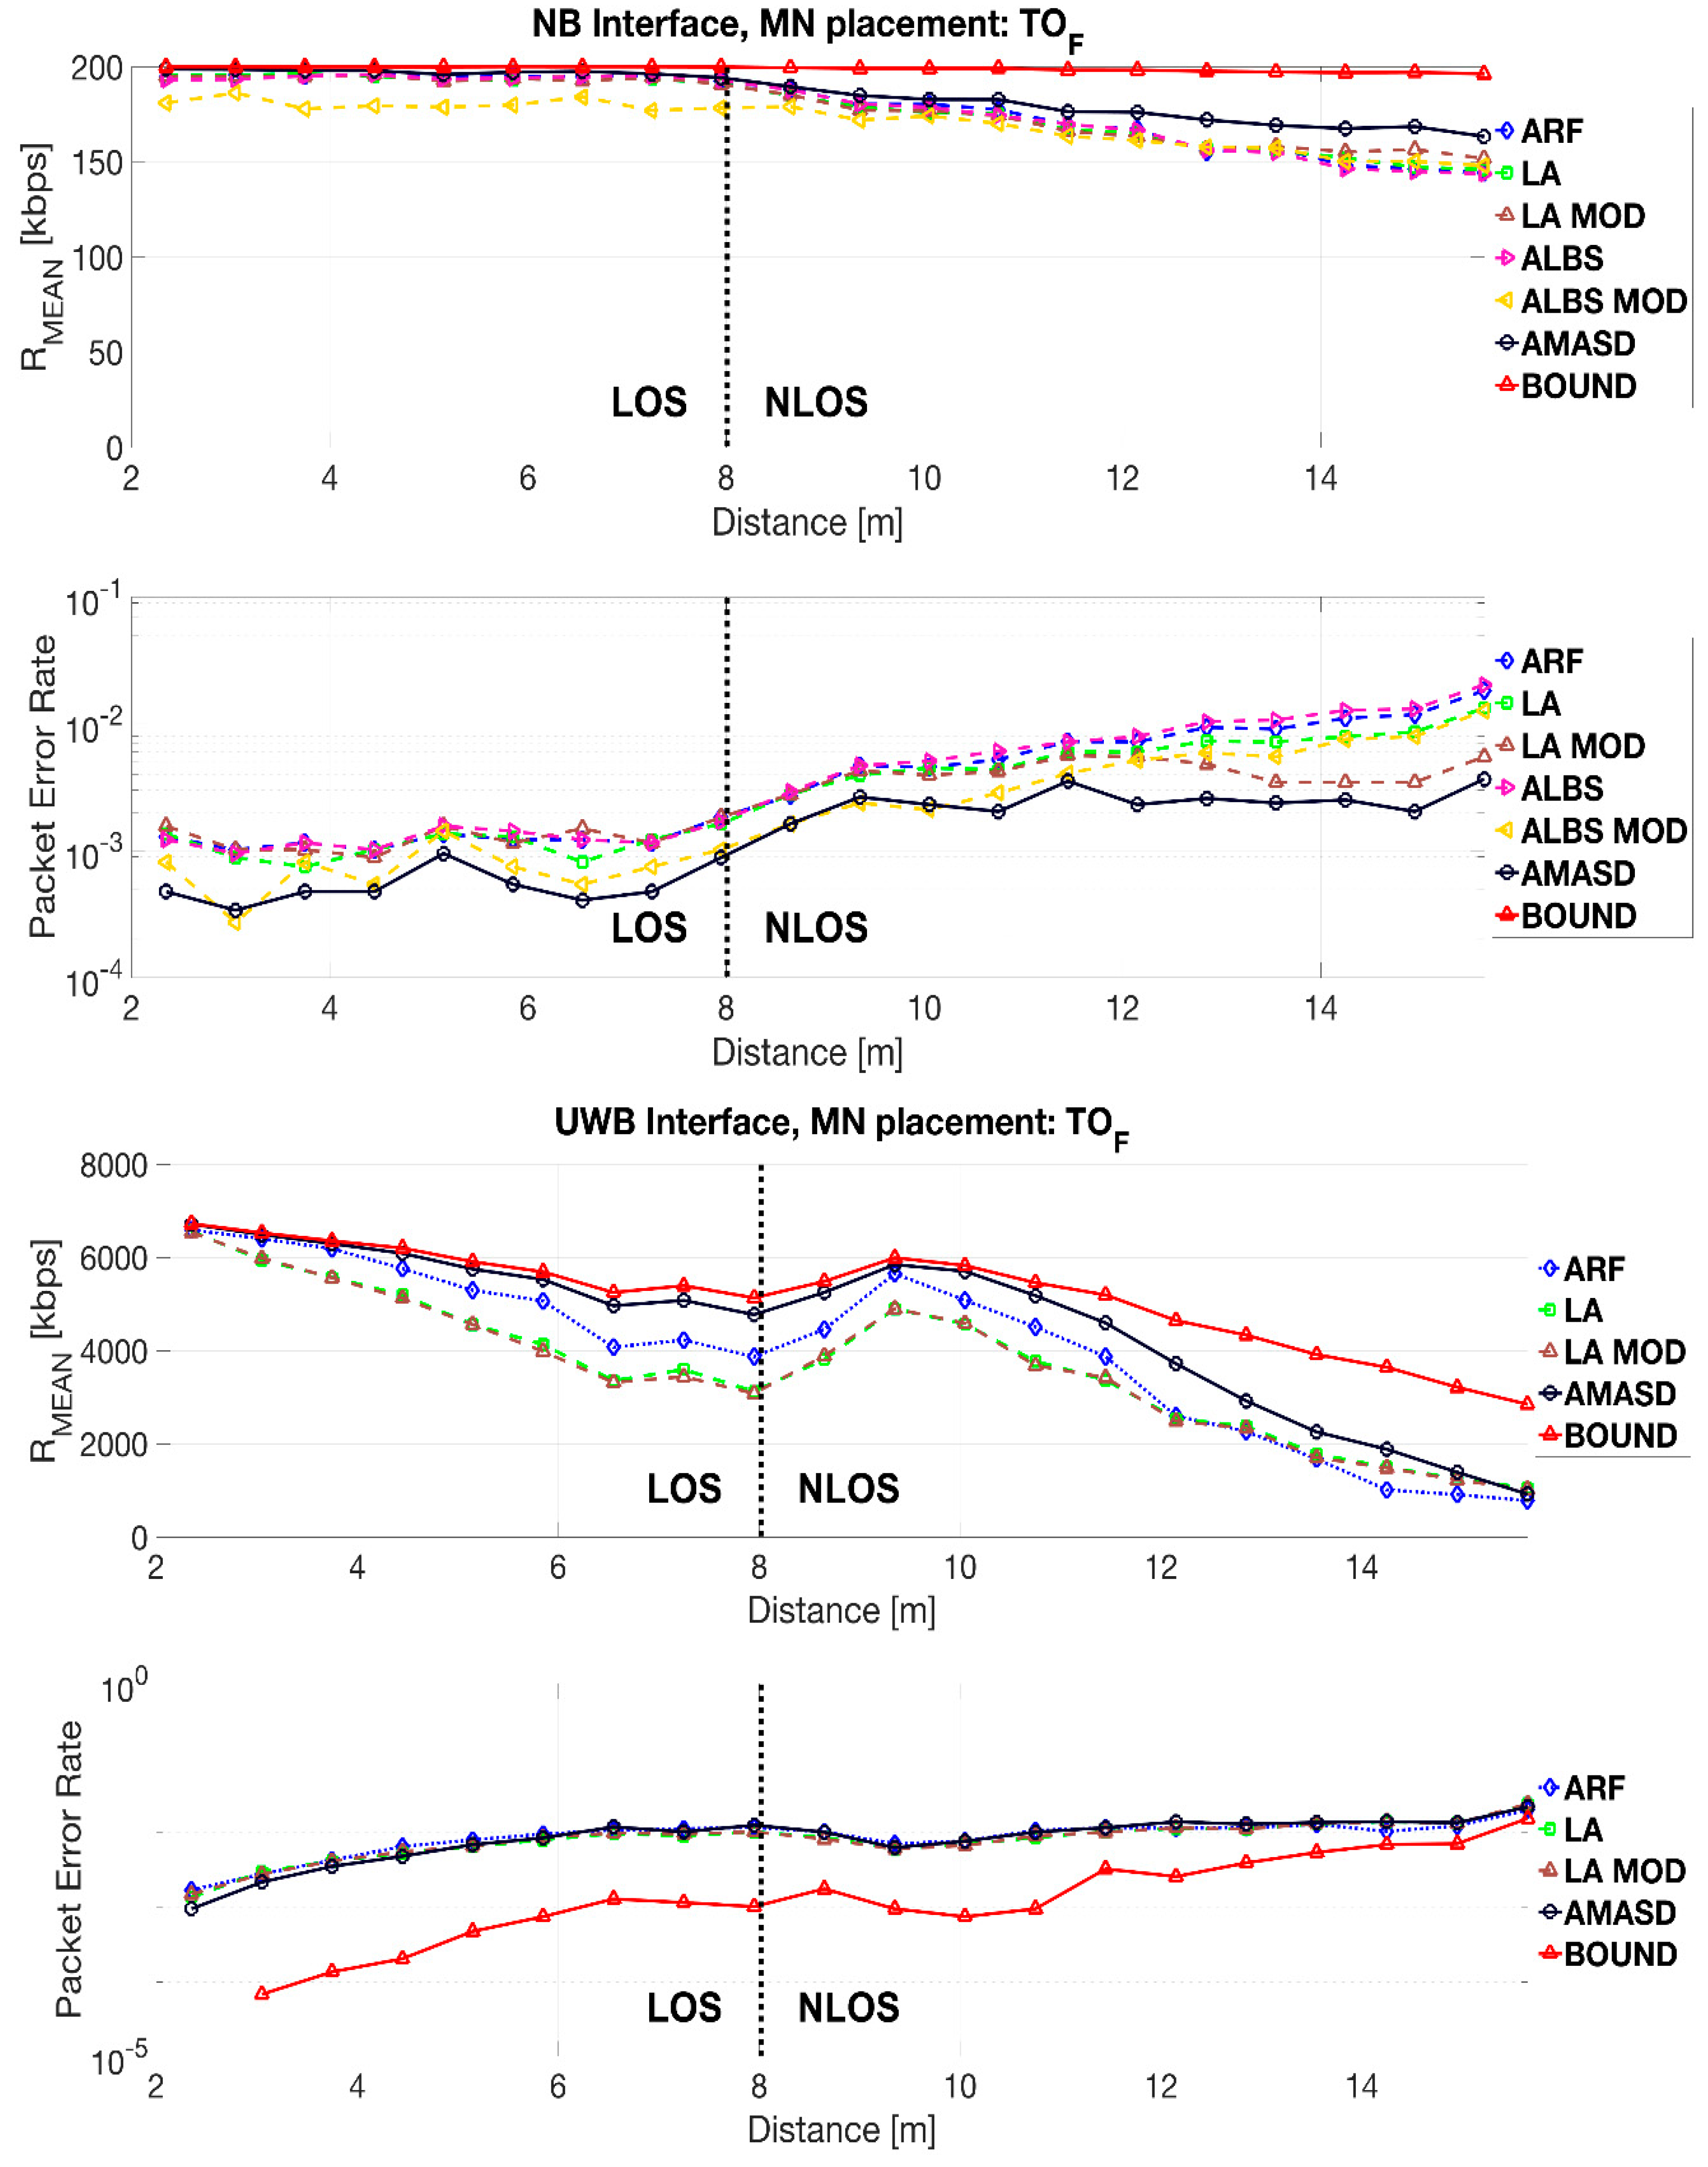
In Figure 8, Figure 9 and Figure 10, graphs of the and PER results as a function of the distance between the MN and the RN in the ferryboat environment are presented.
The results support an increase in the efficiency of the usage of available resources in a heterogeneous WBAN for the proposed AMASD method, regardless of the MN placement on the human body. As expected, with the increase of the distance (and, thus, the RDMs deviation), and when the NLOS conditions appear, the efficiency of the proposed algorithm decreases. This is due to the more frequent fading phenomena and higher mean system loss, which causes the increase of PER and worsens the results of short-term prediction of the radio channel parameters. A noticeable difference in the average bitrates for the UWB RI can be seen only in the NLOS conditions, where the received signal power decreases significantly with the distance.
There was also a significant difference between the NB and the UWB interfaces, resulting from the possibility of a more adaptive selection of the bitrate to a current characteristic of the radio channels. In the NB interface, it was possible to find a solution, maximizing the mean bitrate, , and minimizing the PER, with respect to the available methods, while the UWB interface was characterized by proportional interchangeability between those. In addition, in the characteristics of the UWB channel, a rapid increase of attenuation can be observed, which corresponds to a significant reduction in the transmission rate. However, the mean useful transmission rate was increased over the entire route. It should be noticed, that a similar PER was obtained, with respect to the other methods under the LOS conditions, and was greater under the NLOS conditions. This is due to the increase of the fading impact as well as the RDMs deviation.
In Table 5, the numerical results of the available time-frequency resources usage, including selected fixed bitrates, without using any allocation method are presented. The best results (considering only the algorithms analyzed in this article) are indicated with the green color, while the orange color marks the second best result.
Regardless to the RI being analyzed and the MN montage location on the human body, the best results of the available time-frequency resources usage were obtained using the proposed AMASD method. It enables even a several times more efficient use of the resources in a heterogeneous WBAN in relation to the fixed bitrate choice or the usage of known algorithms. Considering the second best algorithm, in terms of efficiency, the best results were obtained for the ARF algorithm for the UWB interface, and the ARF and LA MOD algorithm, that is the LA algorithm [21,22], with additional running filtering of input data for the NB interface. The obtained results of the well-known algorithms are very similar to each other.
The gains of using the available time-frequency resources, , by applying the AMASD algorithm, in relation to the second best one, in terms of the efficiency (that should be understood as the useful throughput increase), is (12%), (31%), and (18%) for the NB interface, and (37%), (35%), and (48%) for the UWB interface. The influence of a rapid change in the system loss, which was detected by the algorithm, is clearly visible and the bitrates of the subsequent transmission were adjusted to the current radio channel parameters.
In summary, the results obtained for the variable propagation conditions have proved the usefulness of the proposed AMASD method regardless of the MN placement in the heterogeneous WBAN. It was also indicated that other algorithms (in particular, LA MOD and ARF) can be used in these networks interchangeably, depending on the scenario. However, there is usually no more than one algorithm for data stream allocation that is implemented in the nodes’ software, even if the network is heterogeneous.
6. Conclusions
The growing demand for devices for the monitoring of health parameters, recording movement parameters, or providing multimedia content has contributed to the significant development of radio networks working within the human body or its proximity. WBANs, which are currently one of the major directions of modern fifth generation radio communication network development, are also widely used in the areas of entertainment, marketing, and security. In the implemented homogeneous and heterogeneous networks, distinguishable by the number of the RIs used, the key aspect is the available time-frequency resources usage.
A novel AMASD method was proposed to increase the available time-frequency resources usage by using two parallel-working RIs, i.e., the NB and the UWB. An innovative element of the proposed method is the usage of the RDMs to estimate users’ movement parameters and spatial filtration parameters of the received signal power estimations, which are used to estimate the channel parameters and dynamic system loss exponent. These parameters are determined separately for the LOS and NLOS conditions, which are estimated basing on the UWB CIR. The obtained predicted radio channel parameters are used together with the designated noise characteristics of both RIs to adaptively allocate the data streams for the next transmission.
The results of extensive measurement research and analysis were the input data for the simulation tool that enabled a reliable reconstruction of the heterogeneous WBAN radio link specificity. The usefulness of the analyzed algorithms for the adaptive data streams allocation was analyzed in a dynamic scenario, representing a movement along an L-shaped corridor where both the LOS and NLOS conditions could be distinguished. Considering the smallest cumulative RMS mean bitrate for all the methods (that should be interpreted as the rate of unused throughput), the optimal number of available bitrates for the known threshold-based algorithms has been determined.
Based on the specific metrics, the efficiency of the time-frequency resources usage has been demonstrated. The efficiency increased several times when the AMASD method was used, regardless of the MN montage location on the human body for both RIs. The differences in the interchangeability of the obtained mean bitrate and the PER between the NB and UWB interface were also indicated. Despite this, the AMASD method significantly increased the usage of available resources, keeping the PER for the UWB interface close to the rest of the algorithms, and minimizing it for the NB interface.
The results presented in the article may be a contribution to further analysis of the adaptive data streams allocation methods in the heterogeneous WBAN for body-to-body or on-body communication. The main limitation of the presented research is the lack of implementation and measurements in the real environment, thus, the time-frequency resources efficiency usage was investigated only using a dedicated software simulator. However, using the measurement methodology, the prepared measurement stand, and the simulation tool presented in this article, it is possible to verify the AMASD performance by measurements in the real environment. Thus, future works will be focused on the implementation of analyzed methods on a hardware, and their efficiency comparison in off-body communications.
7. Patents
The described novel method is subject of a patent application, No. P.425400, in the Patent Office of the Republic of Poland.
Author Contributions
All authors contributed to designing and performing measurements, data analysis, scientific discussions, and writing the article.
Funding
This work was developed with financial support of the Faculty of Electronics, Telecommunications and Informatics of Gdansk University of Technology.
Acknowledgments
This work was developed within framework of the COST Action CA15104 “Inclusive Radio Communication Networks for 5G and beyond” (IRACON).
Conflicts of Interest
The authors have no conflict of interest to declare.
References
- Ambroziak, S.J. Wireless Body Area Networks, Telecommunications Review and Telecommunications News. 2017. (In Polish)
- Cavallari, R.; Martelli, F.; Rosini, R.; Buratti, C.; Verdone, R. A Survey on Wireless Body Area Networks: Technologies and Design Challenges. IEEE Commun. Surv. Tutor. 2014, 16. [Google Scholar] [CrossRef]
- Choi, B.; Kim, B.; Lee, S.; Wang, K.; Kim, Y.; Chung, D. Narrowband Physical Layer design for WBAN system. In Proceedings of the First International Conference on Pervasive Computing, Signal Processing and Applications, Harbin, China, 17–19 September 2010. [Google Scholar]
- Li, H.B.; Schwoerer, J.; Yoon, Y.M.; Farserotu, J.; Yang, W.; Sayrafian, K.; Miniutti, D.; Lewis, D.; Gowans, A.; Moss, J. IEEE 802. 15. 6 Regulation Subcommittee Report; IEEE 802.15 Working Group Document; IEEE: New York, NY, USA, 2008. [Google Scholar]
- Swami, A.; Zhao, Q.; Hong, Y.-W.; Tong, L. Wireless Sensor Networks—Signal Processing and Communications Perspectives; Wiley & Sons: New York, NY, USA, 2007. [Google Scholar]
- Barbeau, M.; Kranakis, E. Principles of Ad Hoc Networking; Wiley & Sons: New York, NY, USA, 2007. [Google Scholar]
- Boukerche, A. Algorithms and Protocols for Wireless and Mobile Ad Hoc Networks; Wiley Series on Parallel and Distributed Computing; Wiley & Sons: New York, NY, USA, 2009. [Google Scholar]
- De Cordeiro, C.M.; Agrawal, D.P. Ad hoc & Sensor Networks—Theory and Applications; World Scientific: Singapore, 2006. [Google Scholar]
- European Commission. COST Action 231, Digital Mobile Radio towards Future Generation Systems; Final Report; European Commission: Luxemburg, 1999. [Google Scholar]
- Góra, J. 5G Technology Development—From Idea to Product, Telecommunications Review and Telecommunications News. 2017. (In Polish)
- Holger, K.; Willig, A. Protocols and Architectures for Wireless Sensor Networks; Wiley & Sons: New York, NY, USA, 2005. [Google Scholar]
- Lin, C.-H.; Lin, K.C.-J.; Chen, W.-T. Rate Adaptation for Highly Dynamic Body Area Networks. In Proceedings of the IEEE International Conference on Cyber, Physical and Social Computing (CPSCom), Taipei, Taiwan, 1–3 September 2014. [Google Scholar]
- Nabar, S.; Walling, J.; Poovendran, R. Minimizing Energy Consumption in Body Sensor Networks via Convex Optimization. In Proceedings of the International Conference on Body Sensor Networks, Singapore, 7–9 June 2010. [Google Scholar]
- Yazdi, E.T.; Willig, A.; Pawlikowski, K. On Channel Adaptation in IEEE 802.15.4 Mobile Body Sensor Networks: What can be Gained? In Proceedings of the 18th IEEE International Conference on Networks (ICON), Singapore, 12–14 December 2012. [Google Scholar]
- Yoo, T.; Lavery, R.J.; Goldsmith, A.; Goodman, D.J. Throughput Optimization Using Adaptive Techniques. In Proceedings of the IEEE International Conference on Communications, Paris, France, 20–24 June 2004. [Google Scholar]
- Yun, J.-H. Throughput Analysis of IEEE 802.11 WLANs with Automatic Rate Fallback in a Lossy Channel. IEEE Trans. Wirel. Commun. 2009, 8. [Google Scholar] [CrossRef]
- Salayma, M.; Al-Dubai, A.; Romdhani, I.; Nasser, Y. Reliability and Energy Efficiency Enhancement for Emergency-Aware Wireless Body Area Networks (WBAN). IEEE Trans. Green Commun. Netw. 2018. [Google Scholar] [CrossRef]
- Salayma, M.; Al-Dubai, A.; Romdhani, I.; Nasser, Y. New dynamic, reliable and energy efficient scheduling for Wireless Body Area Networks (WBAN). In Proceedings of the IEEE International Conference on Communications, Paris, France, 21–25 May 2017. [Google Scholar]
- Deshpande, S. Adaptive Low-Bitrate Streaming Over IEEE 802.15.4 Low Rate Wireless Personal Area Networks (LR-WPAN) Based on Link Quality Indication. In Proceedings of the 2006 International Conference on Wireless Communications and Mobile Computing (IWCMC), Vancouver, BC, Canada, 3–6 July 2006. [Google Scholar]
- Farhad, A.; Zia, Y.; Farid, S.; Hussain, F.B. A Traffic Aware Dynamic Super-frame Adaptation Algorithm for the IEEE 802.15.4 Based Networks. In Proceedings of the IEEE Asia Pacific Conference on Wireless and Mobile, Bandung, Indonesia, 27–29 August 2015. [Google Scholar]
- Martelli, F.; Verdone, R.; Buratti, C. Link Adaptation in IEEE 802.15.4-Based Wireless Body Area Networks. In Proceedings of the IEEE 21st International Symposium on Personal, Indoor and Mobile Radio Communications Workshops, Instanbul, Turkey, 26–30 September 2010. [Google Scholar]
- Martelli, F.; Verdone, R.; Buratti, C. Link Adaptation in Wireless Body Area Networks. In Proceedings of the IEEE 73rd Vehicular Technology Conference, Yokohama, Japan, 15–18 May 2011. [Google Scholar]
- Mohamed, B.; Amira, Z.; Houria, R.; Tahar, E. Impact of Energy and Link Quality Indicator with Link Quality Estimators in Wireless Sensor Networks. In Proceedings of the IEEE International Journal on Applications of Graph Theory in Wireless Ad hoc Networks and Sensor Networks (GRAPH-HOC), Chennai, India, 27–28 December 2014; Volume 6. [Google Scholar]
- Zhang, Q. Energy Saving Efficiency Comparison of Transmit Power Control and Link Adaptation in BANs. In Proceedings of the IEEE ICC Ad-hoc and Sensor Networking Symposium, Budapest, Hungary, 9–13 June 2013. [Google Scholar]
- IEEE 802.15.4 Standard. Wireless Medium Access Control (MAC) and Physical Layer (PHY) Specifications for Low-Rate Wireless Personal Area Networks (LR-WPANs); IEEE: New York, NY, USA, 2006. [Google Scholar]
- Smith, S.W. The Scientist and Engineer’s Guide to Digital Signal Processing; California Technical Publishing: San Diego, CA, USA, 2011. [Google Scholar]
- DecaWave. DW1000 User Manual v. 2.07; DecaWave: Dublin, Ireland, 2016. [Google Scholar]
- DecaWave. ScenSor, Designing the First Commercial IEEE 802.15.4a Chip; DecaWave: Dublin, Ireland, 2012. [Google Scholar]
- Zieliński, T.P.; Korohoda, P.; Rumian, R. Digital Signal Processing in Telecommunications; Polish Scientific Publishers PWN: Warsaw, Poland, 2014. (In Polish) [Google Scholar]
- ITU–R P.341–6. The Concept of Transmission Loss for Radio Link; ITU: Geneva, Switzerland, 2016. [Google Scholar]
- Rajchowski, P.; Cwalina, K. Research and Analysis of the Accuracy of Determining the Position of People in WBAN Networks, Telecommunications Review and Telecommunications News. 2017. (In Polish)
- Wei, L.; Chunzi, W.; Jian, Z. RSSI—SDSTWR Estimation Method for Indoor Ranging; Hubei University of Technology: Wuhan, China, 2013. [Google Scholar]
- Wei, L.; Zou, J.; Wang, C.; Xu, H. Kalman Filter Localization Algorithm Based on SDS-TWR Ranging. Telkomnika 2013, 11, 1436–1448. [Google Scholar] [CrossRef]
- Ambroziak, S.J.; Correia, L.M.; Katulski, R.J.; Mackowiak, M.; Oliveira, C.; Sadowski, J.; Turbic, K. An Off-Body Channel Model for Body Area Networks in Indoor Environments. IEEE Trans. Antennas Propag. 2016, 64. [Google Scholar] [CrossRef]
- Sadowski, J.; Stefański, J.; Rajchowski, P.; Cwalina, K.; Gilski, P.; Magiera, J. System for Remote Monitoring of the Position of People in Closed Environments, Telecommunications Review and Telecommunications News. 2016. (In Polish)
- Sadowski, J.; Rajchowski, P.; Cwalina, K. Tracking Body Movement for Radio Channel Measurements in BAN with Indoor Positioning System. In Proceedings of the URSI Asia-Pacific Radio Science Conference (URSI AP-RASC), Seoul, Korea, 21–25 August 2016. [Google Scholar]
- Hu, Y.; Leus, G. Self-Estimation of Path-Loss Exponent in Wireless Networks and Applications. IEEE Trans. Veh. Technol. 2014, 64, 5091–5102. [Google Scholar] [CrossRef]
- Skokowski, P.; Malon, K.; Kelner, J.M.; Dołowski, J.; Łopatka, J.; Gajewski, P. Adaptive Channels’ Selection for Hierarchical Cluster Based Cognitive Radio Networks. In Proceedings of the 8th International Conference on Signal Processing and Communication Systems (ICSPCS), Gold Coast, Australia, 15–17 December 2015. [Google Scholar]
- Smith, D.B.; Miniutti, D.; Lamahewa, T.A.; Hanlen, L.W. Propagation Models for Body-Area Networks: A Survey and New Outlook. IEEE Antennas Propag. Mag. 2013, 55. [Google Scholar] [CrossRef]
- Timmons, N.F.; Scanlon, W.G. An Adaptive Energy Efficient MAC Protocol for the Medical Body Area Network. In Proceedings of the 1st International Conference on Wireless Communication, Vehicular Technology, Information Theory and Aerospace & Electronic Systems Technology, Aalborg, Denmark, 17–20 May 2009. [Google Scholar]
- Czepiel, S.A. Maximum Likelihood Estimation of Logistic Regression Models: Theory and Implementation. 2005. Available online: https://czep.net/stat/mlelr.pdf (accessed on 19 July 2018).
- Cwalina, K.K.; Ambroziak, S.J.; Rajchowski, P. An Off-Body Narrowband and Ultra-Wide Band Channel Model for Body Area Networks in a Ferryboat Environment. Appl. Sci. 2018, 8, 988. [Google Scholar] [CrossRef]
- Adeunis, R.F. Narrowband NB868-500mW RF Module v.2.2.5, 2014.
- Latre, B.; Braem, B.; Moerman, I.; Blondia, C.; Demeester, P. A Survey on Wireless Body Area Networks. Wirel. Netw. 2011, 17, 1–18. [Google Scholar] [CrossRef]
- Cwalina, K.K.; Ambroziak, S.J.; Rajchowski, P.; Correia, L.M. Radio Channel Measurements in 868 MHz Off-Body Communications in a Ferry Environment. In Proceedings of the XXXIInd General Assembly and Scientific Symposium of the International Union of Radio Science (URSI GASS), Montreal, QC, Canada, 19–26 August 2017. [Google Scholar]
- Khemapech, I. Environmental Monitoring WSN; IntechOpen: Rijeka, Croatia, 2011. [Google Scholar]
Figure 1.
The principle of operation of the LA algorithm.

Figure 2.
Block diagram of the proposed developed novel adaptive method for data stream allocation (AMASD).
Figure 2.
Block diagram of the proposed developed novel adaptive method for data stream allocation (AMASD).

Figure 3.
An example of an empirical error probability density function (PDF) around the average value with a fitted normal distribution for one of the measurement scenarios.
Figure 3.
An example of an empirical error probability density function (PDF) around the average value with a fitted normal distribution for one of the measurement scenarios.

Figure 4.
The exponential regression function fitted to the empirical measurement data.

Figure 5.
The method for determining the noise characteristics of the NB interface from the data of empirical measurements for an exemplary PER = 10−3.
Figure 5.
The method for determining the noise characteristics of the NB interface from the data of empirical measurements for an exemplary PER = 10−3.

Figure 6.
The method for determining the noise characteristics of the UWB interface from the data of empirical measurements for an exemplary packet error rate (PER) = 10−3.
Figure 6.
The method for determining the noise characteristics of the UWB interface from the data of empirical measurements for an exemplary packet error rate (PER) = 10−3.

Figure 7.
Results of the analyzed methods’ effectiveness as a function of the deterministic number of the bitrate threshold values for the NB interface.
Figure 7.
Results of the analyzed methods’ effectiveness as a function of the deterministic number of the bitrate threshold values for the NB interface.

Figure 8.
The mean bitrate () and PER results as a function of the distance for the right side of the head (HER) mobile node (MN) placement for the NB and the UWB interfaces.
Figure 8.
The mean bitrate () and PER results as a function of the distance for the right side of the head (HER) mobile node (MN) placement for the NB and the UWB interfaces.

Figure 9.
The and PER results as a function of the distance for the TOF MN placement for the NB and the UWB interfaces.
Figure 9.
The and PER results as a function of the distance for the TOF MN placement for the NB and the UWB interfaces.

Figure 10.
The and PER results as a function of the distance for the ABL MN placement for NB and UWB interfaces.
Figure 10.
The and PER results as a function of the distance for the ABL MN placement for NB and UWB interfaces.


Table 1.
Parameters of the system loss model for off-body communication in the ferryboat environment [42].
Table 1.
Parameters of the system loss model for off-body communication in the ferryboat environment [42].
| Model Parameters for 868 MHz Narrowband Channel | ||||||
| n | ||||||
| LOS | [0.16; 0.34] | [64.7; 75.9] | [−0.2; 0.0] | [0.8; 2.0] | [−0.4; −0.2] | [1.5; 2.1] |
| NLOS | [1.40; 3.80] | [65.9; 76.2] | [−0.4; −0.2] | [1.5; 2.6] | −0.4 | [1.8; 2.2] |
| Model Parameters for 6489 MHz Ultra-Wide Band Channel | ||||||
| n | ||||||
| LOS | [0.13; 0.85] | [23.4; 28.9] | [−0.3; −0.17] | [1.3; 2.2] | [−0.3; −0.2] | [0.7; 1.5] |
| NLOS | [1.25; 3.46] | [26.1; 30.7] | [−0.3; −0.2] | [1.7; 2.8] | [−0.3; −0.2] | [1.4; 1.7] |
Table 2.
Values of the standard deviation of a normal distribution of the distance estimation error fitted to the empirical values for all the measurement scenarios.
Table 2.
Values of the standard deviation of a normal distribution of the distance estimation error fitted to the empirical values for all the measurement scenarios.
| MN LOCATION | SCENARIO | LOS/NLOS Conditions | |
|---|---|---|---|
| HER | APR | LOS | 0.18 |
| NLOS | 0.52 | ||
| DEP | LOS | 0.28 | |
| NLOS | 0.56 | ||
| TOF | APR | LOS | 0.09 |
| NLOS | 0.49 | ||
| DEP | LOS | 0.43 | |
| NLOS | 0.66 | ||
| ABL | APR | LOS | 0.26 |
| NLOS | 0.44 | ||
| DEP | LOS | 0.25 | |
| NLOS | 0.48 |
Table 3.
The probability of the correct detection of the direct visibility conditions.
| MN LOCATION | SCENARIO | LOS/NLOS Conditions | ||
|---|---|---|---|---|
| HER | APR | LOS | 0.89 | 0.98 |
| NLOS | 0.95 | 0.97 | ||
| DEP | LOS | 0.89 | 0.98 | |
| NLOS | 0.95 | 0.97 | ||
| TOF | APR | LOS | 0.88 | 0.99 |
| NLOS | 0.95 | 0.97 | ||
| DEP | LOS | 0.83 | 0.99 | |
| NLOS | 0.97 | 0.97 | ||
| ABL | APR | LOS | 0.91 | 0.98 |
| NLOS | 0.93 | 0.97 | ||
| DEP | LOS | 0.88 | 0.98 | |
| NLOS | 0.89 | 0.98 |
Table 4.
The chosen parameters of the WBAN heterogeneous simulator.
| PARAMETER | VALUE | UNIT |
|---|---|---|
| User speed | [0.5; 1.5] | mps |
| Walks number | 10 | – |
| Transmitting power in NB interface | [5; 17] | dBm |
| Transmitting power spectral density in the UWB interface | [−56.3; −41.3] | dBm/MHz |
Table 5.
Numerical results of the available time-frequency resources usage.
| NB | RMS (kbps) | RMEAN (kbps) | PER | ||||||
| HER | TOF | ABL | HER | TOF | ABL | HER | TOF | ABL | |
| 10 kbps | 154.71 | 193.76 | 175.14 | 9.98 | 9.99 | 9.99 | 1.6 × 10⁻³ | 6.1 × 10⁻⁴ | 1.5 × 10⁻³ |
| 48 kbps | 116.49 | 154.83 | 136.65 | 47.68 | 47.94 | 47.87 | 7.1 × 10⁻³ | 1.3 × 10⁻³ | 2.9 × 10⁻³ |
| 86 kbps | 81.65 | 115.88 | 99.34 | 81.30 | 85.91 | 84.42 | 5.7 × 10⁻² | 1.0 × 10⁻³ | 2.0 × 10⁻² |
| 124 kbps | 64.56 | 76.90 | 69.12 | 96.47 | 123.90 | 112.28 | 2.3 × 10⁻¹ | 8.1 × 10⁻⁴ | 1.0 × 10⁻¹ |
| 162 kbps | 86.22 | 39.31 | 67.98 | 77.31 | 160.54 | 118.14 | 5.2 ∙10−1 | 9.5 × 10⁻³ | 2.8 × 10⁻¹ |
| 200 kbps | 127.22 | 27.98 | 97.17 | 35.67 | 177.97 | 95.21 | 8.2 × 10⁻¹ | 1.1 × 10⁻¹ | 5.3 × 10⁻¹ |
| ARF | 64.89 | 27.53 | 54.68 | 96.08 | 178.24 | 127.38 | 2.5 × 10⁻¹ | 1.0 × 10⁻¹ | 2.2 × 10⁻¹ |
| LA | 68.14 | 27.65 | 57.01 | 92.93 | 177.63 | 125.45 | 2.3 × 10⁻¹ | 8.2 × 10⁻² | 1.9 × 10⁻¹ |
| LA MOD | 65.12 | 26.12 | 54.11 | 95.81 | 178.30 | 127.92 | 1.2 × 10⁻¹ | 5.9 × 10⁻² | 1.1 × 10⁻¹ |
| ALBS | 127.09 | 28.26 | 96.71 | 35.81 | 177.54 | 95.82 | 8.2 × 10⁻¹ | 1.1 ∙10−1 | 5.2 × 10⁻¹ |
| ALBS MOD | 96.22 | 31.31 | 74.87 | 66.15 | 170.26 | 112.19 | 6.1 × 10⁻¹ | 6.4 × 10⁻² | 3.6 × 10⁻¹ |
| AMASD | 56.85 | 17.91 | 44.40 | 103.91 | 185.33 | 138.21 | 9.9 × 10⁻² | 3.3 × 10⁻² | 8.0 × 10⁻² |
| UWB | RMS (kbps) | RMEAN (kbps) | PER | ||||||
| HER | TOF | ABL | HER | TOF | ABL | HER | TOF | ABL | |
| 6800 kbps | 1004.4 | 1515.99 | 1078.99 | 5287.88 | 3755.79 | 4538.67 | 2.3 × 10⁻¹ | 4.5 × 10⁻¹ | 3.4 × 10⁻¹ |
| 850 kbps | 5399.1 | 4621.95 | 4972.74 | 819.03 | 798.05 | 801.99 | 4.0 × 10⁻² | 6.4 × 10⁻² | 5.9 × 10⁻² |
| ARF | 1070.2 | 1445.87 | 1330.66 | 5368.00 | 4013.90 | 4634.72 | 9.8 × 10⁻² | 1.9 × 10⁻¹ | 1.6 × 10⁻¹ |
| LA | 1188.2 | 1675.36 | 1365.79 | 5198.26 | 3647.37 | 4356.07 | 9.9 × 10⁻² | 1.8 × 10⁻¹ | 1.6 × 10⁻¹ |
| LA MOD | 1196.6 | 1712.24 | 1359.77 | 5190.08 | 3615.50 | 4364.97 | 9.9 × 10⁻² | 1.9 × 10⁻¹ | 1.6 × 10⁻¹ |
| AMASD | 700.78 | 936.47 | 695.60 | 5616.62 | 4566.41 | 5143.42 | 1.0 × 10⁻¹ | 2.0 × 10⁻¹ | 1.7 × 10⁻¹ |
© 2018 by the authors. Licensee MDPI, Basel, Switzerland. This article is an open access article distributed under the terms and conditions of the Creative Commons Attribution (CC BY) license (http://creativecommons.org/licenses/by/4.0/).
Share and Cite
MDPI and ACS Style
Cwalina, K.K.; Ambroziak, S.J.; Rajchowski, P.; Sadowski, J.; Stefanski, J. A Novel Bitrate Adaptation Method for Heterogeneous Wireless Body Area Networks. Appl. Sci. 2018, 8, 1209. https://doi.org/10.3390/app8071209
AMA Style
Cwalina KK, Ambroziak SJ, Rajchowski P, Sadowski J, Stefanski J. A Novel Bitrate Adaptation Method for Heterogeneous Wireless Body Area Networks. Applied Sciences. 2018; 8(7):1209. https://doi.org/10.3390/app8071209
Chicago/Turabian StyleCwalina, Krzysztof K., Slawomir J. Ambroziak, Piotr Rajchowski, Jaroslaw Sadowski, and Jacek Stefanski. 2018. "A Novel Bitrate Adaptation Method for Heterogeneous Wireless Body Area Networks" Applied Sciences 8, no. 7: 1209. https://doi.org/10.3390/app8071209
Note that from the first issue of 2016, this journal uses article numbers instead of page numbers. See further details here.