Influence of a New Form of Bolted Connection on the Mechanical Behaviors of a PC Shear Wall


1
College of Civil Engineering, Fuzhou University, Fuzhou 350116, China
2
College of Civil Engineering, Fujian University of Technology, Fuzhou 350118, China
*
Author to whom correspondence should be addressed.
Appl. Sci. 2018, 8(8), 1381; https://doi.org/10.3390/app8081381
Submission received: 5 July 2018
/
Revised: 2 August 2018
/
Accepted: 13 August 2018
/
Published: 16 August 2018
(This article belongs to the Special Issue Emerging Construction Materials and Sustainable Infrastructure)
Abstract
:A variety of forms of connection in precast reinforced concrete (PC) have been proposed, but the impact of the connection forms on the shear wall remains to be studied. In this paper, through quasi-static experiments and numerical simulations, the influences of a new form of bolted connection on the mechanical behaviors of the PC shear wall are investigated. The results show that the strain of the connector is less than the yield strain and the failure does not occur in the connector; the mechanical behaviors of this connection form of the PC shear wall are equivalent to those of the cast-in-place reinforced concrete (RC) shear wall. Meanwhile, reasonable suggestions are put forward for the design of the connector from the pretightening force, bolt number, and axial compression ratio. This implies that this form of bolted connection has little influence on the mechanical behaviors of the PC shear wall and design suggestions can be used in practical projects.
1. Introduction
RC structure has been widely applied in the construction industry due to the easy availability of building materials, advanced mechanical properties, and huge economic benefits. However, RC structure does have its disadvantages, such as the large consumption of building materials, huge amount of building waste, heavy pollution, high labor intensity, low degree of industrialization, and so on [1]. Apparently, it does not conform to the national policy of "Saving Resources and Protecting the Environment" and "Building a Resource-saving, Environmentally Friendly Society and Adhering to the Road of Sustainable Development". Compared with the RC structure, the PC structure has many advantages [2], e.g., high-quality components, fast construction, energy saving, pollution reduction, and low disturbance to the residency. Therefore, the PC structure is one of the key structure types advocated by the Chinese government.
For the PC shear wall structure, connection is the key [3,4]. According to research conducted both at home and abroad, the forms of connection can be categorized into two main types: wet connection and dry connection. At the same time, the effects of the connection and assembling zone on the shear wall have also been studied, since they are likely to affect the mechanical behaviors of the wall. For example, Dhanasekar et al. [5] thought that shear walls with different strengths of materials may result in unexpected failure modes, and they emphasized the importance of ensuring compatible material properties.
Wet connection mainly includes sleeve grouting connection [6,7,8,9] and lap connection [10,11,12,13,14]. Tullini [15] and Wu [16] studied the influence of sleeve grouting connection on shear walls. The test results show that this type of wall exhibits ductile and stable hysteretic behaviors; furthermore, the effectiveness of sleeve-mortar connections in load transfer is also validated. Liu [17] carried out a quasi-static test on the shear wall with sleeve grouting. The test shows that the sleeve connection is very sensitive to the grouting quality, which can affect the performance of the assembling zone. Qian et al. [18] thought that full pouring is difficult to conduct in the interface of the connector, and horizontal gaps may form in the assembling zone. As a result of this, the ductility and energy dissipation capacity of the structure are reduced. Wang et al. [19] studied the influence of banded and lapped connection on shear walls. The test shows that when the connector is located at the upper part of the wall, the mechanical behaviors of the PC wall and the RC wall are basically the same; but when the connector is located at the bottom of the wall, the wall is prone to severe damage because the load is the largest at the bottom and the connector is unbearable. In summary, the stress of vertical rebars can be effectively transmitted with the wet connection form. However, it is undeniable that this kind of connection is complex in structure and technique intensive. These shortcomings may somehow compromise the advantages of the PC structure, and make the quality of the connection difficult to guarantee.
Dry connection mainly includes prestressed connection [20,21,22,23,24,25], welded connection [26,27,28], bolted connection [29,30,31], and anchor connection [32,33]. Lago et al. [34] considered that if dry connection is correctly designed, the wall may still enjoy a good seismic performance. Kurama [35] studied the influence of unbonded post-tensioned prestressed connection on shear walls. The test shows that the strength and initial stiffness of the PC wall are basically equivalent to those of the RC wall, but the energy dissipation capacity looks inferior. Bora et al. [36] used the bolts to connect the PC wall and the ground beam. The result shows that the PC wall with bolts boasts a good ductility and energy dissipation capacity under an earthquake load. Ozturan et al. [37] studied the influence of various forms of connection on shear walls, including welded connection, bolted connection, and so on. The results show that the seismic performance of bolted connection is better than that of other connections, but still lower than the RC connection. Dhanasekar et al. [38,39] studied the influence of bolt looseness on structures. It is common that bolts loosen over a period of time, and this phenomenon may cause the out-of-plane rotation of tall shear walls. Song et al. [40,41,42,43] monitored the phenomenon of bolts looseness and found it common in the structures with bolted connection. In summary, the present PC shear wall with dry connection cannot achieve the same seismic performance as the RC shear wall. It is still necessary to improve the connector and pay close attention to its influence on the mechanical behaviors of the wall.
The aim of this paper is to investigate the influence of a patented bolted connector (by Jiang et al. [44]) on the mechanical behaviors of the PC shear wall and conclude with suggestions for the revision of this form of connector. The rest of the paper is organized as follows. Section 2 introduces the connector designed and patented by Jiang et al., the preparation of specimens, and the results of quasi-static experiments. A numerical model is developed and the corresponding parametric analyses are performed in Section 3. Section 4 includes the conclusive remarks.
2. Quasi-Static Experiment
2.1. Specimens Preparation
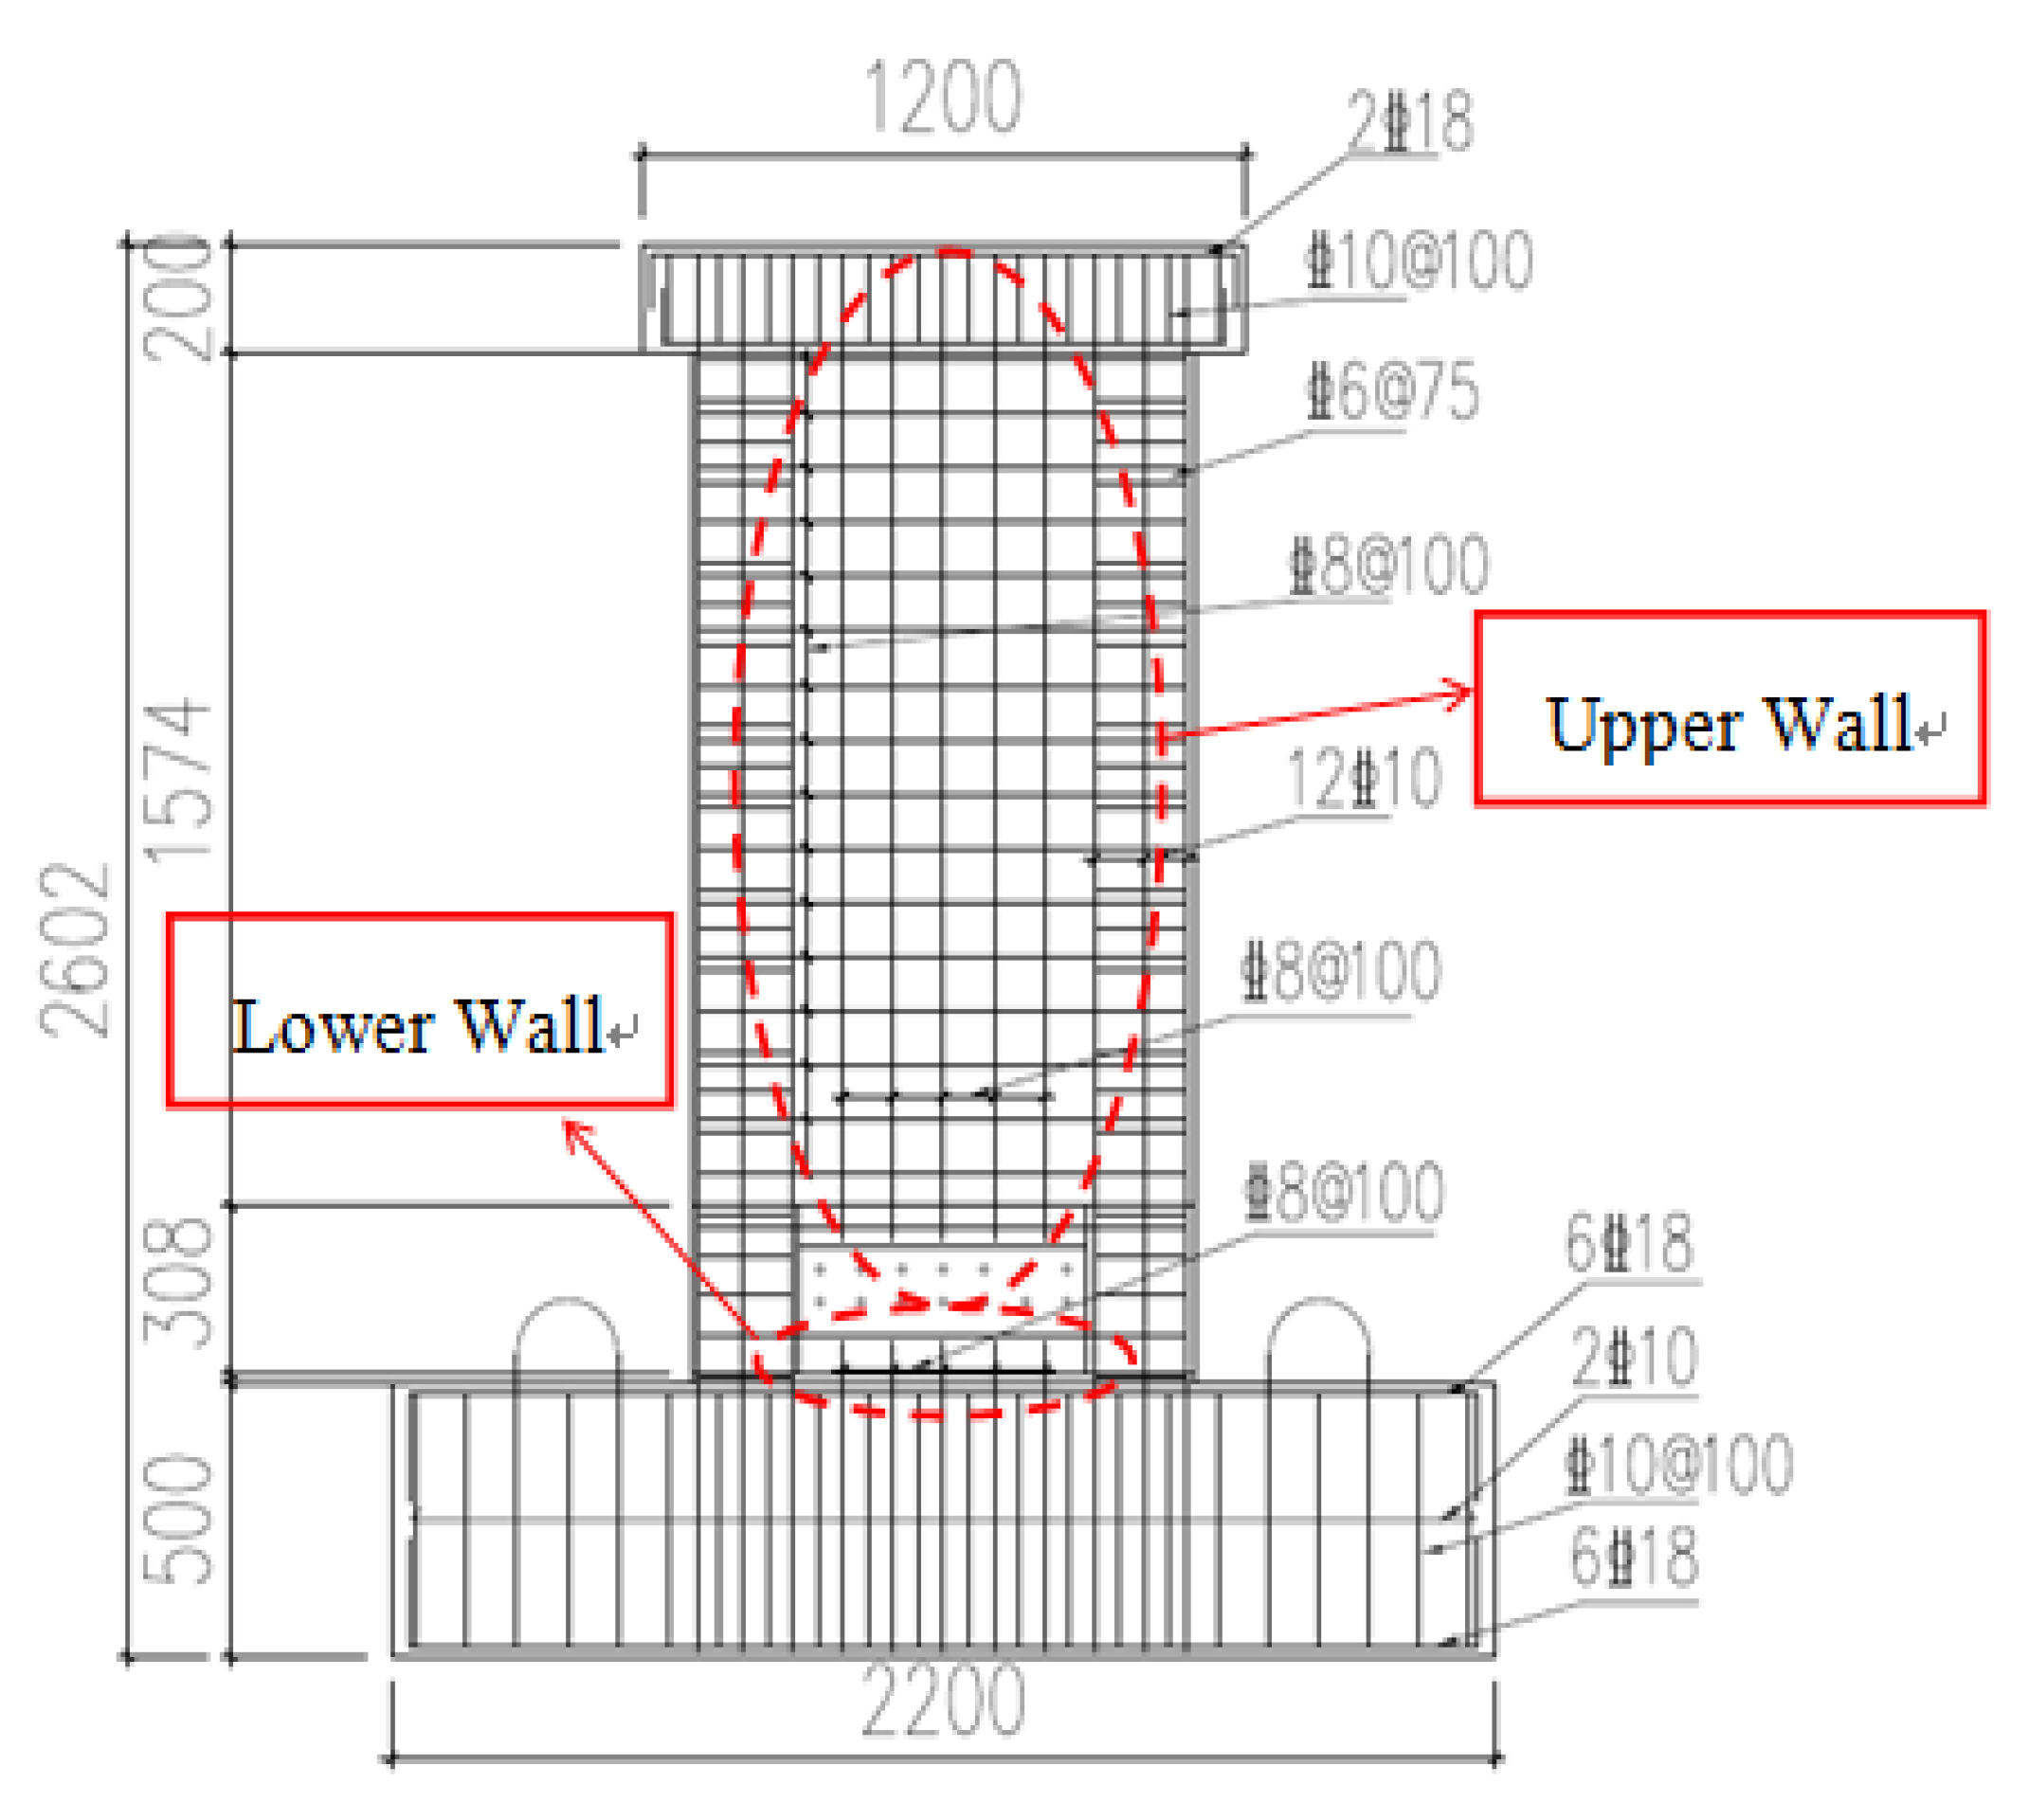
Two half-scale specimens are prepared, including one RC shear wall and one PC shear wall. The strength grades of concrete and rebars are C40 and HRB400, respectively. The mechanical properties of the concrete, rebars, and steel plate are shown in Table 1 and Table 2, respectively. Figure 1 shows the dimension and rebars of specimens.
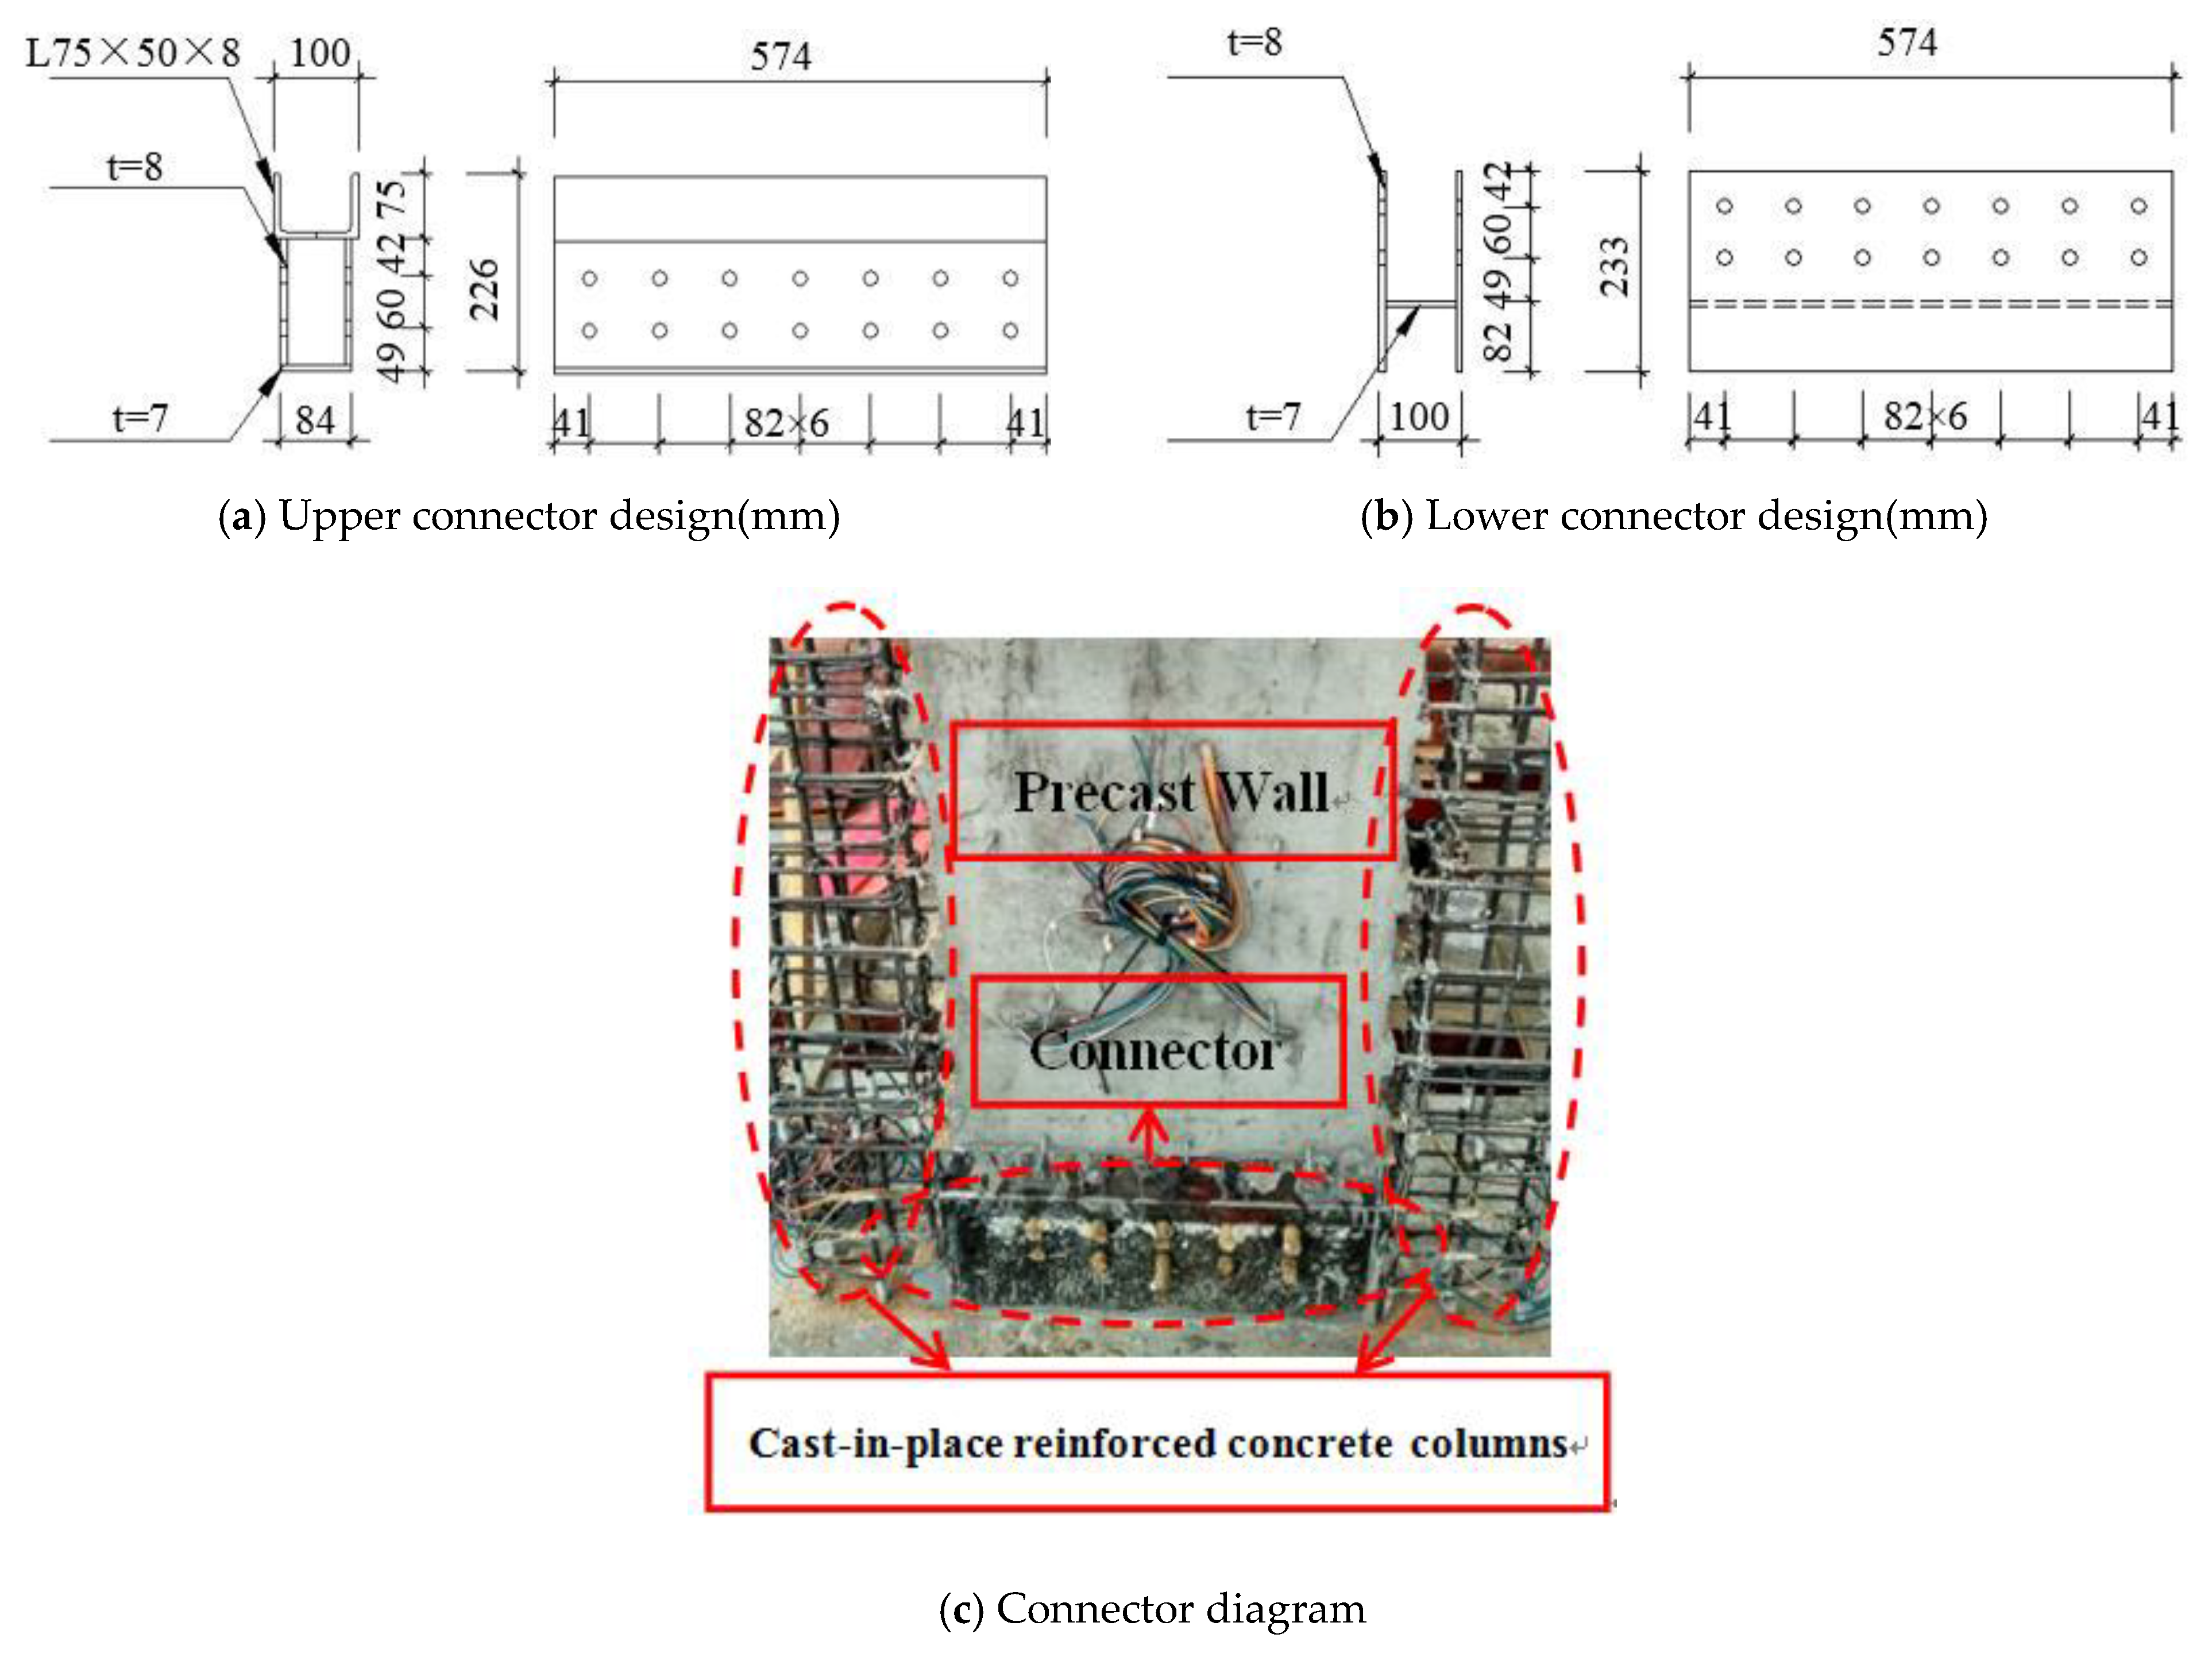
In the connection area, steel plates of Q235 are used to produce a pair of connectors with 14 holes of 20 mm in diameter. The connectors connect the upper and lower walls by means of bolts. Through the welding between the vertical rebars and the inner side of the connector, the reliable connection between the two parts can be achieved. Beside the central precast part, the columns are cast-in-place reinforced concrete. Figure 2 shows the design of the connector.
2.2. Test Setup and Loading Program
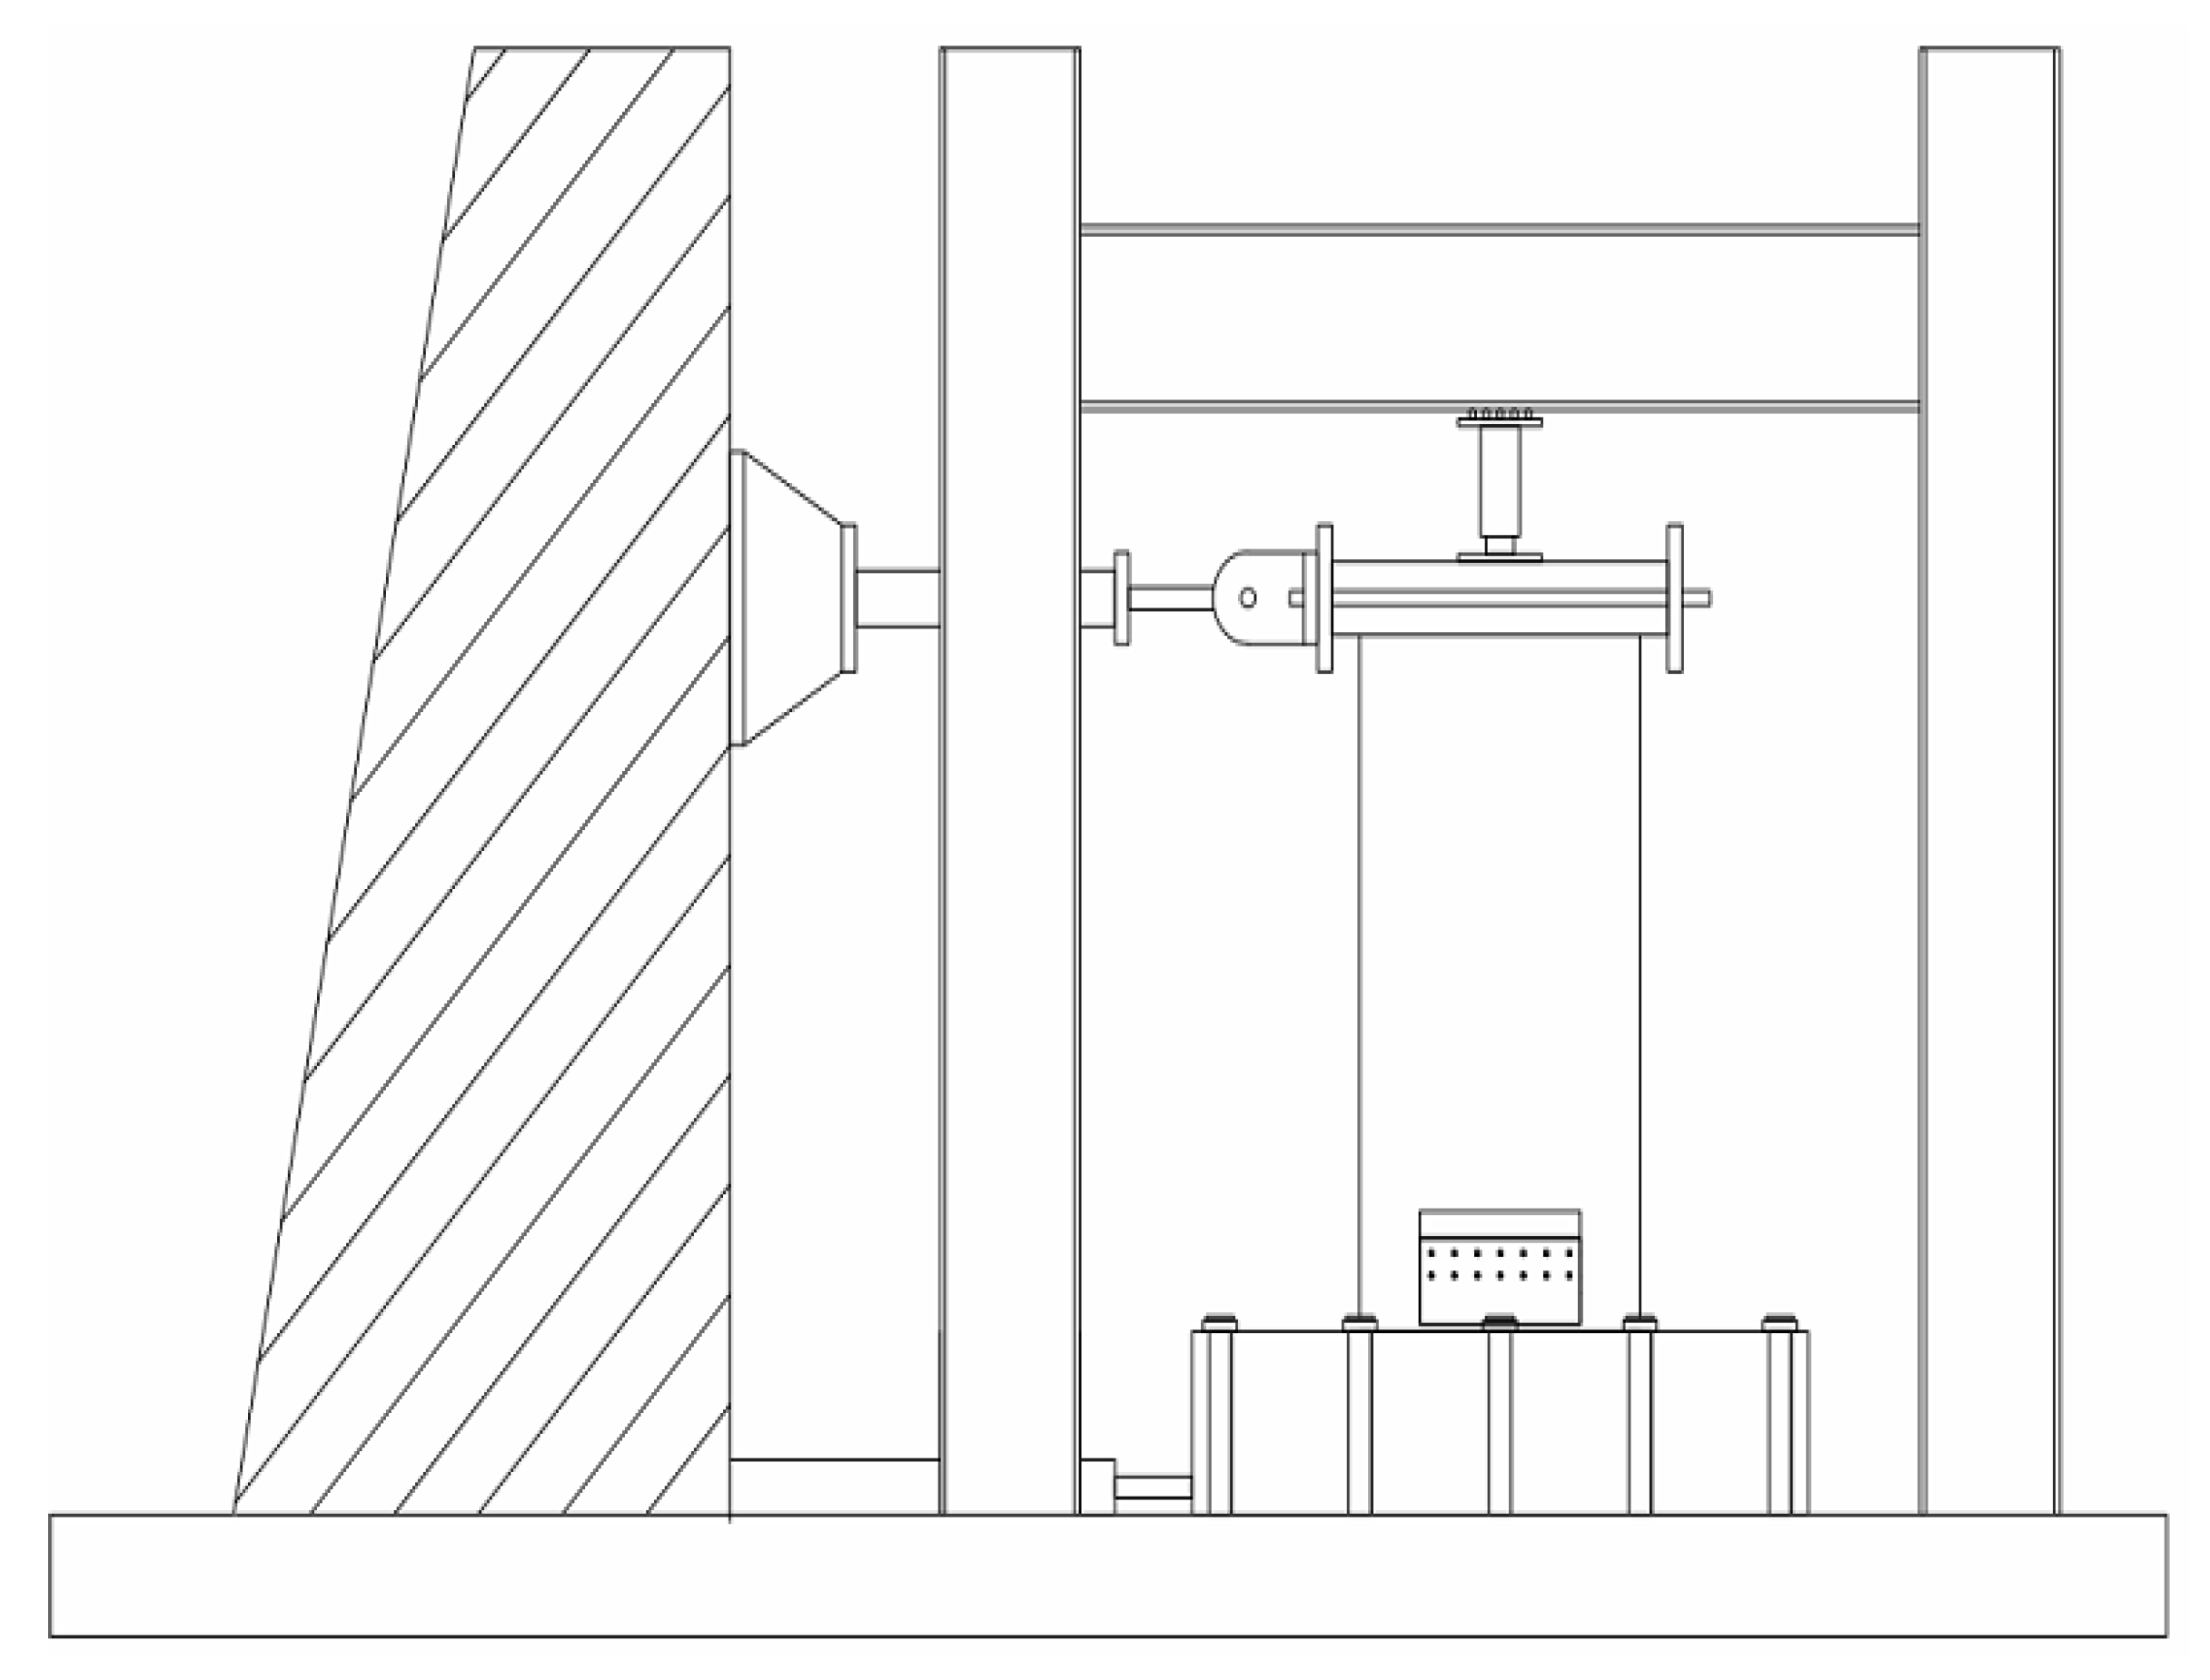
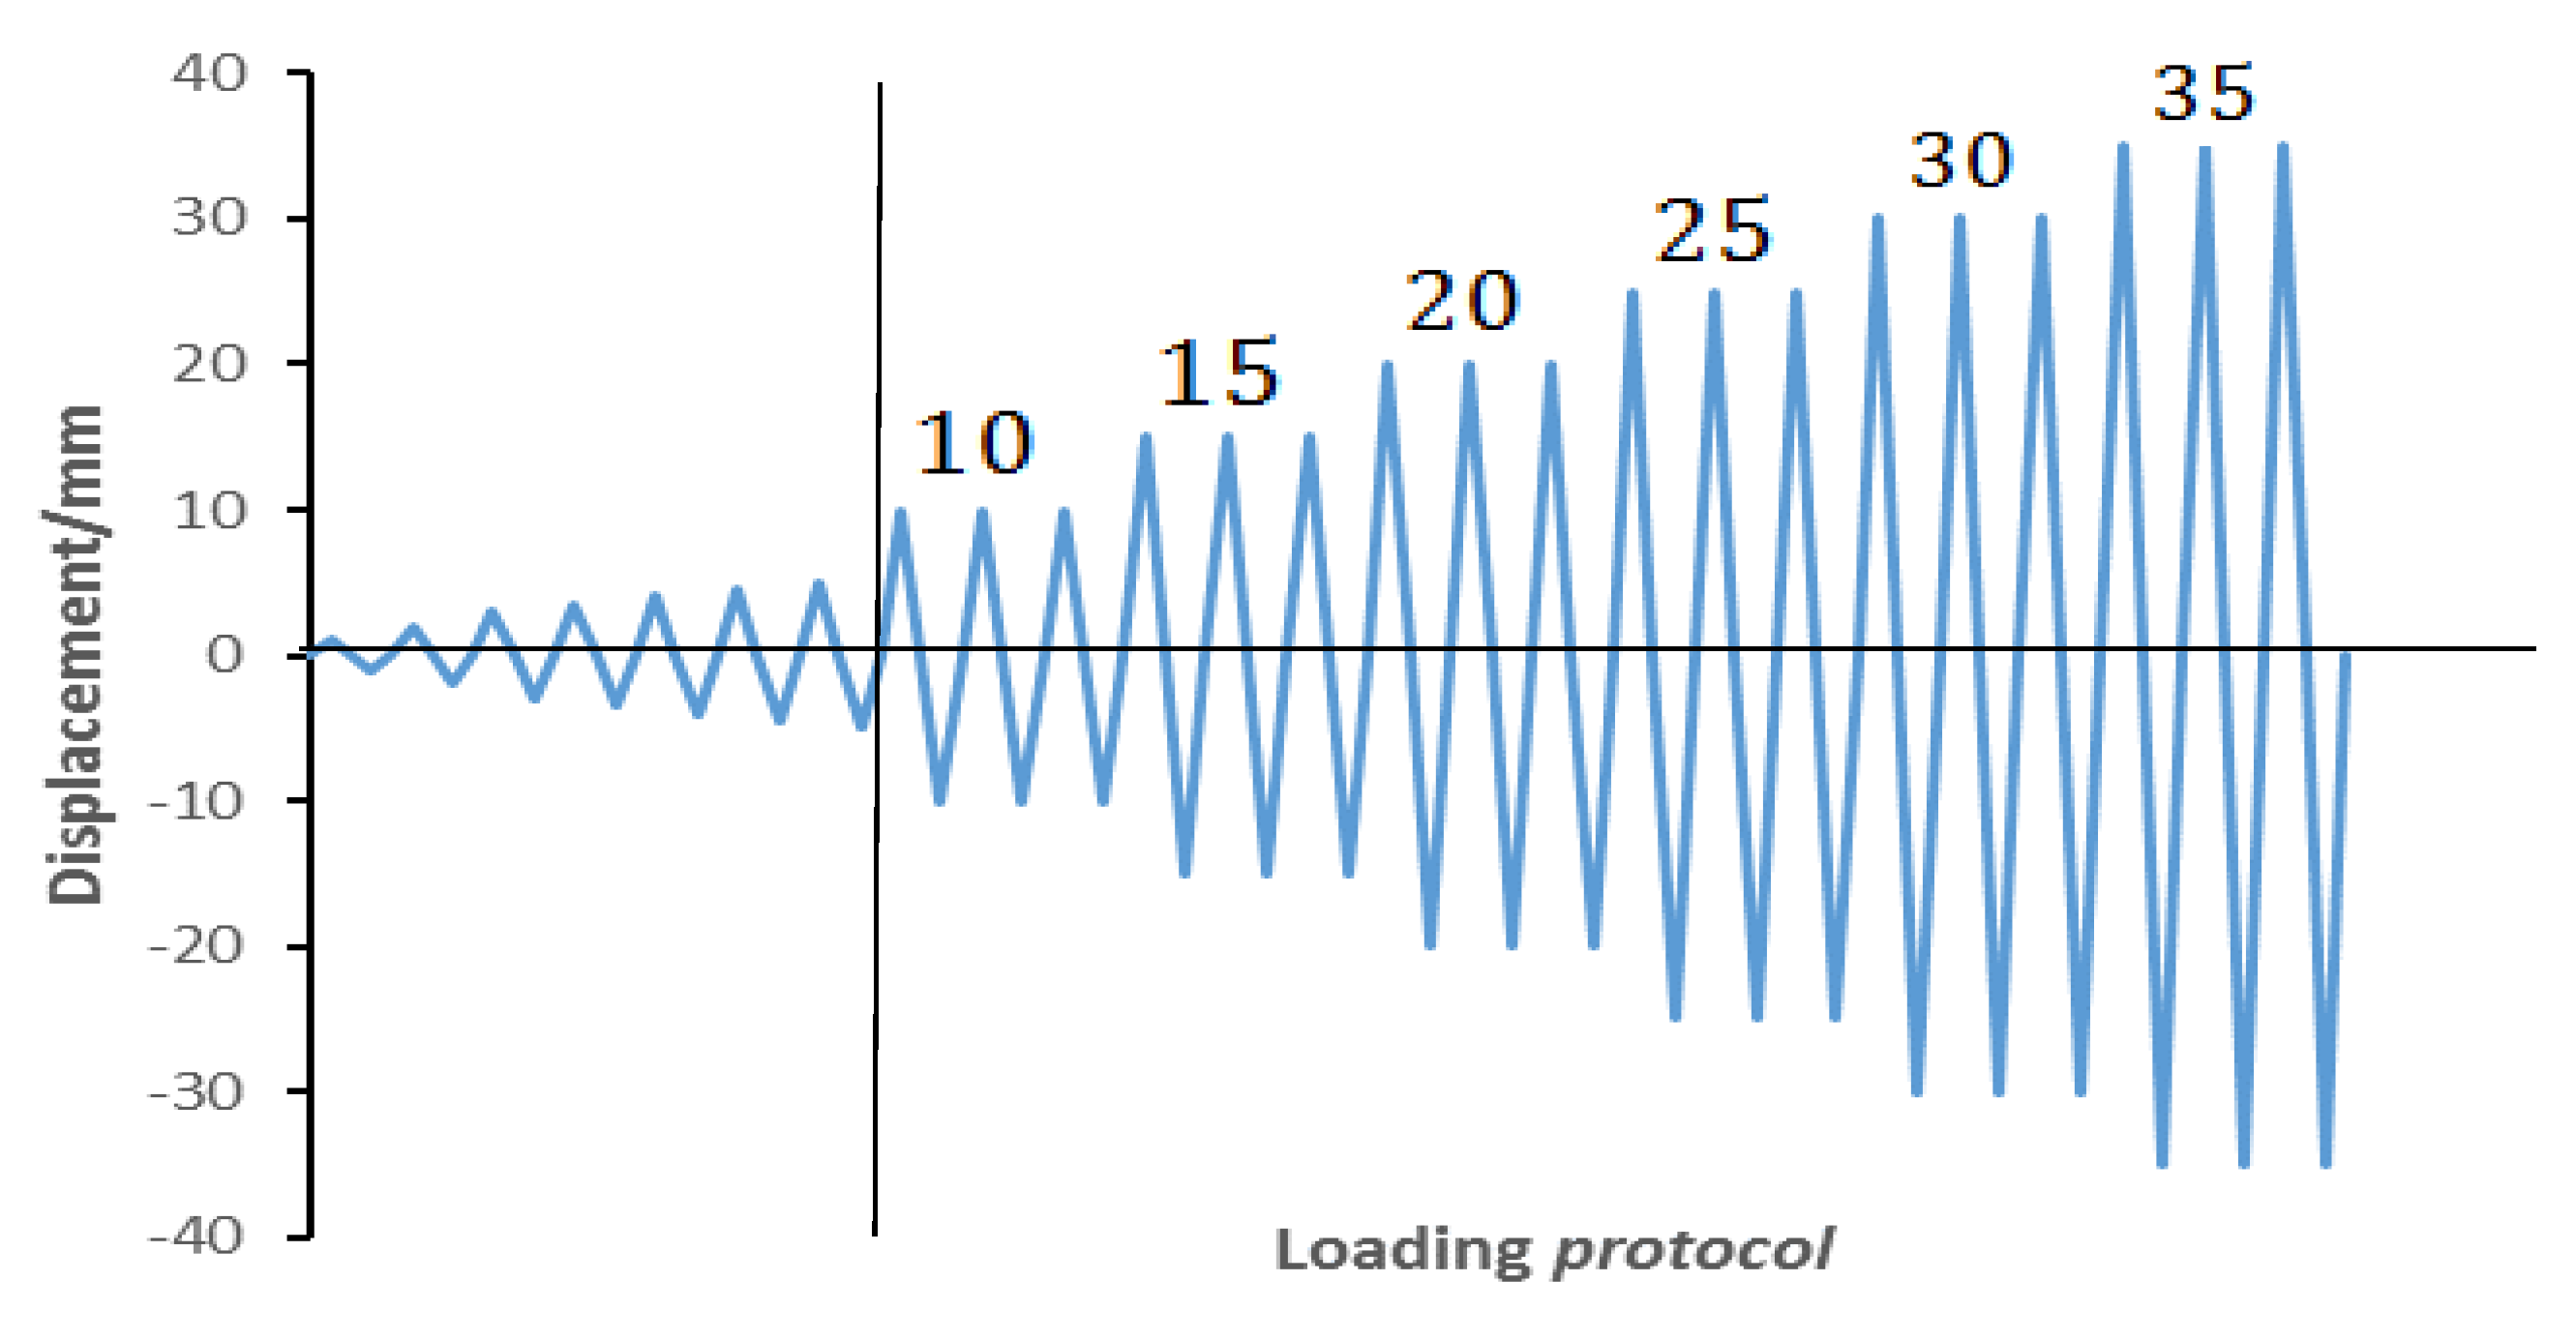
A quasi-static test of horizontal cyclic loads under constant axial pressure is conducted. In the experiment, the axial compression ratio is set to 0.2. The axial compression ratio is calculated by Equation (1). Figure 3 shows the test setup of the specimens. The vertical load is applied to the specimens by a 500 kN hydraulic jack, and the horizontal cyclic load is applied by a 500 kN MTS actuator. According to the Code for Seismic Test of Buildings [45], the horizontal load is controlled by displacement. Before the specimen yields, the amplitude of the applied horizontal cyclic displacement is gradually increased, such as 1 mm, 2 mm, 3 mm, 3.5 mm, 4 mm, 4.5 mm, and 5 mm. The specimen yields when the displacement reaches 5 mm. After that, the amplitude of the applied horizontal cyclic displacement is increased by multiples of the yield displacement, such as 5 mm, 10 mm, 15 mm, 20 mm, 25 mm, 30 mm, and 35 mm, until the longitudinal rebars at the bottom edge of the wall are broken, marking the failure of the specimen. The loading protocol is shown in Figure 4.
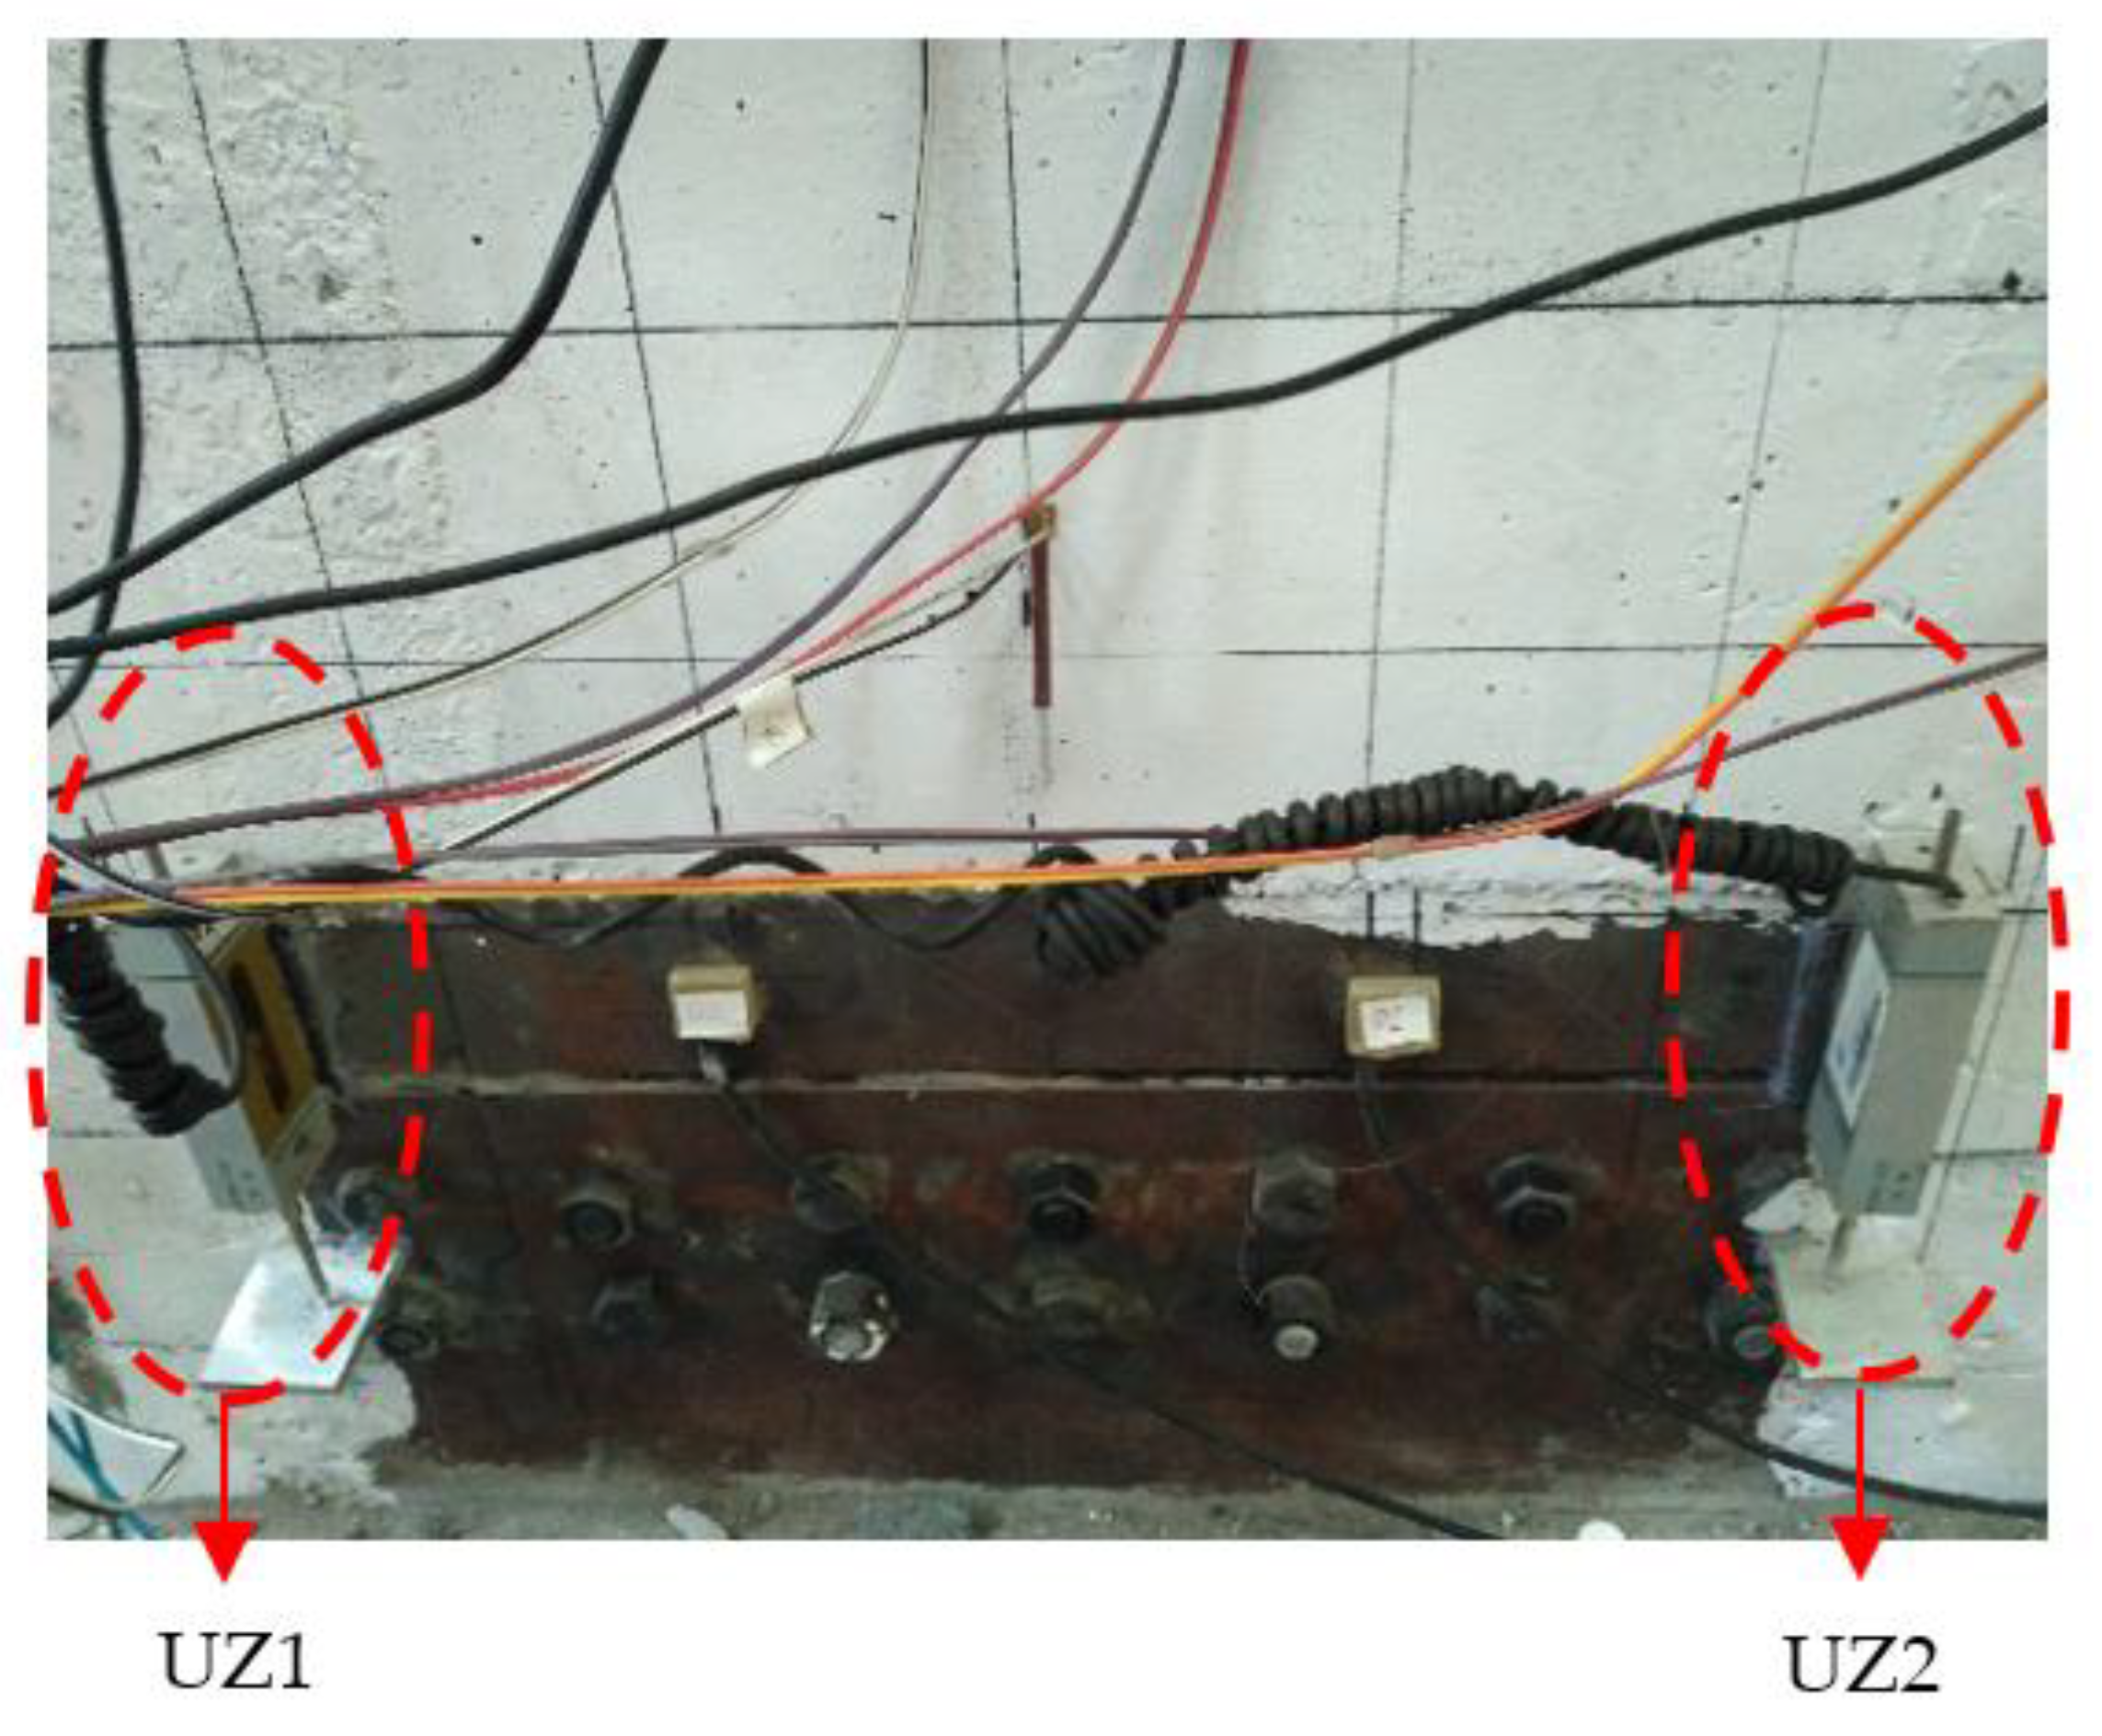
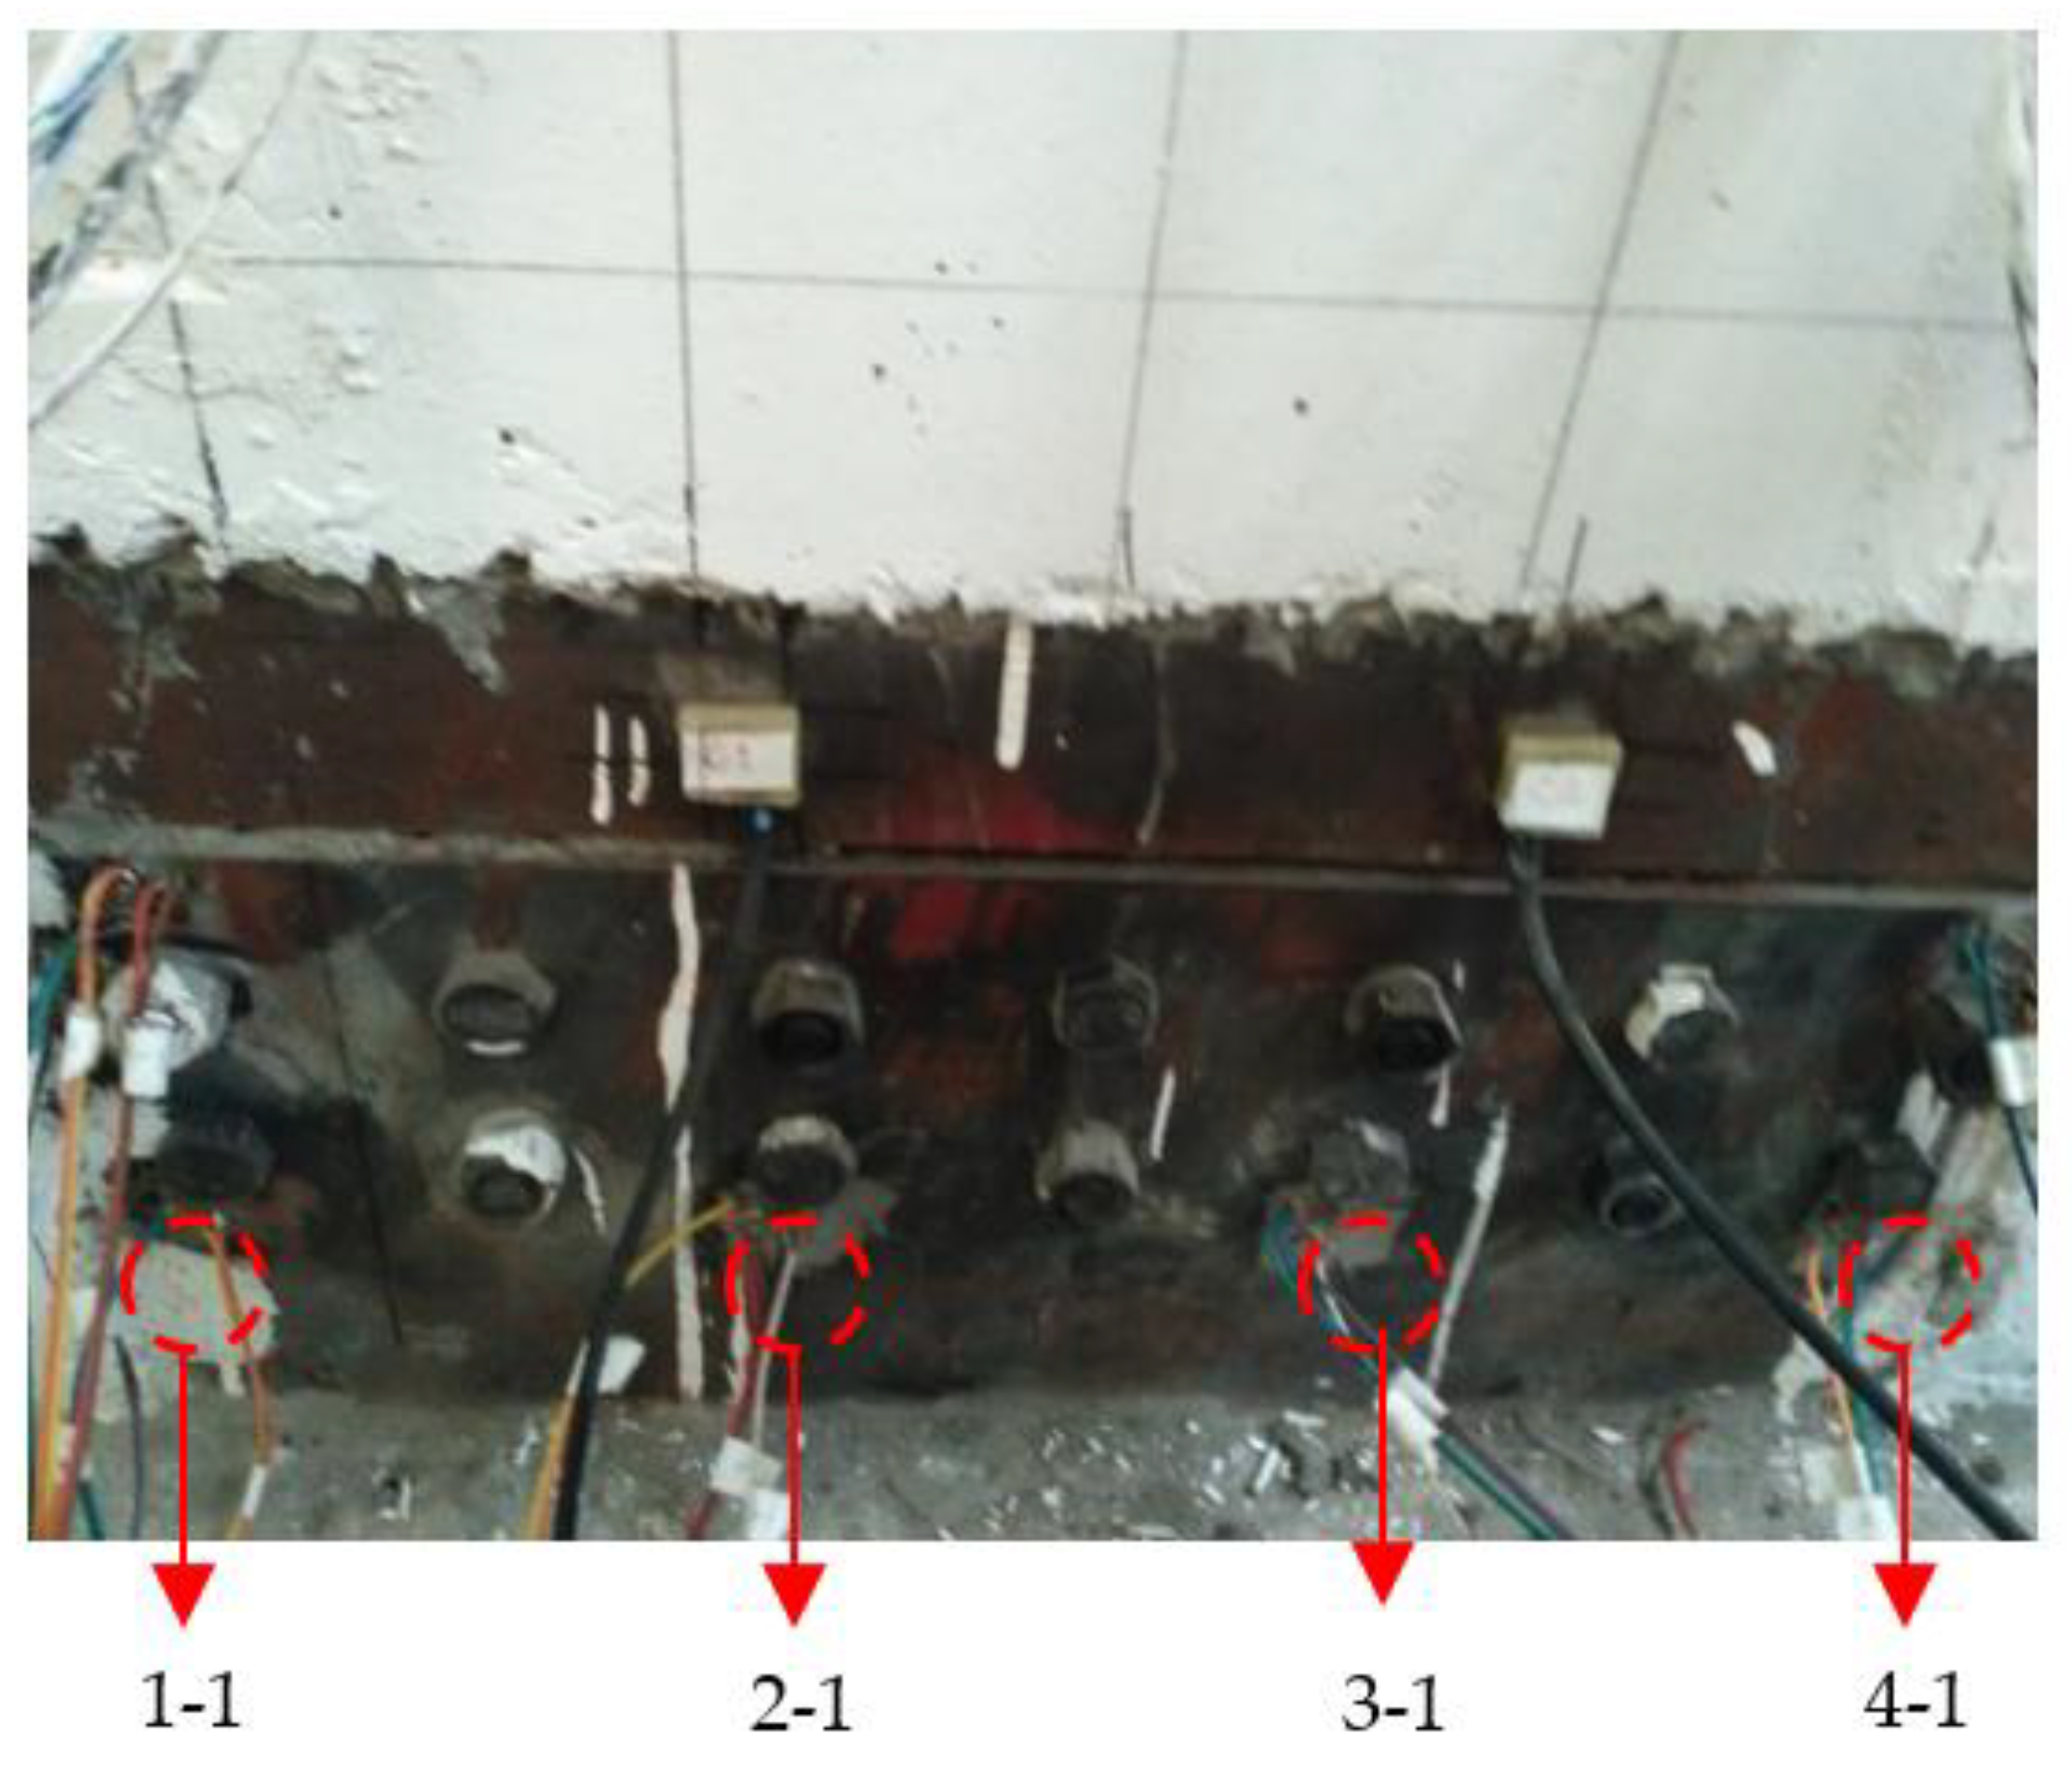
During the test, the horizontal force and horizontal displacement at the loading point are measured by a force sensor and displacement sensor in the MTS actuator. The slipping movement of the connector in the test is measured by two displacement transducers, i.e., linear variable differential transformers (LVDTs), placed on both left and right sides of the connector, as shown in Figure 5. In addition, the strains of the connector are measured by strain gauges placed on the bottom side of the bolt holes, and the details are shown in Figure 6.
where n is the axial compression ratio; N is the vertical axial load; fc is the design value of the axial compressive strength of concrete; and A is the concrete compressive area.
2.3. Experimental Results and Discussion
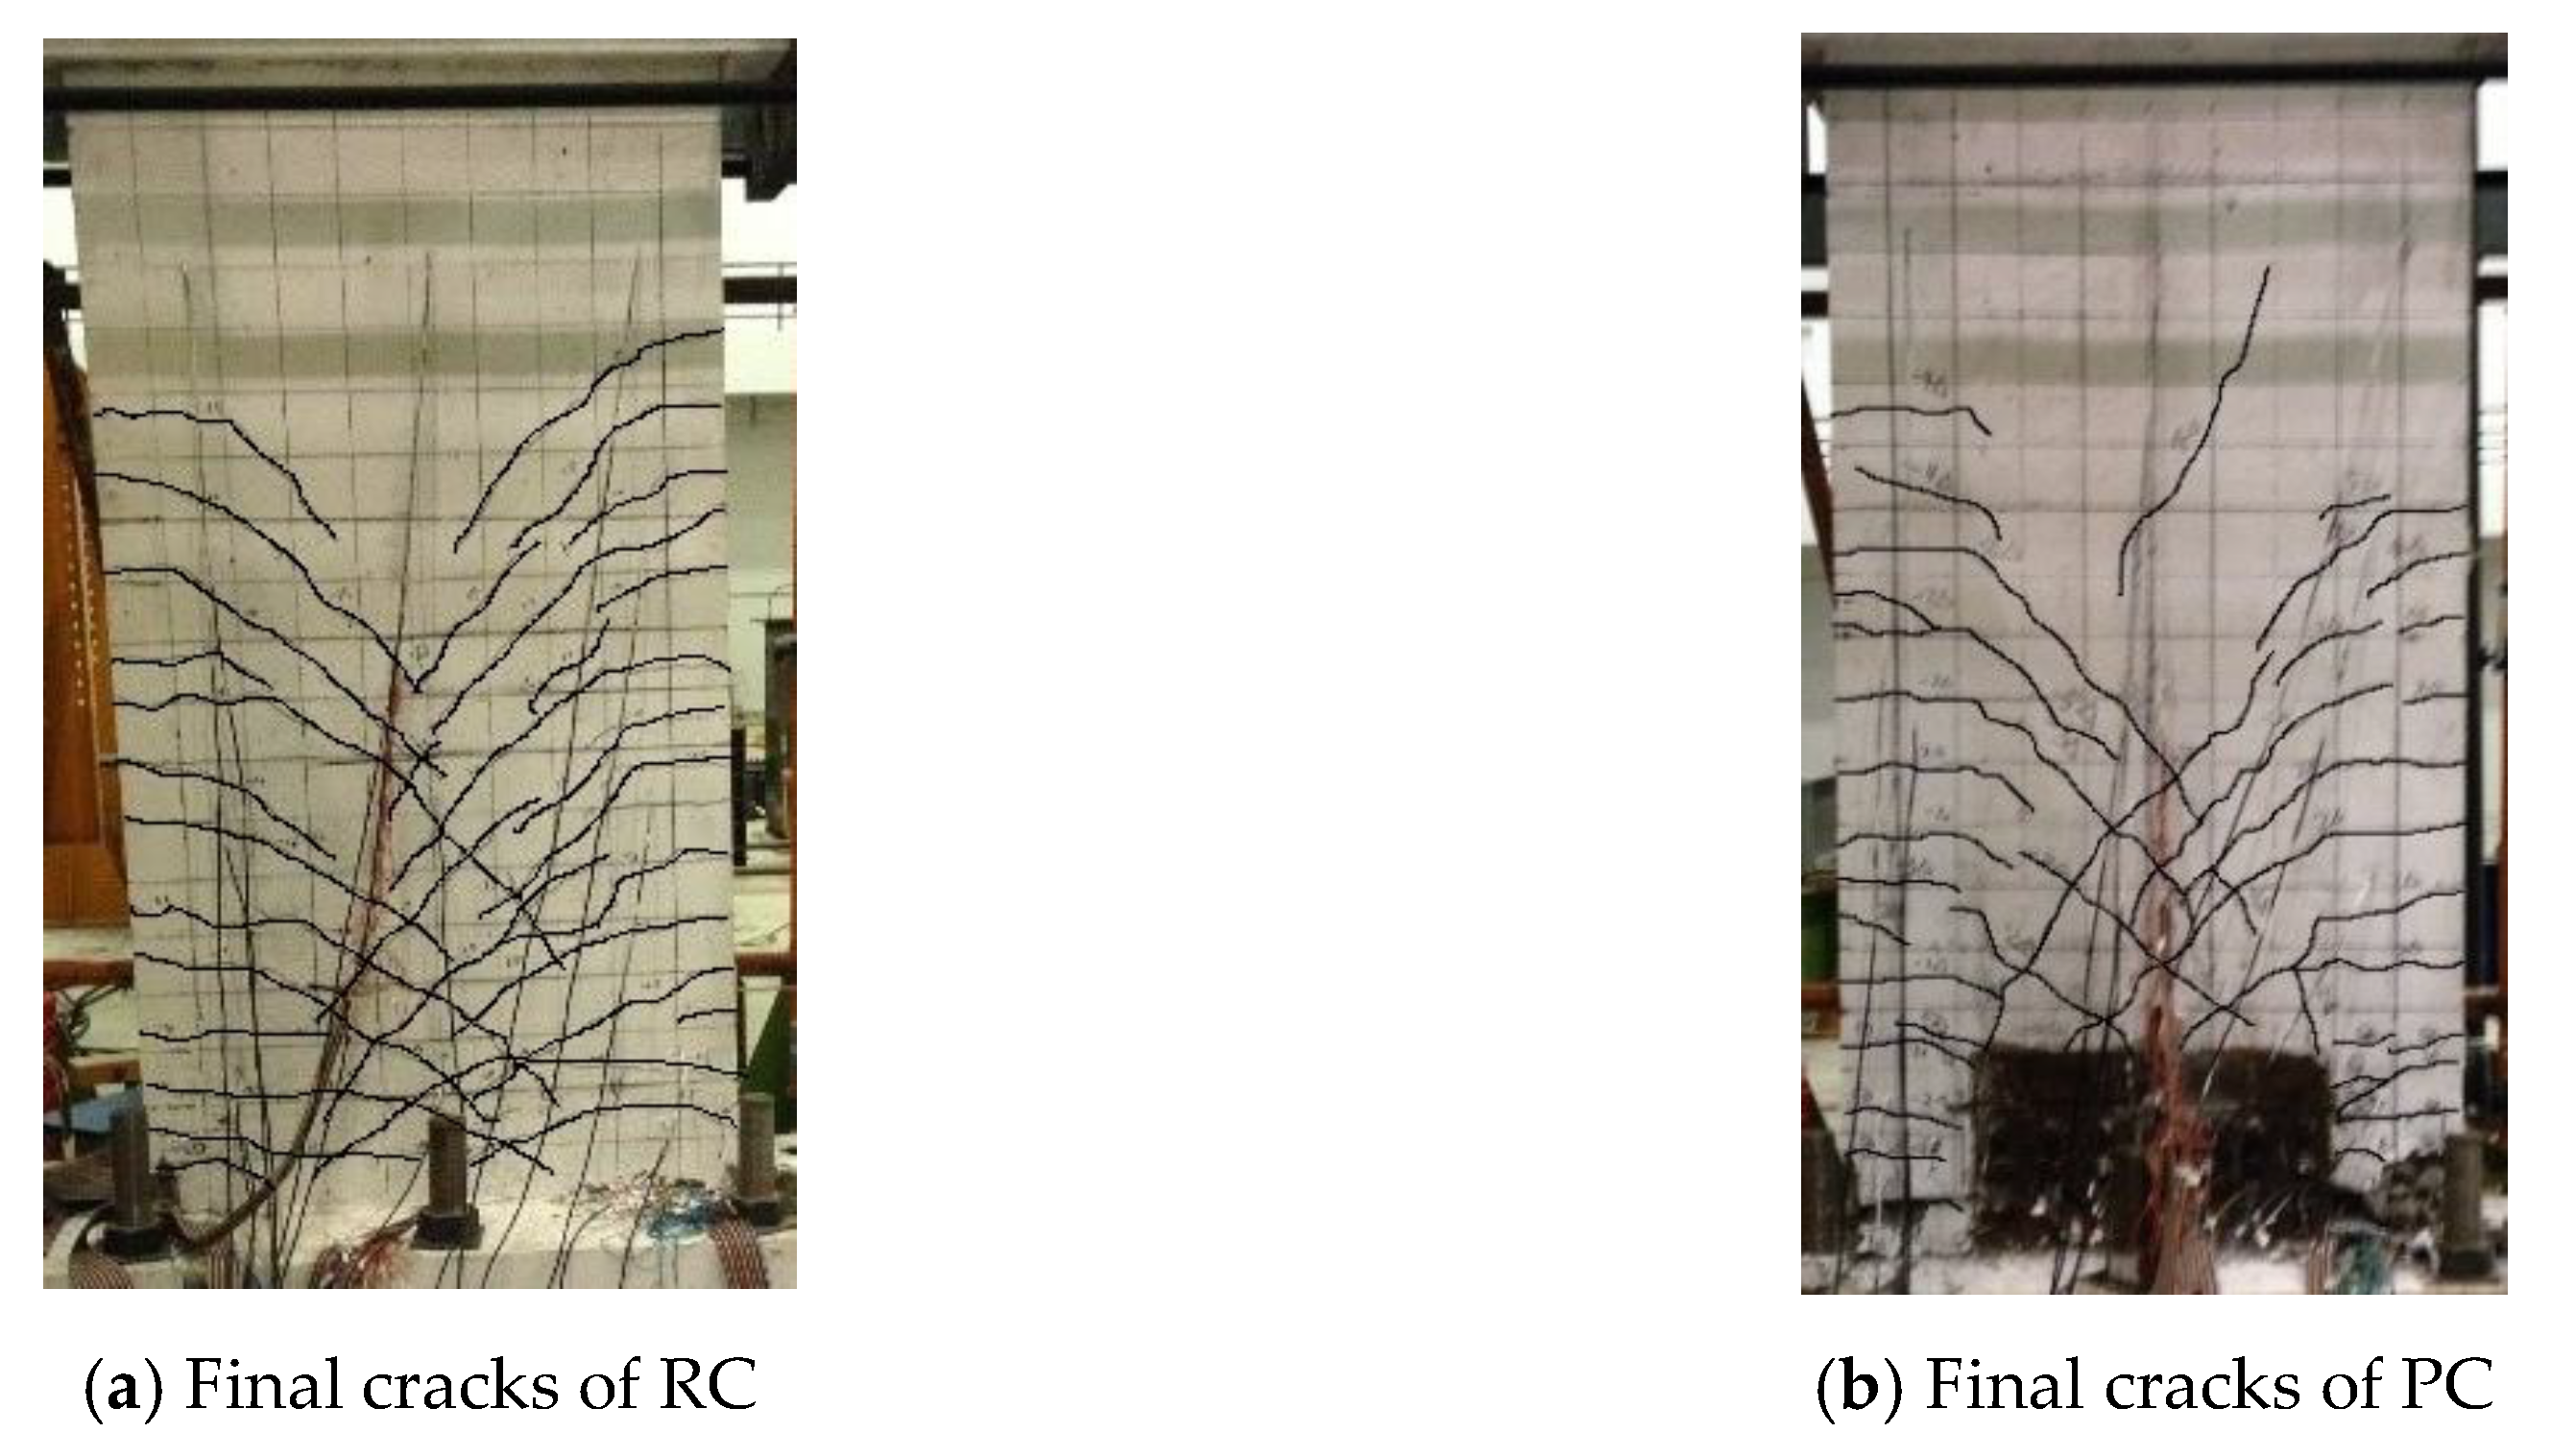
Figure 7 shows the crack patterns and failure modes. The crack development and failure mode of the PC specimen are basically the same as those of the RC specimen. The cracks are mainly bending cracks, which are horizontal at the edge of the wall; the failure modes are bending failure modes, which means that the longitudinal rebars at the bottom edge of the wall are likely to break. In summary, there is no obvious deformation and slip at the interface of the connector and the connector has little effect on the wall of the test phenomenon.
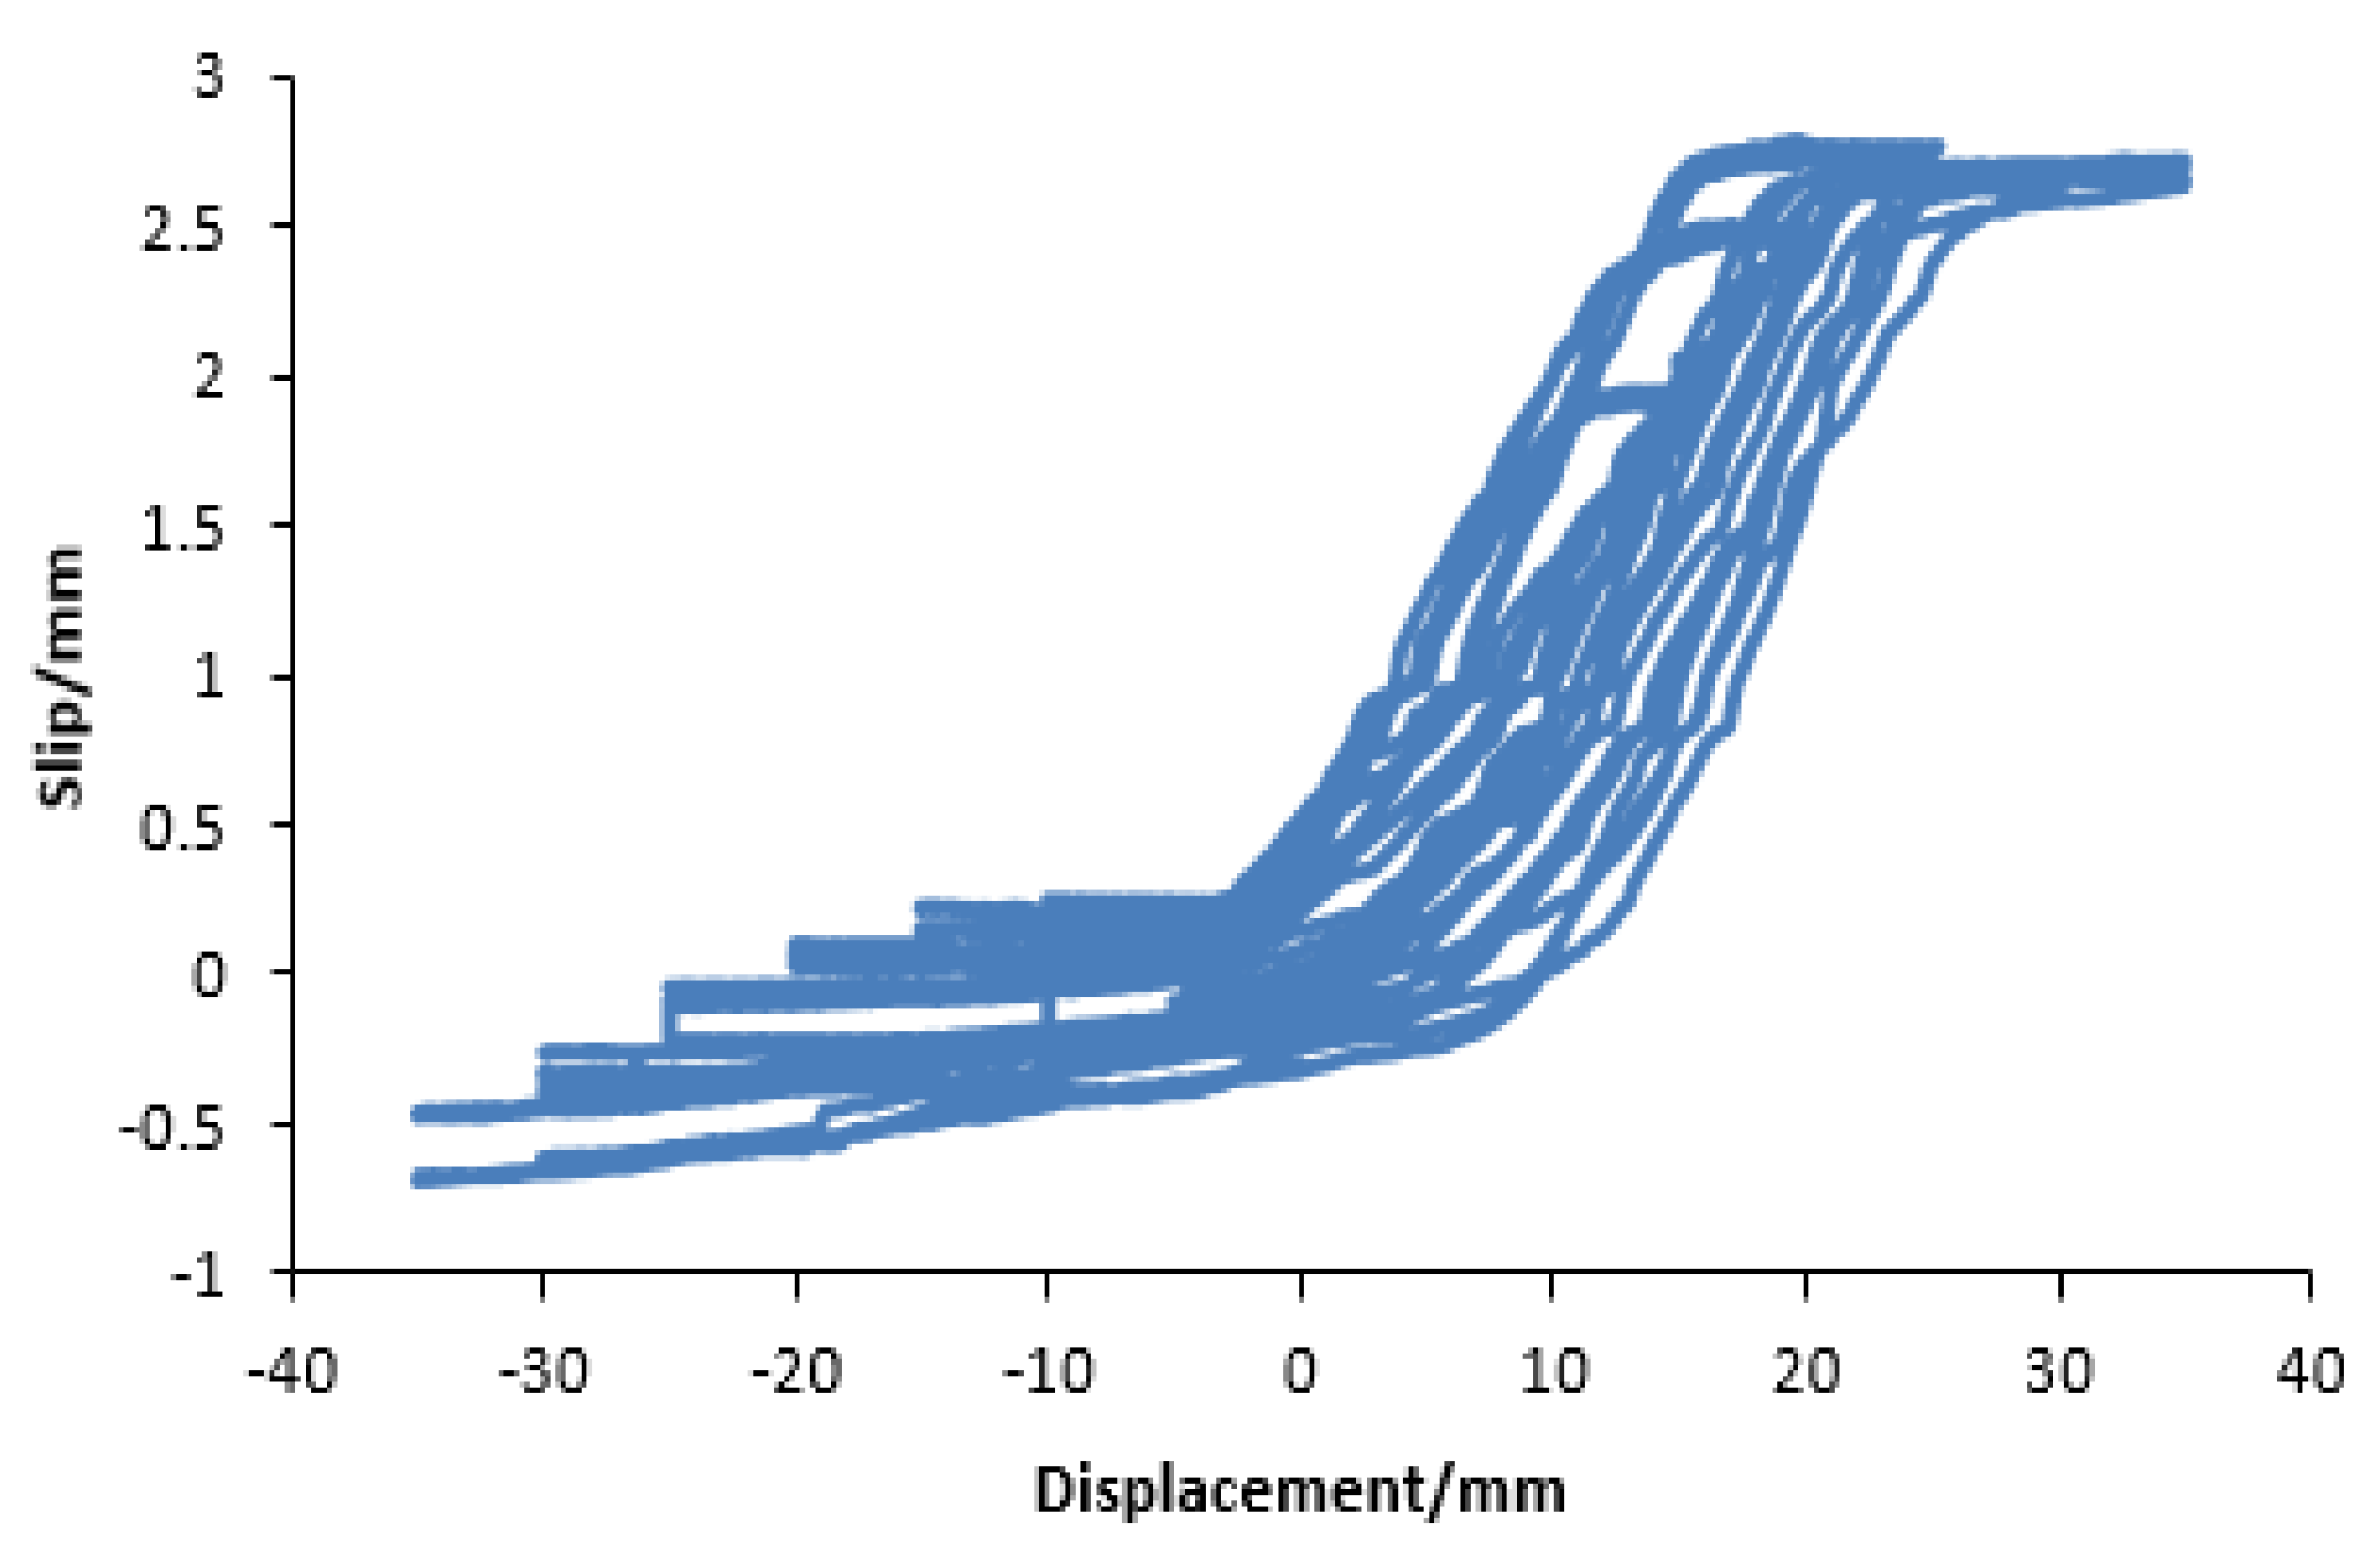
2.3.1. Slip
Slipping is inevitable with a bolted connection. Therefore, it is necessary to monitor and analyze the slip. Taking UZ1 (see in Figure 5) as an example, it is shown in Figure 8 that no slip occurs out of extrusion on the compression side of the connector. However, due to the lifting, slip occurs on the tension side of the connector. From Figure 8, it is seen that the maximum of slip is approximately 3 mm for the PC specimen; after the displacement amounts to 20 mm, the slip stops developing due to the contact between bolts and bolt holes, but the magnitude of slip remains unchanged, and can thus be depicted as horizontal lines on the curves. Furthermore, since the diameter of the bolt and the bolt hole are 20 mm and 18 mm, respectively, the magnitude of slip should be 2 mm, theoretically. However, the actual slip is greater than 2 mm due to the presence of the initial gap between the upper and lower connectors and the eccentric location of the bolts.
Through the analysis in Section 2.3.3, it can be seen that the slip hardly influences the performance of the PC specimen, while the ultimate displacement and ductility of the PC specimen are improved because of the slip.
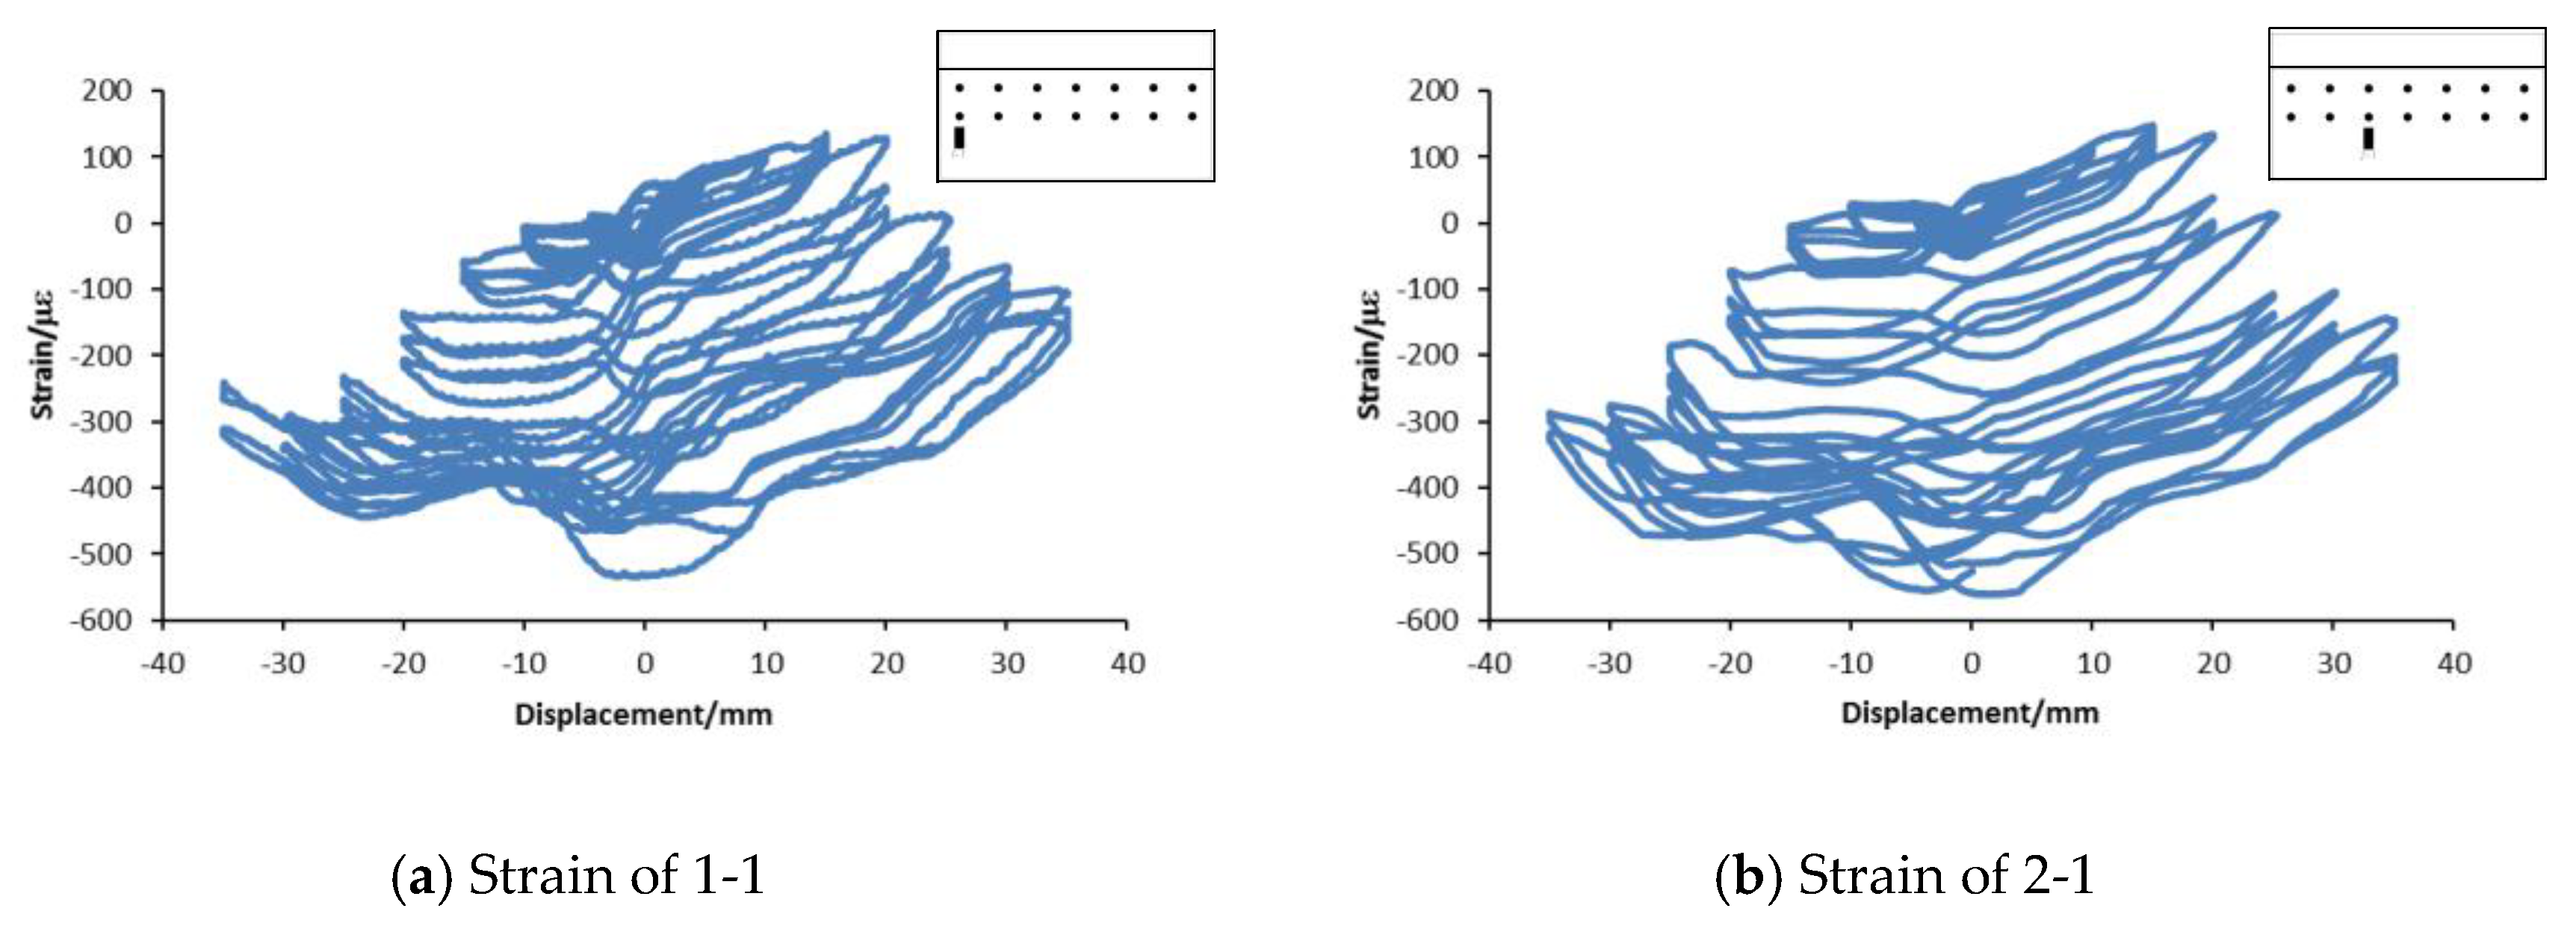
2.3.2. Strain
Figure 9 shows the connector strain-displacement curves of the PC specimen, and the location of the relevant strain gauge is shown at the top right corner of the picture. It can be seen from Figure 9 that the maximum of strain is in the range of [−600µε, 200µε]. Thus, it is concluded that the connector will not fail, which is matched with the failure mode shown in Figure 7, due to the fact that the maximum of strain never reaches the yield strain (2000µε).
2.3.3. Seismic Performance of the PC Specimen
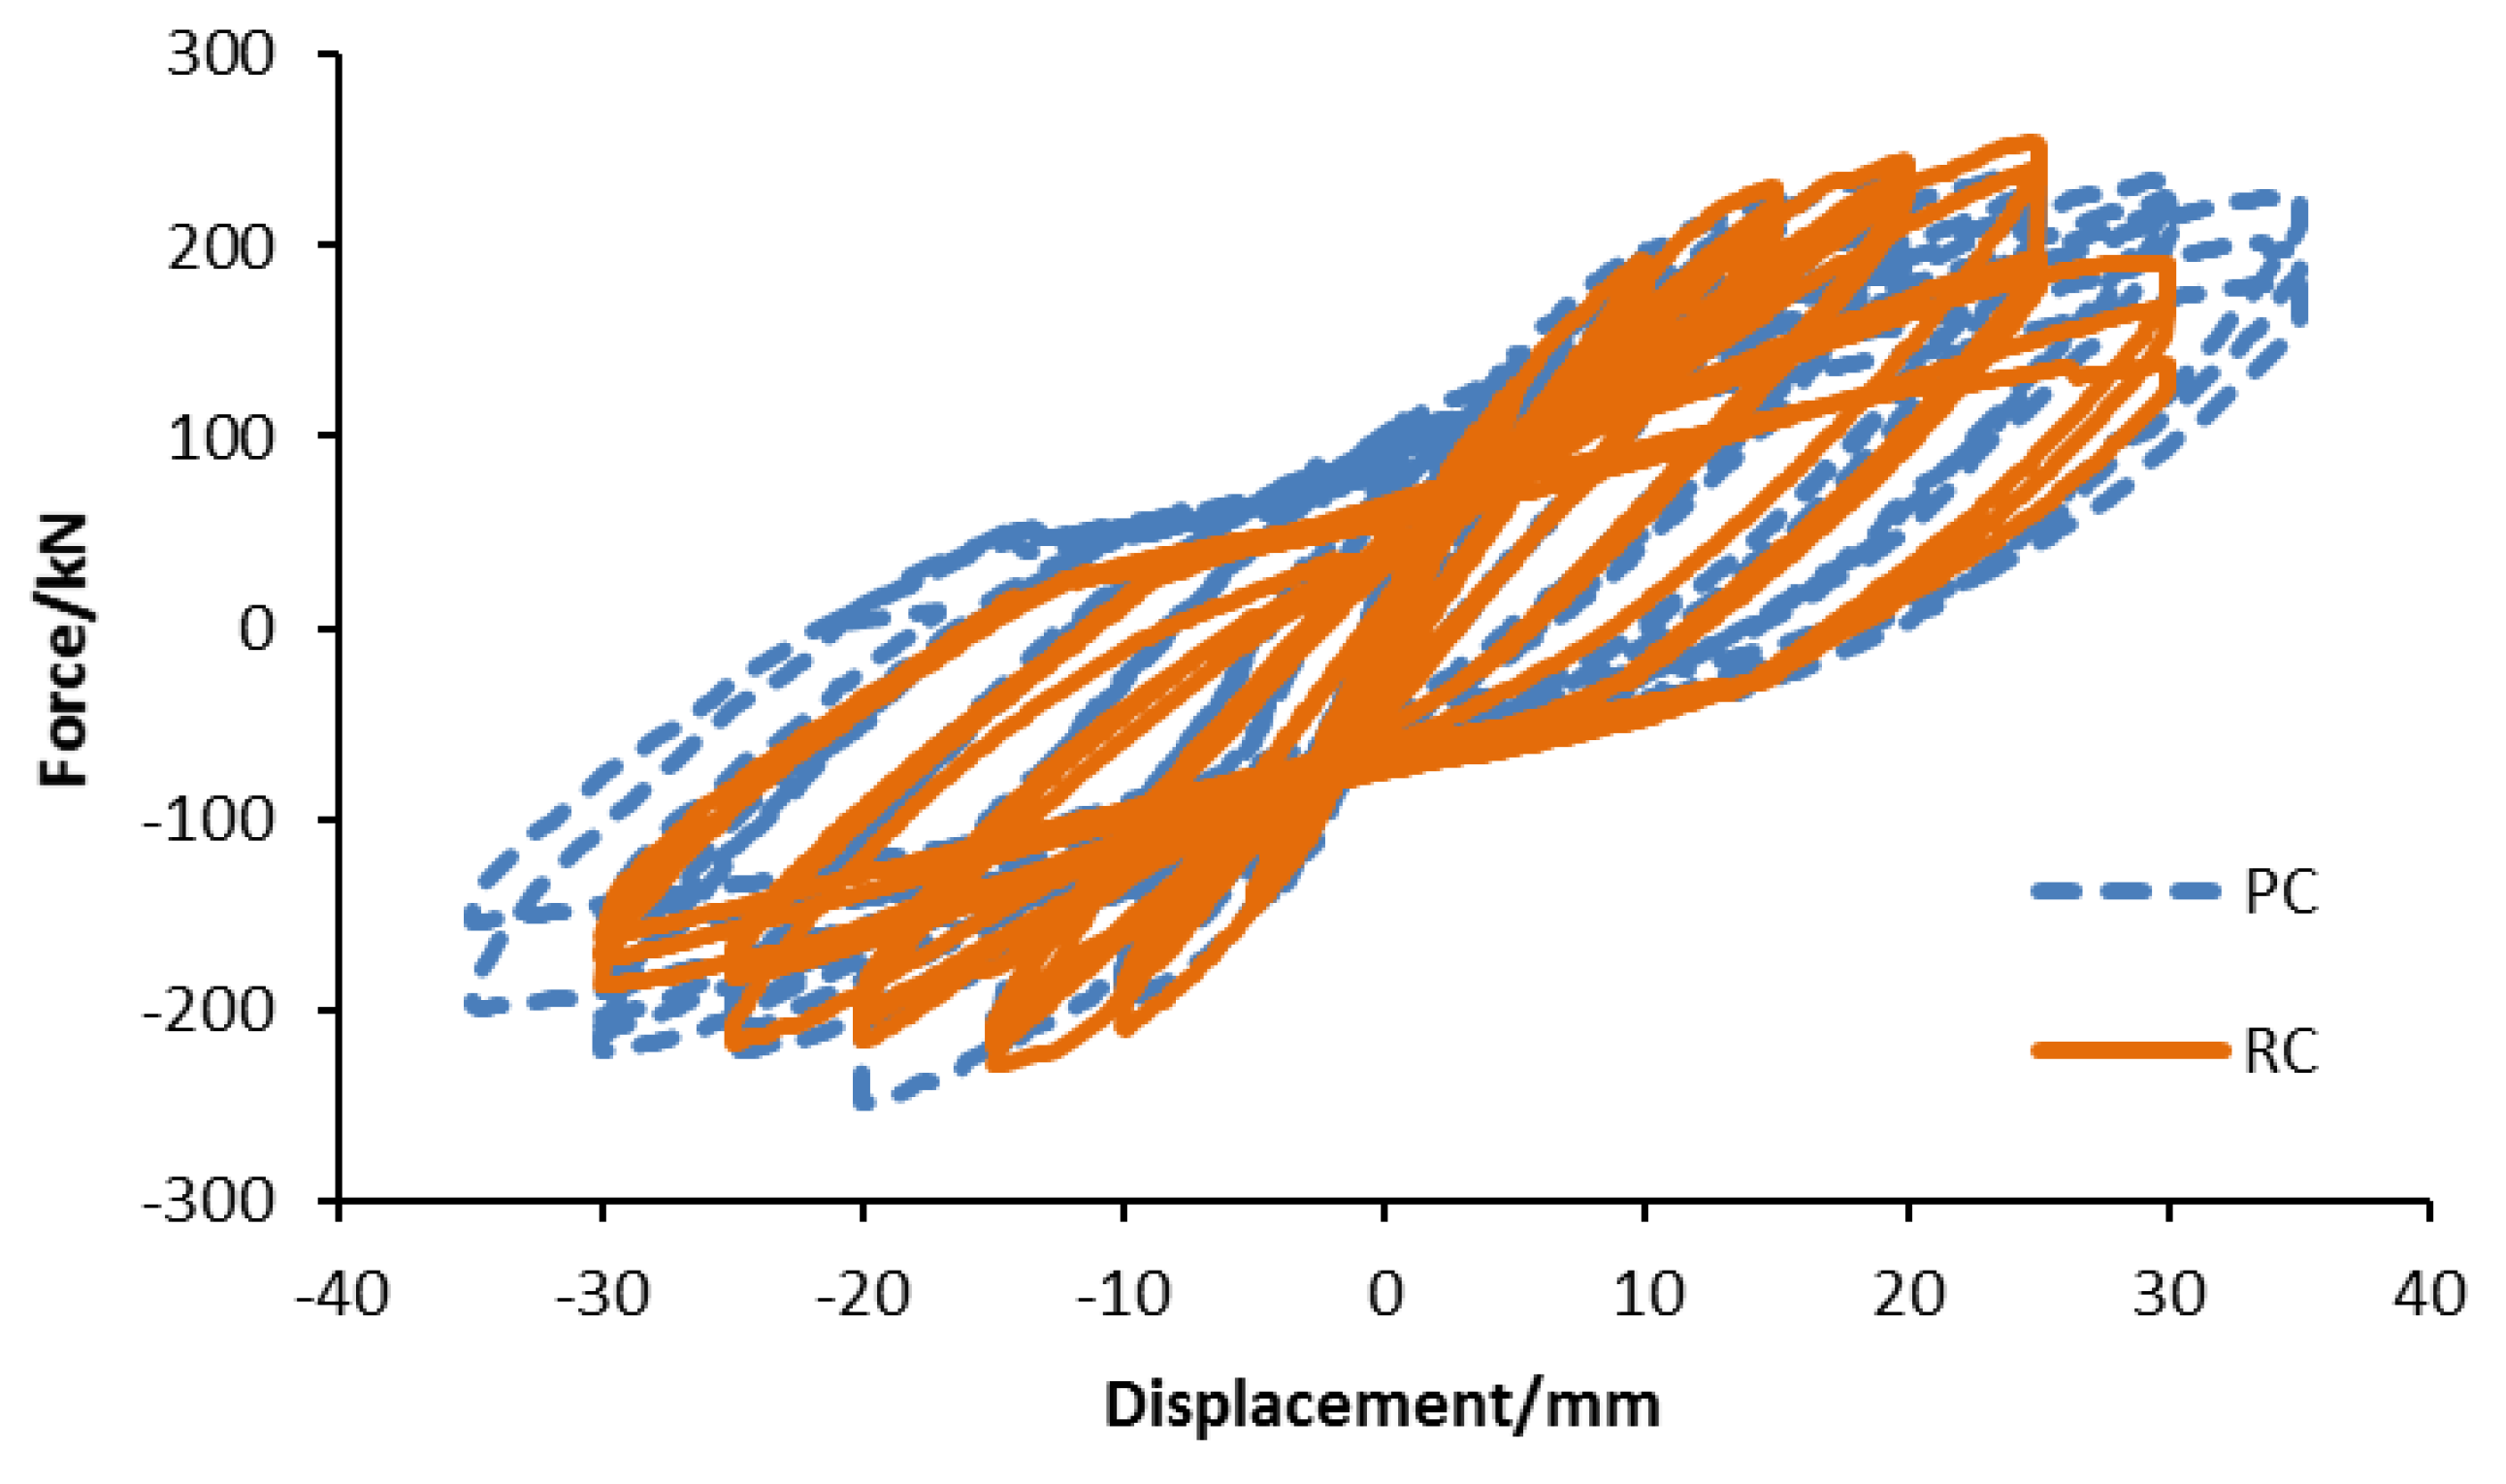
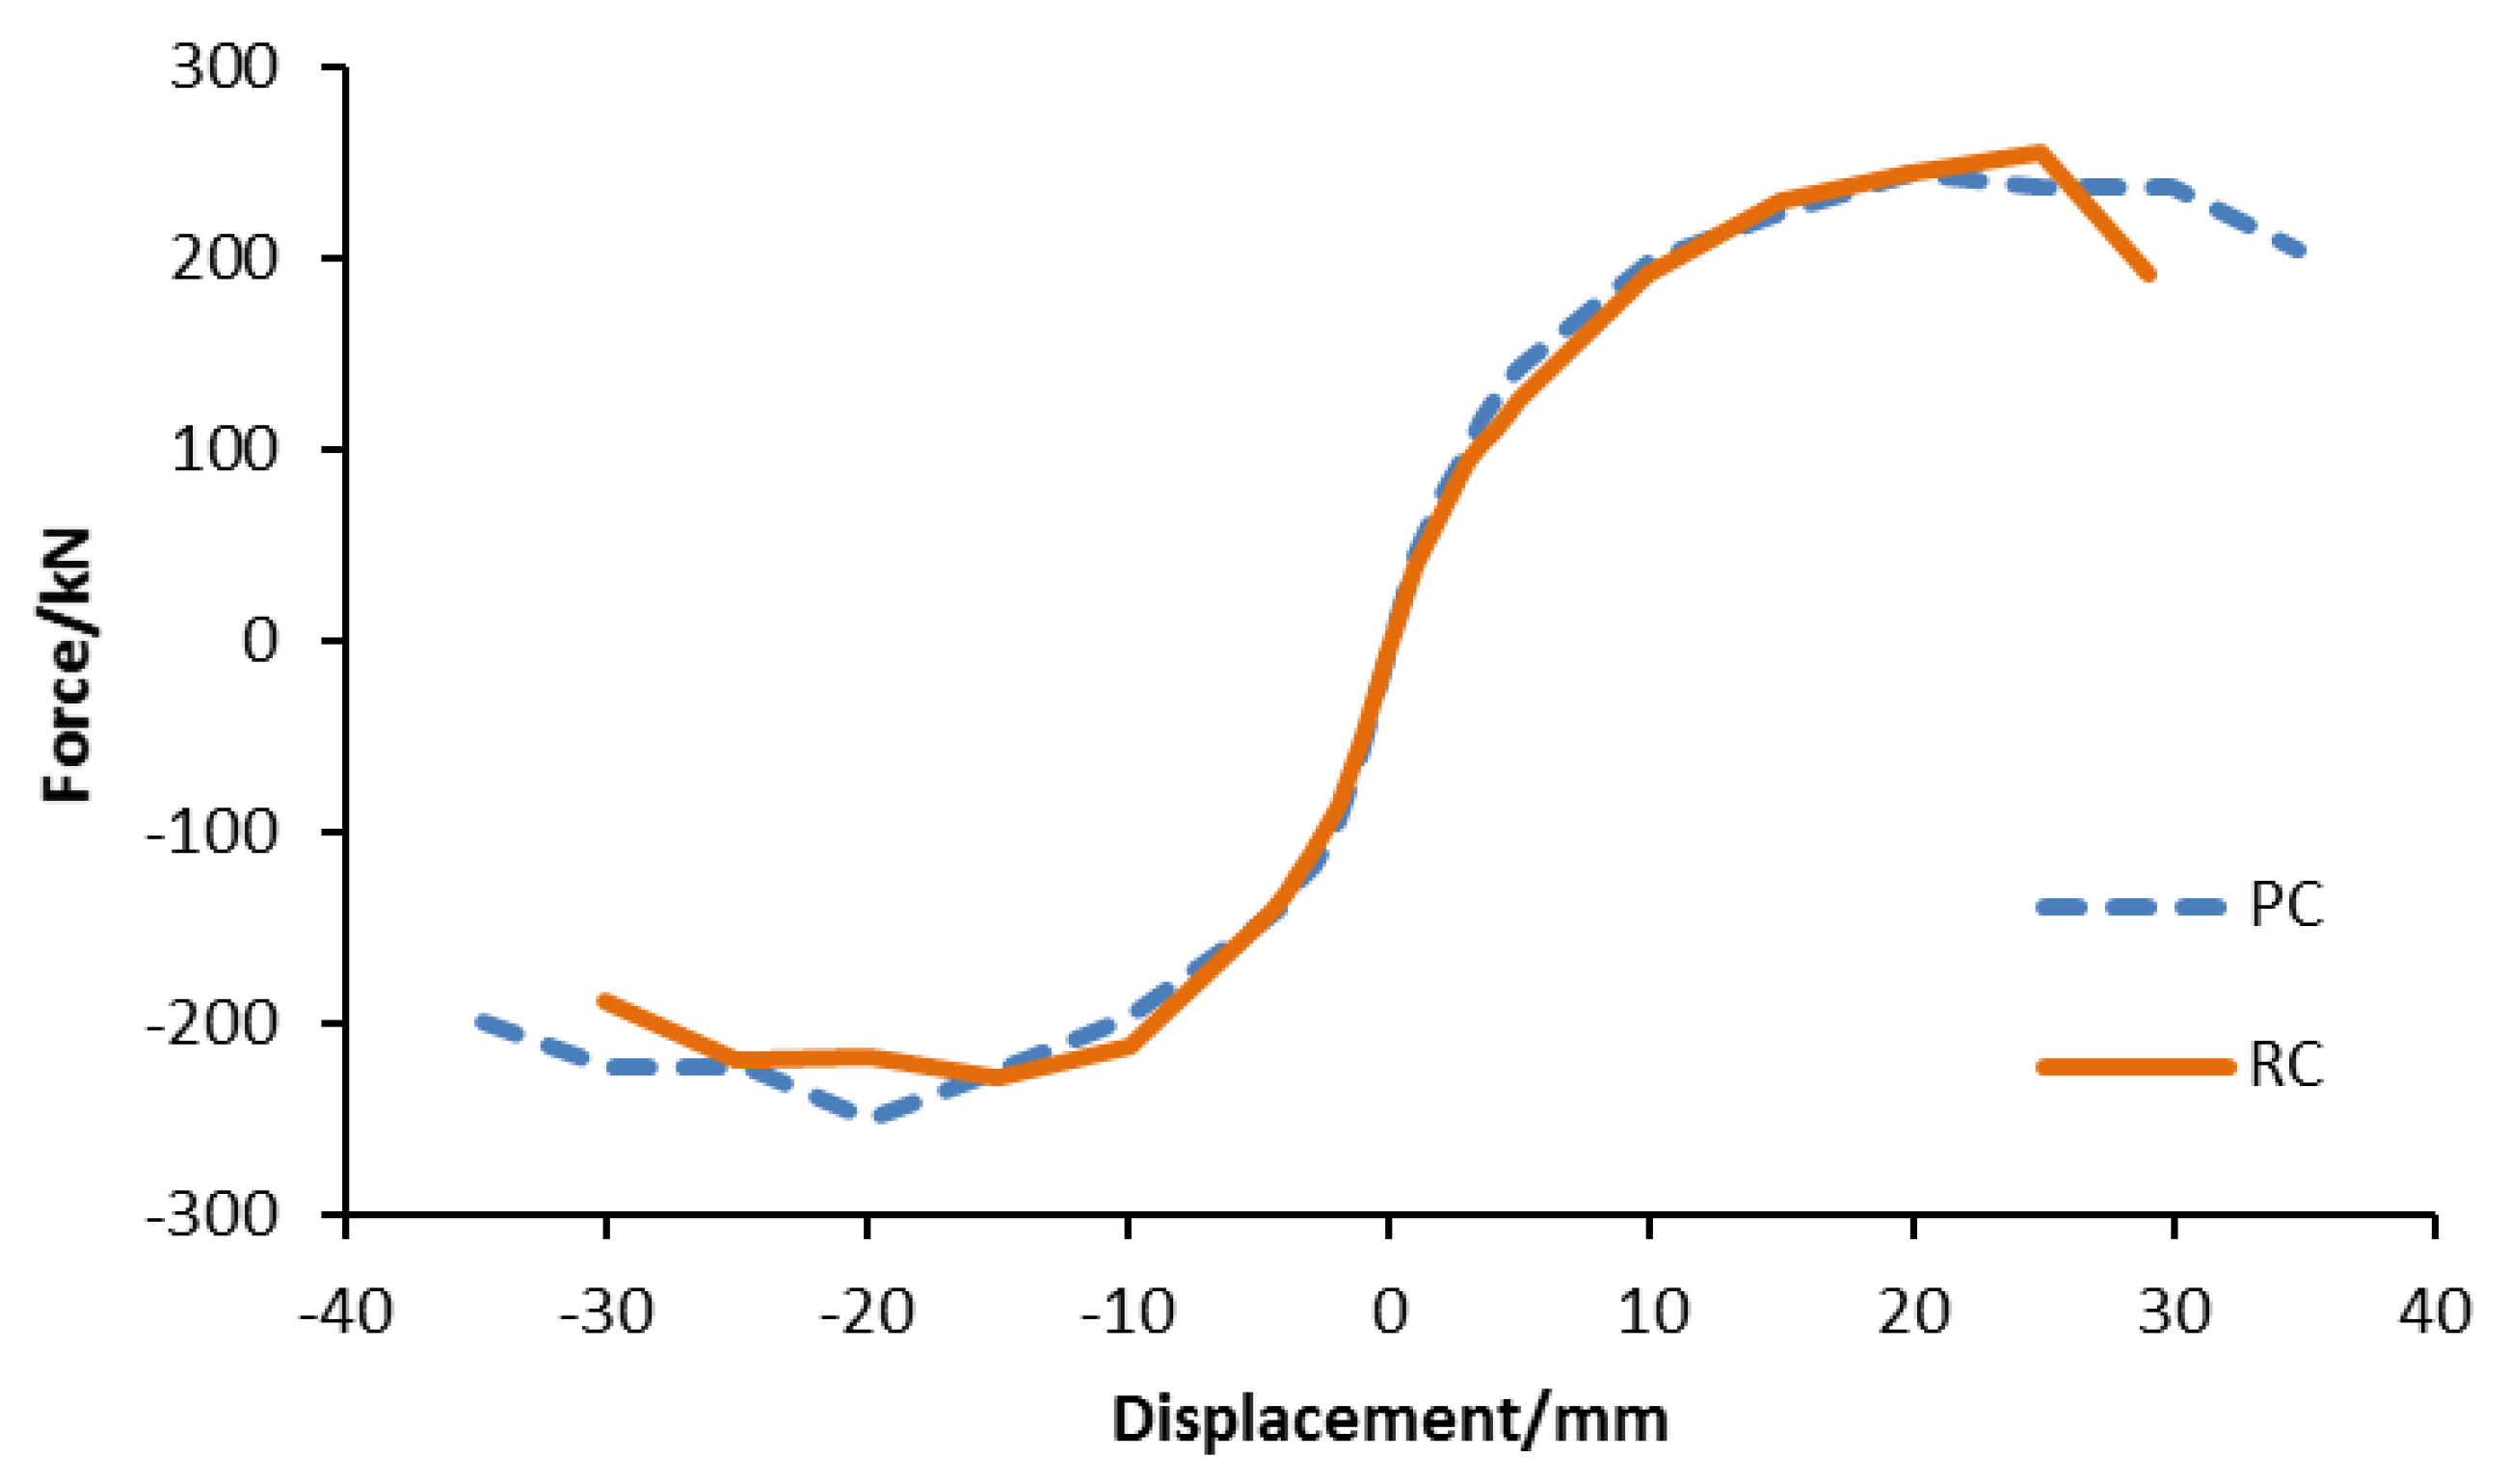
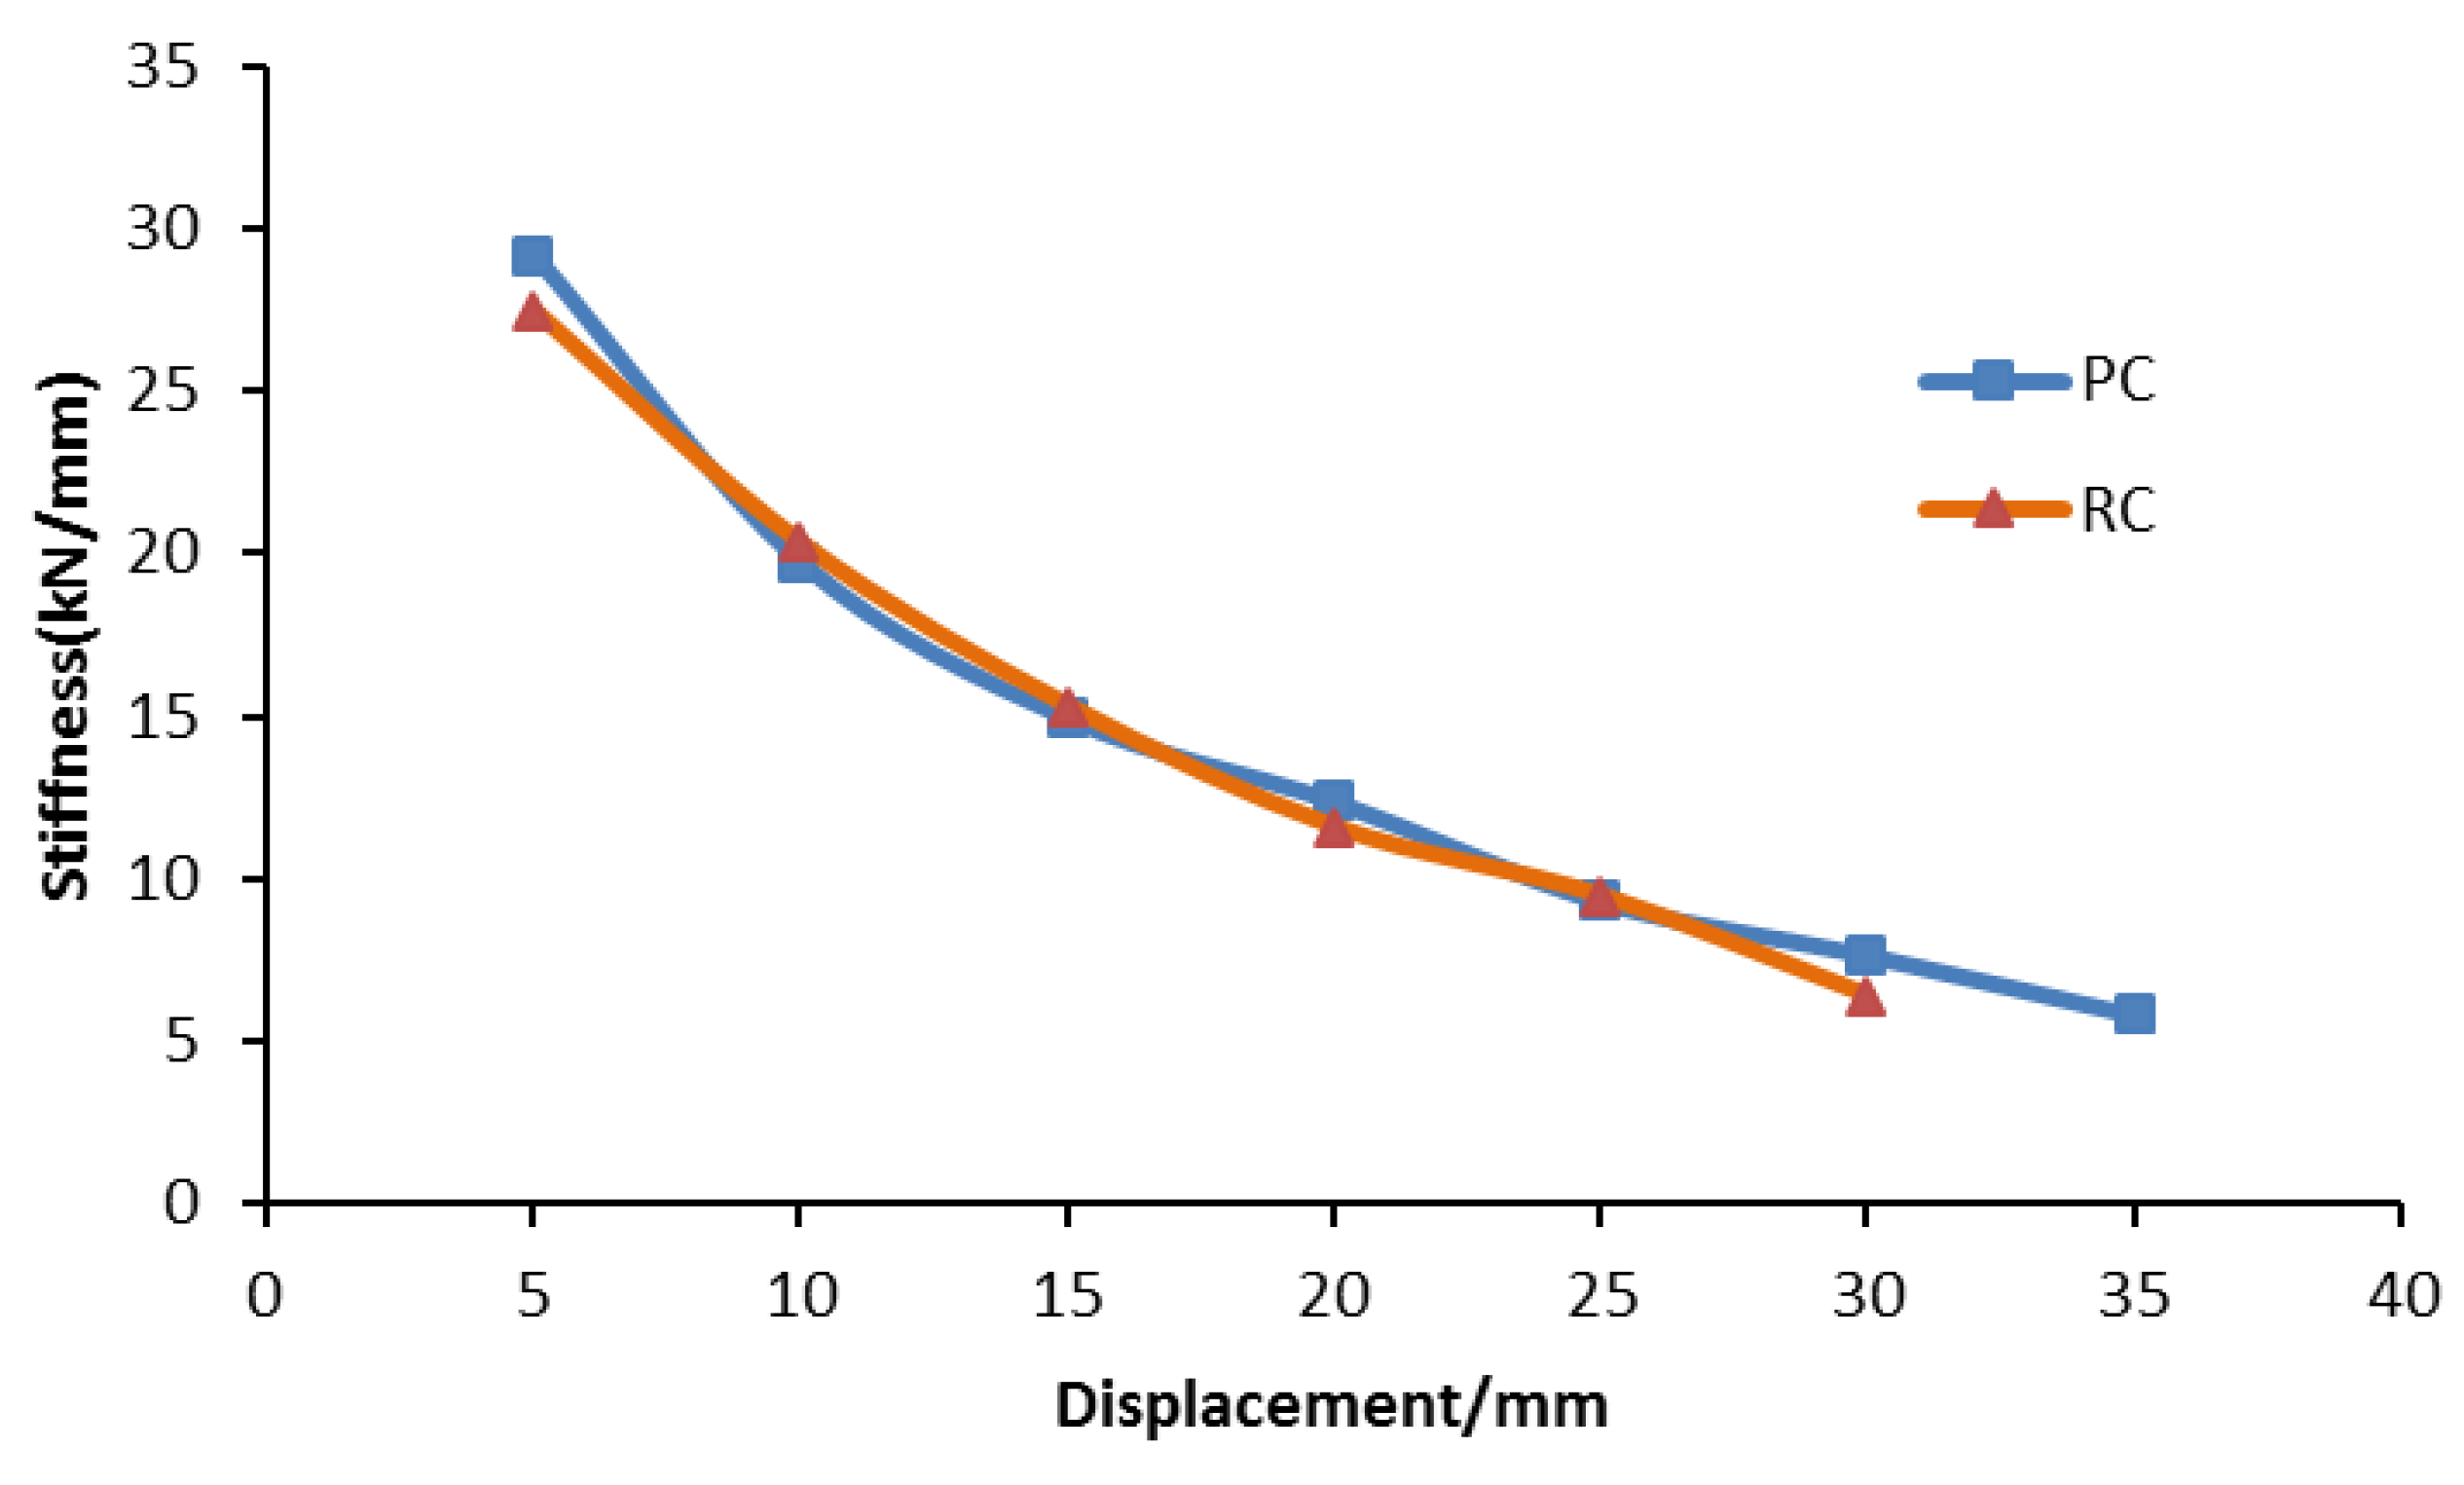
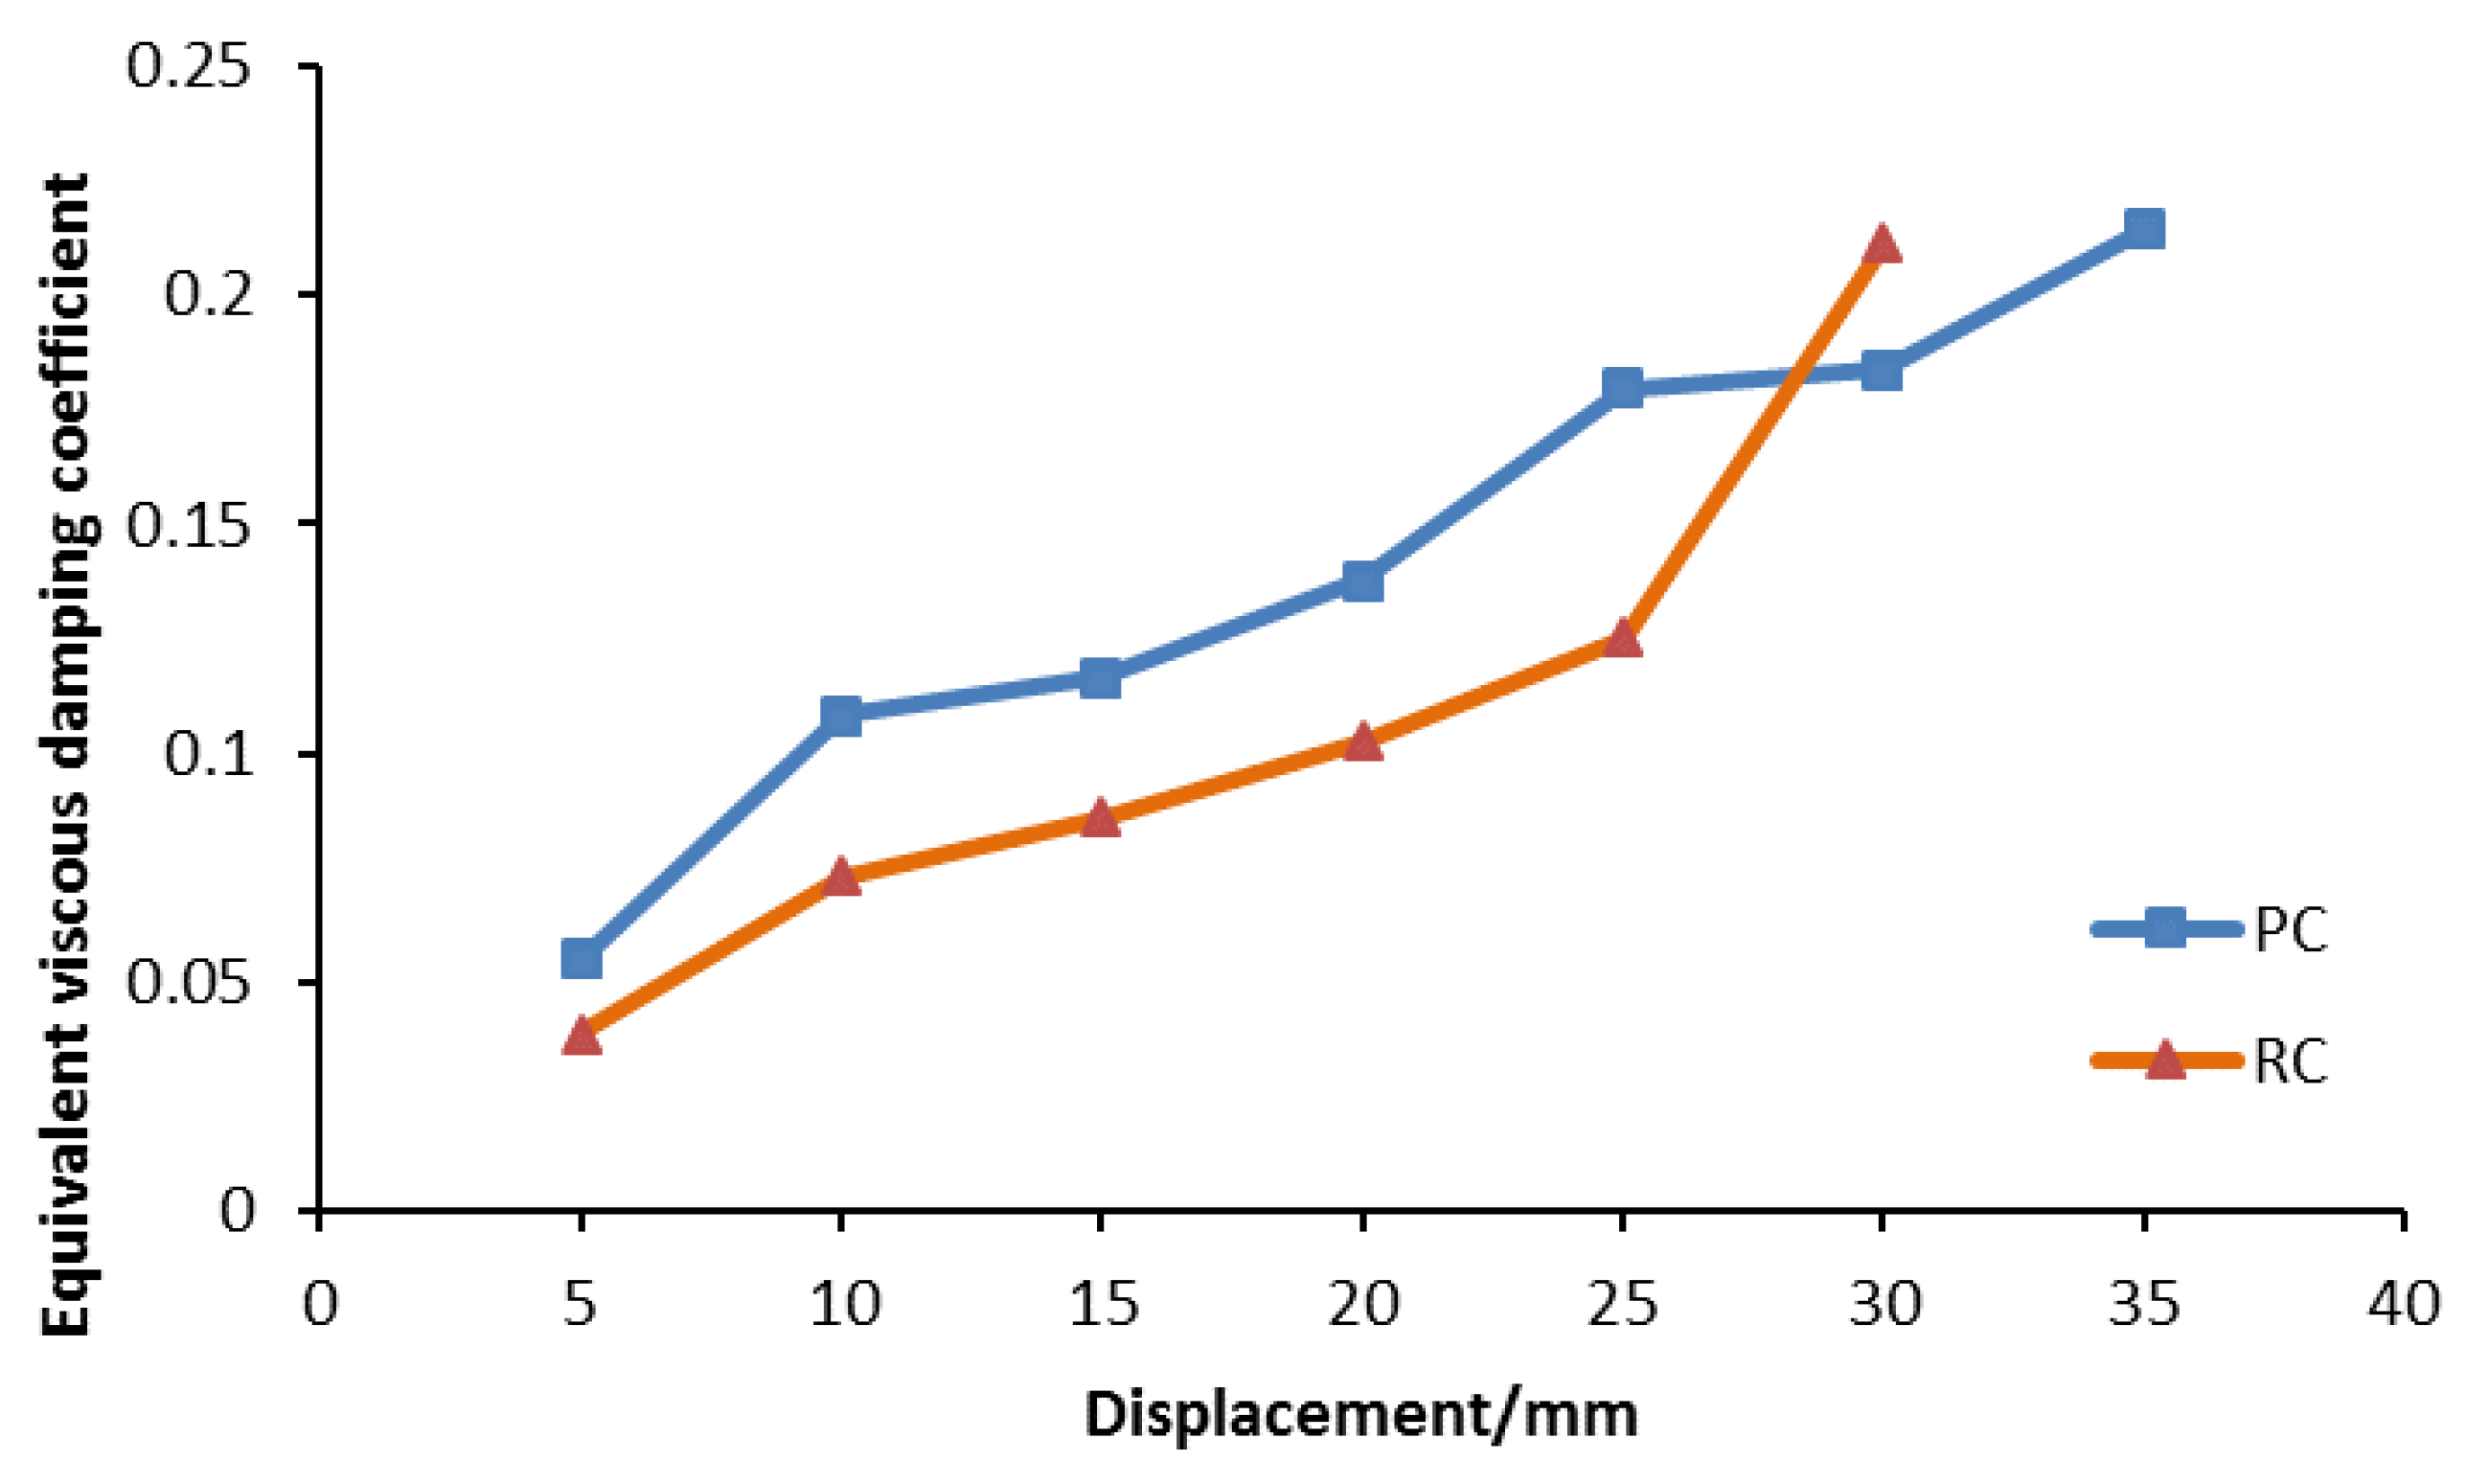
In order to study the influence of the connector on the PC specimen, the seismic performance of the PC specimen needs to be analyzed and compared with that of the RC specimen. Figure 10, Figure 11, Figure 12 and Figure 13 and Table 3 show the force-displacement curves, the secant stiffness curves calculated by Equation (2), the equivalent viscous damping coefficient curves calculated by Equation (3), and the displacement ductility coefficients calculated by Equation (4). We can see that: (1) the hysteresis loop of the PC specimen is more plump than that of the RC specimen (see Figure 10); (2) after the maximal load is reached, the load of the PC specimen drops more slowly than that of the RC specimen (see Figure 11); (3) the stiffness of the PC specimen is almost the same as that of the RC specimen (see Figure 12); and (4) the ductility coefficient (see Table 3) and the equivalent viscous damping coefficient (see Figure 13) of the PC specimen are larger than those of the RC specimen. Meanwhile, the ductility coefficient and the equivalent viscous damping coefficient of the PC specimen are greater than 4 and 0.1, respectively. These are measured by Guo [46], since the limits are not specified in the Code for Seismic Test of Buildings [45].
where K is the secant stiffness; F is the peak load for the first loading cycle; and Δ is the peak displacement for the first loading cycle.
where he is the equivalent viscous damping coefficient; SDAB + SBCD is the dissipated energy in a loading cycle on the hysteresis curve; and SOBE + SODF is the energy absorbed by a linear elastic body equivalent to the specimen, defined as the areas surrounded by the triangles OBE and ODF.
where μ is the ductility coefficient; Δμ is the ultimate displacement; and Δy is the yield displacement.
In summary, the seismic performance of the PC specimen is close to that of the RC specimen, which implies that the connector has little influence on the seismic performance of the PC specimen.
3. Numerical Simulation Analysis
3.1. Numerical Model
In order to conduct further parametric analysis, a numerical simulation model for the PC shear wall is developed using ABAQUS software.
Due to the fact that the solid element is easy to set up and understand, this paper uses a solid element instead of a shell element, despite the fact that a shell element has a better computational efficiency than a solid element [47]. Specifically, concrete, steel, and bolt are simulated using a three-dimensional (3D) stress solid element (C3D8R). In addition, rebars are simulated using a two-dimensional (2D) truss element (T3D2). In terms of a constitutive model, the concrete damage plasticity model provided by ABAQUS is used as a stress-strain model to define concrete. Furthermore, the tension and the compression stress-strain curves are determined according to the Code for Design of Concrete Structures [48]. Additionally, the damage parameters are calculated according to the formulas proposed by Song et al [49]. In addition, the bilinear kinematic hardening model is used as a stress-strain model to simulate steel, rebars, and bolt, which includes an elastic stage and a strengthening stage. Furthermore, the modulus magnitude of the strengthening stage is 1% of that of the elastic stage.
In the assembling zone, the contacts in the model are mainly between the upper and lower parts of a pair of connectors, and the connectors and bolts. In this paper, normal contact is defined as ‘‘hard’’ contact, while tangential contact is “penalty” contact, whose friction coefficient is 0.3. Embedded region constraint is used for rebars and concrete, whereas “tie” constraint is used between rebars and the connector, as well as concrete and the connector.
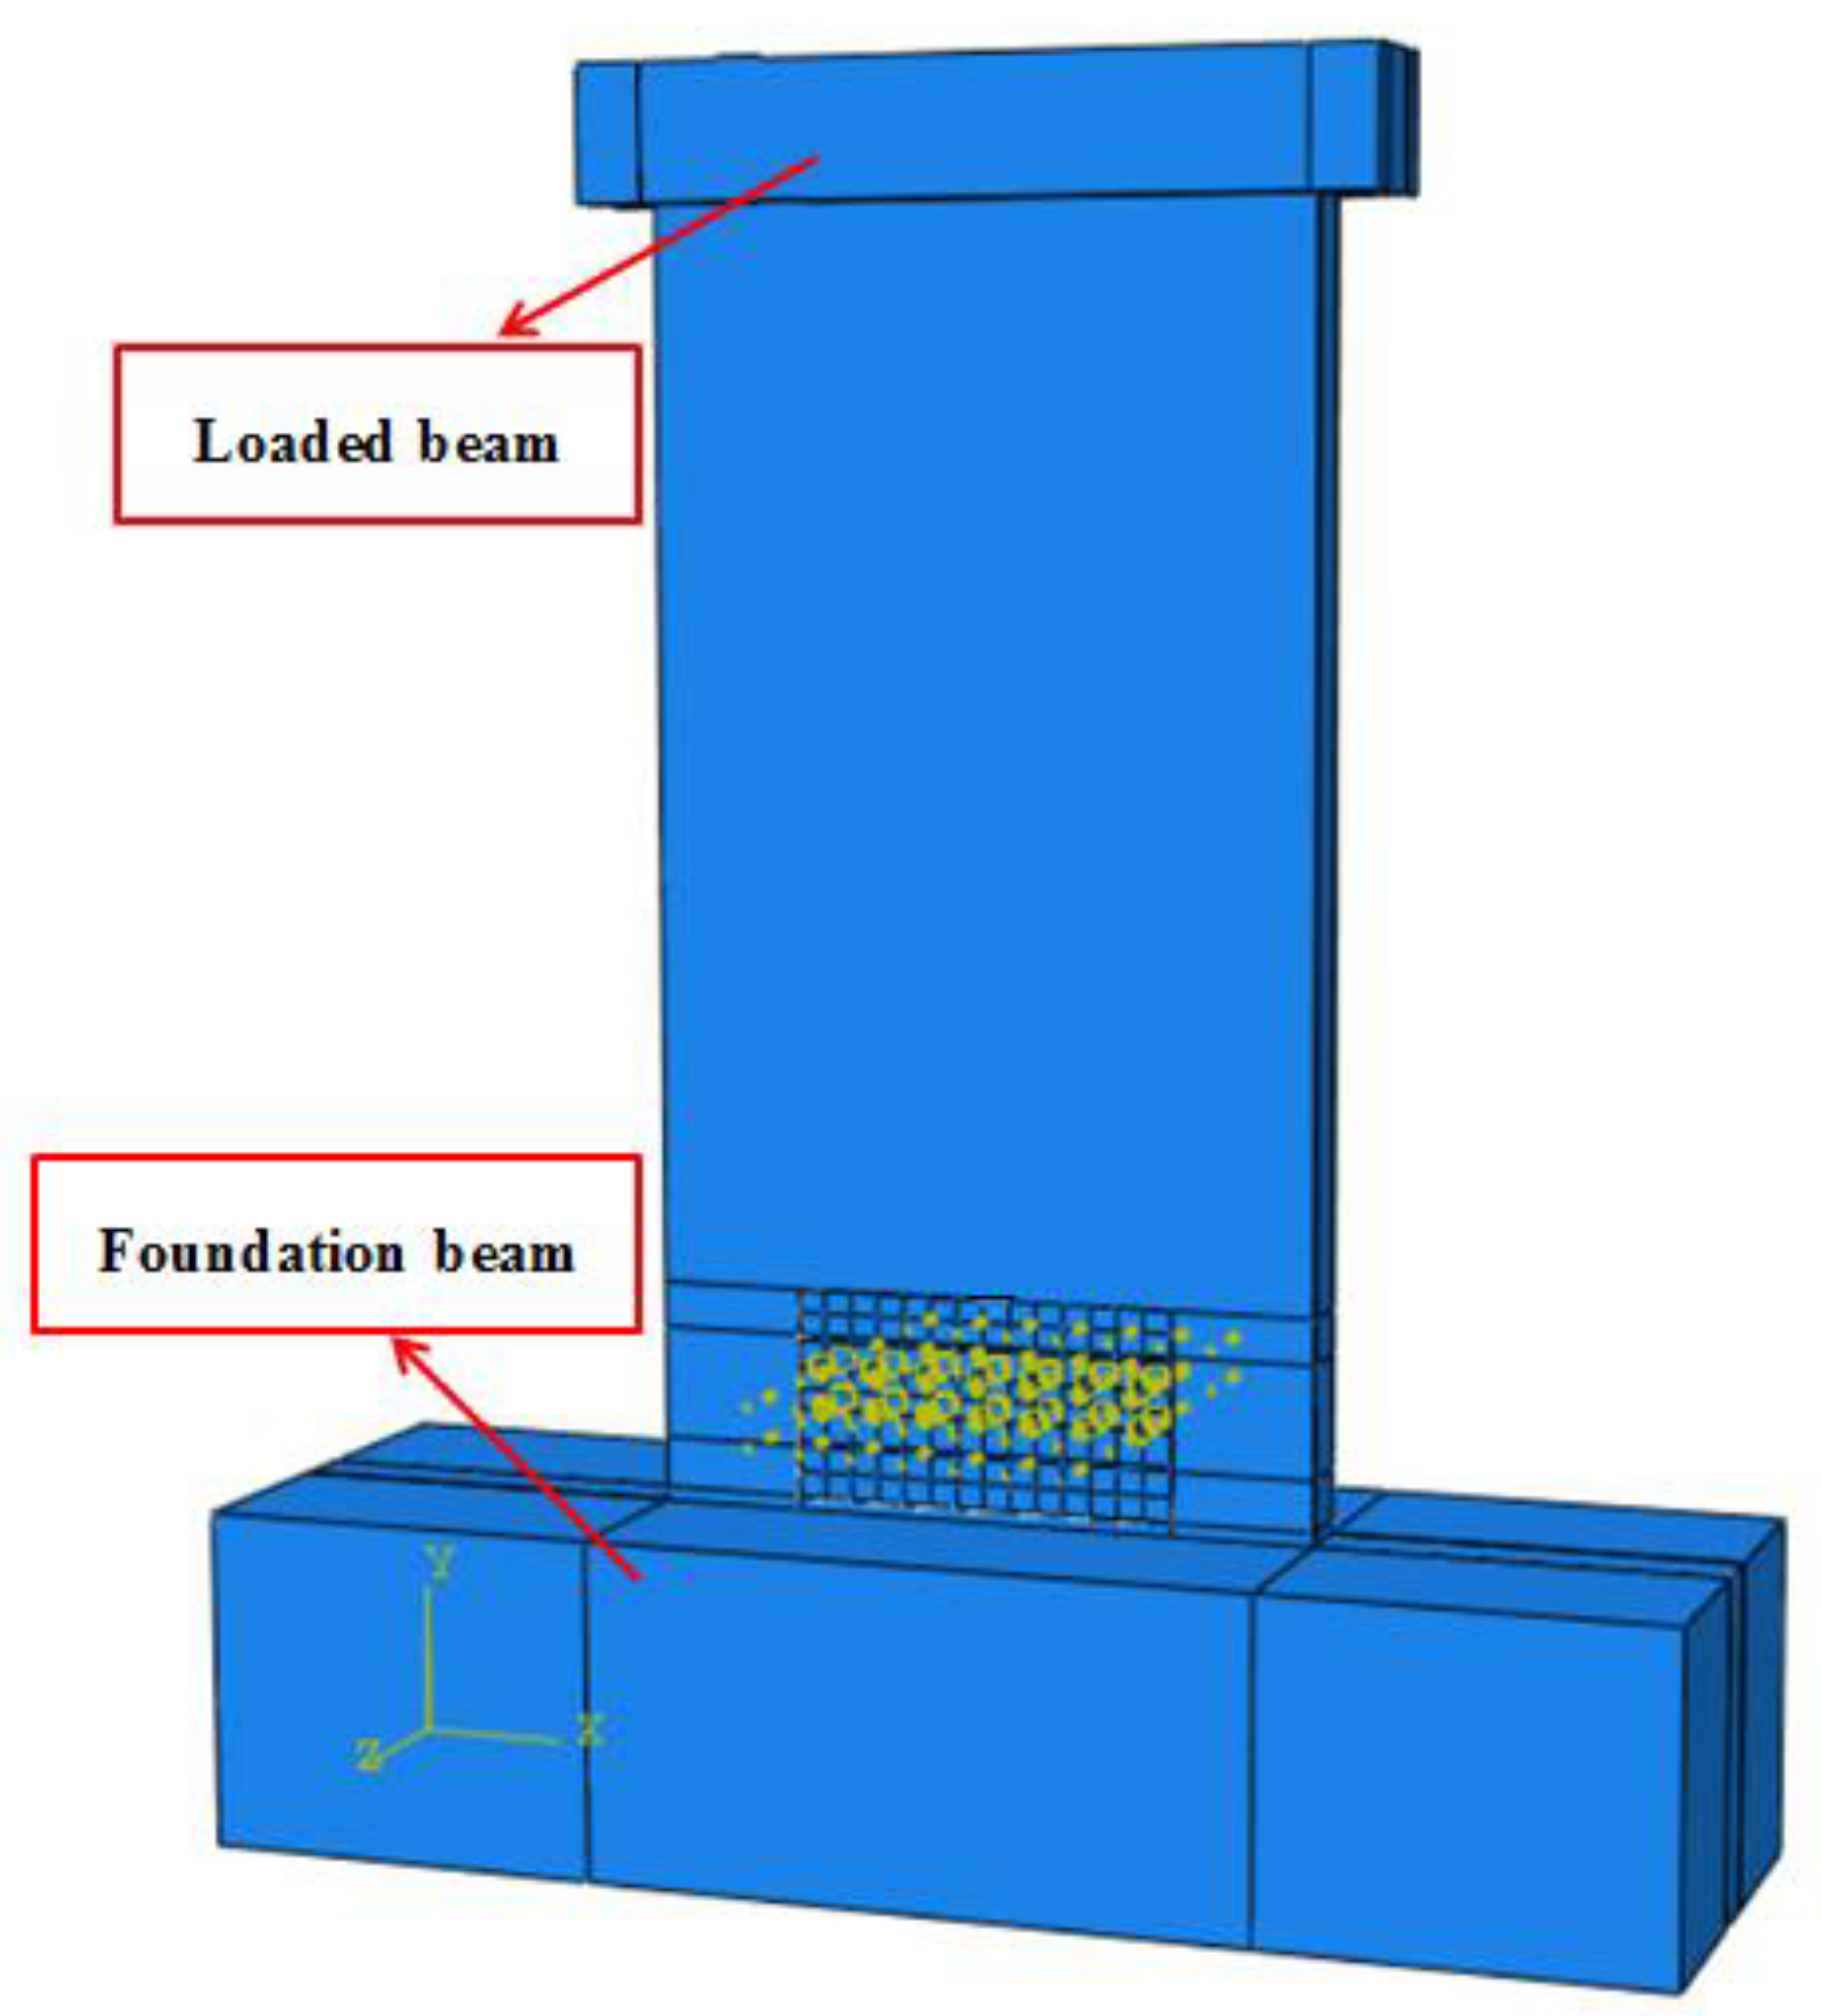
To simulate loading, a fixed constraint is used for the bottom of the foundation beam (see Figure 14). The axial load is applied as a uniform load on the top of the loaded beam (Figure 14). The cyclic horizontal load is applied to the side of the loaded beam according to the loading procedure. Three steps are required to set the bolt load [50,51]. In the first step, the temporary boundary conditions of bolts are defined, and “Apply Force” of 10 N is applied to bolts. In the second step, temporary boundary conditions are removed and “Apply Force” is modified to 30 kN. In the third step, the bolt loads are defined as “Fix at Current Length”.
3.2. Model Validation
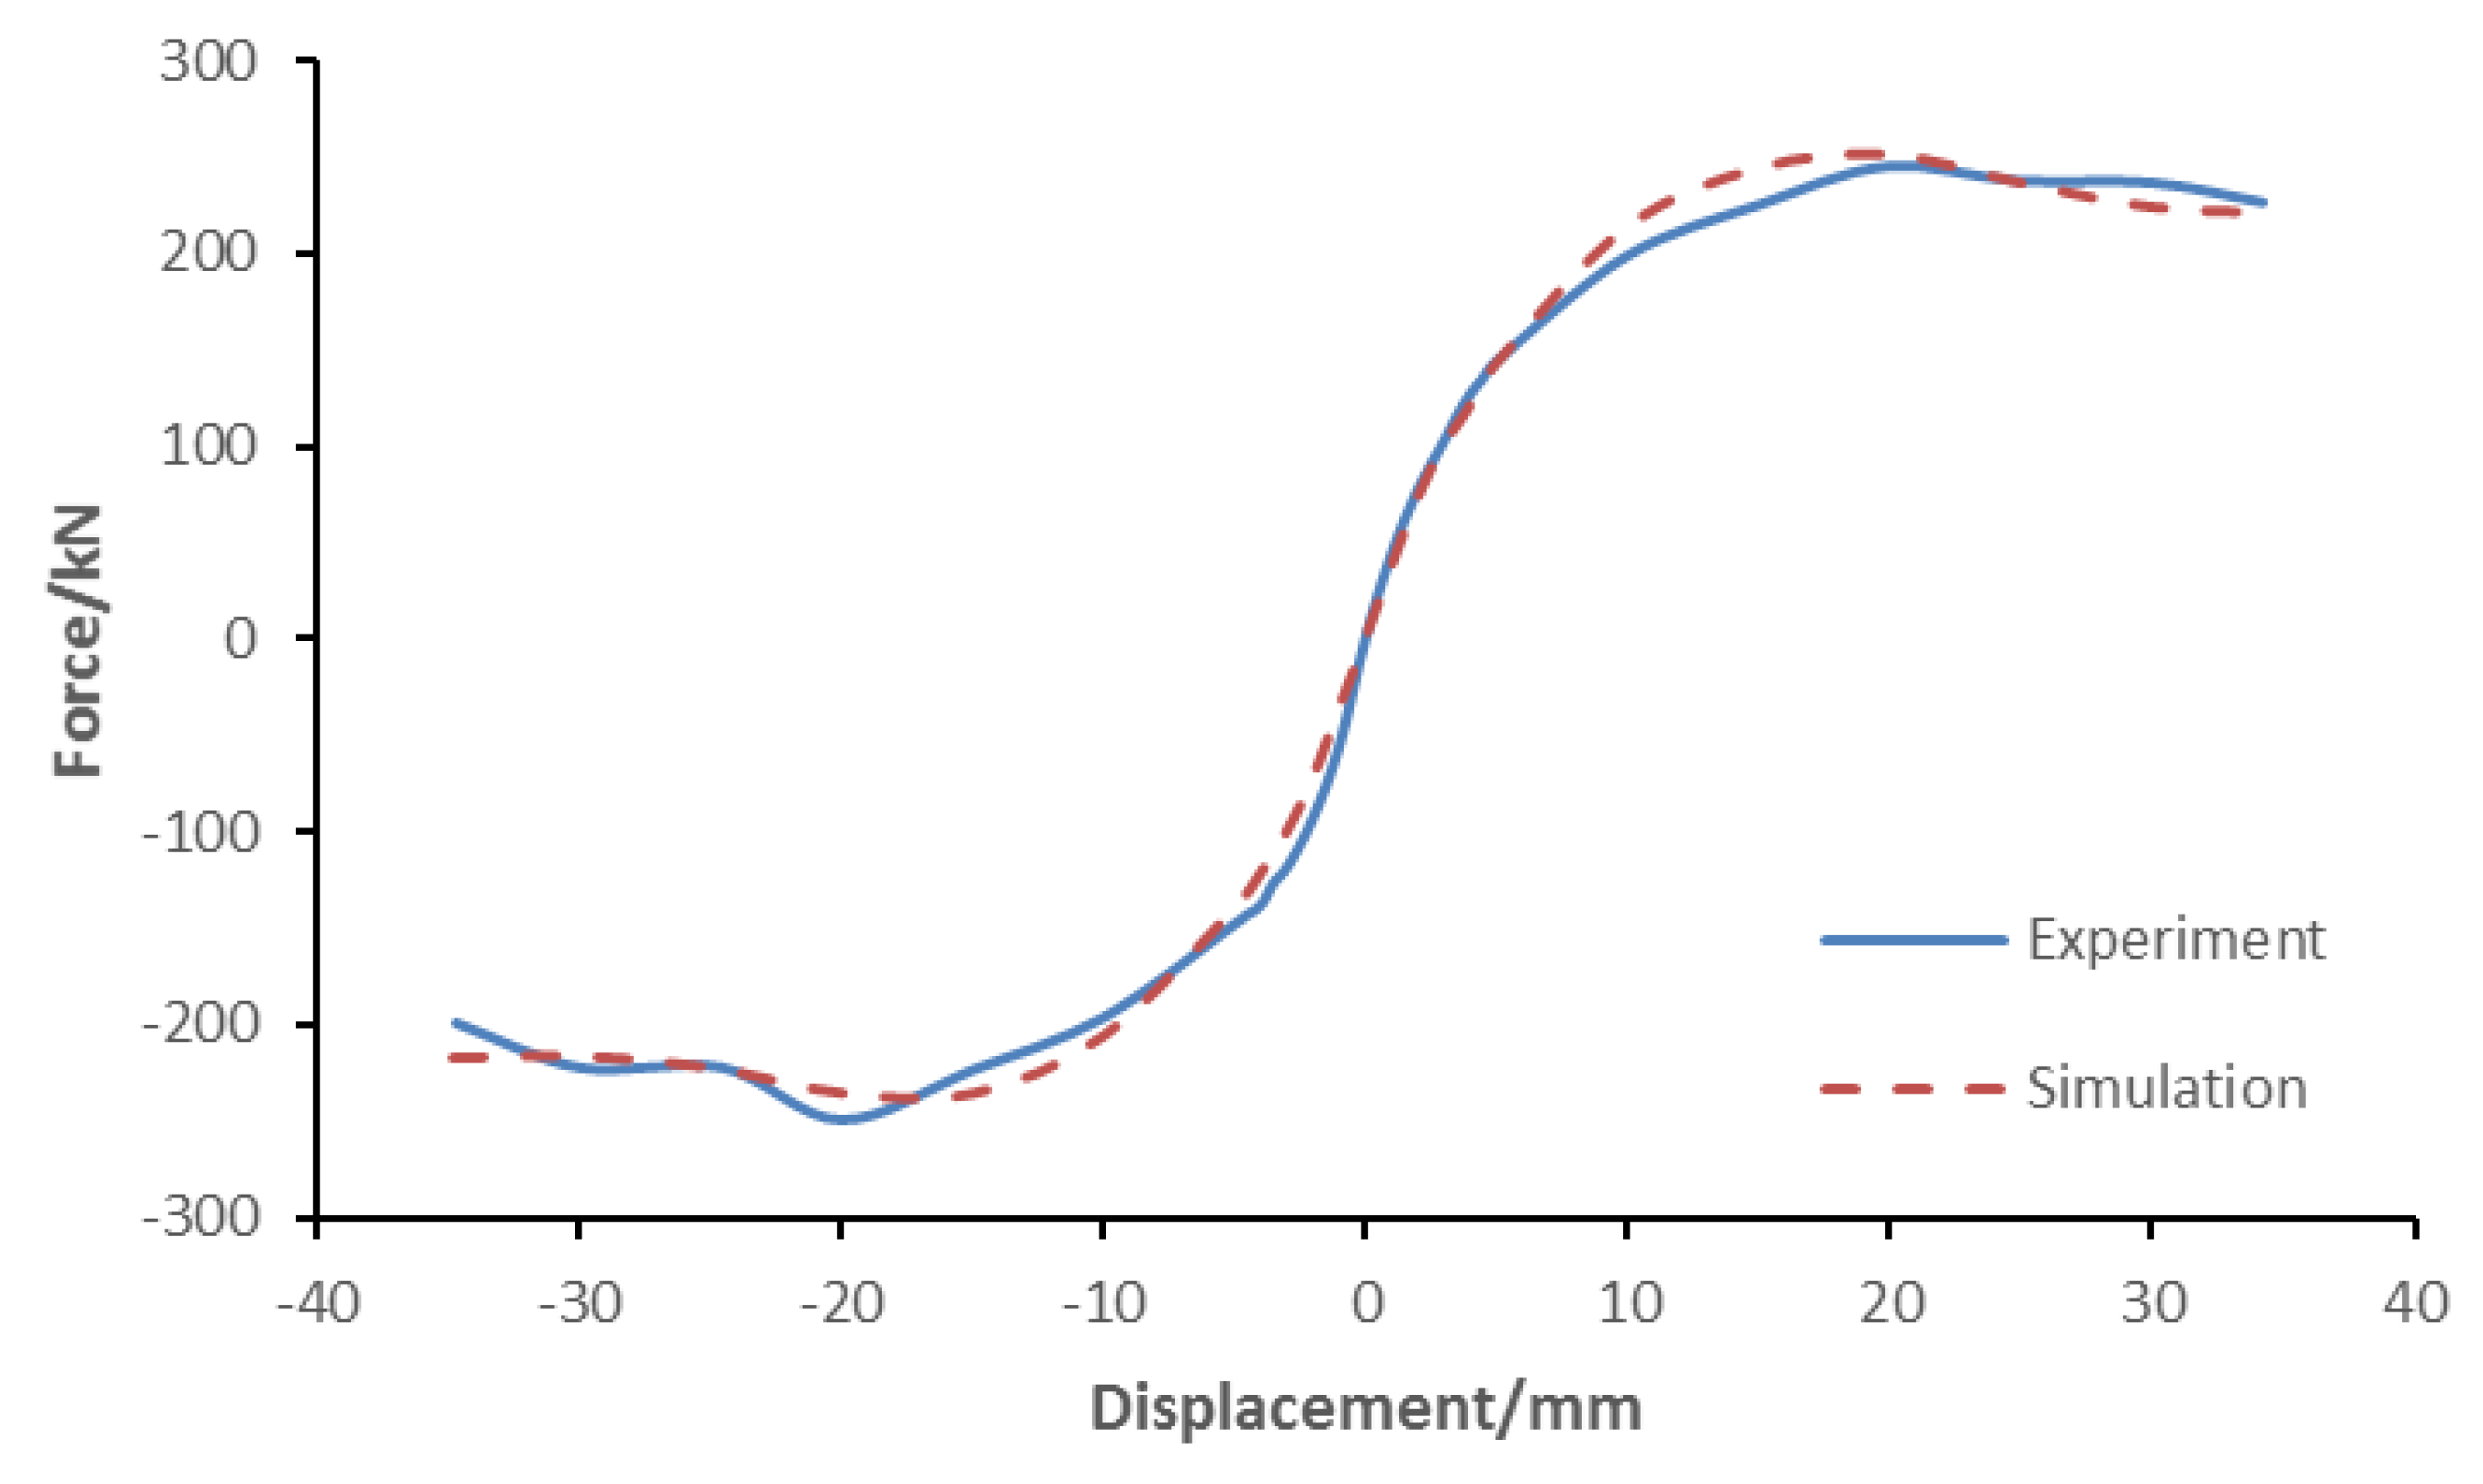
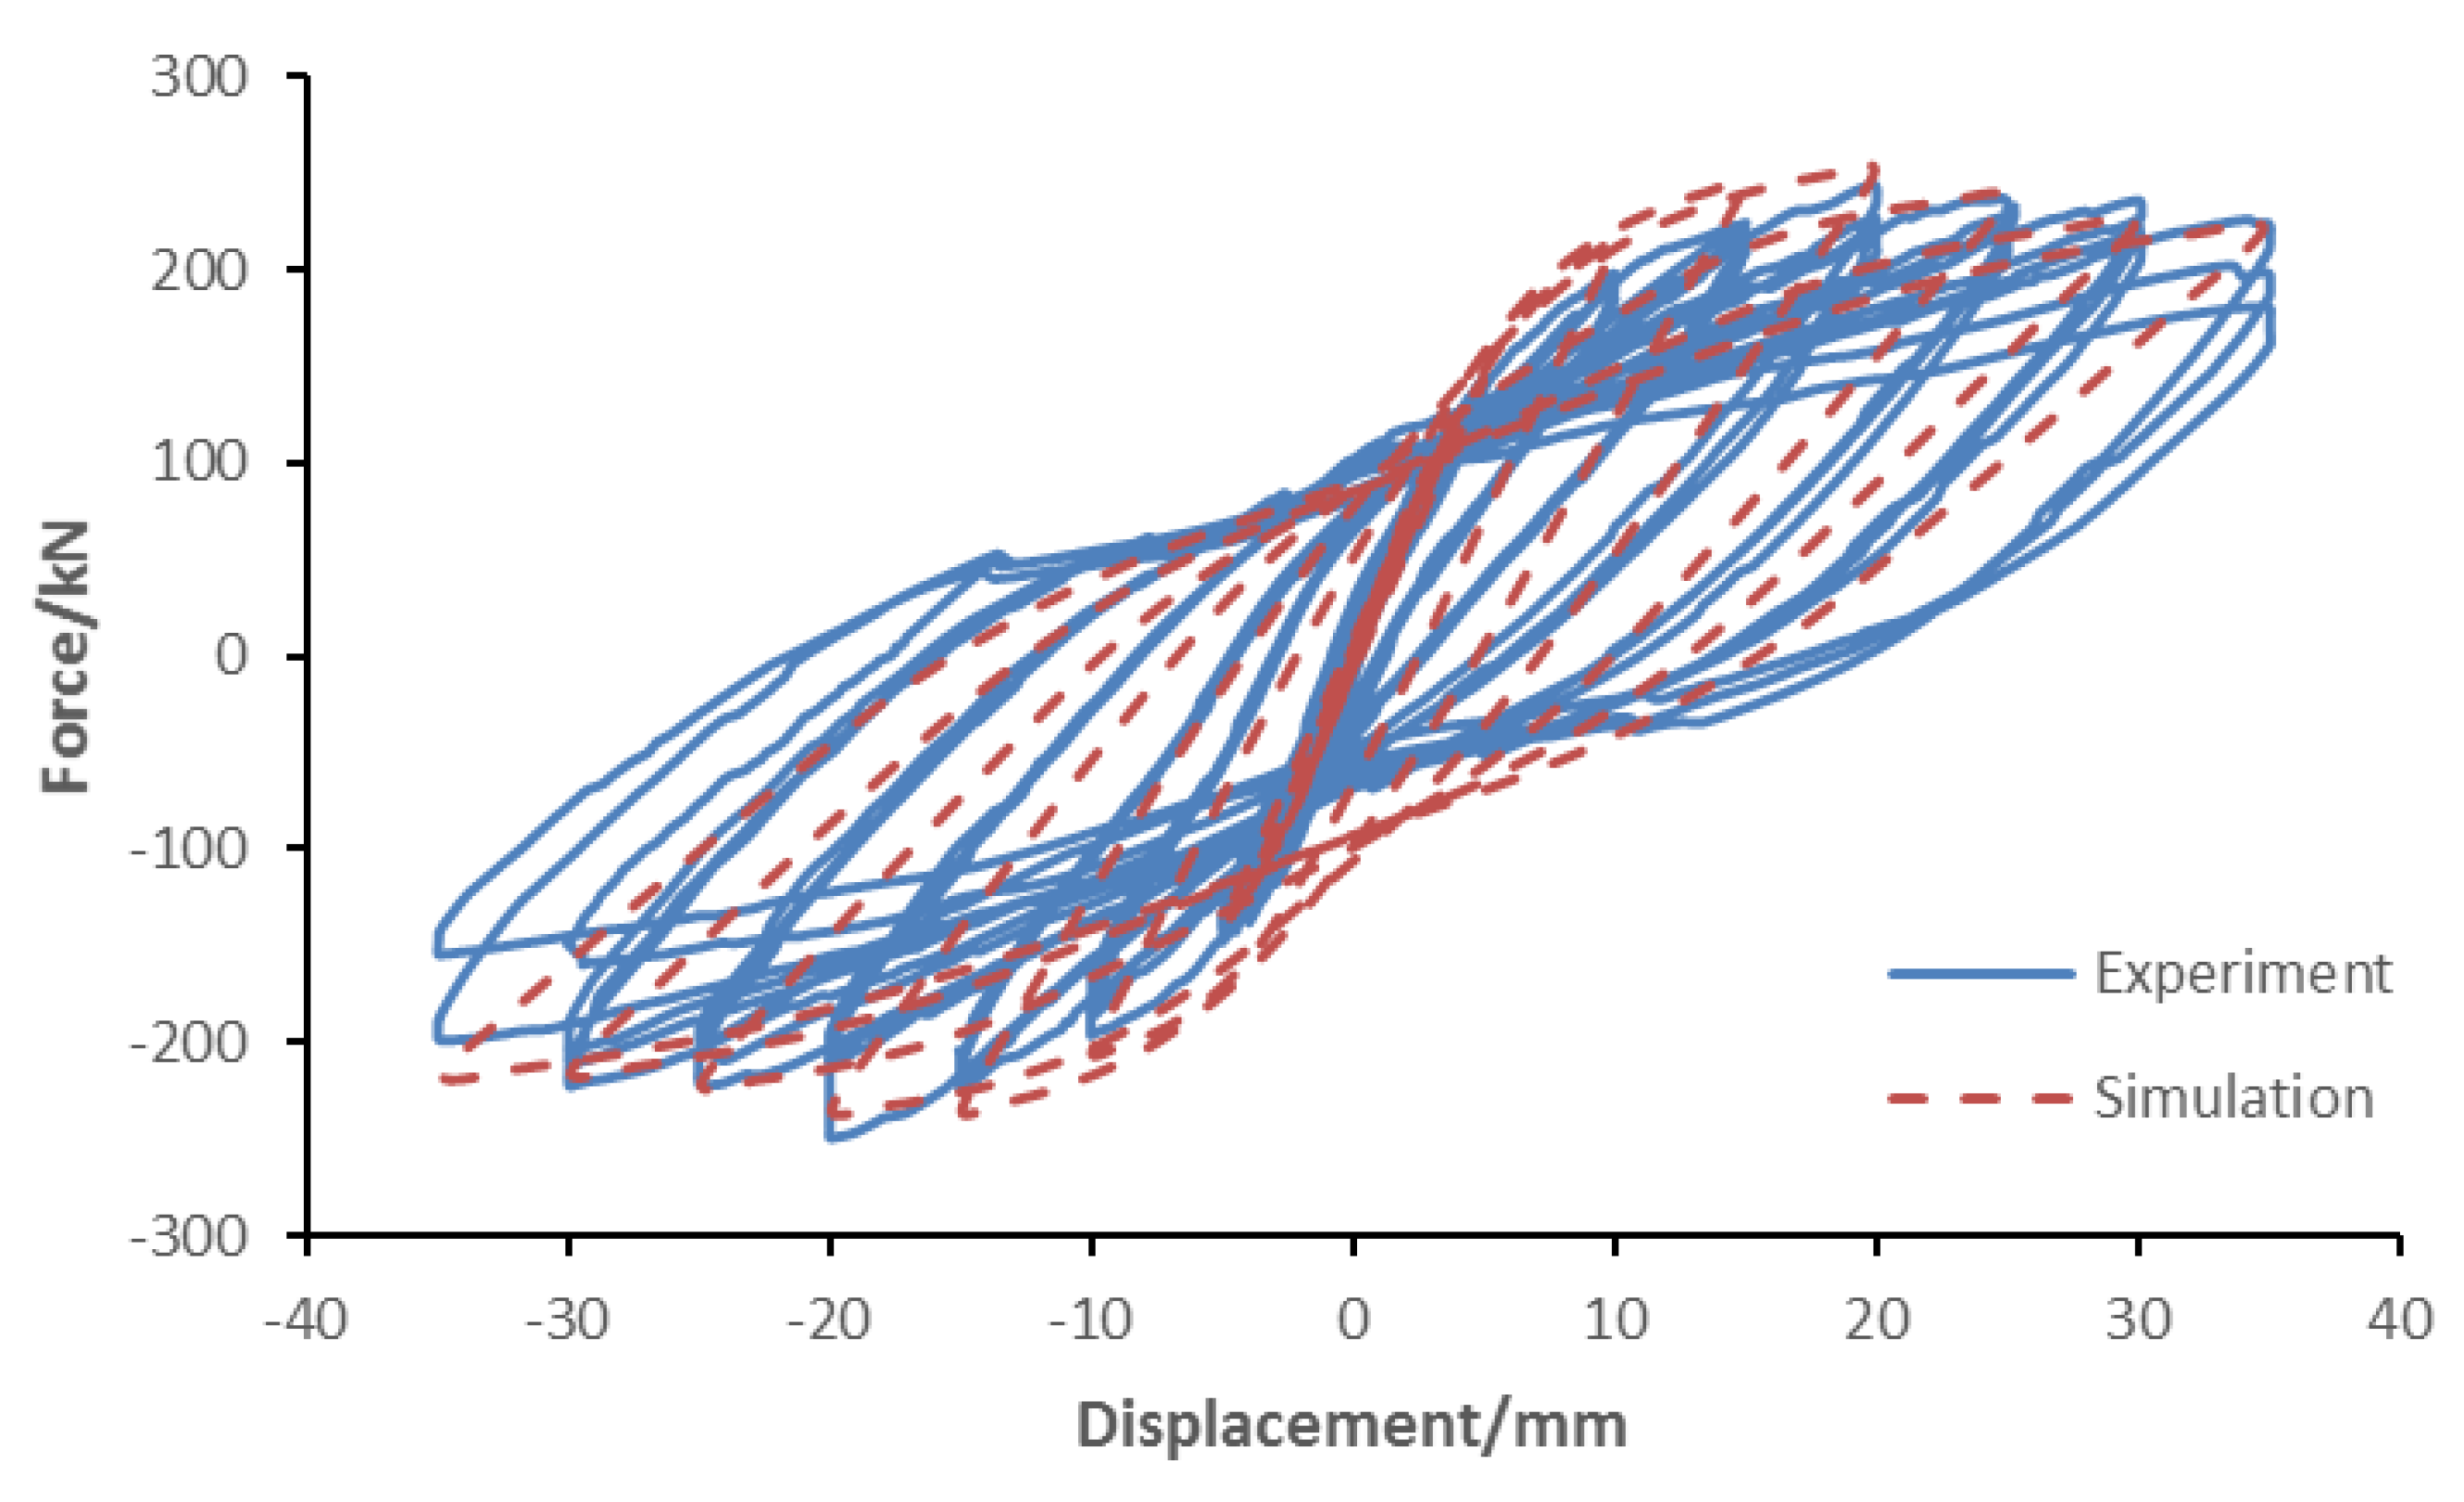
Based on the above modeling approach, a numerical model is established to simulate the PC specimen (see Figure 14). Hysteretic curves and skeleton curves of both the simulation and the experiment are shown in Figure 15 and Figure 16, respectively, for comparison.
It is shown in Figure 15 and Figure 16 that the simulation and experimental results share similar curves. Specifically, the peak load of the experiment is 244.6 kN and the corresponding displacement is 19.2 mm, whereas the peak load of the simulation is 251.9 kN and the corresponding displacement is 19.9 mm. In other words, the peak load and the corresponding displacement of the simulation are slightly higher than those of the experiment, and the values for the simulation and experiment are 2.9% and 3.6% at the highest, respectively. The error meets the requirements of practical engineering. Therefore, the numerical model developed for the PC shear wall can be used for parameter analysis.
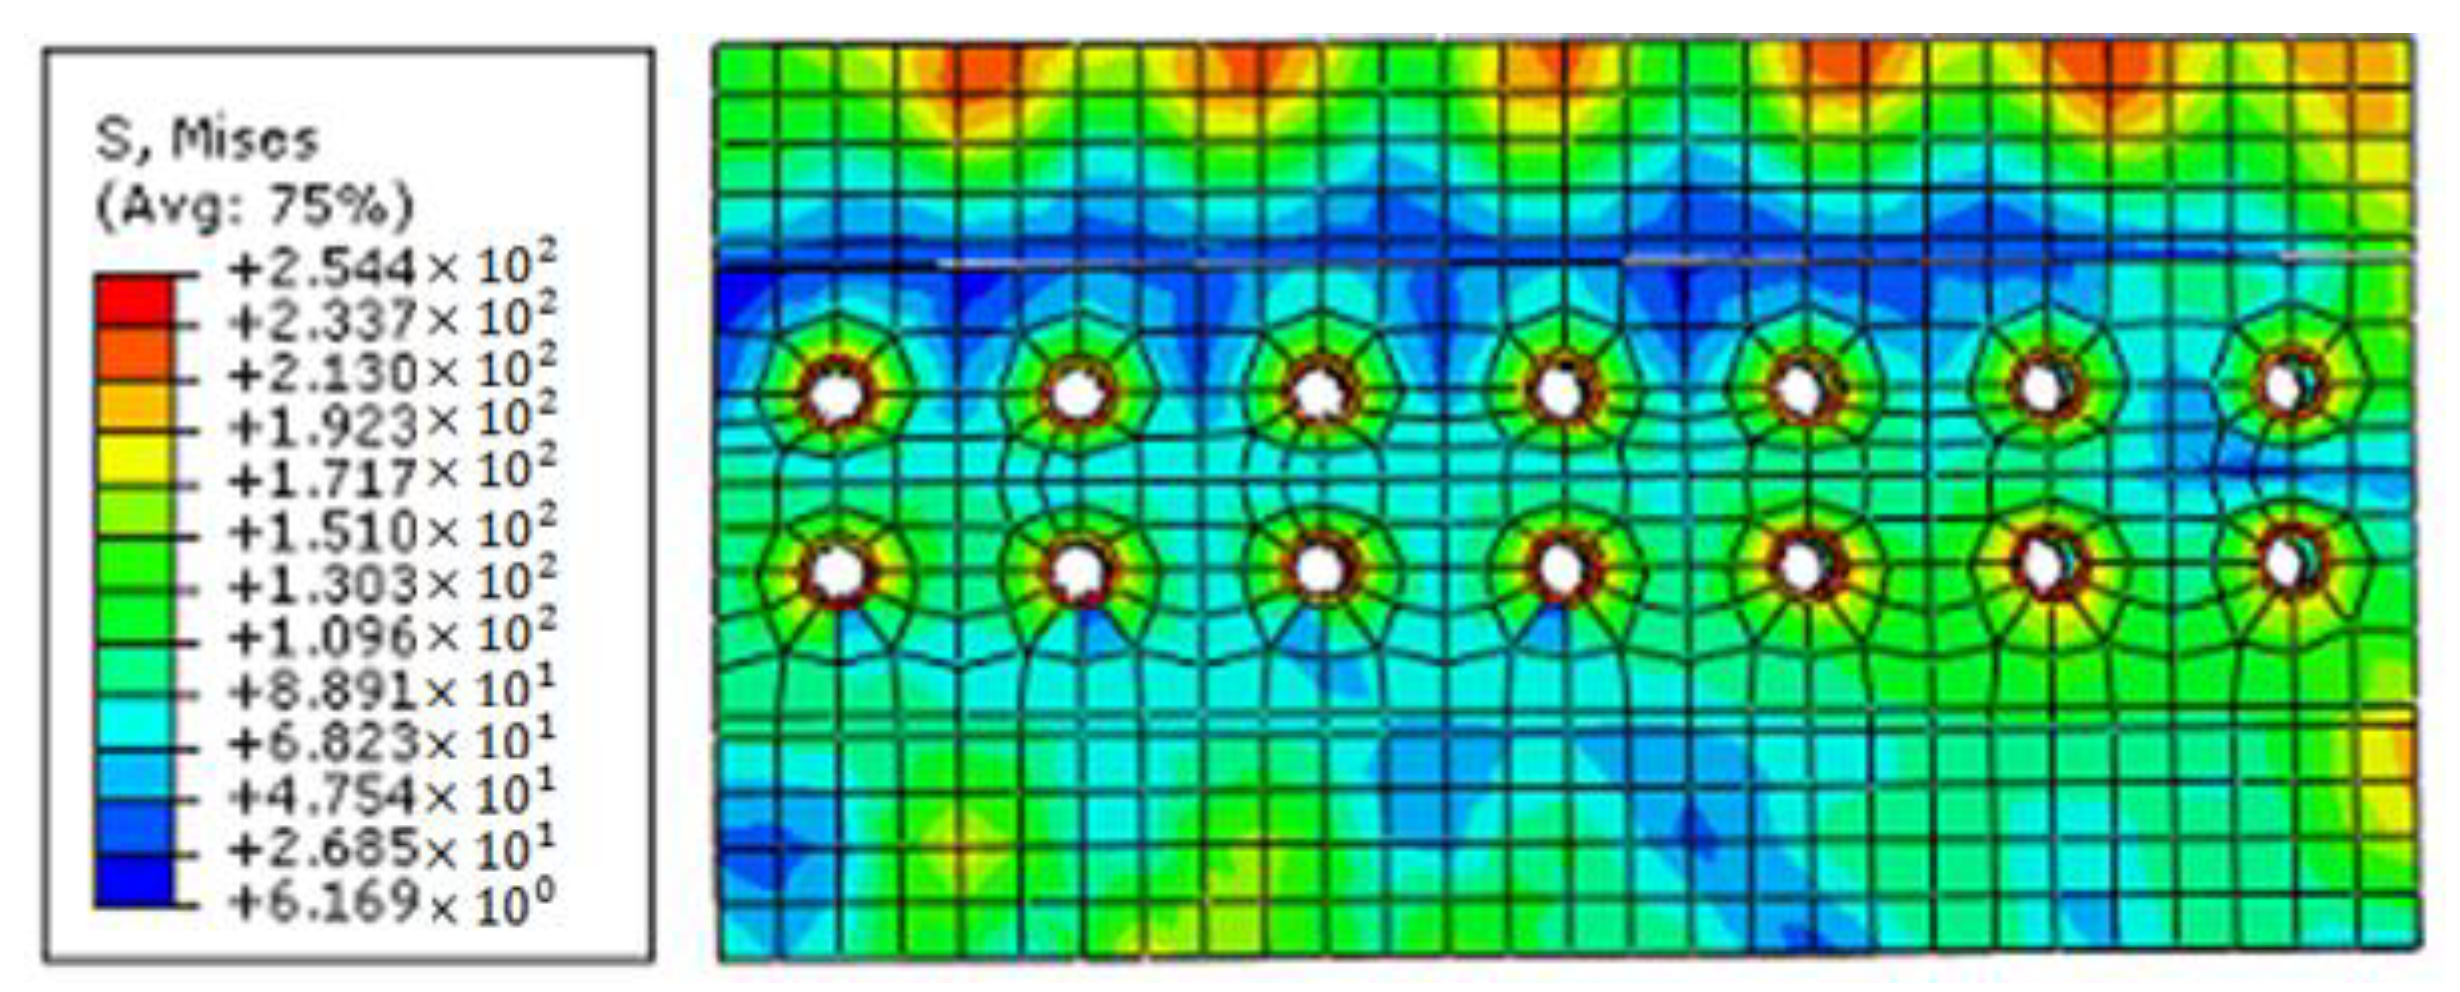
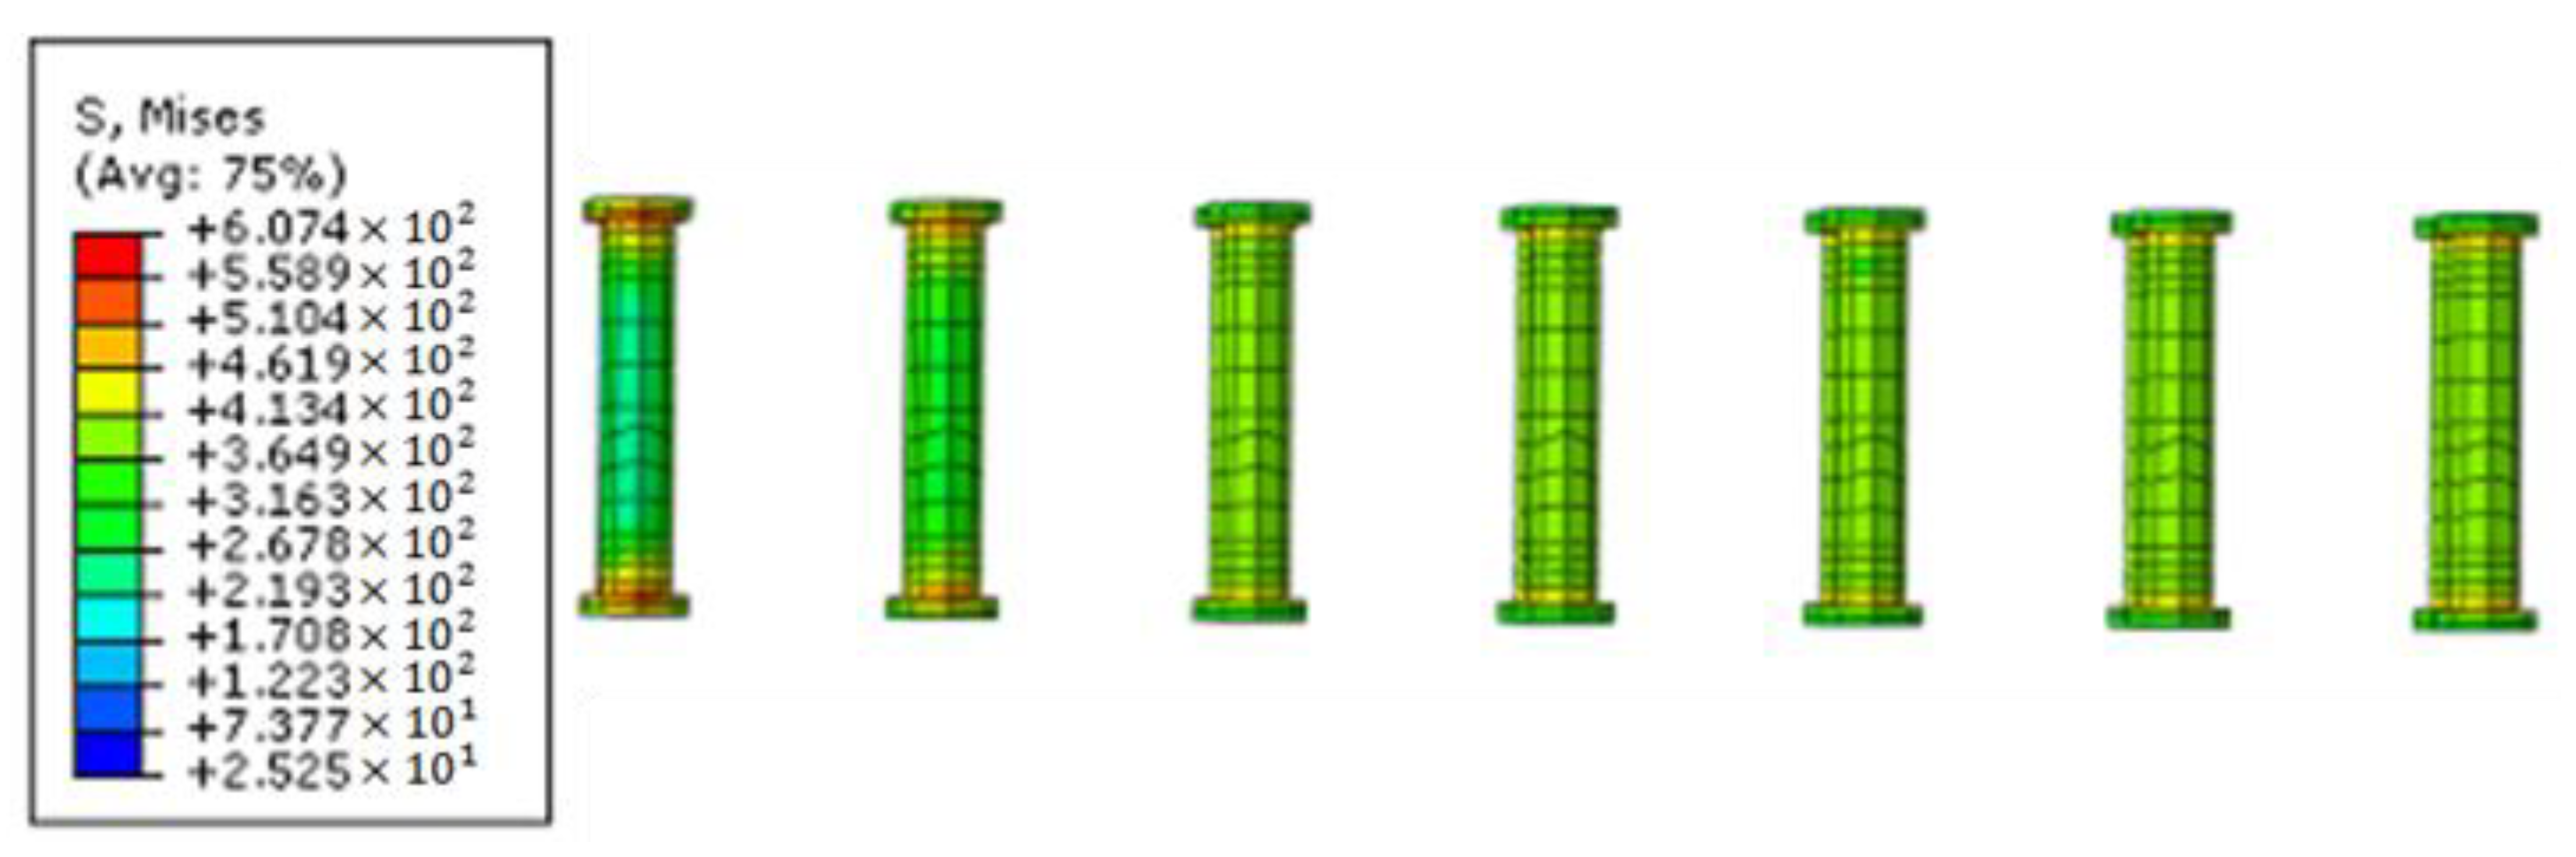
Figure 17 and Figure 18 show the stress cloud diagrams of the connector and the bolts. It is noted that the welding area of the connector and rebars and the bolt holes yielded, when it reaches the maximum stress of 254 MPa (the yield stress is 235 MPa). However, the other areas of the connector are in the elastic stage. As for bolts, the maximum stress is 607 MPa, which appears in the outermost bolts. Since the yield stress of bolts is 640 MPa, all the bolts are in the elastic stage. The result is consistent with the test result described in Section 2.3.2.
3.3. Parametric Analyses
Since experiments were only conducted on a limited number of specimens on account of the cost and test conditions, parametric analyses were carried out using a validated numerical model instead to further study the connector and improve the existing designs.
3.3.1. Pretightening Force
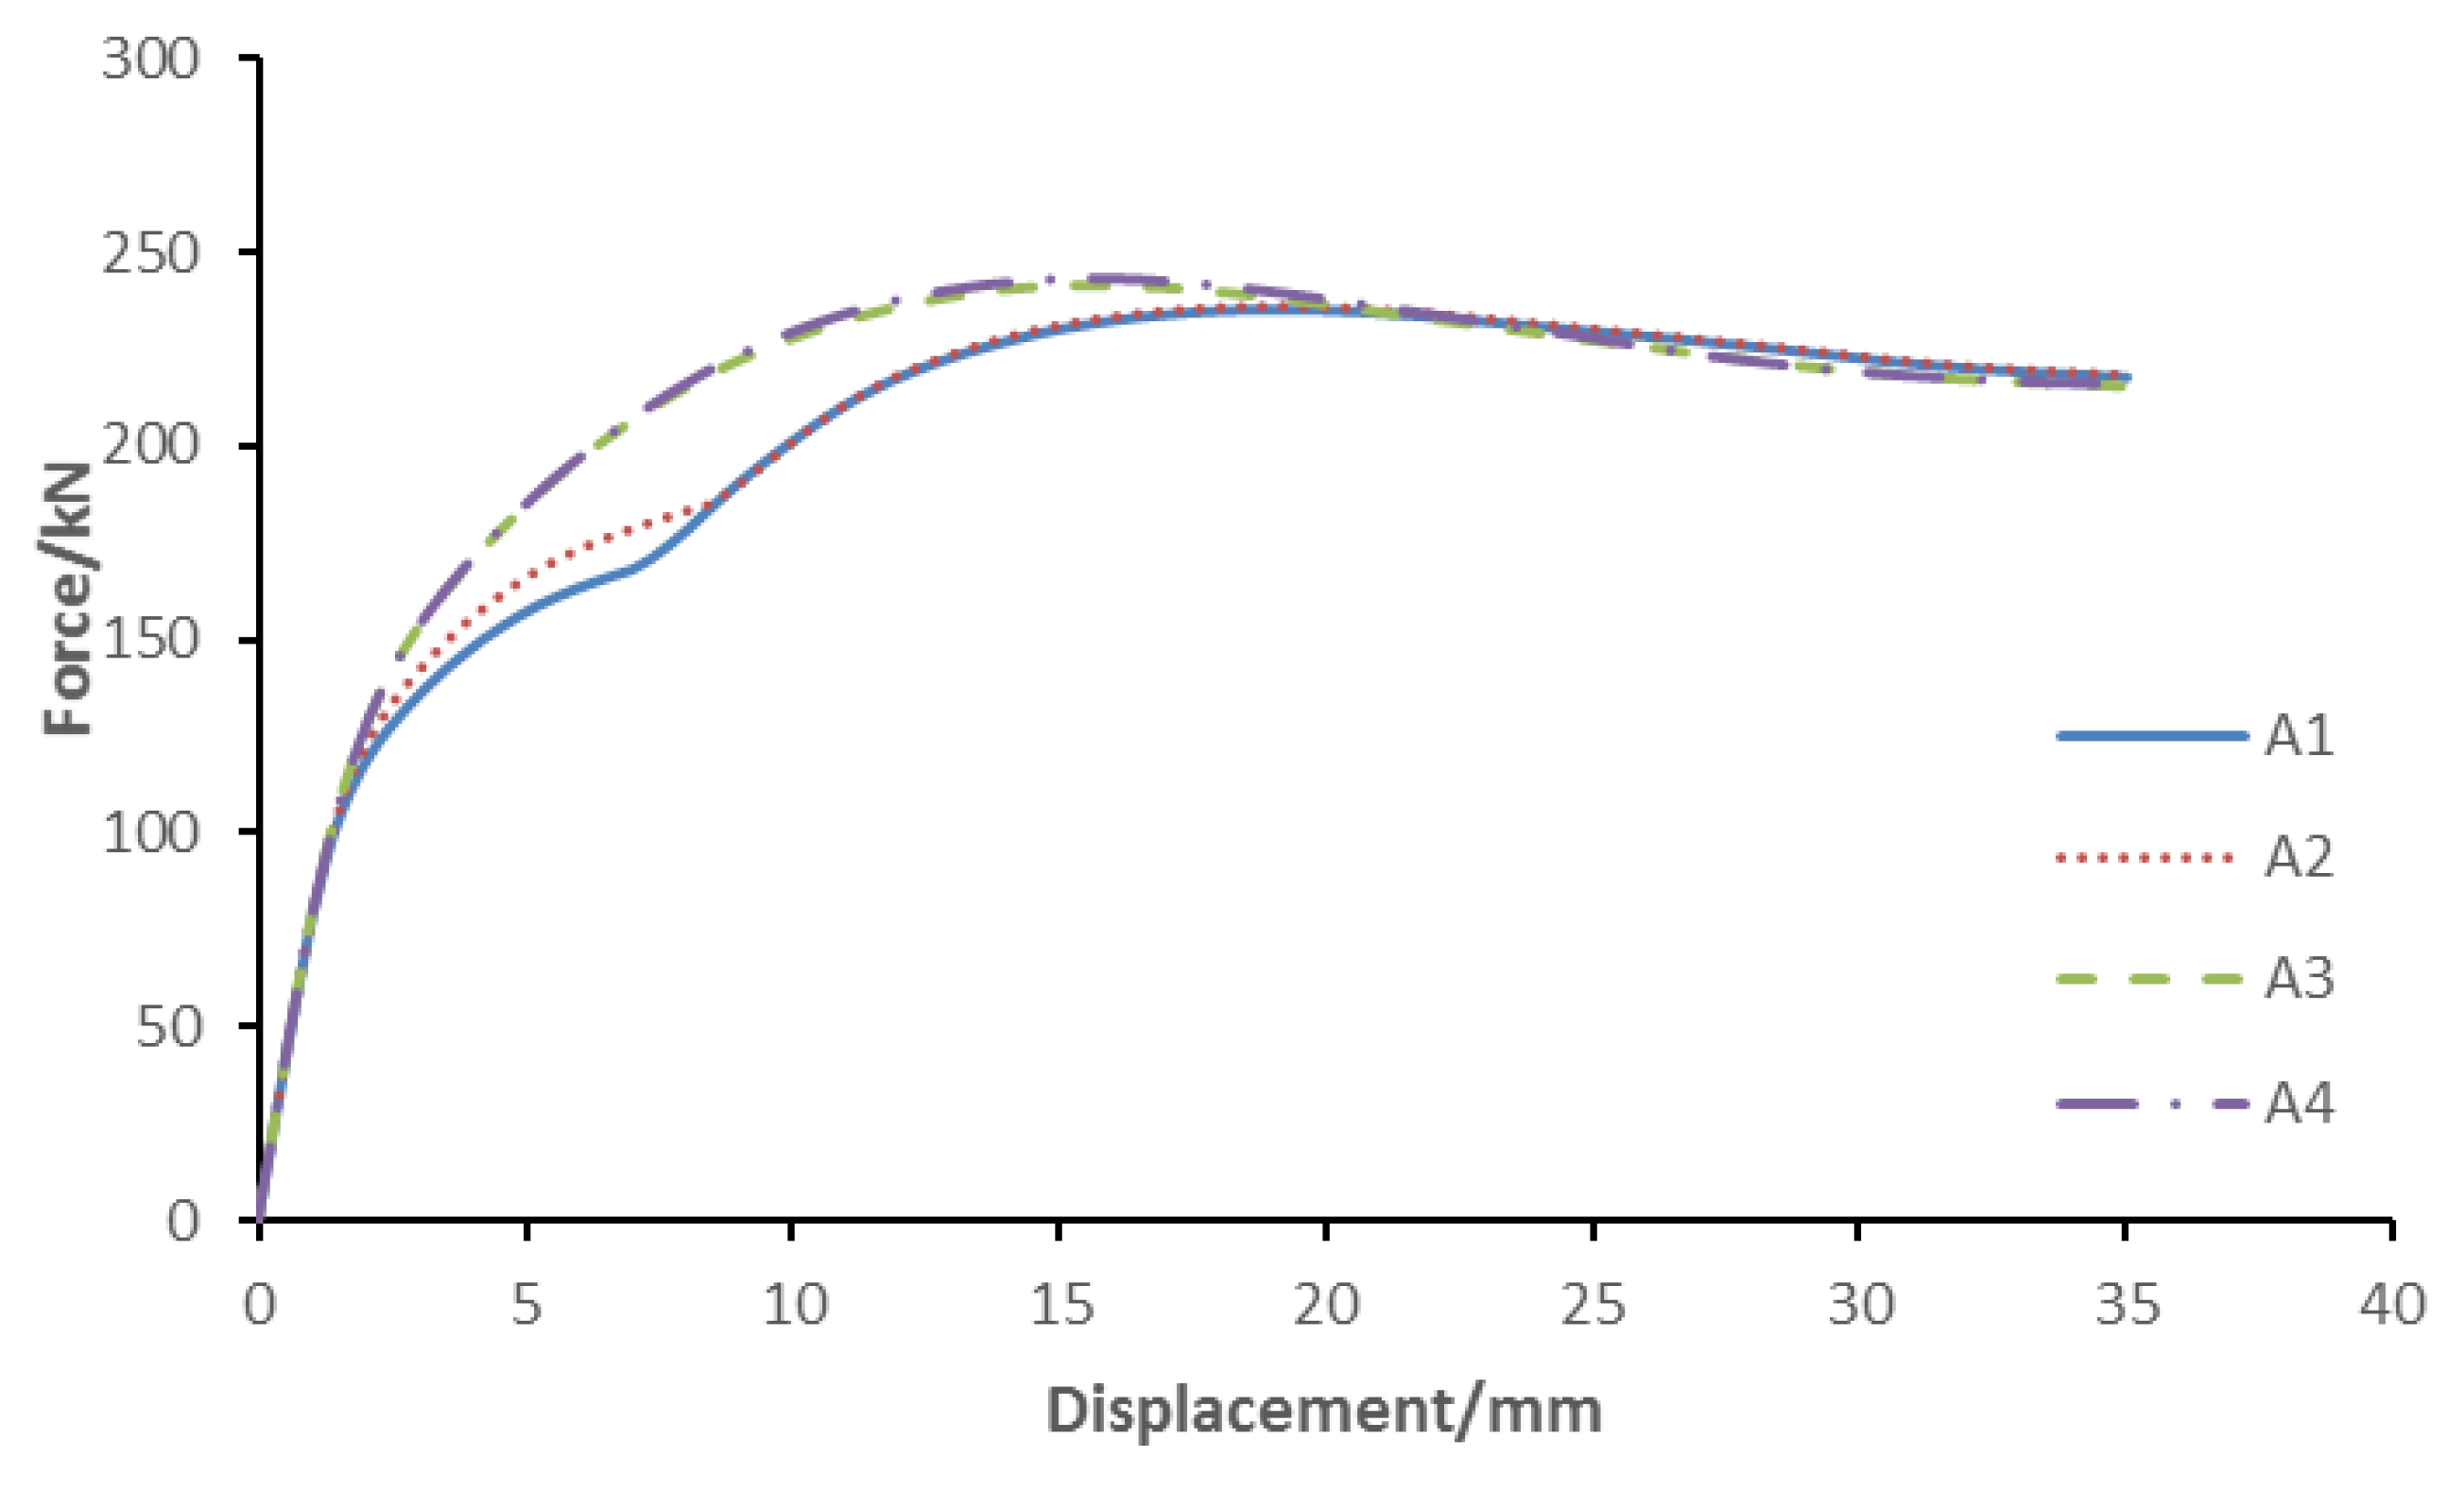
Different pretightening forces cause different friction forces for the connector, which may in turn affect the slip of the connector. Therefore, the models with different pretightening forces are analyzed in this section. The change of pretightening force is achieved by modifying the "Apply Force" (see Table 4). Through numerical analyses, the force-displacement curves and slip-displacement curves are shown in Figure 19 and Figure 20. In Figure 19, the initial slip of A1–A4 occurs at the horizontal displacement of 1.03 mm, 1.38 mm, 1.73 mm, and 2.00 mm, respectively. In addition, the slip magnitudes of A1–A4 are 2.00 mm, 2.00 mm, 0.97 mm, and 0.16 mm, respectively. It is worth noting that the initial slip will be delayed, and the slip magnitude will decrease, with an increase of the pretightening force. In Figure 20, the stiffnesses of A1–A4 decrease by 70.0%, 66.1%, 57.9%, and 55.2% from the start of slip to the end of slip, respectively. It implies that the stiffness degradation occurs during the slip and the stiffness decreases with the increase of the pretightening force.
In summary, it is necessary to increase the pretightening force, and high strength bolts can be used for this purpose.
3.3.2. Number of Bolts
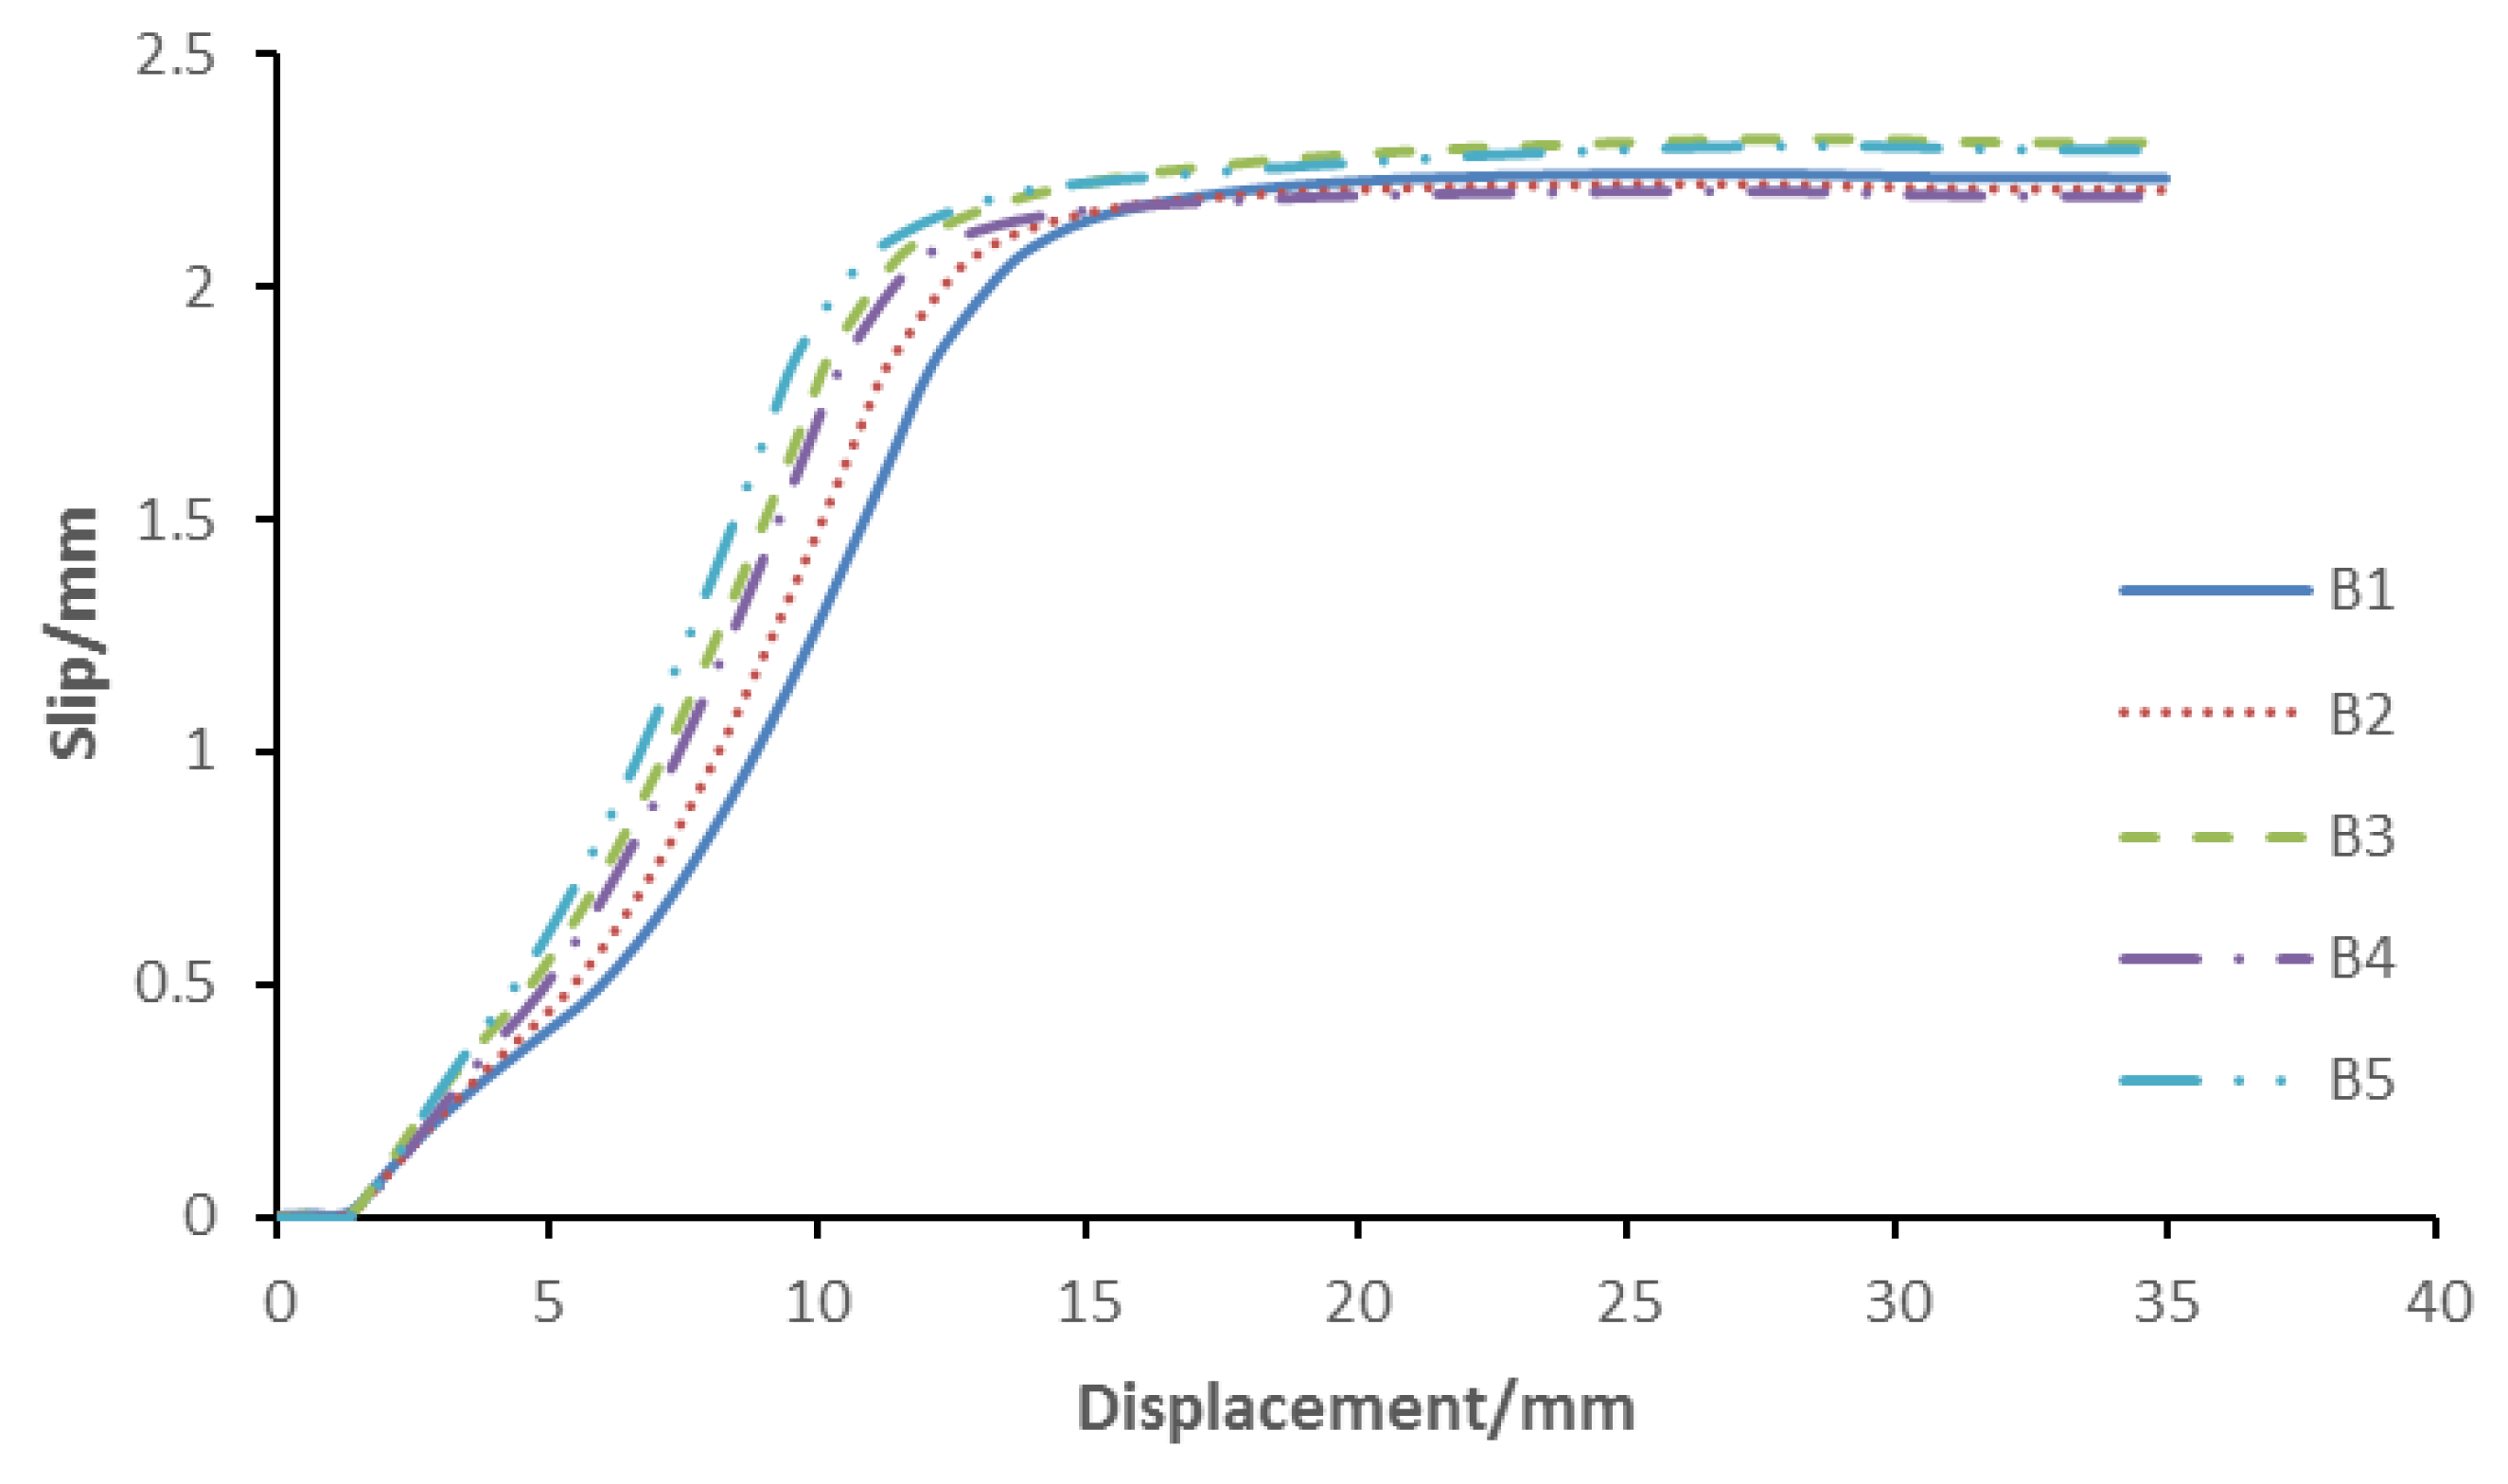
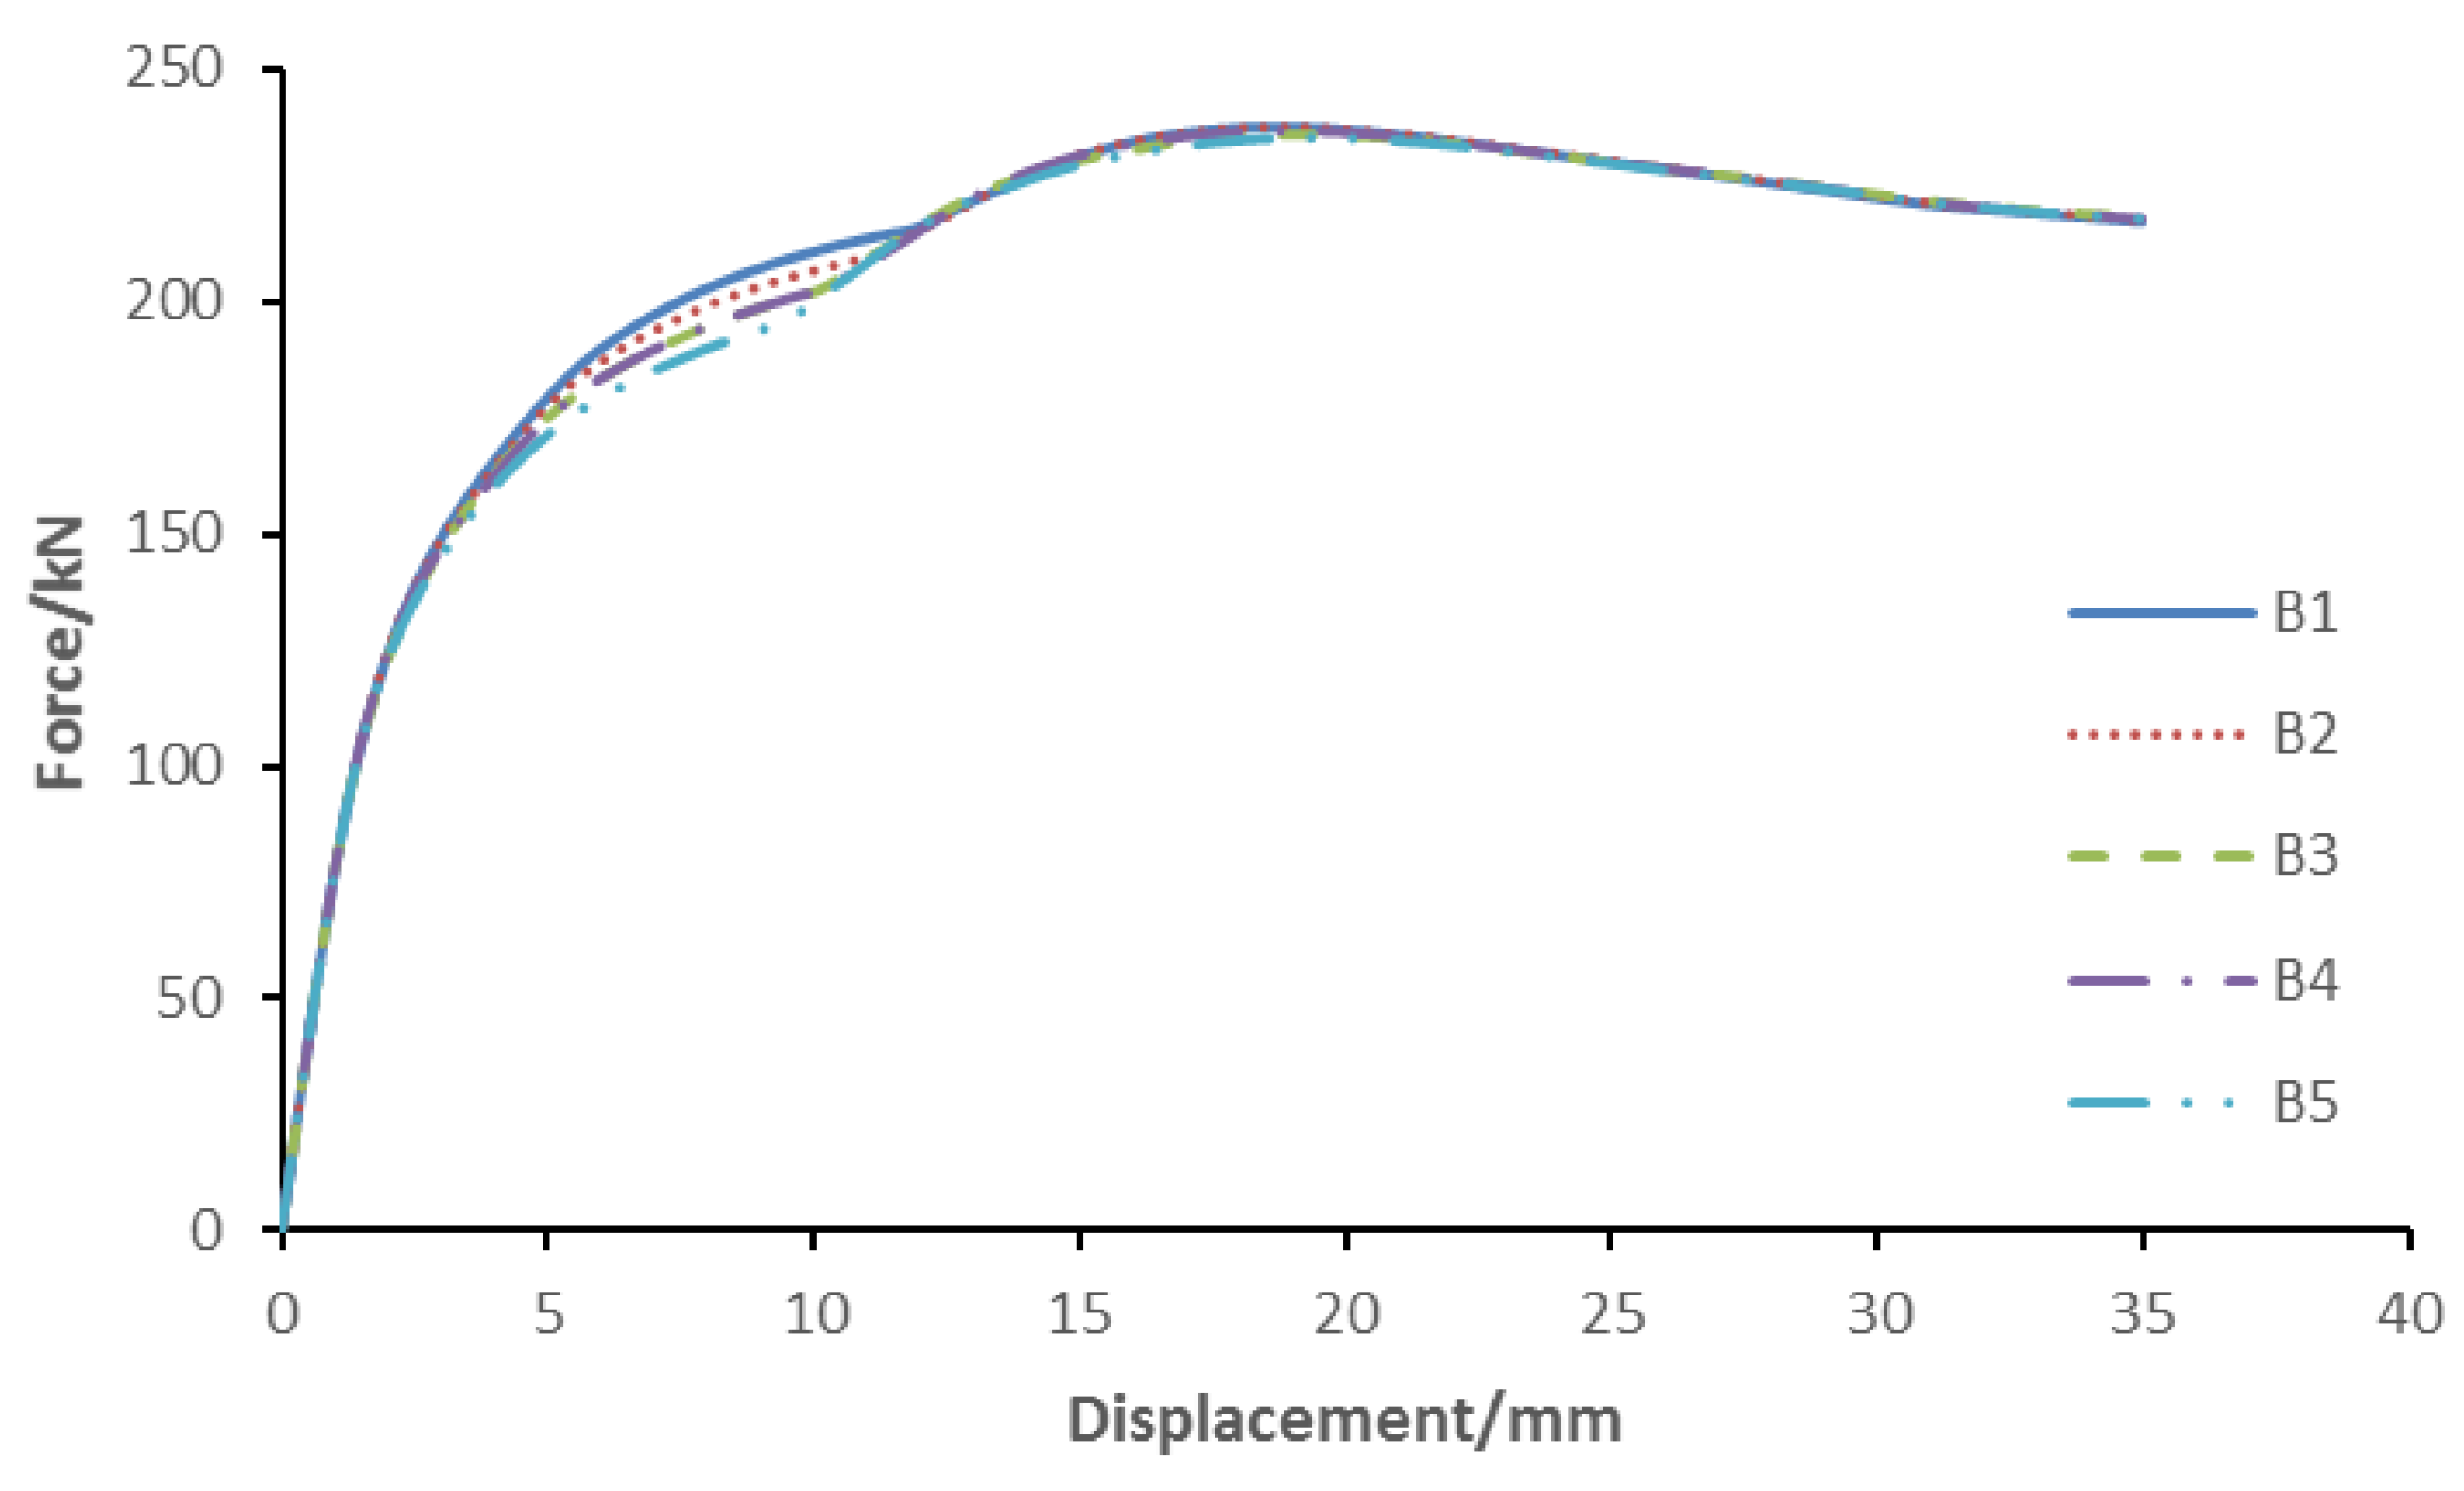
Under the premise of ensuring the safety of the specimen, it is necessary to determine the most economical and reasonable number of bolts. On the basis of the numerical model in Section 3.2, the changes of the number of bolts are achieved by deleting bolts in different locations. According to Chinese Standard GB50017-2003 [52], the maximum distance between bolts in this paper is 192 mm. The specific number of bolts is shown in Table 5. Through the numerical analyses, the force-displacement curves and slip-displacement curves are shown in Figure 21 and Figure 22, respectively. In Figure 21, the initial slips of B1–B5 all occur at the horizontal displacement of 1.38 mm, and the end slips occur at the horizontal displacement of 11.8 mm, 11.2 mm, 10.5 mm, 10.5 mm, and 9.4 mm, respectively. This means that the slip of the model is not sensitive to the number of bolts. In Figure 22, the stiffnesses of B1–B5 decrease by 69.4%, 70.1%, 70.6%, 70.8%, and 71.3% from the start of slip to the end of slip, respectively. Although a reduction of bolts can cause the stiffness degradation to become greater, the stiffness degradation ratios are approximations only. It is concluded that the changes of the number of bolts have little effect on the slip when the number of bolts meets the earthquake-resistant detail requirement and transmitted force need. In other words, in designing a connector for the PC shear wall, when the number of bolts is satisfied with the detail requirement and transmitted force need, the number of bolts can be reduced.
3.3.3. Axial Compression Ratio
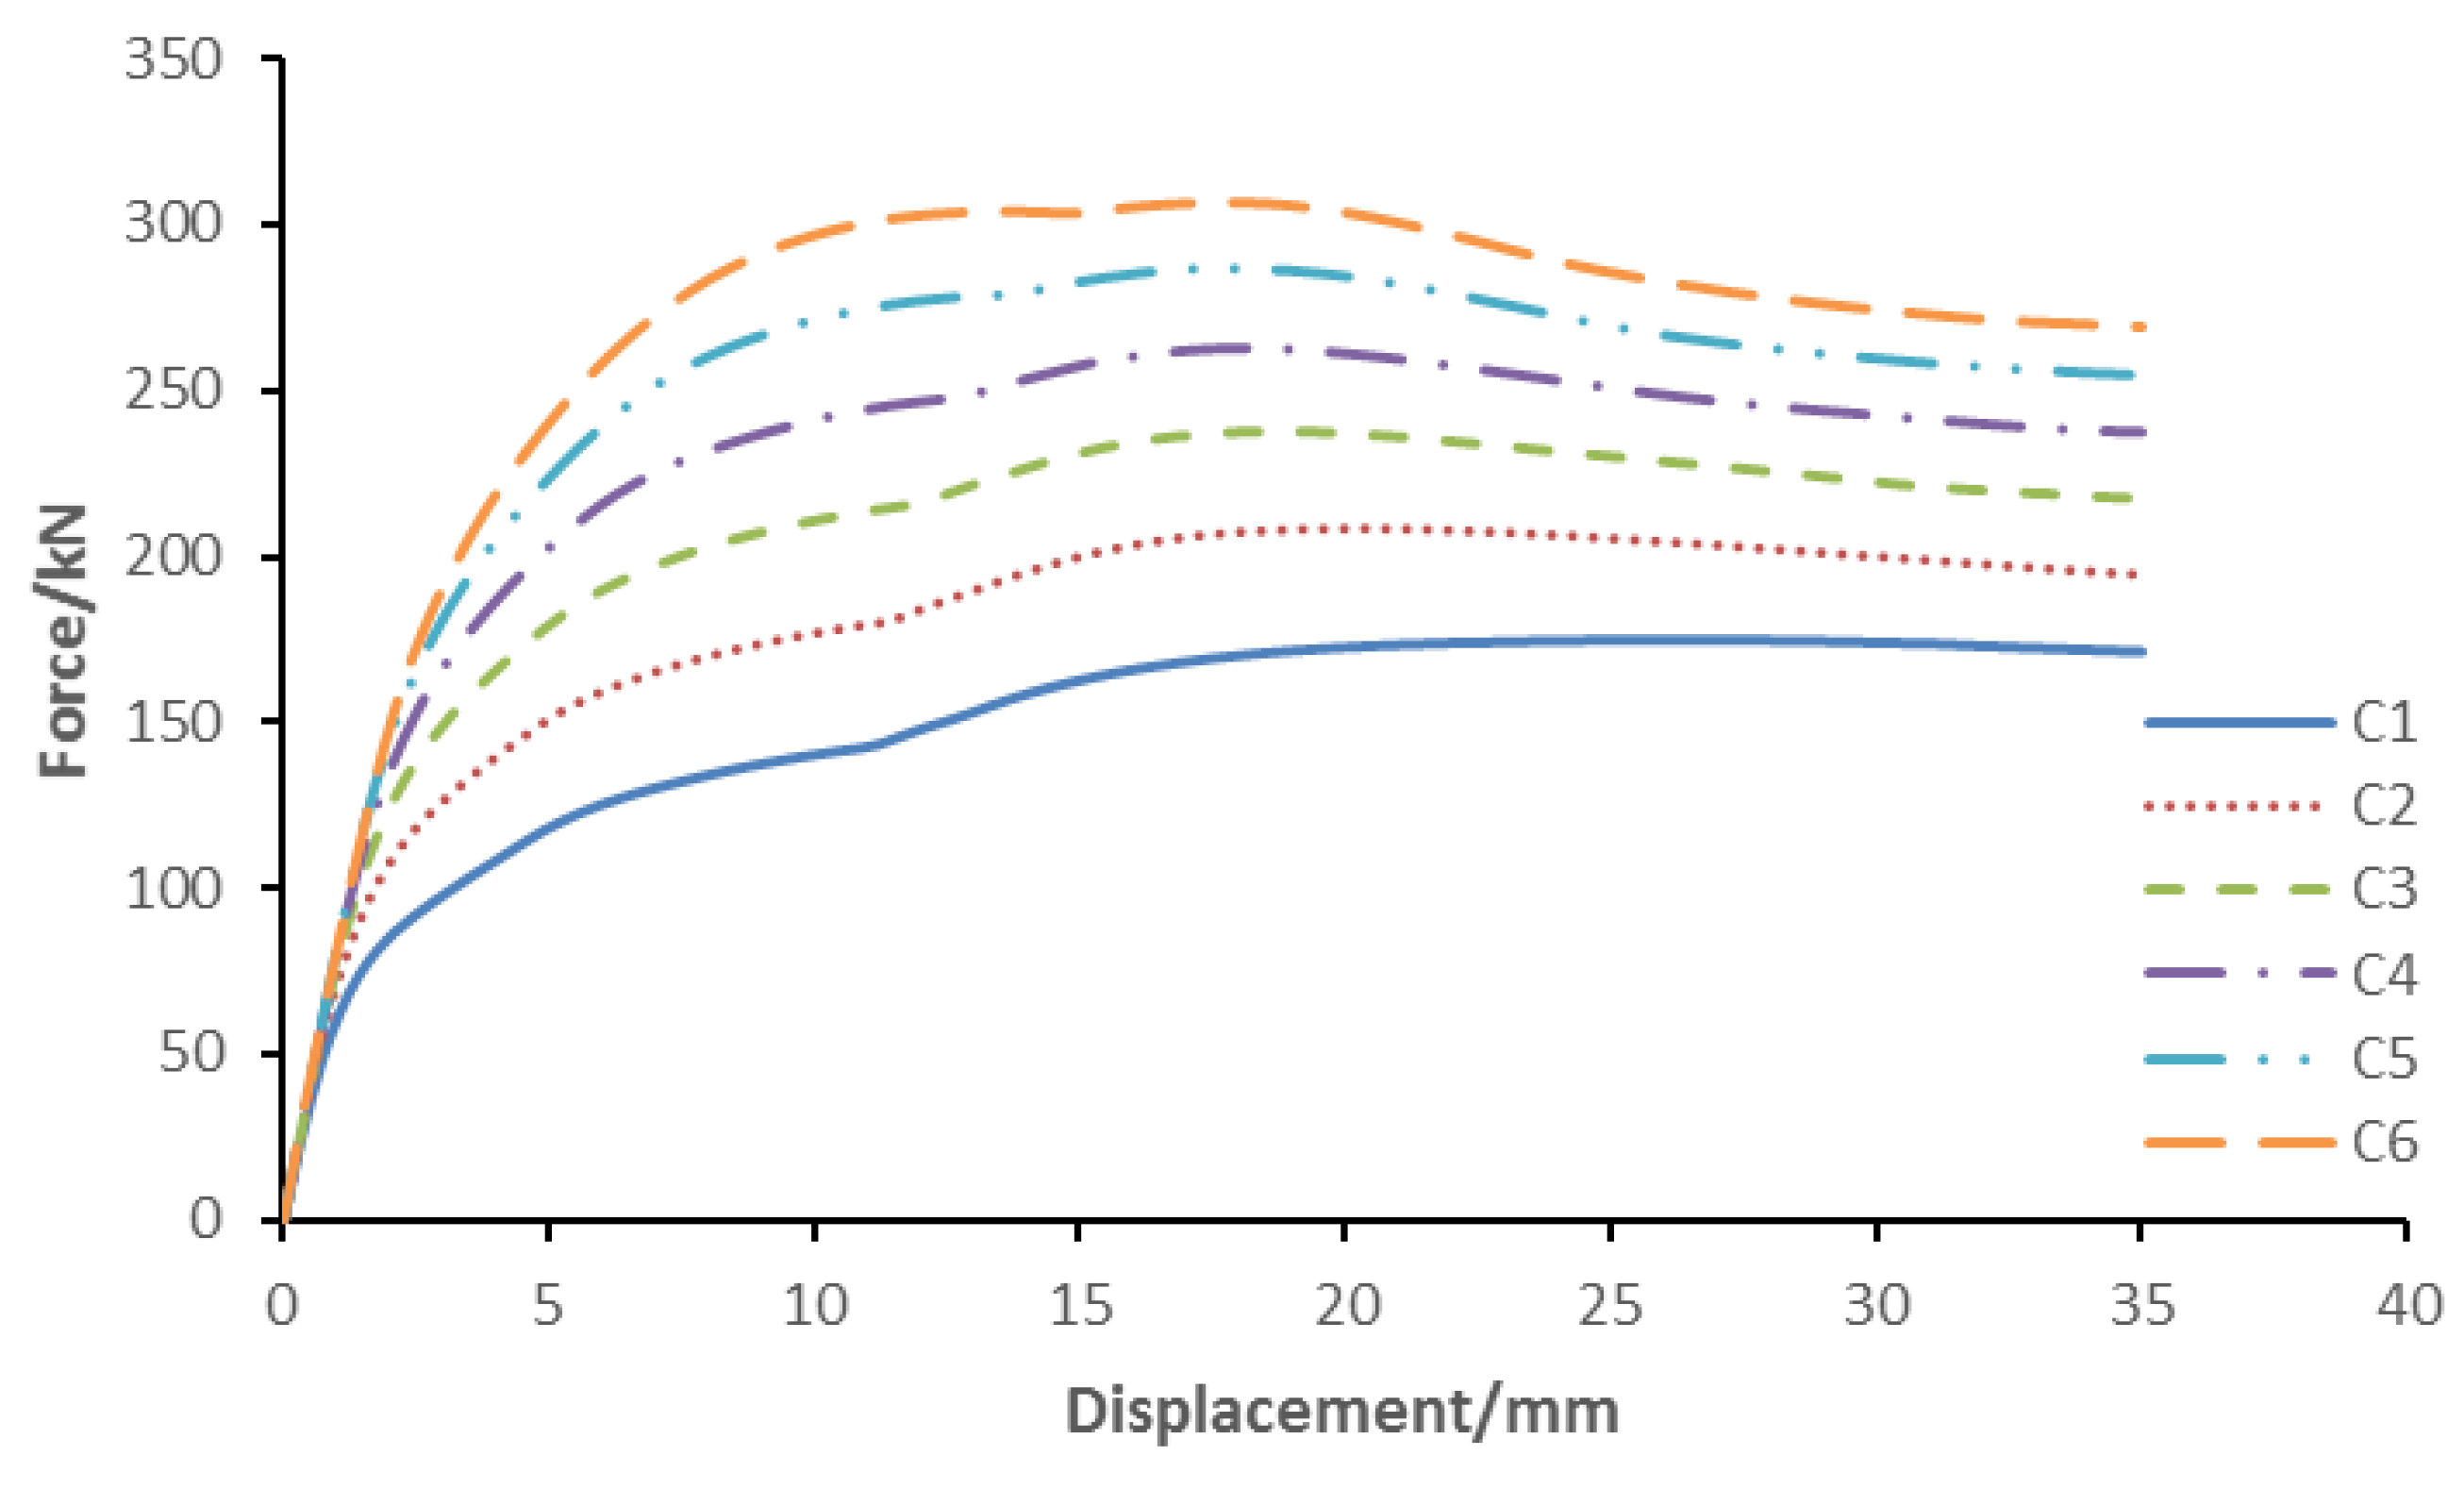
The axial compression ratio is an important parameter in structural design, which not only affects the ultimate load and ductility, but may also affect the slip. Therefore, it is necessary to determine an appropriate axial compression ratio. The change of axial compression ratio is achieved by modifying the axial pressure, which is applied to the top of the loaded beam (see Table 6). Through the numerical analyses, the force-displacement curves and slip-displacement curves are shown in Figure 23 and Figure 24. It can be seen from Figure 23 that the initial slips of C1–C6 occur at the horizontal displacement of 0.68 mm, 1.03 mm, 1.38 mm, 1.73 mm, and 2.08 mm, 2.34 mm, respectively. This means that the initial slip will be delayed with the increase of the axial compression ratio. In Figure 24, the ultimate loads of C1–C6 are 175.1 kN, 208.6 kN, 237.5 kN, 262.8 kN, 286.4 kN, and 307.1 kN, respectively. It is worth noting that the ultimate loads of the model are obviously enhanced with the increase of the axial compression ratio. However, when the loads reach the peak, the descent of load becomes faster with the increase of the axial compression ratio. In addition, the ductility coefficient of the specimen, calculated by Equation (4), declines with the increase of the axial compression ratio (see Table 7). Therefore, it is concluded that the axial compression ratio has a remarkably significant effect on the force-displacement curve.
It is worth noting that Guo [46] suggests that the ductility coefficient of the shear wall in a reinforced concrete structure should be greater than 4, and the minimum ductility coefficient (the axial compression ratio is 0.5) in this study is also greater than 4. Moreover, as suggested in the Code for Seismic Design of Buildings [53], the limiting value (minimum value) of the ductility coefficient of the shear wall is 0.5 for cast-in place reinforced concrete. Thus, by studying comparatively, this paper recommends that designers set the axial compression ratio to 0.5 for similar shear walls, i.e., a precast reinforced concrete structure. Of course, when the axial compression ratio is less than 0.5, the mechanical behaviors of the PC shear wall can also satisfy the safety requirement.
4. Conclusions
On the basis of the experimental and numerical analyses, the following conclusions can be drawn:
(1) The strain of the connector is less than the yield strain and the failure does not occur in the connector. The mechanical behaviors of the PC shear wall with this form of bolted connection, such as ductility, stiffness, and energy dissipation capacity, can satisfy the requirements of the equivalent RC shear wall.
(2) This form of bolted connection has little influence on the overall mechanical behaviors of the PC shear wall, thus, it can be used in practical design.
(3) By means of numerical analyses, some reasonable suggestions are made for the design of the connector. In practical design, (a) it is suggested that high strength bolts with a high pretightening force should be adopted to reduce the value of slip; (b) the number of bolts can be reduced on the basis of earthquake-resistant detailed requirement and transmitted force need; (c) the axial compression ratio can be set to 0.5 in this form of the PC shear wall, which also meets the Code for Seismic Design of Buildings [53] about cast-in place shear walls.
Author Contributions
S.J., J.Z., and X.L. designed the connector; S.L., J.Z., and S.M. designed the experiment; S.L. performed the experiments and numerical simulations, and wrote the paper; S.J. revised and finalized the paper.
Funding
This research was funded by [Fujian Science and Technology Planning Project] grant number [No. 2017Y0412].
Acknowledgments
This study is sponsored by the Fujian Science and Technology Planning Project (No. 2017Y0412).
Conflicts of Interest
The authors declare no conflict of interest.
References
- Lan, T.Q.; Zhao, S.N.; Xue, Y.P.; Luo, S.K. Review on seismic performance of PC shear wall structure. J. Civ. Archit. Environ. Eng. 2015, 37, 71–77. [Google Scholar]
- Xue, W.C. Progress in research and application of PC frame structure system. Ind. Constr. 2002, 32, 47–50. [Google Scholar]
- Kurama, Y.C.; Sritharan, S.; Fleischman, R.B.; Restrepo, J.I.; Henry, R.S. Seismic-Resistant Precast Concrete Structures: State of the Art. J. Struct. Eng. 2018, 144, 03118001. [Google Scholar] [CrossRef]
- Brunesi, E.; Nascimbene, R. Experimental and numerical investigation of the seismic response of precast wall connections. Bull. Earthq. Eng. 2017, 15, 1–40. [Google Scholar] [CrossRef]
- Dhanasekar, M.; Thamboo, J.A.; Nazir, S. On the in-plane shear response of the high bond strength concrete masonry walls. Mater. Struct. 2017, 50, 214. [Google Scholar] [CrossRef]
- Huang, Y.; Zhu, Z.G.; Huang, D. Investigation into half grout sleeve splicing for rebar via static tensile test. J. S. China Univ. Technol. (Nat. Sci. Ed.) 2016, 44, 26–32. [Google Scholar]
- Ma, J.W.; Pan, J.L.; Yin, W.Y. Experimental study on seismic performance of full precast shear wall-frame structures with reinforcement spliced by grout-filled sleeves. Eng. Mech. 2017, 34, 178–187. [Google Scholar]
- Belleri, A.; Riva, P. Seismic performance and retrofit of precast concrete grouted sleeve connections. PCI J. 2012, 57, 97–109. [Google Scholar] [CrossRef]
- Galvis, F.A.; Correal, J.F. Anchorage of bundled bars grouted in ducts. ACI Struct. J. 2018, 115, 415–424. [Google Scholar] [CrossRef]
- Liu, J.B.; Chen, Y.G.; Guo, Z.X.; Yuan, F. Test on the seismic performance of precast shear wall with vertical reinforcement lapping in pore-forming on steel plate. J. Hunan Univ. (Nat. Sci.) 2014, 41, 16–24. [Google Scholar]
- Yu, Z.W.; Peng, X.D.; Guo, W.; Peng, M.P. Seismic performance of precast concrete shear wall with U-type reinforcements ferrule connection. J. Zhejiang Univ. (Eng. Sci.) 2015, 49, 975–984. [Google Scholar]
- Zhou, J.; Zhao, Z.Z.; Hou, J.Q.; Ren, B. Uniaxial tension test and finite element simulation of indirect lap splice between the upper and lower floors of fabricated concrete shear walls. Concrete 2015, 11, 12–16. [Google Scholar]
- Villalobos, E.; Escolano-Margarit, D.; Ramírez-Márquez, A.; Pujol, S. Seismic response of reinforced concrete walls with lap splices. Bull. Earthq. Eng. 2017, 15, 2079–2100. [Google Scholar] [CrossRef]
- Seo, J.; Varma, A. Experimental behavior and design of steel plate composite-to-reinforced concrete lap splice connections. J. Struct. Eng. 2017, 143, 04017011. [Google Scholar] [CrossRef]
- Tullini, N.; Minghini, F. Grouted sleeve connections used in precast reinforced concrete construction-experimental investigation of a column-to-column joint. Eng. Struct. 2016, 127, 784–803. [Google Scholar] [CrossRef]
- Wu, L.W.; Tian, Y.; Su, Y.P. Seismic performance of precast composite shear walls reinforced by concrete-filled steel tubes. Eng. Struct. 2018, 162, 72–83. [Google Scholar] [CrossRef]
- Liu, J.J. Experimental study on seismic behavior of PC shear wall with different vertical steel connection. Master’s Thesis, Chongqing University, Chongqing, China, May 2015. [Google Scholar]
- Qian, J.R.; Peng, Y.Y.; Zhang, J.M. Tests on seismic behavior of PC shear walls with vertical reinforcements spliced by grout sleeves. Build. Struct. 2011, 4, 1–6. [Google Scholar]
- Wang, D.; Lv, X.L.; Lu, W.X. Experimental study on seismic performance of PC shear walls with joint connecting beam. J. Build. Struct. 2013, 34, 1–11. [Google Scholar]
- Zhu, Z.F.; Guo, Z.X.; Tang, L.; Zhu, Y. Seismic performance experiments on new hybrid precast concrete shear walls under different prestress forces. J. Hunan Univ. (Nat. Sci.). 2015, 42, 41–48. [Google Scholar]
- Smith, B.J.; Kurama, Y.C.; McGinnis, M.J. Comparison of solid and perforated hybrid precast concrete shear walls for seismic regions. Proceedings of ASCE Structures Congress, Reston, VA, USA, 29–31 March 2012; pp. 1529–1540. [Google Scholar]
- BulentErkmen; Schultz, A. Self-centering behavior of unbonded post-tensioned precast concrete shear walls. J. Earthq. Eng. 2009, 13, 1047–1064. [Google Scholar]
- Smith, B.J.; Kurama, Y.C.; Mcginnis, M.J. Design and measured behavior of a hybrid precast concrete wall specimen for seismic regions. J. Struct. Eng. 2011, 137, 1052–1062. [Google Scholar] [CrossRef]
- Belleri, A.; Schoettler, M.J.; Restrepo, J.I.; Fleishman, R.B. Dynamic behavior of rocking and hybrid cantilever walls in precast concrete building. ACI Struct. J. 2014, 111, 661–672. [Google Scholar] [CrossRef]
- Twigden, K.M.; Sritharan, S.; Henry, R.S. Cyclic testing of unbonded post-tensioned concrete wall systems with and without supplemental damping. Eng. Struct. 2017, 140, 406–420. [Google Scholar] [CrossRef]
- Liu, J.X.; Li, W.F.; Wang, X.T.; Wang, T. Seismic behavior of a new assembled monolithic concrete wall structure. J. Earthq. Eng. Eng. Vibr. 2012, 32, 110–118. [Google Scholar]
- Ersoy, U.; Tankut, T. Precast concrete members with welded plate connections under reversed cyclic loading. Pci J. 1993, 38, 94–100. [Google Scholar] [CrossRef]
- Crisafulli, F.J.; Restrepo, J.I. Ductile steel connections for seismic resistant precast buildings. J. Earthq. Eng. 2003, 7, 541–553. [Google Scholar] [CrossRef]
- Xue, W.C.; Gu, X.L.; Hu, X.; Li, X. Experimental study of assembled monolithic concrete shear wall with bolted connection under low reversed cyclic loading. China Civ. Eng. J. 2014, s2, 221–226. [Google Scholar]
- Wang, W.; Xiong, F.; Xu, J.X. Experimental study on shear behavior of the bolt connection of prefabricated concrete wallboard. J. Sichuan Univ. (Eng. Sci. Ed.) 2016, s2, 86–92. [Google Scholar]
- Lim, W.; Kang, H.; Hong, S. Cyclic lateral testing of precast concrete t-walls in fast low-rise construction. ACI Struct. J. 2016, 113, 179–189. [Google Scholar] [CrossRef]
- Semelawy, M.E.; Damatty, A.E.; Soliman, A.M. Novel anchor-jointed precast shear wall: testing and validation. Ice Proc. Struct. Build. 2014, 168, 263–274. [Google Scholar] [CrossRef]
- Semelawy, M.E.; Damatty, A.E.; Soliman, A.M. Finite-element analysis of anchor-jointed precast Structure wall system. Struct. Build. 2017, 170, 1–12. [Google Scholar] [CrossRef]
- Lago, B.D.; Negro, P.; Lago, A.D. Seismic design and performance of dry-assembled precast structures with adaptable joints. Soil Dyn. Earthq. Eng. 2018, 106, 182–195. [Google Scholar] [CrossRef]
- Kurama, Y.; Pessiki, S.; Sause, R.; Lu, L.W. Lateral load behavior and seismic design of unbonded post-tensioned precast concrete walls. ACI Struct. J. 1999, 96, 622–632. [Google Scholar]
- Bora, C.; Oliva, M.G.; Nakaki, S.D.; Becker, R. Development of a precast concrete shear-wall system requiring special code acceptance. PCI J. 2007, 52, 122–135. [Google Scholar] [CrossRef]
- Ozturan, T.; Ozden, S.; Ertas, O. Ductile connections in precast concrete moment resisting frames. PCI J. 2006, 3, 66–76. [Google Scholar]
- Ding, K.; Dhanasekar, M. Flexural behaviour of bonded-bolted butt joints due to bolt looseness. Adv. Eng. Softw. 2007, 38, 598–606. [Google Scholar] [CrossRef]
- Noor-E-Khuda, S.; Dhanasekar, M. Masonry walls under combined in-plane and out-of-plane loadings. J. Struct. Eng. 2018, 144, 04017186. [Google Scholar] [CrossRef]
- Wang, T.; Song, G.; Liu, S. Review of bolted connection monitoring. Int. J. Distrib. Sens. Netw. 2013, 2013, 1–8. [Google Scholar] [CrossRef]
- Huo, L.; Chen, D.; Kong, Q.; Li, H.; Song, G. Smart washer—A piezoceramic-based transducer to monitor looseness of bolted connection. Smart Mater. Struct. 2017, 26, 025033. [Google Scholar] [CrossRef]
- Huo, L.; Chen, D.; Liang, Y.; Li, H.; Feng, X.; Song, G. Impedance based bolt pre-load monitoring using piezoceramic smart washer. Smart Mater. Struct. 2017, 26, 057004. [Google Scholar] [CrossRef]
- Wang, T.; Song, G.; Wang, Z.; Li, Y. Proof-of-concept study of monitoring bolt connection status using a piezoelectric based active sensing method. Smart Mater. Struct. 2013, 22, 087001. [Google Scholar] [CrossRef]
- Jiang, S.F.; Zhao, J.; Liu, Z.P.; Li, X. Connection device and connection method of precast shear wall horizontal gaps. N106906923A 30 June 2017. [Google Scholar]
- Chinese Academy of Architectural Sciences. Code for seismic test of buildings; JGJ/T 101-2015; China Architectur and Building Press: Beijing, China, 5 February 2015. [Google Scholar]
- Guo, Z.H.; Shi, X.D. Principle and Analysis of Reinforced Concrete, 1st ed.; Tsinghua University Publisher: Beijing, China, 2003. [Google Scholar]
- Janaraj, T.; Dhanasekar, M. Finite element analysis of the in-plane shear behaviour of masonry panels confined with reinforced grouted cores. Constr. Build. Mater. 2014, 65, 495–506. [Google Scholar] [CrossRef]
- Chinese Academy of Architectural Sciences. Code for design of concrete structures; GB50010-2010; China Architecture and Building Press: Beijing, China, 18 August 2010. [Google Scholar]
- Song, C.C.; Liu, J.M.; Ai, T.T.; Li, Z. The study on damage factors in concrete plastic damage model of ABAQUS. Eng. Constr. 2017, 49, 1–5. [Google Scholar]
- Li, H.; Zhong, M.; Zhu, C.J. Study on analysis methods of bolt connection based on the ABAQUS. Mech. Res. Appl. 2017, 1, 15–17. [Google Scholar]
- Sun, J. Study on the seismic behavior of an innovative totally precast shear wall structure. Ph.D. Thesis, Southeast University, Nanjing, China, 2016. [Google Scholar]
- Chinese Academy of Architectural Sciences. Code for design of steel structures; GB50017-2003; China Architecture and Building Press: Beijing, China, 25 April 2003. [Google Scholar]
- Chinese Academy of Architectural Sciences. Code for seismic design of buildings; GB50011-2010; China Architecture and Building Press: Beijing, China, 31 May 2010. [Google Scholar]
Figure 1.
Dimension and rebars of specimens.

Figure 2.
Connector design.

Figure 3.
Test setup.

Figure 4.
Loading protocol.

Figure 5.
Arrangement of displacement transducers.

Figure 6.
Arrangement of strain rosettes.

Figure 7.
Failure modes of specimens.

Figure 8.
Curves of slip-displacement for the PC specimen.

Figure 9.
Connector strain curves.


Figure 10.
Hysteretic curves.

Figure 11.
Skeleton curves.

Figure 12.
Stiffness curves.

Figure 13.
Equivalent viscous damping coefficient curves.

Figure 14.
Numerical model.

Figure 15.
Hysteretic curves.

Figure 16.
Skeleton curves.

Figure 17.
Stress cloud diagrams of the connector.

Figure 18.
Stress cloud diagrams of the bolts.

Figure 19.
Slip-displacement curves.

Figure 20.
Force-displacement curves.

Figure 21.
Slip-displacement curves.

Figure 22.
Force-displacement curves.

Figure 23.
Slip-displacement curves.

Figure 24.
Force-displacement curves.


Table 1.
Material properties of concrete.
| Specimen | Wall Strength (MPa) | Wall Limb Strength (MPa) | Ground Beam Strength (MPa) | Elastic Modulus (104 MPa) |
|---|---|---|---|---|
| RC (cast-in-place reinforced concrete) | 32.7 | 32.7 | 32.7 | 3.07 |
| PC (precast reinforced concrete) | 32.7 | 38.5 | 32.7 | 3.07 |
Table 2.
Material properties of rebars and steel plate.
| Type | Yield Strength (MPa) | Ultimate Strength (MPa) | Elastic Modulus (105 MPa) |
|---|---|---|---|
| Ф6 | 303.04 | 402.69 | 1.61 |
| Ф8 | 415.94 | 680.01 | 2.02 |
| Ф10 | 425.32 | 547.56 | 1.81 |
| Q235 | 239.09 | 345.85 | 1.95 |
Table 3.
Displacement ductility coefficient.
| Specimen | δy/mm | δu/mm | μ |
|---|---|---|---|
| RC | 5.7 | 27.1 | 4.7 |
| −5.3 | −29.0 | 5.4 | |
| PC | 5.0 | 34.7 | 6.9 |
| −4.7 | −34.7 | 7.3 |
Table 4.
Pretightening force.
| Model | A1 | A2 | A3 | A4 |
|---|---|---|---|---|
| Pretightening force (kN) | 0 | 30 | 60 | 90 |
Table 5.
Number and arrangement of bolts.
| Model | B1 | B2 | B3 | B4 | B5 |
|---|---|---|---|---|---|
| Bolt number | 14 | 12 | 10 | 10 | 8 |
| Bolt arrangement |  |  |  |  |  |
Table 6.
Axial compression ratio.
| Model | C1 | C2 | C3 | C4 | C5 | C6 |
|---|---|---|---|---|---|---|
| Axial pressure ratio | 0 | 0.1 | 0.2 | 0.3 | 0.4 | 0.5 |
| Axial pressure (kN) | 0 | 191 | 382 | 573 | 764 | 955 |
Table 7.
Ductility.
| Model | C1 | C2 | C3 | C4 | C5 | C6 |
|---|---|---|---|---|---|---|
| Ductility coefficient | 6.3 | 5.9 | 5.7 | 5.3 | 5.0 | 4.8 |
© 2018 by the authors. Licensee MDPI, Basel, Switzerland. This article is an open access article distributed under the terms and conditions of the Creative Commons Attribution (CC BY) license (http://creativecommons.org/licenses/by/4.0/).
Share and Cite
MDPI and ACS Style
Jiang, S.; Lian, S.; Zhao, J.; Li, X.; Ma, S. Influence of a New Form of Bolted Connection on the Mechanical Behaviors of a PC Shear Wall. Appl. Sci. 2018, 8, 1381. https://doi.org/10.3390/app8081381
AMA Style
Jiang S, Lian S, Zhao J, Li X, Ma S. Influence of a New Form of Bolted Connection on the Mechanical Behaviors of a PC Shear Wall. Applied Sciences. 2018; 8(8):1381. https://doi.org/10.3390/app8081381
Chicago/Turabian StyleJiang, Shaofei, Shenghang Lian, Jian Zhao, Xiang Li, and Shenglan Ma. 2018. "Influence of a New Form of Bolted Connection on the Mechanical Behaviors of a PC Shear Wall" Applied Sciences 8, no. 8: 1381. https://doi.org/10.3390/app8081381
Note that from the first issue of 2016, this journal uses article numbers instead of page numbers. See further details here.