A Robust Cover Song Identification System with Two-Level Similarity Fusion and Post-Processing


School of Information Science and Engineering, East China University of Science and Technology, 130 Meilong Road, Shanghai 200237, China
*
Author to whom correspondence should be addressed.
Appl. Sci. 2018, 8(8), 1383; https://doi.org/10.3390/app8081383
Submission received: 23 July 2018
/
Revised: 13 August 2018
/
Accepted: 14 August 2018
/
Published: 16 August 2018
(This article belongs to the Special Issue Digital Audio and Image Processing with Focus on Music Research)
Abstract
:Similarity measurement plays an important role in various information retrieval tasks. In this paper, a music information retrieval scheme based on two-level similarity fusion and post-processing is proposed. At the similarity fusion level, to take full advantage of the common and complementary properties among different descriptors and different similarity functions, first, the track-by-track similarity graphs generated from the same descriptor but different similarity functions are fused with the similarity network fusion (SNF) technique. Then, the obtained first-level fused similarities based on different descriptors are further fused with the mixture Markov model (MMM) technique. At the post-processing level, diffusion is first performed on the two-level fused similarity graph to utilize the underlying track manifold contained within it. Then, a mutual proximity (MP) algorithm is adopted to refine the diffused similarity scores, which helps to reduce the bad influence caused by the “hubness” phenomenon contained in the scores. The performance of the proposed scheme is tested in the cover song identification (CSI) task on three cover song datasets (Covers80, Covers40, and Second Hand Songs (SHS)). The experimental results demonstrate that the proposed scheme outperforms state-of-the-art CSI schemes based on single similarity or similarity fusion.
1. Introduction
A huge increase in the number of digital music tracks promotes the development of content-based music information retrieval (MIR) technology. As a part of MIR, cover song identification (CSI, also called cover version identification) has received increasing attention due to its potential real-world applications in copyright protection and the management of online music products. Additionally, the study of CSI techniques helps to understand how the human auditory system measures and models the similarity between music.
As one of the most fundamental components of MIR applications, how to measure and model similarity between music items is an important yet challenging research question [1]. Various similarity functions have been proposed in recent years [2,3,4,5]. Considering that the similarity between two tracks can be calculated based on different descriptors and similarity functions, the complementary properties are neglected while using a single similarity function. It has been verified [6,7,8] that different descriptors and similarity functions are complementary to each other in the CSI task. To fully take advantage of the common as well as complementary information contained in different descriptors and similarity functions in describing the similarity between tracks, some researchers began to study similarity fusion algorithms for CSI. In [9], the main melody and accompaniment of the music were extracted first. Then, the maximum value of the similarities obtained based on main melody, accompaniment, and mixture signal, separately, was taken as the final similarity. In [6], the standard classification-based fusion strategy [10] was adopted to fuse the similarities of three related yet different descriptors (harmony, melody, and bass line). In [11], the fusion of different similarities was achieved by projecting different similarities in a multi-dimensional space, where the dimensionality of the space was the number of similarities considered. However, this scheme was easily disturbed by bad descriptors because of the diluted signal-to-noise ratio. In [12], the similarity graphs obtained based on different descriptors and corresponding similarity functions were fused by the similarity network fusion (SNF) technique [13]. Then, the track-by-track similarities in the fused similarity graph were adopted for version identification. Due to the merits of the SNF technique, this fusion scheme could reduce the noise existing in each similarity graph and take advantage of the common as well as complementary information across each similarity graph. A similar strategy was adopted in [8] to fuse the similarities obtained based on the same descriptor and different similarity functions (Qmax [4] and Dmax [5]). This achieved the highest identification accuracy in the CSI task of MIREX 2016 (http://www.music-ir.org/mirex/wiki/2016:Audio_Cover_Song_Identification_Results). Some researchers proposed multi-stage similarity fusion schemes to take advantage of the common and complementary information provided by different musical descriptors and different similarity functions at the same time [7,14]. In [14], the SNF technique was applied to both the descriptor-level fusion and the similarity-level fusion. It achieved the highest identification accuracy on the Covers80 dataset. In [7], in the early fusion, the similarities obtained by the same descriptor and different similarity functions were integrated by SNF. In the late fusion, the learning method selected by the sparse group LASSO algorithm was applied to the early fused similarity to obtain the probability that the input track pair belonged to the reference/cover pair. Finally, the final similarity was obtained by averaging the probability-based similarities obtained based on each descriptor.
However, some important factors that may seriously influence the identification accuracy are not considered in the available fusion schemes: (i) The complementarity among different descriptors and that among different similarity functions is not considered simultaneously [6,8] or not fused efficiently [7]. (ii) The track manifold of the fused similarity graph, which will affect retrieval accuracy greatly, is not taken into consideration [15] (refer to Section 2.4.1 for specific examples). (iii) The bad influence caused by the “hubness” phenomenon contained in the fused similarity graph is seldom considered, which may increase the false positive rate [16].
To solve the possible shortcomings existing in the available similarity fusion algorithms and enhance the CSI performances further, a new CSI scheme based on two-level similarity fusion and post-processing is put forward in this paper. At the fusion level, a nonlinear graph fusion technique [13] is first adopted to fuse the similarity graphs constructed based on the same descriptor and different similarity functions. Then, a mixture Markov model (MMM) [17] is introduced to integrate the first-level fused similarity graphs generated based on two complementary descriptors. At the post-processing level, diffusion [16] is first applied on the obtained two-level fused similarity graph to take full advantage of the underlying structure of the tracks contained within it to reduce the noise and enhance the identification further. Then, the mutual proximity (MP) technique [15] is performed on the diffused similarity scores to reduce the bad influence caused by the “hubness” phenomenon existing in the diffused track community. It should be noted that the proposed scheme is different from our previously proposed scheme [7] in the following respects: (i) Unlike the scheme in [7], the proposed scheme is fully unsupervised. (ii) The track manifold contained in the two-level fused similarity graph is not considered in [7]. (iii) The negative influence of the “hubness” phenomenon, which is not considered in [7], is eliminated by the MP technique in the proposed scheme. Extensive experiments conducted on three cover song datasets (Covers80 (https://labrosa.ee.columbia.edu/projects/coversongs/covers80/), Covers40, and SHS https://labrosa.ee.columbia.edu/millionsong/secondhand) manifest the necessity and effectiveness of each step included in the proposed model (Section 3.3.1) and the superiority of the proposed scheme, in terms of CSI identification accuracy over state-of-the-art CSI schemes (Section 3.3.2) and computational complexity, especially when the size of the dataset increased (Section 3.3.3). The rest of this paper is organized as follows. The proposed model is presented in Section 2. Section 3 reports the experimental results. Finally, conclusions are drawn and future work is discussed in Section 4.
2. Proposed Model
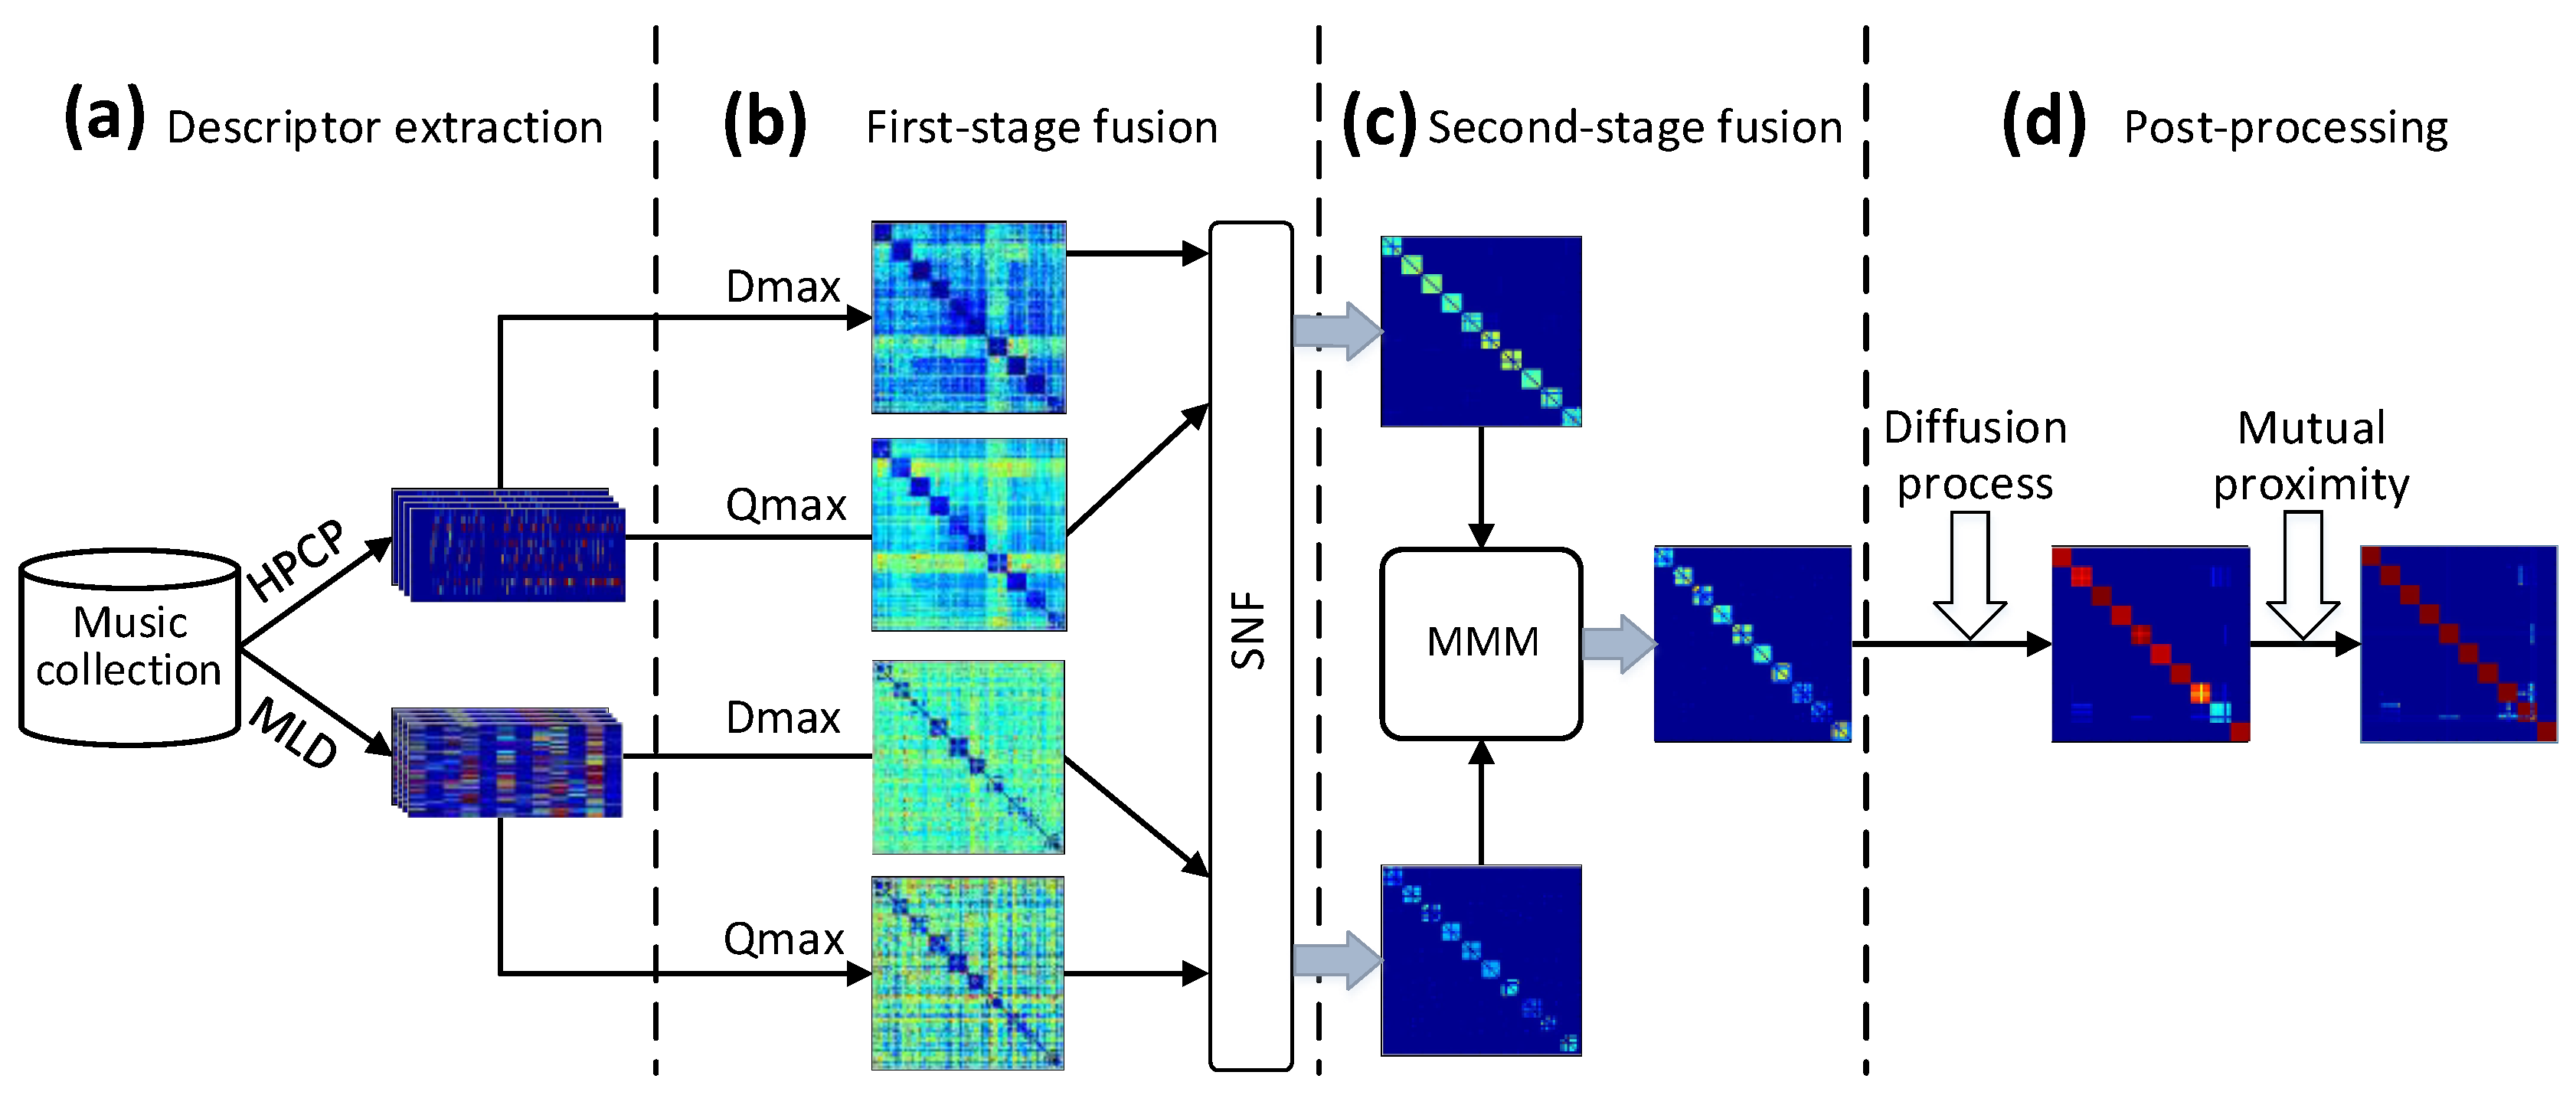
A block diagram of the proposed model, which is illustrated by an example of results obtained on Covers40 (see Section 3.1), is shown in Figure 1.
Let denote a music collection. Two function lists are defined as follows:
- Function list : where extracts the i-th kind of descriptor from the track .
- Function list : where computes the j-th similarity score between the i-th descriptors of the input tracks and .
2.1. Descriptor Extraction
2.2. First-Level Fusion
For each pair of tracks ( and ), the j-th kind of similarity function is performed on their i-th descriptors to obtain the similarity score :
Thus, the track-by-track similarity matrix obtained based on the i-th descriptor and j-th similarity function can be represented as a graph, denoted as , where the vertices correspond to the tracks in the collection, and the edges are weighted by the corresponding similarity scores .
To take advantage of the complementarity between the Qmax and Dmax similarity functions in representing the similarity between cover versions, the similarity graphs based on the same descriptor (HPCP or MLD) and two different similarity functions (Qmax [4] and Dmax [5]) are fused with the SNF technique [13]. The specific details of the SNF technique can be found in [13] and [7]. The first-level fused similarity graph for the i-th descriptor can be denoted as , , which is obtained with Equation (2):
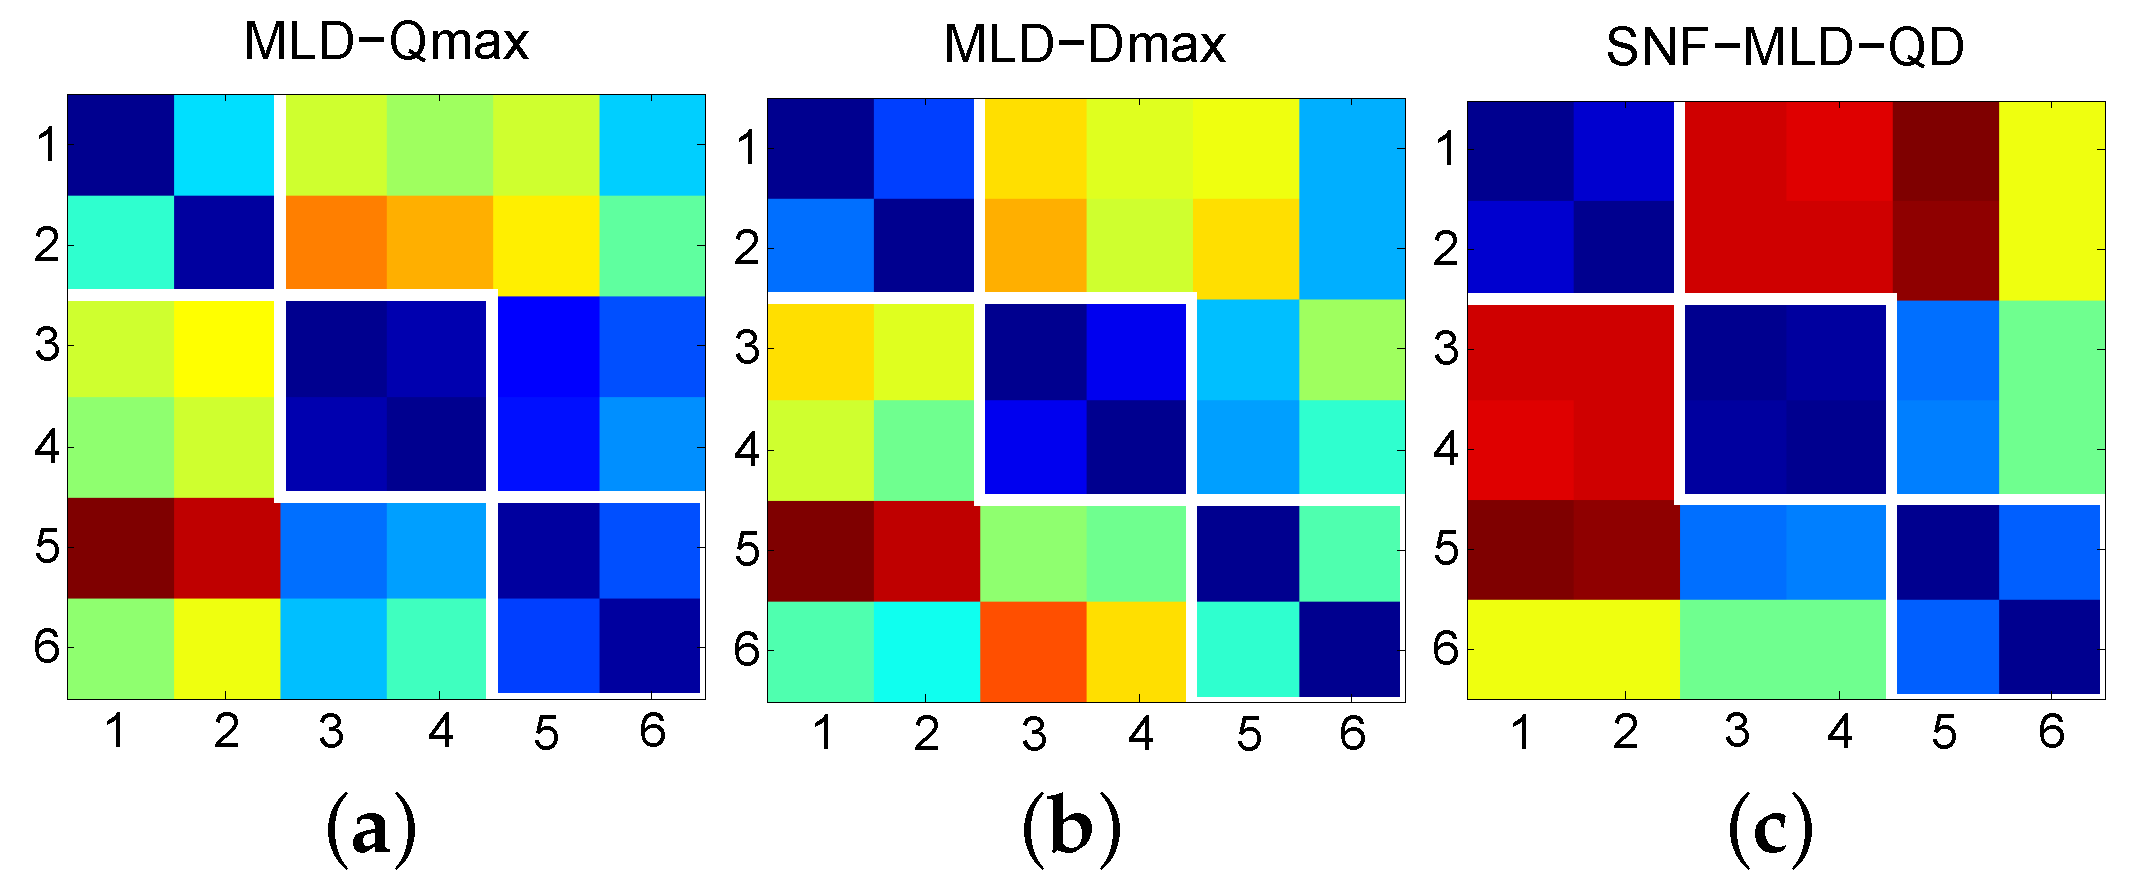
To test the validity of the first-level fusion, three cover sets shown in Table 1 are studied here. The six tracks were used both as the queries and the targets. The corresponding 6 × 6 similarity matrices obtained by MLD-Qmax, MLD-Dmax, and the first-level fused version of them (denoted as SNF-MLD-QD), are shown in Figure 2a–c, respectively. The cells corresponding to the query/cover pairs are marked with white boxes. It can be seen that MLD-Qmax and MLD-Dmax did not work on the No. 1 and No. 3 cover sets, respectively. However, after first-level fusion, this problem was solved.
2.3. Second-Level Fusion
To make full use of the common and complementary properties of different descriptors (HPCP and MLD), the first-level fused similarity graphs for each descriptor are further fused with MMM technique [17] as follows.
For a walker sitting at vertex in graph , she first decides which graph to land in, jumps to that graph, then decides which neighboring vertex to go to according to the graph’s similarity matrix. The procedure of walking from to across all graphs can be represented with Equation (3):
where is the transition probability of walking from to in the second-level fused similarity graph. is the probability of switching to (or staying in) graph when the walker is at vertex .
The degree of in , denoted as , is defined as the sum of the edge strength of all vertices connected to (i.e. ). The volume of graph , denoted as , is defined as the sum of all edge strengths in it, which can be calculated as . Then, can be rewritten as
When the random walk model reaches a stationary state, the stationary probability at vertex is defined as
Suppose the stationary probability of the second-level fused graph, denoted as , can be represented by a linear combination of the stationary probabilities of all first-level fused graphs as follows:
where is the weight for vertex in graph , and .
Then, in Equation (3) can be calculated as follows:
Then is adopted as the second-level fused similarity score. The corresponding similarity graph is denoted as , where .
2.4. Post-Processing
At the post-processing level, first, the locally constrained diffusion process (LCDP) [16] is performed on the second-level fused similarity graph to make full use of the underlying track manifold structure contained within it to enhance the retrieval performance. Then, the MP technique is applied on the obtained diffused similarity to eliminate the negative influence caused by the “hubness” phenomenon contained in the diffused track community.
2.4.1. Diffusion Processing
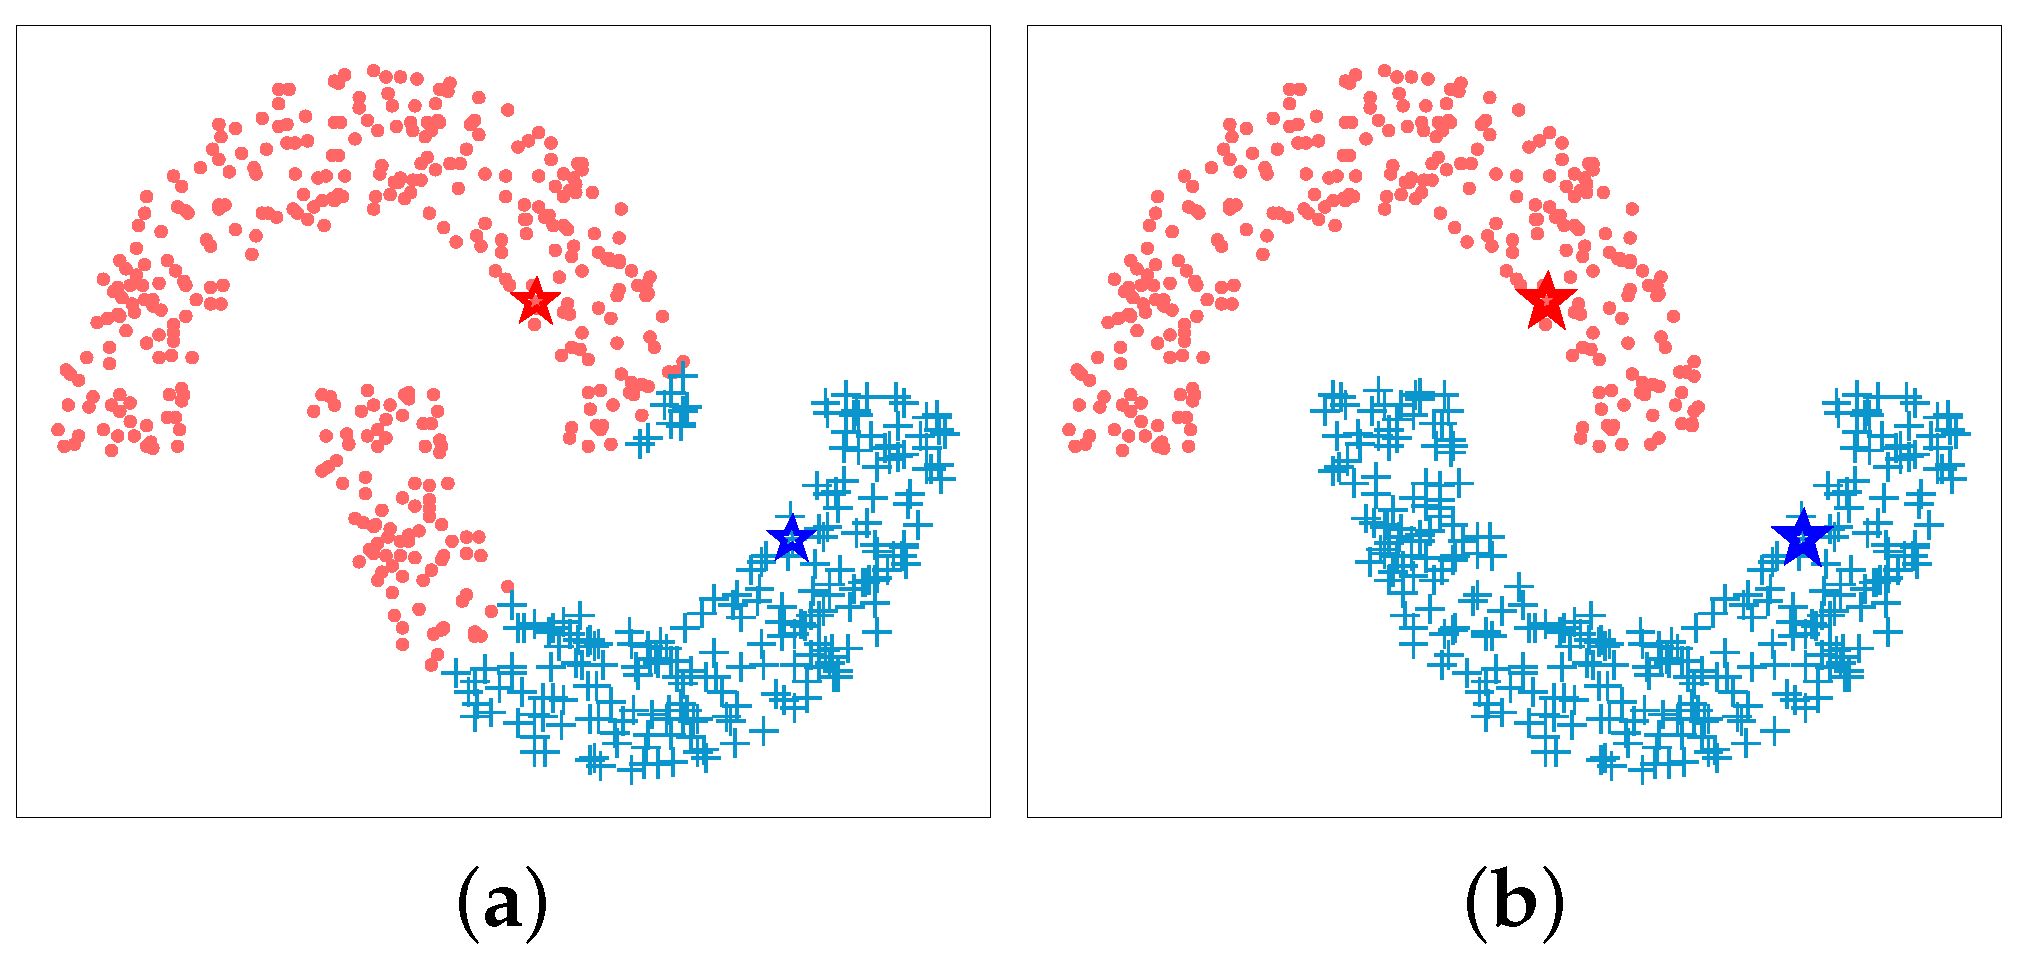
For diffusion processing, we adopt the LCDP technique proposed in [16]. The central concept of LCDP is to restrict a random walk to the K nearest neighbors of the data points by replacing the original graph G in traditional diffusion process with a K nearest neighbor (K-NN) graph , which can effectively reduce the influence of the noisy data points. Figure 3 shows the classification results of double moon data before and after applying diffusion on the distance values. It can be seen that diffusion can utilize the structure of the underlying data manifold to enhance classification performance.
Given the second-level fused similarity matrix , the transition matrix, denoted as , can be calculated as follows:
where is a diagonal matrix and the q-th diagonal element is the degree of in graph G.
Assume that the K-NN graph of G is , which is generated by only keeping the similarity scores of each node and its K nearest neighbors in G. The transition matrix corresponding to is . We generate a diffused similarity matrix, denoted as , where is a column vector indicating the probability of being at a vertex starting from vertex after t steps. Then, LCDP [16] is employed to iteratively update as follows:
where , and the diffusion terminates after a pre-defined number of iterations or if does not change. Then, the obtained diffused similarity graph can be denoted as .
2.4.2. Hubness Reduction
To reduce the negative influence caused by the “hubness” phenomenon existing in the track community, we adopt MP algorithm [15] to transform the obtained arbitrary similarity scores to probability-based similarity scores. MP is a global scaling method, and its general idea is to reinterpret the original distance space so that two objects sharing similar nearest neighbors are more closely tied to each other. Under the assumption that all distances in a data set follow a certain distribution, any similarity can now be reinterpreted as the probability of being the nearest neighbor of , is defined by the similarities of to all other objects in the collection, and the probability of an element being a nearest neighbor of is:
denotes the cumulative distribution function (CDF), which is assumed for the distribution of similarity scores . Then, the MP-based similarity between and , denoted as , is defined as the probability that is the nearest neighbor of given and is the nearest neighbor of given as follows:
By visualizing the joint similarity score distribution of X and Y, computing MP for a given similarity score in a collection of N objects can be boiled down to simply counting the number of objects j having a smaller similarity score to and than :
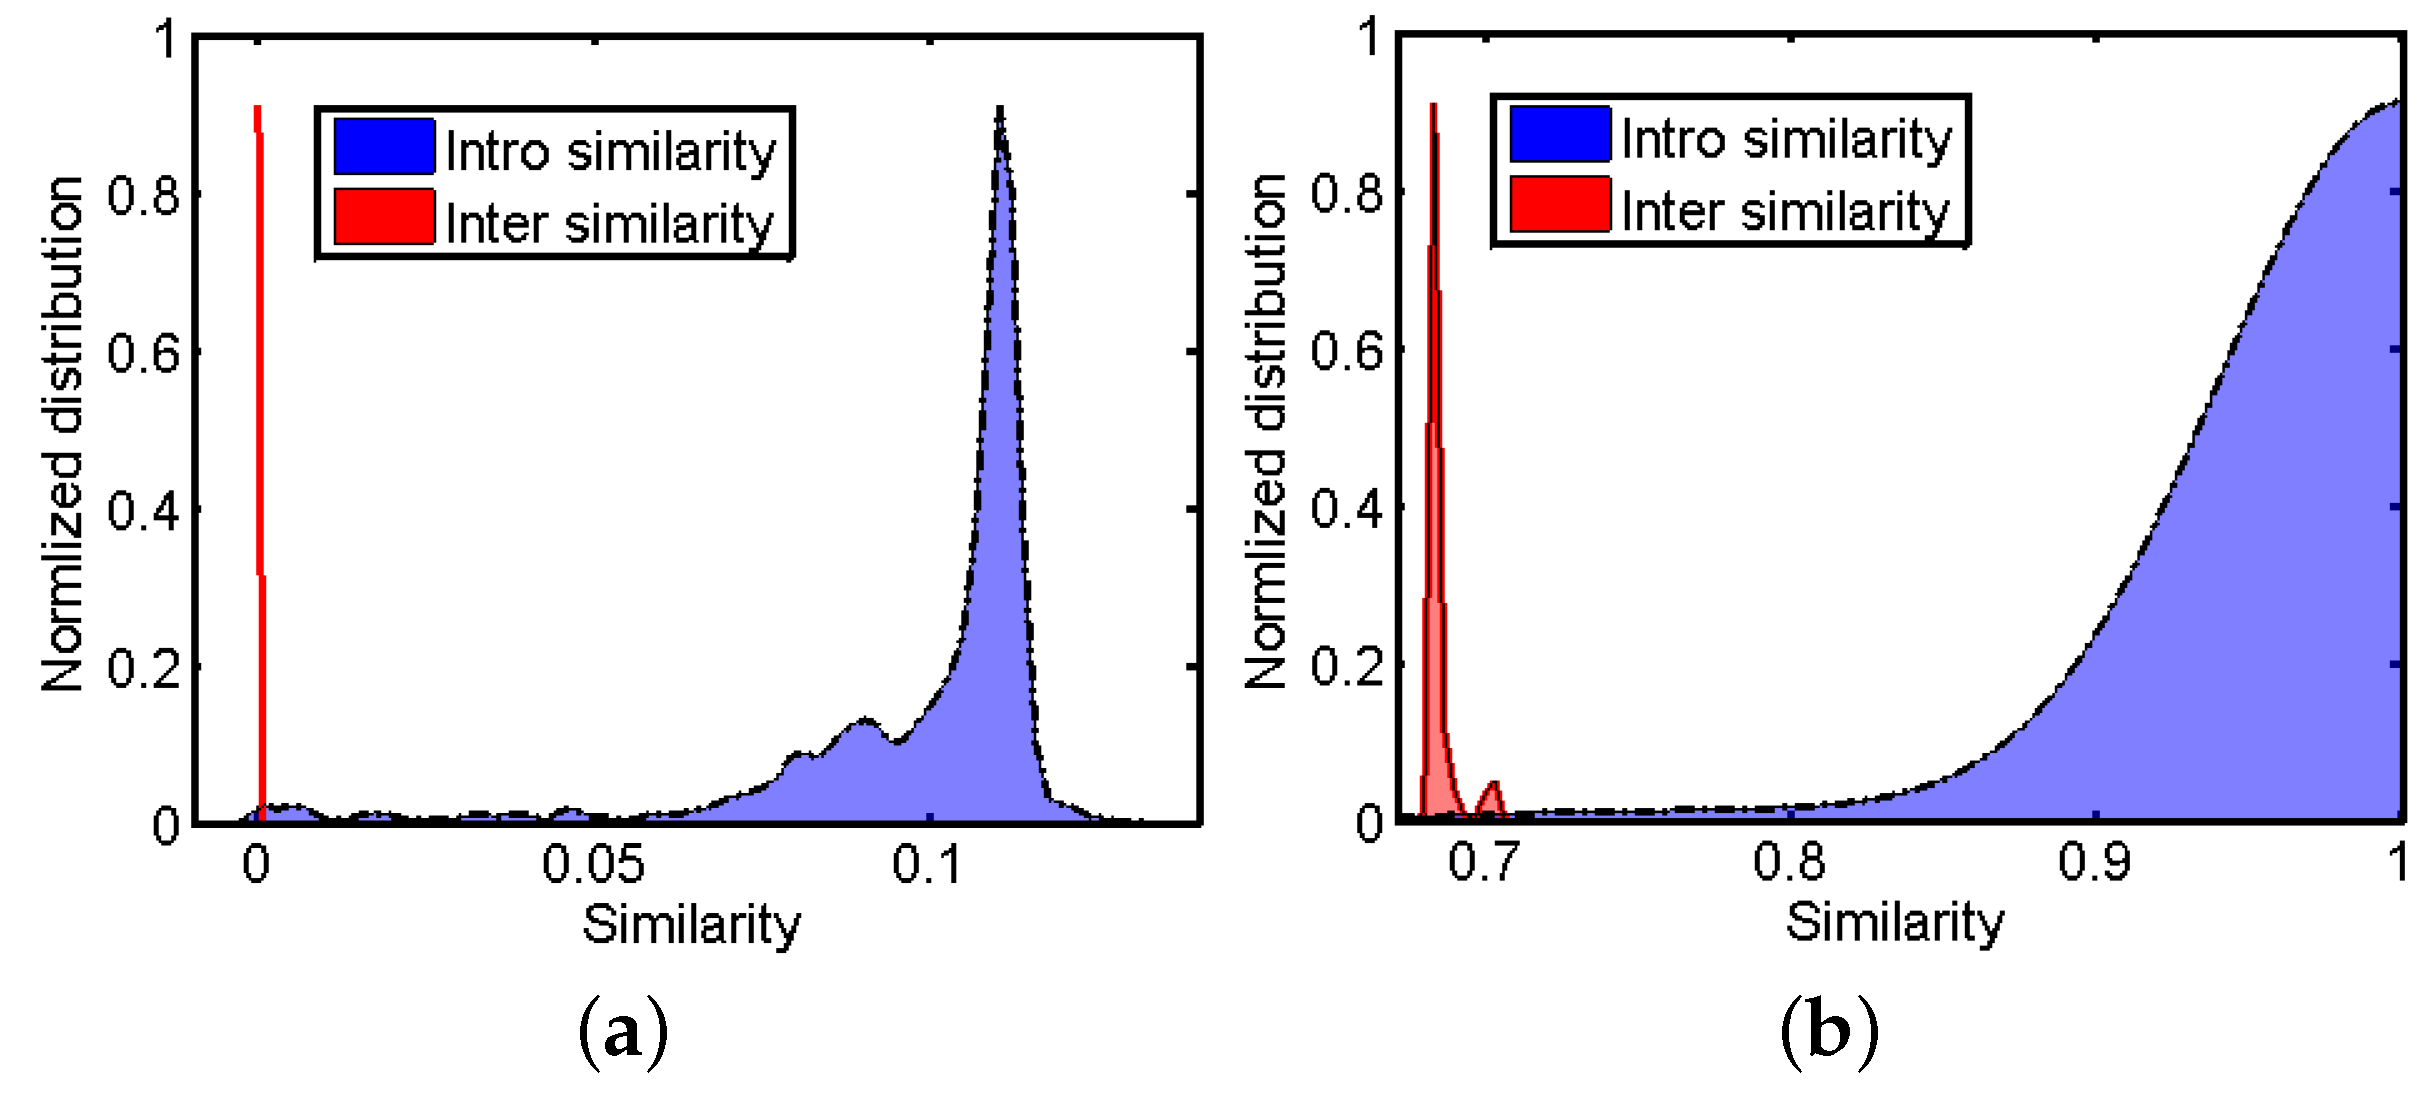
Figure 4 shows the probability distribution of the diffused similarities on Covers40 before and after applying the MP algorithm to them. It can be seen that the MP algorithm helps to enlarge the difference between inter tracks (unrelated tracks), which helps to reduce the false positive rate.
3. Experiments
In this section, we evaluate the performance of the proposed scheme. The cover song data sets used in the experiment and the experimental settings are described in Section 3.1 and Section 3.2, respectively. The experimental results, which include the necessity and importance of each step in the proposed scheme, the performance comparison with state-of-the-art CSI schemes, and the computational complexity comparison with other fusion-based CSI schemes, are discussed in Section 3.3.
3.1. Datasets
To evaluate the performance of the proposed model, we used three different cover song datasets (see Table 2) in the experiments.
Covers80, denoted as DB160 in this paper, is provided by Ellis from LabROSA. It contains 80 cover sets with 2 tracks in each set. Most of the tracks in this database have significant differences in rhythm.
Covers40, denoted as DB400 here, is composed of 400 tracks and 40 cover sets collected by us. There are 9 cover versions, which include both popular songs and classical music, for each original track. A complete list of this collection can be obtained by contacting us by email.
SHS, part of Second Hand Song cover song dataset, which consists of 12,730 tracks. There are 4235 original tracks and 8495 covers in this collection. The average number of covers in each cover set is 3.01, ranging from 2 to 42. This collection spans a variety of genres, including pop, rock, electronic, jazz, blues, and classical music. As shown in Table 2, we split it into four subsets sequentially without overlapping, denoted as DB3172, DB3183, DB3187, and DB3188, respectively.
3.2. Experiment Settings
To reduce the computation time and the memory requirements, the track was converted into a mono, 22.5 kHz, and 16 bits per sample version. Then the pre-processed signal was segmented into frames of 464 ms by Hamming window without overlapping. For each frame, the HPCP and MLD descriptors were extracted. Qmax and Dmax were adopted to measure the similarity between HPCP or MLD descriptors. As for the evaluation measures, the mean of average precision (MAP) [4], the mean averaged reciprocal rank (MaRR) [20], and the total number of covers identified in TOP 10 (TOP-10) were adopted to evaluate the performance of the CSI schemes. The larger the value of MAP, MaRR, or TOP-10, the better the performance achieved.
3.3. Experimental Results
First, we prove the necessity and importance of each step included in the proposed model by comparing the identification accuracy obtained in each step. Second, we compare the performance of the proposed model with those of state-of-the-art CSI schemes, in terms of MAP, MaRR, and TOP-10, on all three datasets. Finally, we compare the computational complexity of the proposed model with those of other similarity-fusion based CSI schemes.
3.3.1. Necessity and Importance of Each Step Included in the Proposed Model
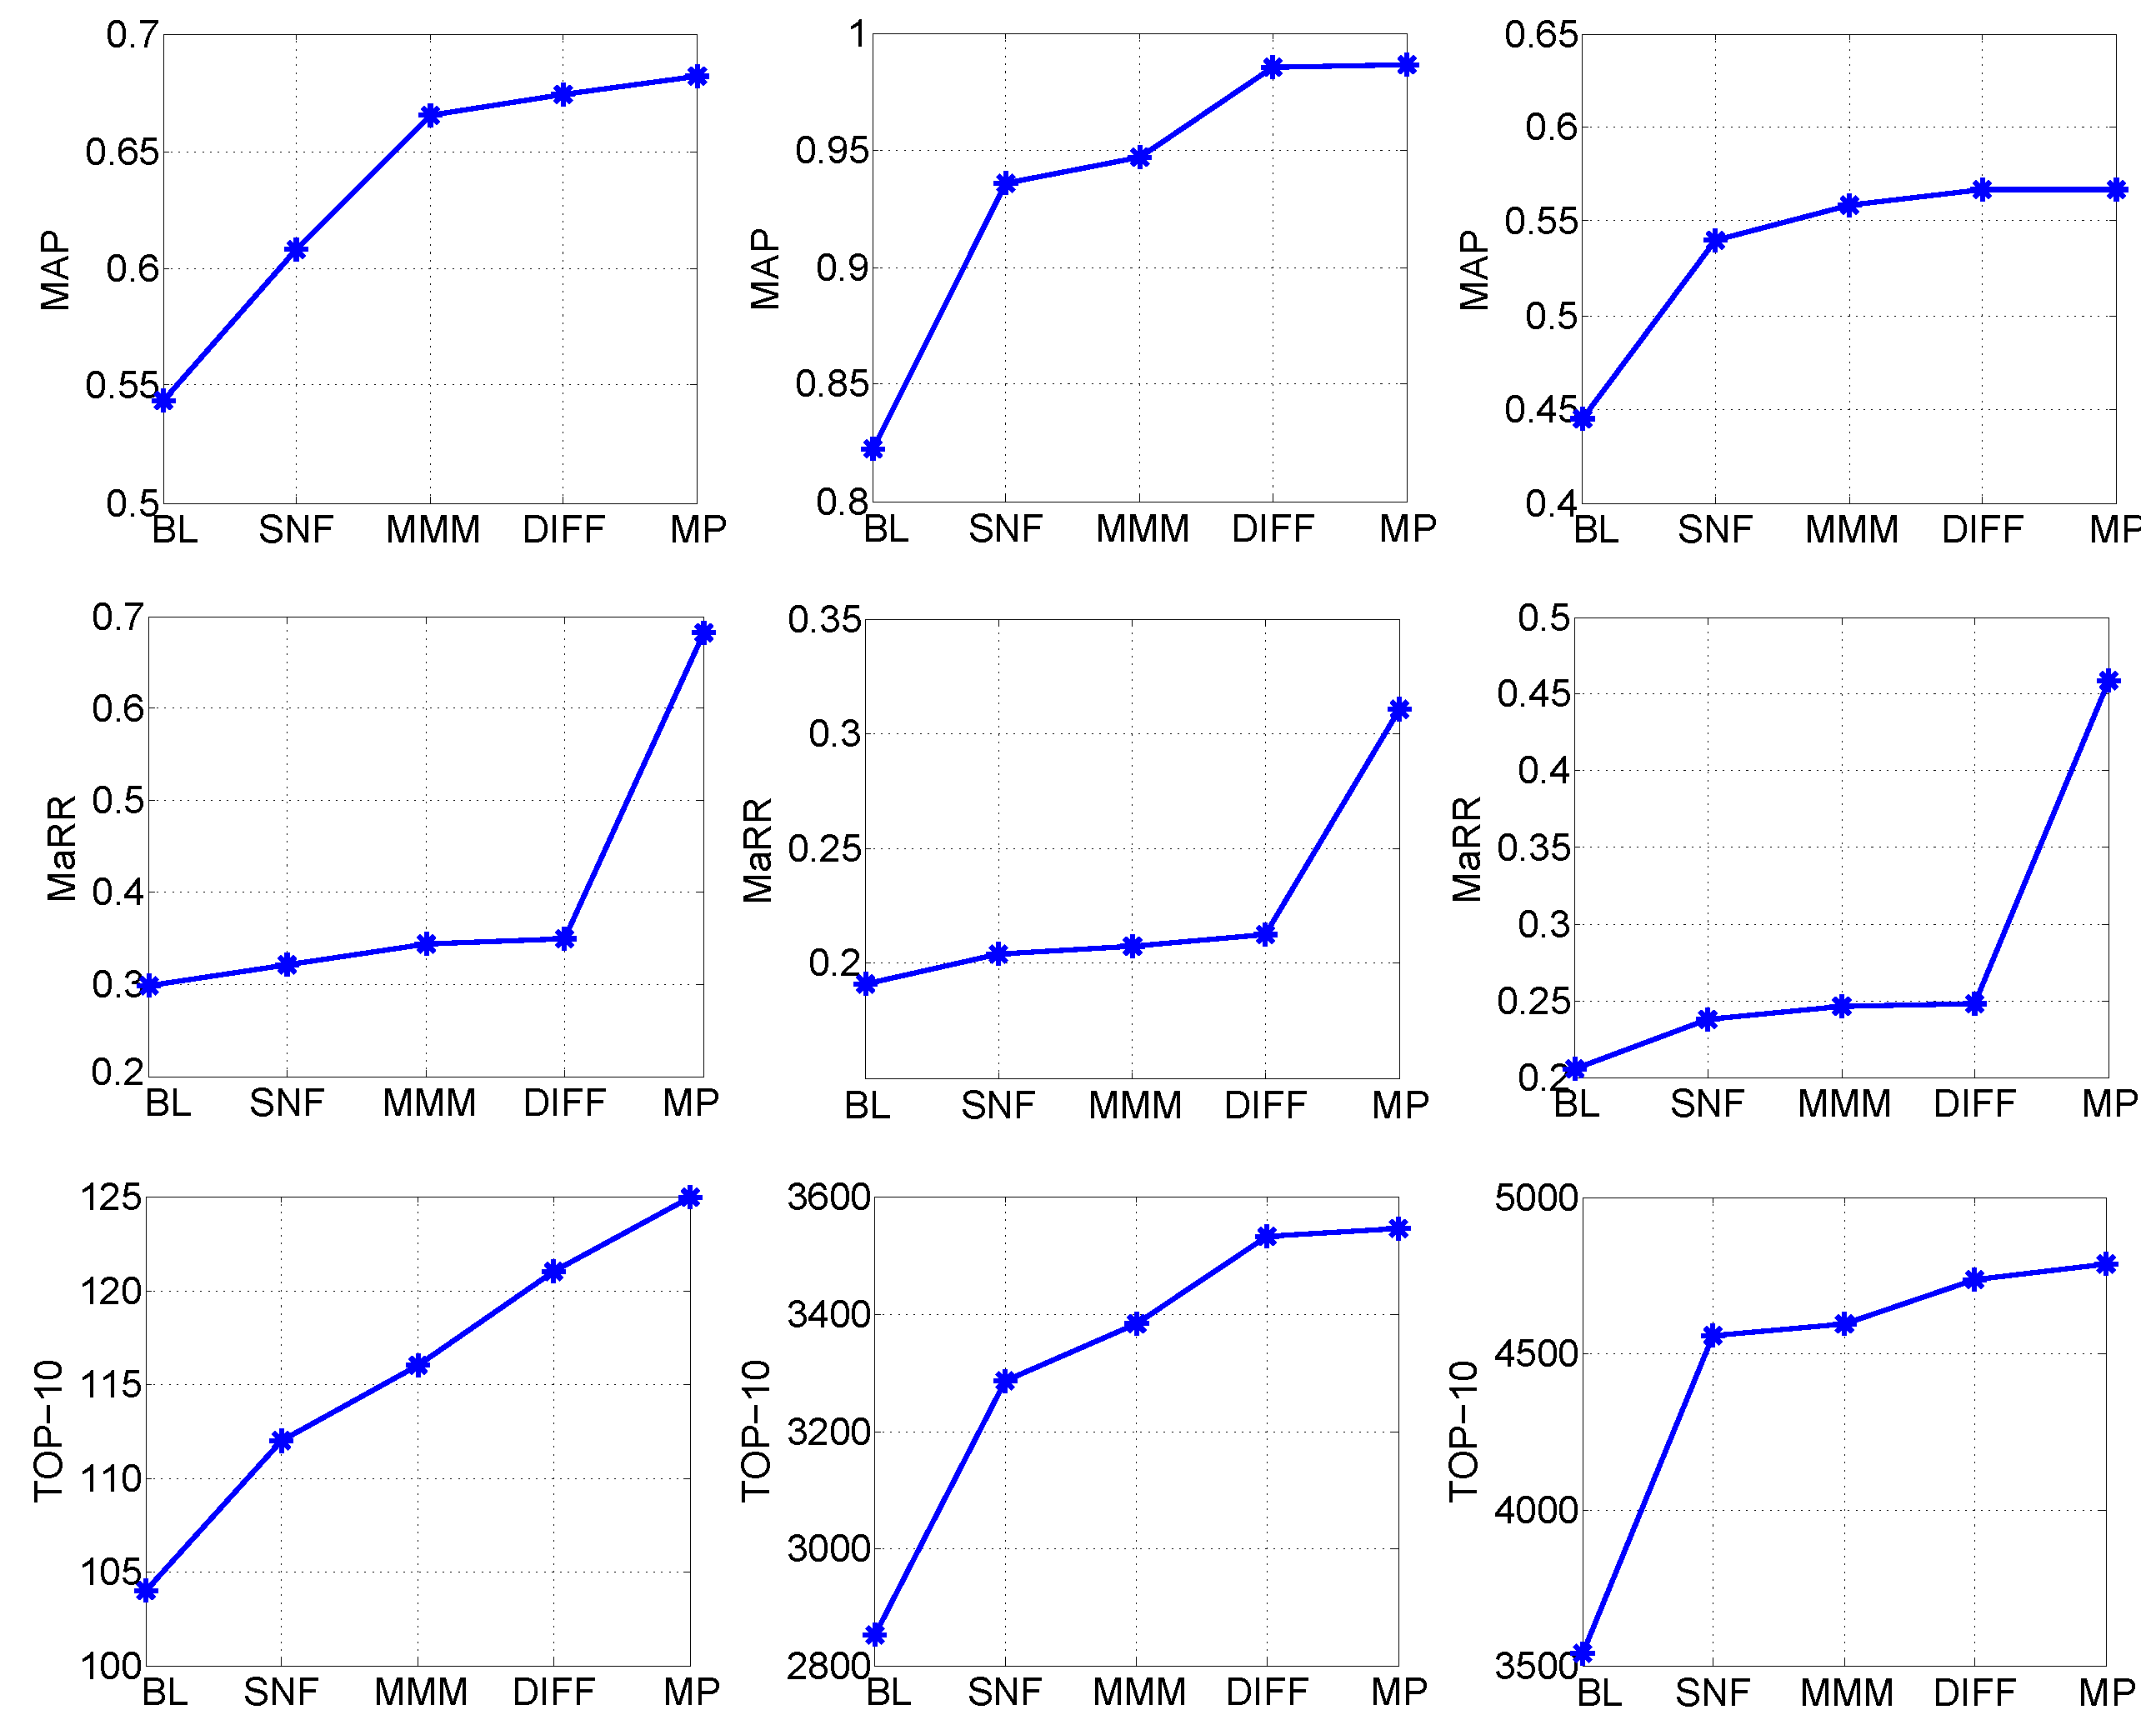
To verify the necessity and validity of each step in the proposed model (see Figure 1), the identification accuracy in terms of MAP, MaRR, and TOP-10 achieved in each step are compared in Figure 5, where baseline (BL) is the fusion object (HPCP-Qmax, HPCP-Dmax, MLD-Qmax, MLD-Dmax) that achieved the best performance, and SNF denotes the first-level fused similarity for the HPCP descriptor. In Figure 5, only the results on DB3172 are included. Similar results could be obtained on the other three SHS subsets.
The experimental results shown in Figure 5 demonstrate that: (i) Each step in the proposed model helped to enhance the identification accuracy. (ii) SNF-based first-level fusion could enhance the MAP and TOP-10 performances to a large extend. (iii) MMM-based second-level fusion helped to improve the MAP and TOP-10 further. (iv) Diffusion could enhance the performance of the proposed model in terms of TOP-10 greatly, which may benefit from making use of the track manifold of the fused similarity graph. (v) The MP step helped to enhance the MaRR performance of the proposed model greatly, indicating a lower false positive rate.
3.3.2. Comparison with State-Of-The-Art CSI Schemes
To verify the efficiency of the proposed scheme in comparison with other CSI schemes that are based on single similarity function or similarity fusion, the MAP, MaRR, and TOP-10 achieved by each scheme are listed in Table 3. The CSI schemes included in this experiment were the proposed model (denoted as TLSFP—two-level similarity fusion and post-processing); HPCP-Qmax [4]; HPCP-Dmax [5]; a particle swarm optimization (PSO)-based scheme [21]; a high space (HS) mapping-based scheme [11]; the scheme proposed in [8] (denoted as SNF-2); the scheme proposed in [12] (denoted as SNF-3); SNF-4, which fuses the similarities based on HPCP-Qmax, HPCP-Dmax, MLD-Qmax, and MLD-Dmax with SNF; and a two-layer fusion based scheme [7]. For the HS and PSO schemes, the same similarity types as those in SNF-4 were adopted.
The experimental results shown in Table 3 demonstrate that the proposed TLSFP scheme outperformed the other CSI schemes (based on single similarity function or similarity fusion) included in terms of MAP, MaRR, and TOP-10, on all six datasets except for the MAP value on DB3187. The gap was 0.0069, which is very small and can be neglected.
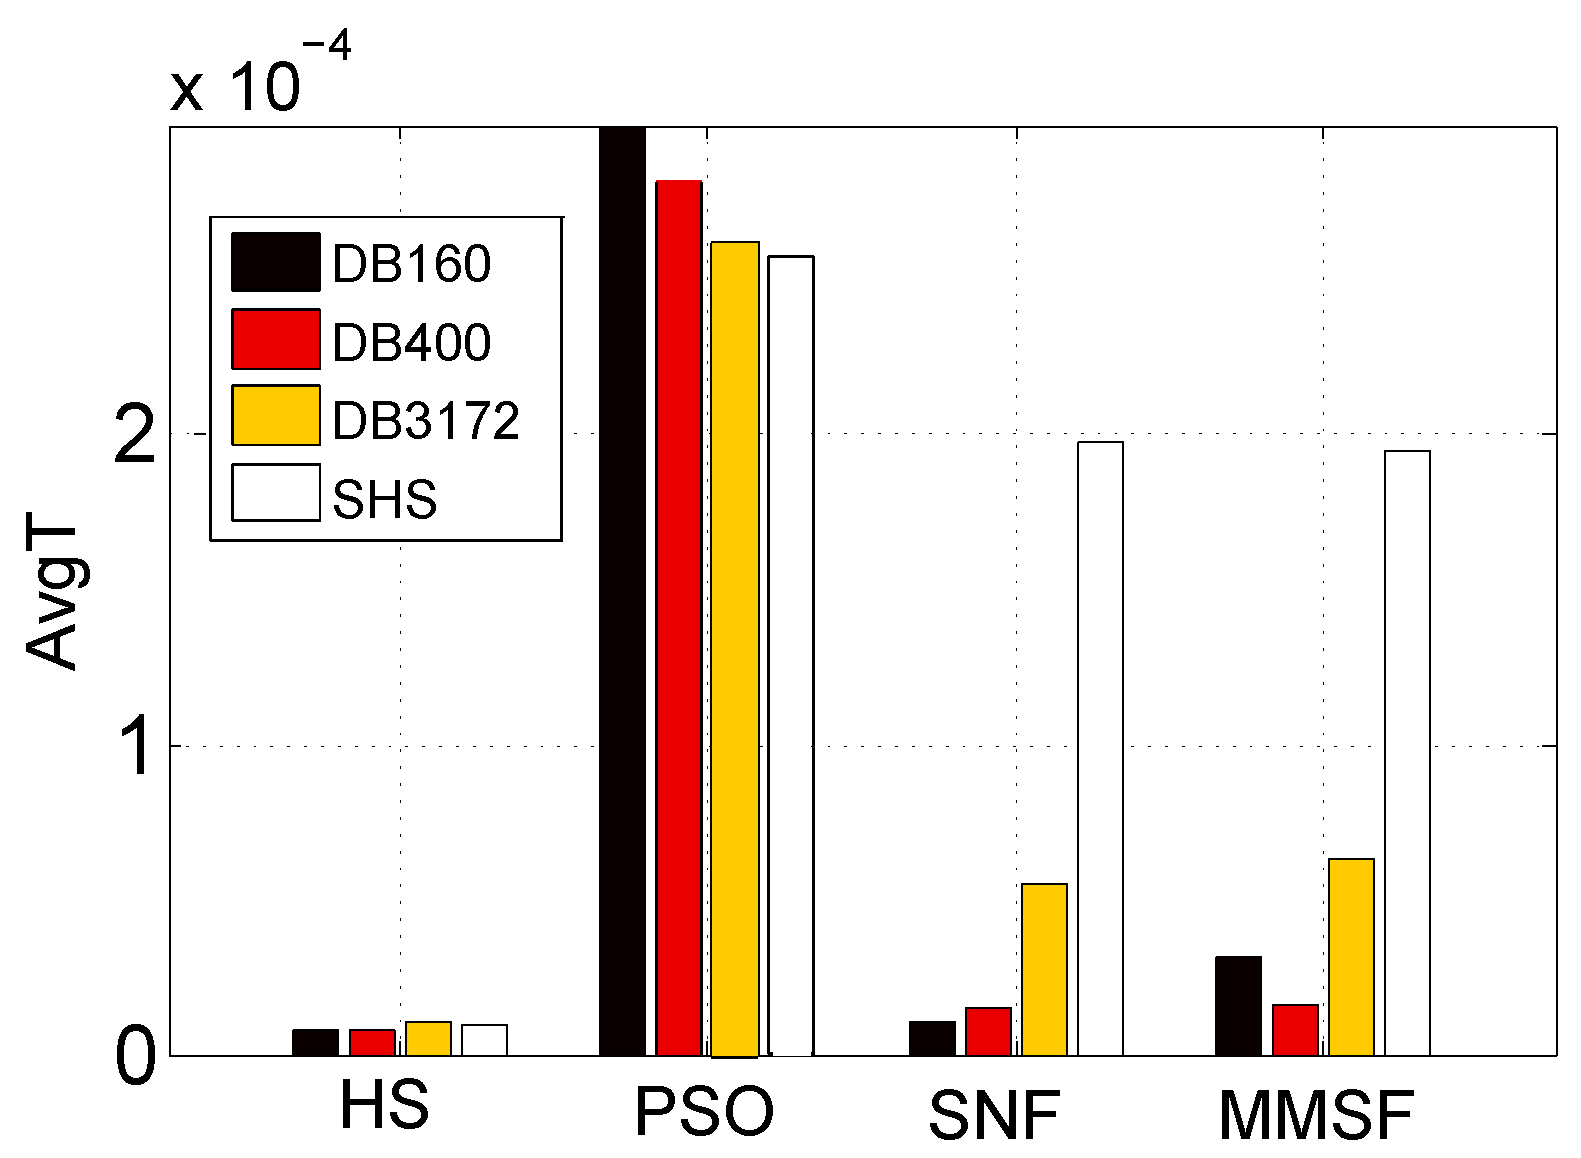
3.3.3. Computational Complexity Comparison
In this experiment, the computational complexity of the proposed model in terms of average computing time is compared with those obtained by PSO-, HS-, and SNF-4-based fusion schemes.
All the experiments were carried out on a desktop machine with an Intel(R) Core(TM) i7 CPU (4.0 GHz) and 32 GB memory. Given the total fusion computing time T, we obtained the average computing time with , where N is the total number of tracks in the dataset.
The experimental results shown in Figure 6 demonstrate that: (i) The PSO scheme cost much more time than the other three. (ii) HS achieved the lowest computational complexity in four schemes. However, its performance may be unsatisfactory (see Table 3). (iii) The proposed TLSFP scheme needed a slightly longer time than SNF-4 when the dataset was small. However, with the increase of the dataset size, the difference became smaller and smaller. When the SHS was considered, the computational complexity of TLSFP was lower than that of SNF-4. So, the proposed model is very fit for large music collections.
4. Conclusions and Future Work
In this paper, we propose a music information retrieval scheme based on two-level similarity fusion and post-processing. It adopts different strategies (SNF and MMM) to combine the merits of different similarity functions and those of different descriptors in two fusion levels. In addition, it introduces diffusion and MP techniques to refine the fused similarity scores to enhance cover version identification accuracy. Extensive experiments on three cover song datasets (including Covers80 and SHS) manifested the effectiveness and efficiency of the proposed model in comparison with state-of-the-art CSI schemes.
TLSFP can be modified and applied to other important tasks in different fields, such as image classification, visual object tracking, cancer subtypes identification, and drug taxonomy, etc. We leave all these problems for future work.
Author Contributions
M.L. conceived of the study, participated in the design of the work, data collection, data analysis, interpretation, and coordination, and drafted the manuscript. N.C. helped to revise the manuscript.
Funding
This work was supported by the National Natural Science Foundation of China [grant number 61771196].
Conflicts of Interest
The authors declare that they have no competing interests.
Abbreviations
The following abbreviations are used in this manuscript:
| BL | BaseLine |
| CSI | Cover Song Identification |
| HPCP | Harmonic Pitch Class Profile |
| HS | High Space |
| K-NN | K Nearest Neighbor |
| LCDP | Locally Constrained Diffusion Process |
| MAP | Mean of Average Precision |
| MaRR | Mean Averaged Reciprocal Rank |
| MMM | Mixture Markov Model |
| MLD | Melody |
| MIR | Music Information Retrieval |
| MIREX | Music Information Retrieval Evaluation eXchange |
| MP | Mutual Proximity |
| PSO | Particle Swarm Optimization |
| SHS | Second Hand Songs |
| SNF | Similarity Network Fusion |
| TLSFP | Two-Level Similarity Fusion and Post-Processing |
| TOP-10 | Total Number of Covers Identified in TOP 10 |
References
- Berenzweig, A.; Logan, B.; Ellis, D.P.; Whitman, B. A large-scale evaluation of acoustic and subjective music-similarity measures. Comput. Music J. 2004, 28, 63–76. [Google Scholar] [CrossRef]
- Dannenberg, R.B.; Goto, M. Music structure analysis from acoustic signals. In Handbook of Signal Processing in Acoustics; Springer: New York, NY, USA, 2008; pp. 305–331. [Google Scholar]
- Ellis, D.P. Identifying ‘cover songs’ with beat-synchronous chroma features. MIREX 2006, 1–4. [Google Scholar] [CrossRef]
- Serra, J.; Serra, X.; Andrzejak, R.G. Cross recurrence quantification for cover song identification. New J. Phys. 2009, 11, 093017. [Google Scholar] [CrossRef] [Green Version]
- Yang, F.; Chen, N. Cover Song Identification Based on Cross Recurrence Plot and Local Alignment. J. East China Univ. Sci. Technol. 2016, 42, 247–253. [Google Scholar]
- Salamon, J.; Serrà, J.; Gómez, E. Melody, bass line, and harmony representations for music version identification. In Proceedings of the 21st International Conference Companion on World Wide Web, Lyon, France, 16–20 April 2012; pp. 887–894. [Google Scholar]
- Chen, N.; Li, M.; Xiao, H. Two-layer similarity fusion model for cover song identification. EURASIP J. Audio Speech Music Process. 2017, 2017, 12. [Google Scholar] [CrossRef]
- Chen, N.; Li, W.; Xiao, H. Fusing similarity functions for cover song identification. Multimed. Tools Appl. 2018, 77, 2629–2652. [Google Scholar] [CrossRef]
- Foucard, R.; Durrieu, J.L.; Lagrange, M.; Richard, G. Multimodal similarity between musical streams for cover version detection. In Proceedings of the 2010 IEEE International Conference on Acoustics Speech and Signal Processing (ICASSP), Dallas, TX, USA, 14–19 March 2010; pp. 5514–5517. [Google Scholar]
- Ravuri, S.; Ellis, D.P. Cover song detection: From high scores to general classification. In Proceedings of the 2010 IEEE International Conference on Acoustics Speech and Signal Processing (ICASSP), Dallas, TX, USA, 14–19 March 2010; pp. 65–68. [Google Scholar]
- Degani, A.; Dalai, M.; Leonardi, R.; Migliorati, P. A heuristic for distance fusion in cover song identification. In Proceedings of the 14th International Workshop on Image Analysis for Multimedia Interactive Services (WIAMIS), Paris, France, 3–5 July 2013; pp. 1–4. [Google Scholar]
- Chen, N.; Xiao, H.D. Similarity fusion scheme for cover song identification. Electron. Lett. 2016, 52, 1173–1175. [Google Scholar] [CrossRef]
- Wang, B.; Mezlini, A.M.; Demir, F.; Fiume, M.; Tu, Z.; Brudno, M.; Haibe-Kains, B.; Goldenberg, A. Similarity network fusion for aggregating data types on a genomic scale. Nat. Methods 2014, 11, 333–337. [Google Scholar] [CrossRef] [PubMed]
- Tralie, C.J. Early MFCC And HPCP Fusion for Robust Cover Song Identification. arXiv, 2017; arXiv:1707.04680. [Google Scholar]
- Schnitzer, D.; Flexer, A.; Schedl, M.; Widmer, G. Local and global scaling reduce hubs in space. J. Mach. Learn. Res. 2012, 13, 2871–2902. [Google Scholar]
- Yang, X.; Koknar-Tezel, S.; Latecki, L.J. Locally constrained diffusion process on locally densified distance spaces with applications to shape retrieval. In Proceedings of the IEEE Conference on Computer Vision and Pattern Recognition (CVPR), Miami, FL, USA, 20–25 June 2009; pp. 357–364. [Google Scholar]
- Zhou, D.; Burges, C.J. Spectral clustering and transductive learning with multiple views. In Proceedings of the 24th International Conference on Machine Learning, Corvalis, OR, USA, 20–24 June 2007; pp. 1159–1166. [Google Scholar]
- Gómez, E. Tonal Description of Music Audio Signals. Ph.D. Thesis, Universitat Pompeu Fabra, Barcelona, Spain, 2006. [Google Scholar]
- Tsai, W.H.; Yu, H.M.; Wang, H.M. Using the Similarity of Main Melodies to Identify Cover Versions of Popular Songs for Music Document Retrieval. J. Inf. Sci. Eng. 2008, 24, 1669–1687. [Google Scholar]
- Salamon, J. Melody Extraction from Polyphonic Music Signals. Ph.D. Thesis, Universitat Pompeu Fabra, Barcelona, Spain, 2013. [Google Scholar]
- Shi, Y. Particle swarm optimization: Developments, applications and resources. In Proceedings of the 2001 Congress on evolutionary computation, Seoul, Korea, 27–30 May 2001; Volume 1, pp. 81–86. [Google Scholar]
Figure 1.
Block diagram and illustrative example of the proposed model, taking part results on Covers40 as an example. (a) Extract the harmonic pitch class profile (HPCP) descriptor and main melody (MLD) descriptor from each track in the music collection. (b) A track-by-track similarity graph is constructed based on each descriptor and corresponding similarity function. The similarity graphs based on the same descriptor and different similarity functions are fused with similarity network fusion (SNF). (c) The first-level fused similarity graphs for each descriptor are integrated with the mixture Markov model (MMM) technique to obtain a second-level fused similarity graph. (d) Post-processing. First, diffusion is performed on the second-level fused similarity graph to take advantage of the structure of the underlying track manifold contained within it to reduce noise and enhance retrieval accuracy, then mutual proximity (MP) is adopted to modify the diffused similarity to reduce the “hubness” phenomenon.

Figure 2.
Similarity matrices obtained by (a) MLD-Qmax, (b) MLD-Dmax, and (c) SNF-MLD-QD.

Figure 3.
Illustration of the effectiveness of the diffusion process in classification. Pentagrams represent two queries from different groups. Each element is assigned to one of the two queries according to its distances with the query samples: (a) without diffusion (b) with diffusion.
Figure 3.
Illustration of the effectiveness of the diffusion process in classification. Pentagrams represent two queries from different groups. Each element is assigned to one of the two queries according to its distances with the query samples: (a) without diffusion (b) with diffusion.

Figure 4.
Probability distribution of the diffused similarities on DB400 (a) before and (b) after applying MP to them.
Figure 4.
Probability distribution of the diffused similarities on DB400 (a) before and (b) after applying MP to them.

Figure 5.
Identification accuracy achieved in each step of the proposed model on (first column) DB160, (second column) DB400, and (last column) DB3172. BL: baseline; DIFF: diffusion processing; MAP: mean of average precision; MaRR: mean averaged reciprocal rank; TOP-10: total number of covers identified in TOP 10.

Figure 6.
The comparison of average computing time achieved by different similarity fusion schemes on four datasets.
Figure 6.
The comparison of average computing time achieved by different similarity fusion schemes on four datasets.


Table 1.
The tracks in the selected cover sets.
| Cover Sets | Title of the Tracks | Artists | Track ID |
|---|---|---|---|
| No. 1 | Wish You Were Here | Wyclef Jean | 1 |
| Pink Floyd | 2 | ||
| No. 2 | White Room | Sheryl Crow | 3 |
| Cream | 4 | ||
| No. 3 | Yesterday | En Vogue | 5 |
| Beatles | 6 |
Table 2.
Cover song datasets used.
| Dataset Name | Num. of Tracks | Num. of Cover Sets | Ave. Num. of Tracks in Each Cover Set |
|---|---|---|---|
| DB160 | 160 | 80 | 2 |
| DB400 | 400 | 40 | 10 |
| DB3172 | 3172 | 1119 | 2.83 |
| DB3183 | 3183 | 985 | 3.23 |
| DB3187 | 3187 | 1030 | 3.09 |
| DB3188 | 3188 | 1101 | 2.90 |
Table 3.
Identification accuracy comparison among different cover song identification (CSI) schemes. HS: high space; PSO: particle swarm optimization; TLSFP: two-level similarity fusion and post-processing.
Table 3.
Identification accuracy comparison among different cover song identification (CSI) schemes. HS: high space; PSO: particle swarm optimization; TLSFP: two-level similarity fusion and post-processing.
| Datasets | Algorithm | MAP | MaRR | TOP-10 |
|---|---|---|---|---|
| DB160 | HPCP-Qmax [4] | 0.5435 | 0.2831 | 98 |
| HPCP-Dmax [5] | 0.5709 | 0.2979 | 104 | |
| PSO (HPCP-Qmax) [21] | 0.5758 | 0.2993 | 101 | |
| HS [11] | 0.5868 | 0.3086 | 107 | |
| SNF-2 [8] | 0.6247 | 0.3269 | 114 | |
| SNF-3 [12] | 0.6413 | 0.3346 | 113 | |
| SNF-4 | 0.6479 | 0.3369 | 114 | |
| Two-layer-fusion [7] | 0.6680 | 0.6680 | 119 | |
| TLSFP | 0.6817 | 0.6817 | 125 | |
| DB400 | HPCP-Qmax [4] | 0.8227 | 0.1907 | 2852 |
| HPCP-Dmax [5] | 0.7945 | 0.1907 | 2717 | |
| PSO [21] | 0.7933 | 0.2445 | 2571 | |
| HS [11] | 0.7564 | 0.1883 | 2651 | |
| SNF-2 [8] | 0.9359 | 0.2040 | 3286 | |
| SNF-3 [12] | 0.9611 | 0.2080 | 3408 | |
| SNF-4 | 0.9848 | 0.2118 | 3529 | |
| Two-layer-fusion [7] | 0.9754 | 0.3094 | 3482 | |
| TLSFP | 0.9866 | 0.3107 | 3545 | |
| DB3172 | HPCP-Qmax [4] | 0.4448 | 0.2831 | 3538 |
| HPCP-Dmax [5] | 0.4412 | 0.2059 | 3501 | |
| PSO [21] | 0.4593 | 0.2101 | 3634 | |
| HS [11] | 0.3536 | 0.1691 | 2832 | |
| SNF-2 [8] | 0.5399 | 0.2379 | 4556 | |
| SNF-3 [12] | 0.5004 | 0.2238 | 3962 | |
| SNF-4 | 0.5602 | 0.2468 | 4602 | |
| Two-layer-fusion [7] | 0.5622 | 0.4579 | 4734 | |
| TLSFP | 0.5673 | 0.4590 | 4787 | |
| DB3183 | HPCP-Qmax [4] | 0.4296 | 0.1877 | 4647 |
| HPCP-Dmax [5] | 0.4321 | 0.1921 | 4567 | |
| PSO [21] | 0.4442 | 0.1938 | 4768 | |
| HS [11] | 0.2947 | 0.1366 | 3103 | |
| SNF-2 [8] | 0.5512 | 0.2285 | 6015 | |
| SNF-3 [12] | 0.4893 | 0.2064 | 5177 | |
| SNF-4 | 0.5508 | 0.2285 | 6015 | |
| Two-layer-fusion [7] | 0.5546 | 0.4147 | 6309 | |
| TLSFP | 0.5693 | 0.4221 | 6461 | |
| DB3187 | HPCP-Qmax [4] | 0.4270 | 0.1909 | 4025 |
| HPCP-Dmax [5] | 0.4189 | 0.1918 | 3862 | |
| PSO [21] | 0.4398 | 0.1967 | 4128 | |
| HS [11] | 0.3127 | 0.1472 | 2981 | |
| SNF-2 [8] | 0.5325 | 0.2270 | 5198 | |
| SNF-3 [12] | 0.4865 | 0.2119 | 4487 | |
| SNF-4 | 0.5513 | 0.2339 | 5410 | |
| Two-layer-fusion [7] | 0.5358 | 0.4168 | 5421 | |
| TLSFP | 0.5444 | 0.4207 | 5502 | |
| DB3188 | HPCP-Qmax [4] | 0.4485 | 0.2031 | 3835 |
| HPCP-Dmax [5] | 0.4502 | 0.2084 | 3815 | |
| PSO [21] | 0.4609 | 0.2098 | 3938 | |
| HS [11] | 0.3630 | 0.1711 | 3173 | |
| SNF-2 [8] | 0.5391 | 0.2361 | 4792 | |
| SNF-3 [12] | 0.4951 | 0.2199 | 4193 | |
| SNF-4 | 0.5429 | 0.2383 | 4755 | |
| Two-layer-fusion [7] | 0.5484 | 0.4456 | 4946 | |
| TLSFP | 0.5571 | 0.4504 | 5029 |
© 2018 by the authors. Licensee MDPI, Basel, Switzerland. This article is an open access article distributed under the terms and conditions of the Creative Commons Attribution (CC BY) license (http://creativecommons.org/licenses/by/4.0/).
Share and Cite
MDPI and ACS Style
Li, M.; Chen, N. A Robust Cover Song Identification System with Two-Level Similarity Fusion and Post-Processing. Appl. Sci. 2018, 8, 1383. https://doi.org/10.3390/app8081383
AMA Style
Li M, Chen N. A Robust Cover Song Identification System with Two-Level Similarity Fusion and Post-Processing. Applied Sciences. 2018; 8(8):1383. https://doi.org/10.3390/app8081383
Chicago/Turabian StyleLi, Mingyu, and Ning Chen. 2018. "A Robust Cover Song Identification System with Two-Level Similarity Fusion and Post-Processing" Applied Sciences 8, no. 8: 1383. https://doi.org/10.3390/app8081383
Note that from the first issue of 2016, this journal uses article numbers instead of page numbers. See further details here.