Emotion, Respiration, and Heart Rate Variability: A Mathematical Model and Simulation Analyses


1
Strategic Research Division, Toyota Central R&D Labs., Inc., Nagakute, Aichi 480-1192, Japan
2
Strategic Research Division, Toyota Central R&D Labs., Inc., Bunkyo-ku, Tokyo 112-0004, Japan
*
Author to whom correspondence should be addressed.
Appl. Sci. 2019, 9(23), 5008; https://doi.org/10.3390/app9235008
Submission received: 18 October 2019
/
Revised: 13 November 2019
/
Accepted: 15 November 2019
/
Published: 20 November 2019
(This article belongs to the Special Issue Dynamic Models of Biology and Medicine, Volume II)
Abstract
:Although the generation mechanism of the low-frequency (LF) component of heart rate variability (HRV) is controversial, HRV is a potential candidate in designing objective measurement methodologies for emotions. These methodologies could be valuable for several biosignal applications. Here, we have conducted a simulation analysis using a novel mathematical model that integrates emotion, respiration, the nervous system, and the cardiovascular system. Our model has well reproduced experimental results, specifically concerning HRV with respiratory sinus arrhythmia and LF, the relation between HRV total power and the respiration frequency, and the homeostatic maintenance by the baroreflex. Our model indicates the following possibilities: (i) The delay in the heart rate control process of the parasympathetic activity works as a low-pass filter and the HRV total power decreases with a higher respiration frequency; (ii) the LF component of HRV and the Mayer wave are generated as transient responses of the baroreflex feedback control to perturbations induced by an emotional stimulus; and (iii) concentration on breathing to reduce the respiration frequency can reduce LF/HF and the reduction can be fed back to the emotional status.
1. Introduction
Despite the increasingly recognized importance of emotions in human activity, objective measurement methodologies of emotions are yet to be established. Psychological evaluations measure emotions through self-report questionnaires such as the state-trait anxiety inventory (STAI), the self-rating depression scale (SDS), and the self-assessment manikin (SAM) [1,2,3]. Alternatively, physiological evaluations measure the autonomous reactions of the body such as changes in heart rate (HR) and skin conductance [1,2,3,4,5,6,7]. However, a large inter-individual difference in the relationship between the HR and the intensity of perceived emotions measured using SAM has been verified [2], and no correlation between the HR and the intensity of a perceived emotion was found when using either STAI or SDS [1,3]. These observations question the reliability of the use of HR to evaluate emotion. Besides HR, the ratio of low-frequency (LF, 0.05–0.15 Hz) to high-frequency (HF, 0.15–1.0 Hz) components of HR variability (HRV) is often used as the measure of autonomous reaction corresponding to emotions [3,8,9,10,11], as this ratio (LF/HF) has been related to the activity balance between the sympathetic and parasympathetic nervous systems [12,13]. However, this relation has also been questioned [14]. Some experiments [3,15] have proven that LF/HF increases with a random number generation task or a mental task, but this change is less significant than the change in mean HR.
Besides the objective measurement methodologies of emotions, the generation mechanism of the LF component of HRV is also controversial [16,17]. One possible and dominant mechanism is the baroreflex feedback (loop) theory. When arterial blood pressure changes due to some perturbation, the central nervous system mediates this change by adjusting cardiac responses such as HR and vascular resistance, thereby normalizing arterial pressure. This process exhibits a delay that, according to the baroreflex feedback theory, leads to an oscillatory normalization of arterial pressure (i.e., Mayer waves) and an oscillatory normalization of HR (i.e., LF). On the other hand, some researchers have proposed the central oscillator theory, in which brain stem circuits oscillate at frequencies corresponding to LF, and the oscillation is reflected in both the HR and the arterial pressure. Montano et al. [18] found that the discharges of single neurons in the brain stem of cats oscillate at these frequencies. The oscillations remained after sinoaortic and vagal resection, which supports the central oscillator theory.
In this study, we aimed to examine both the reliability of LF/HF usage for emotion evaluation and the generation mechanism of the LF component of HRV. We considered a short-term alerting stimulus or long-term mental stress (e.g., anxiety) as a perturbation triggering the LF component. Mathematical models are useful in dealing with such problems because they allow us to predict the physiological behavior under conditions that are not easy to reproduce experimentally [16]. To explain the effects of emotion on HRV, we designed a novel mathematical model by expanding the model formulated by Ursino [19]. This model and the series of expanded models [20,21,22] include the activity of the sympathetic and parasympathetic nervous systems that changes the cardiac response, for example, the heart period, cardiac contractility, unstressed volume of some blood vessels, and resistance of other blood vessels, resulting in changes in the blood flow and pressure at each site. They also describe the process by which arterial pressure changes the sinus nerve activity via a baroreceptor, and the expanded model [22] successfully reproduced the LF component of HRV by inducing vasomotor noise. To avoid confusions caused by using a very complicated model, we selected the most basic model [19]. Based on the finding that the central nucleus of the amygdala (CeA) relates stress or anxiety to the cardiovascular system [23], we formulated the relationships in the autonomic nervous system and added the formulations on this model. Then, a detailed simulation analysis of emotion, respiration, the nervous system, and the cardiovascular system was conducted based on the novel mathematical model.
2. Methods
2.1. Mathematical Model
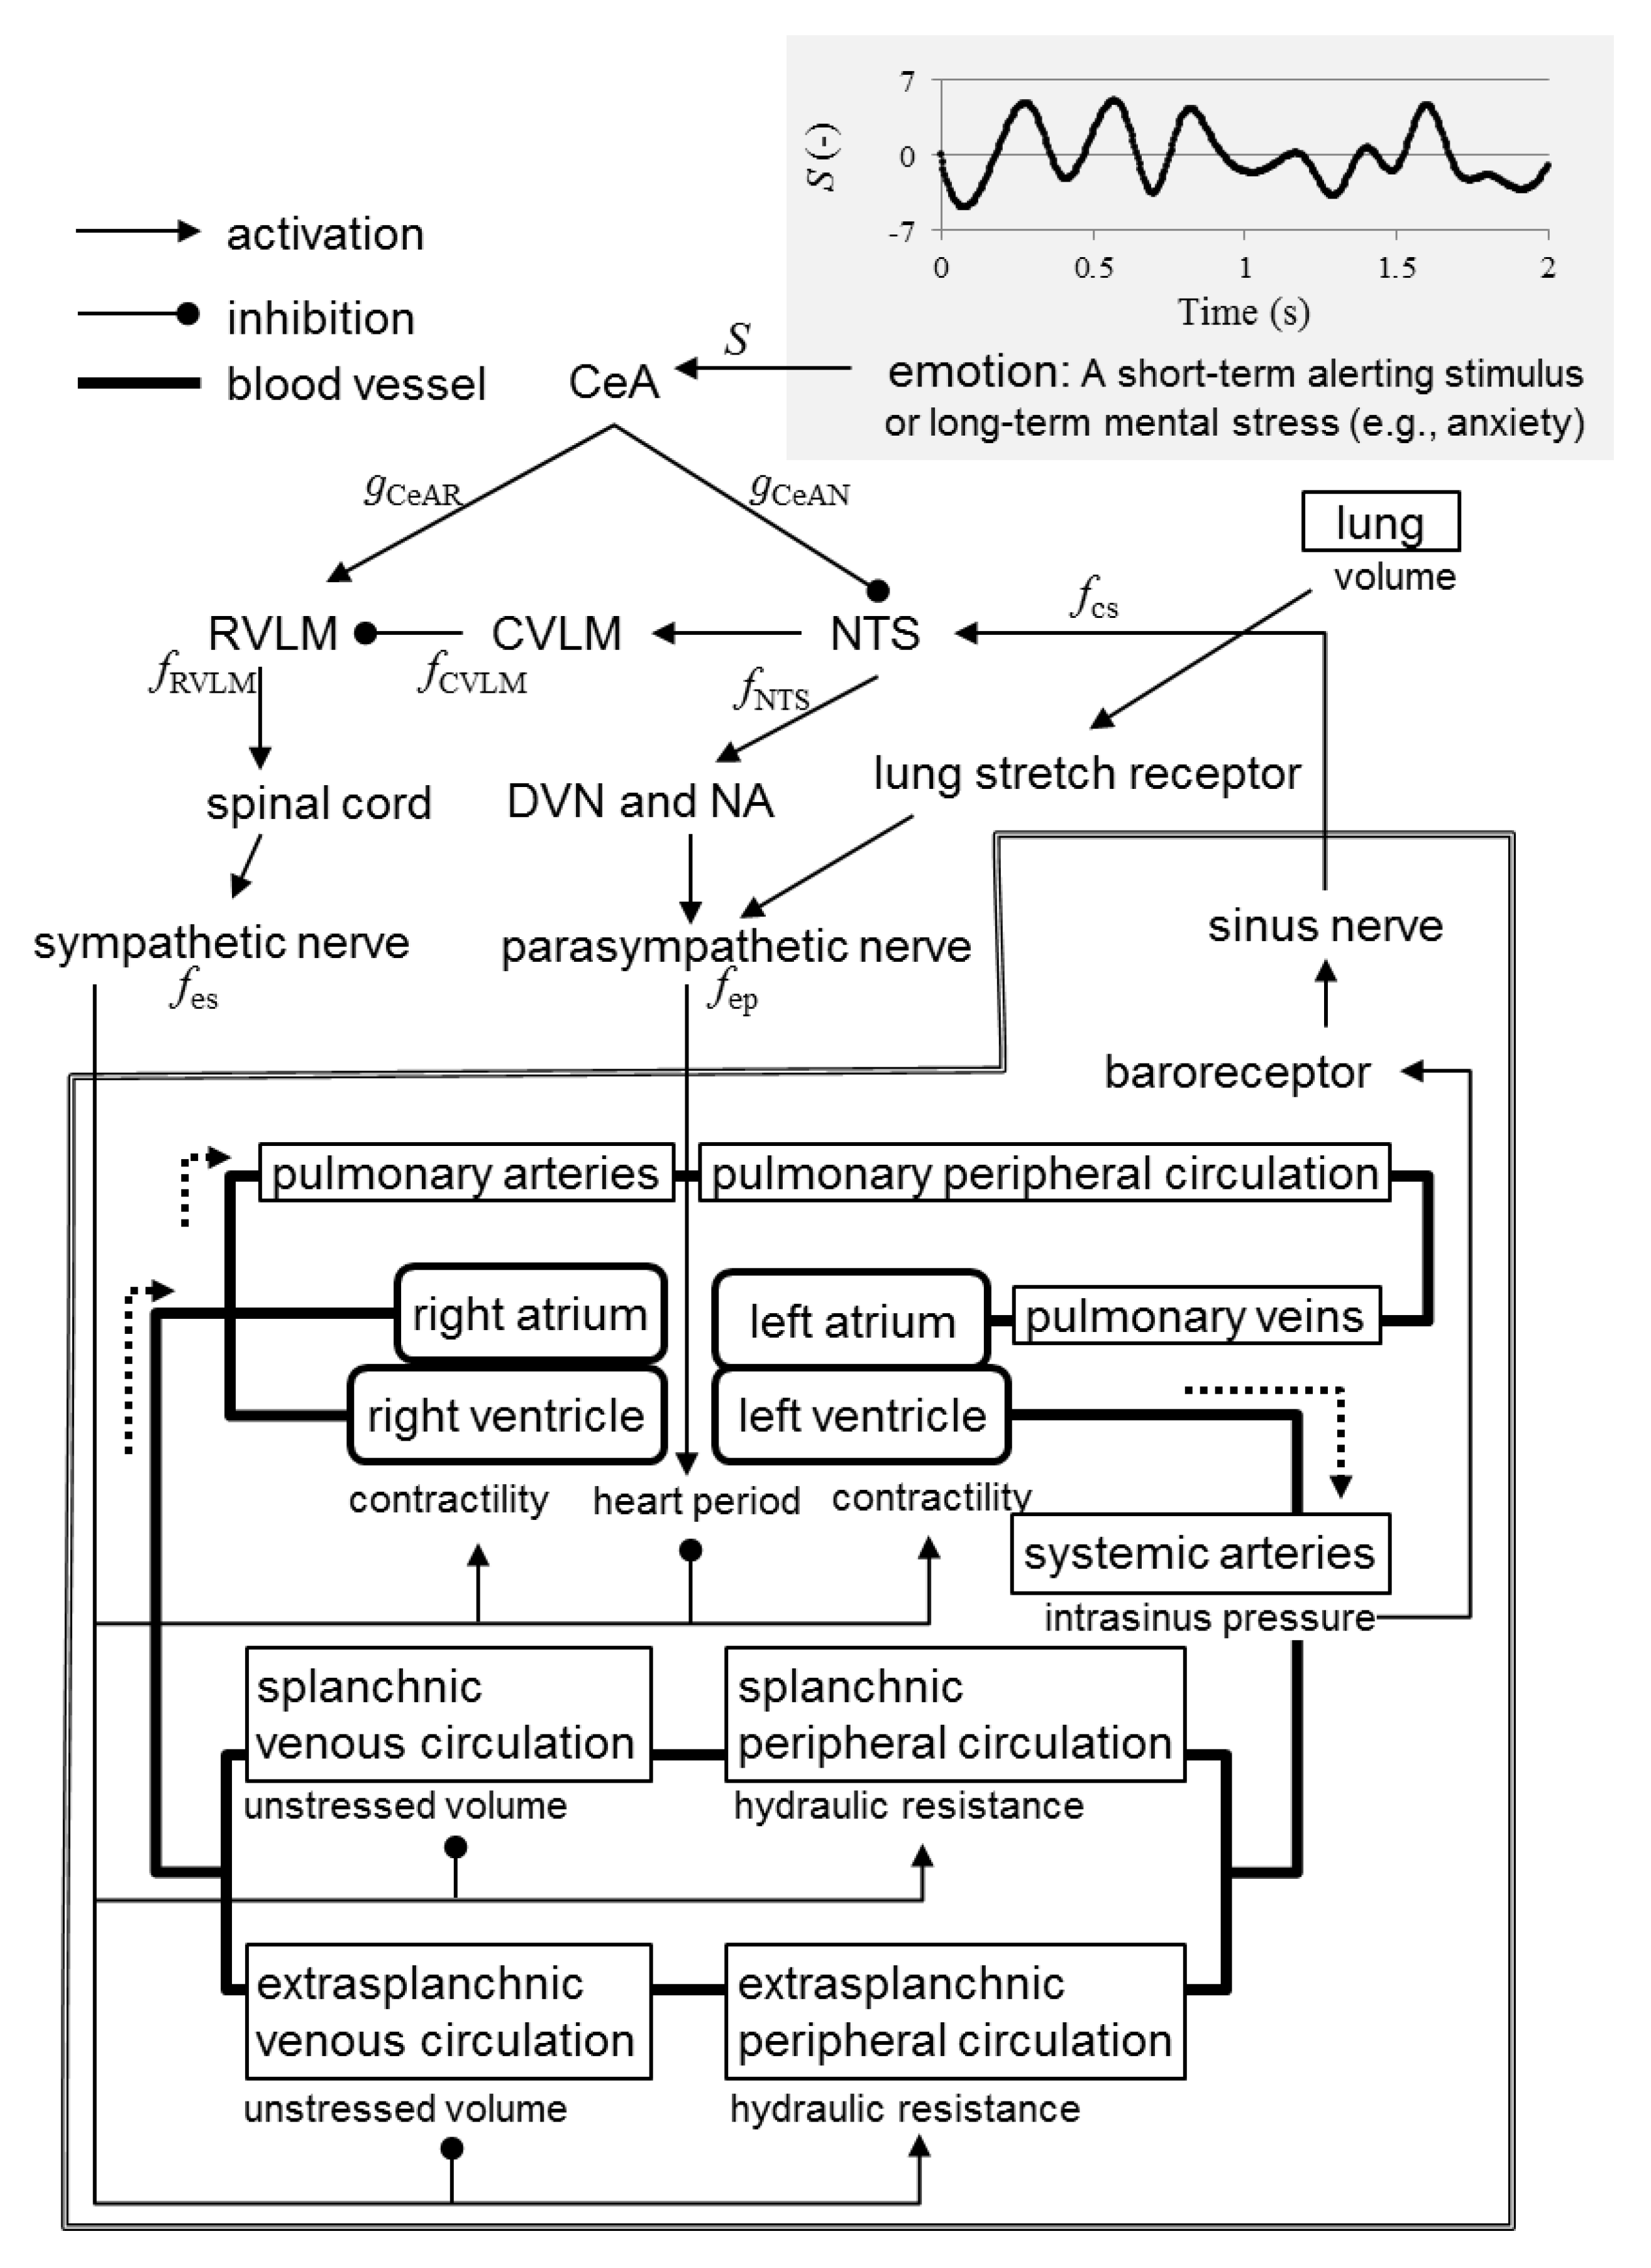
Figure 1 illustrates the proposed novel mathematical model that integrates emotion, the nervous system, the respiratory system, and the cardiovascular system. To expand a part of Ursino′s model [19], describing the enclosed area in Figure 1, we formulated relationships in the autonomic nervous system to satisfy the following conditions based on [19,23]:
- A short-term alerting stimulus or long-term mental stress (e.g., anxiety) triggers excitatory synaptic projections from the CeA to the rostral ventrolateral medulla (RVLM).
- A short-term alerting stimulus or long-term mental stress (e.g., anxiety) triggers inhibitory synaptic projections from the CeA to the nucleus tractus solitarii (NTS).
- The RVLM activates the sympathetic nervous system via the spinal cord.
- The NTS activates the parasympathetic nervous system via the dorsal vagal motor nucleus (DVN) and nucleus ambiguus.
- The NTS activates the caudal ventrolateral medulla (CVLM).
- The CVLM inhibits the RVLM.
- The sinus nerve activates the NTS.
- Increased spike frequency in the sinus nerve results in exponential decrease in the spike frequency in the sympathetic fibers.
- Increased spike frequency in the sinus nerve results in exponential increase in the spike frequency in the parasympathetic fibers with upper saturation.
To formulate the problem, we denote the intensity of emotion triggering the synaptic projection of the CeA as , and the intensities of the influence of the synaptic projection on the RVLM and on the NTS as and , respectively. The firing frequencies of the sinus nerve, sympathetic nerve, parasympathetic nerve, RVLM, CVLM, and NTS are denoted as , , , , , and , respectively. A possible pure delay introduced by processing in the central nervous system and nerve conduction is implicit in the formulation describing the influence of the sympathetic and parasympathetic nervous systems on cardiac behavior [19]. Because it is not easy to measure most of these relationships in the autonomic nervous system, we determined parameters to reproduce some experimental data from previous studies [1,2,3,4,5,6,7,8,9,10,11,12,13] by using the proposed model.
Emotion: In this study, (i) a state of concentration, (ii) a state of emotional perturbation, and (iii) a short-term alerting stimulus were modeled. To model (i), we set the intensity of emotion to 0. In the model (ii), we set the intensity of emotion as a random waveform, a part of which is shown in the upper-right of Figure 1. We obtain this waveform by setting values every 0.1 s with a uniformly distributed random number in the interval (−5, 5), which was created using the MATLAB R2019a function ‘rand’ (The MathWorks, Inc. Natick, MA, USA, 2019), and by defining values every timestep with spline interpolation using the MATLAB function ‘interp1’. In contrast, to model (iii), we set as
where is the elapsed time since the stimulus onset (the unit of which is seconds).
Respiratory system: We adopted a part of Ursino′s model [22] to express the intrathoracic pressure (mmHg) and the lung volume (m3) during the respiratory cycle:
where and denote the inspiration and the expiration duration, respectively, and denotes the time passed since the start of the inspiration. These values are normalized with the respiratory period. When we exclude the effect of pulmonary stretch receptors (PSRs) from the examination, is fixed to 2.6 × 10⁻³ m3.
Synaptic projection from CeA caused by emotion: Assuming that an increase in results in an exponential increase in with upper and lower saturations, we express this relation as a sigmoid curve
where and are the lower and upper saturations of , respectively, is the value of at the center of the sigmoid function; and is a constant given in units of and is related to the slope of the static function at the central point (Table 1). We applied similar assumptions to :
where and are the lower and upper saturations of , respectively, is the value of at the center of the sigmoid function, and is a constant given in units of and is analogous to that in Equation (4) (Table 1).
Firing frequencies of parasympathetic nerve and NTS: Following Ursino [22], who assumed that the effect of PSRs on HR is exclusively mediated by the parasympathetic nerve, we assumed that the PSRs directly affect the parasympathetic nerve. Then, assuming the exponential increase in resulting from an increase in is produced during the activity between the NTS and parasympathetic nerve, we express their relation as
where and are the lower and upper saturations of , respectively, is the spike frequency in the NTS at the center of the sigmoid function, is a constant given in units of a firing frequency and related to the slope of the static function at the central point, is the lung volume at the center of the sigmoid function, and is a constant given in units of volume and related to the slope of the static function at the central point (Table 1). Based on conditions 2 and 7, we express as
where and are constants defined in Table 1. When we remove the baroreflex for examination, is fixed to 29.5 Hz.
Firing frequencies of RVLM, CVLM, and sympathetic nerve: Assuming the exponential increase in resulting from an increase in is produced during the activity between the CVLM and RVLM, we express their relation by an exponential function and add the excitatory synaptic projections from the CeA to the RVLM as
where , , , , and are constants defined in Table 1. Based on conditions 5 and 3, we respectively express and as
where and are constants defined in Table 1.
Nerve control of heart period: We modified the part of Ursino′s model [19] that describes the control of the heart period :
where and denote the heart period changes controlled by the sympathetic and parasympathetic nerves, respectively, and denote the time constants (Table 1); and denote the constant gain factors (Table 1), and are the value of 2 s before and the value of 0.2 s before, respectively, and is the offset (Table 1). Thus, the time from the start of a contraction of the heart to the start of the next contraction (RRI, the R-R interval) is the accumulated change in during the heart period. For the model where the parasympathetic nerve controls the heart period without delay (defined as the “rapid model”), Equation (12) is not used and is set to the same value with .
2.2. Analysis
We conducted analyses with the various conditions shown in Table 2 with a time step of 5 ms. The periodogram power spectral density (PSD) of HRV was obtained from the time variation of the RRI by the following procedure [14]. First, by linear interpolation using the ‘interpl’ function, the 1000 s time variation of RRI was resampled at 2 Hz of time series data. After that, the average value was set to 0 by subtracting the average value of all sections from the values at each time. Then, we estimated the PSD of the time series data by using Welch’s overlapped segment averaging estimator. Here, we used the MATLAB function ‘pwelch’. We divided the signal into segments of 128 samples with a 50% overlap. We used a Hamming window and set the number of discrete Fourier transform points to 128. The HRV total power was obtained by integrating the PSD over all frequencies. When we analyzed the oscillations induced by a short-term alerting stimulus, the durations of the oscillations were so short that we did not divide the signal into segments, used a rectangular window instead of the Hamming window, and set the number of discrete Fourier transform points to the same number as the analyzed signals.
3. Results
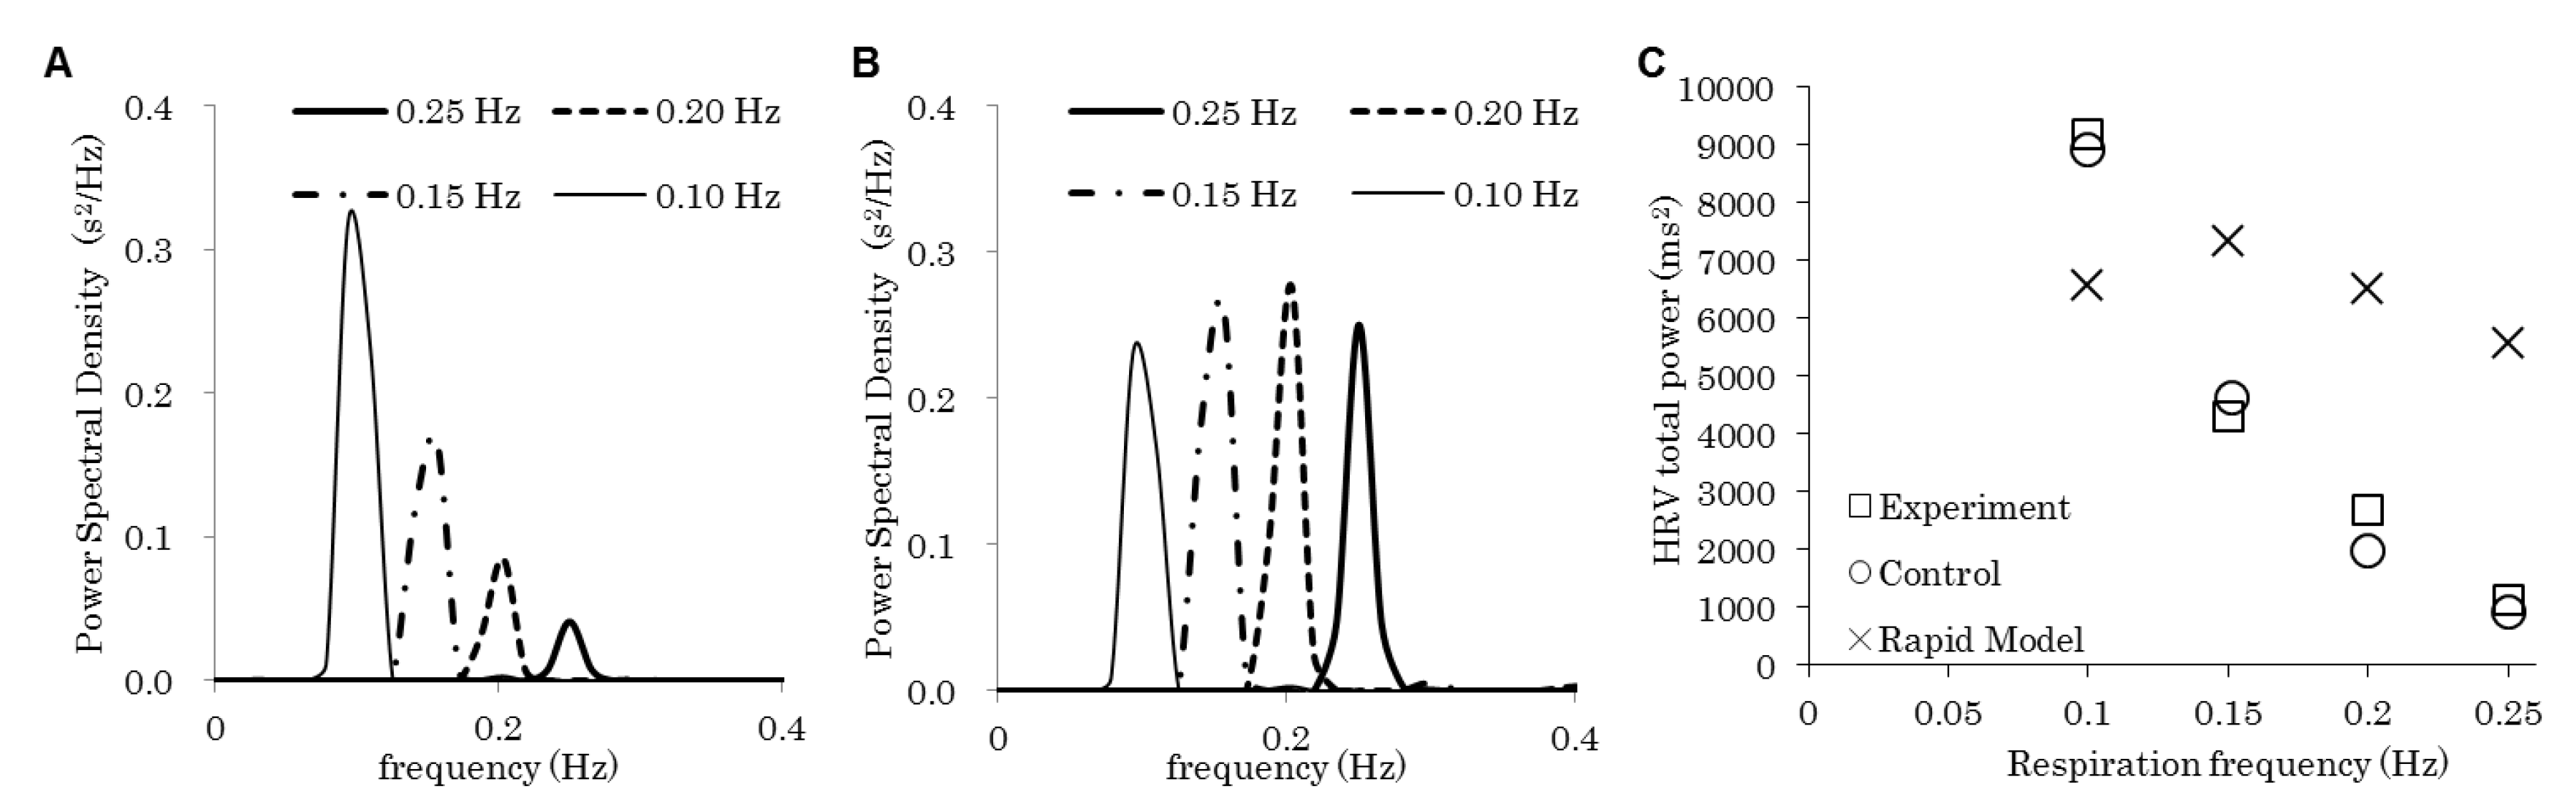
Figure 2A shows the PSD of HRV obtained using the model with the respiration frequencies of 0.10, 0.15, 0.20, and 0.25 Hz, and Figure 2B shows those obtained with the rapid model. Here, both the inspiration and expiration duration and were set at 0.5, and the intensity of emotion is set at 0. With both the models, HRVs have single spectral components at exactly the respiration frequency, as shown in the experiments performed by Yildiz and Ider [14], who controlled respiration by asking the subject to breathe in synchrony with a computer-generated display. While the relation between the HRV total power and the respiration frequency obtained in Figure 2A shows good accordance with their experiments, the relation obtained in Figure 2B is not consistent with the experimental results (Figure 2C).
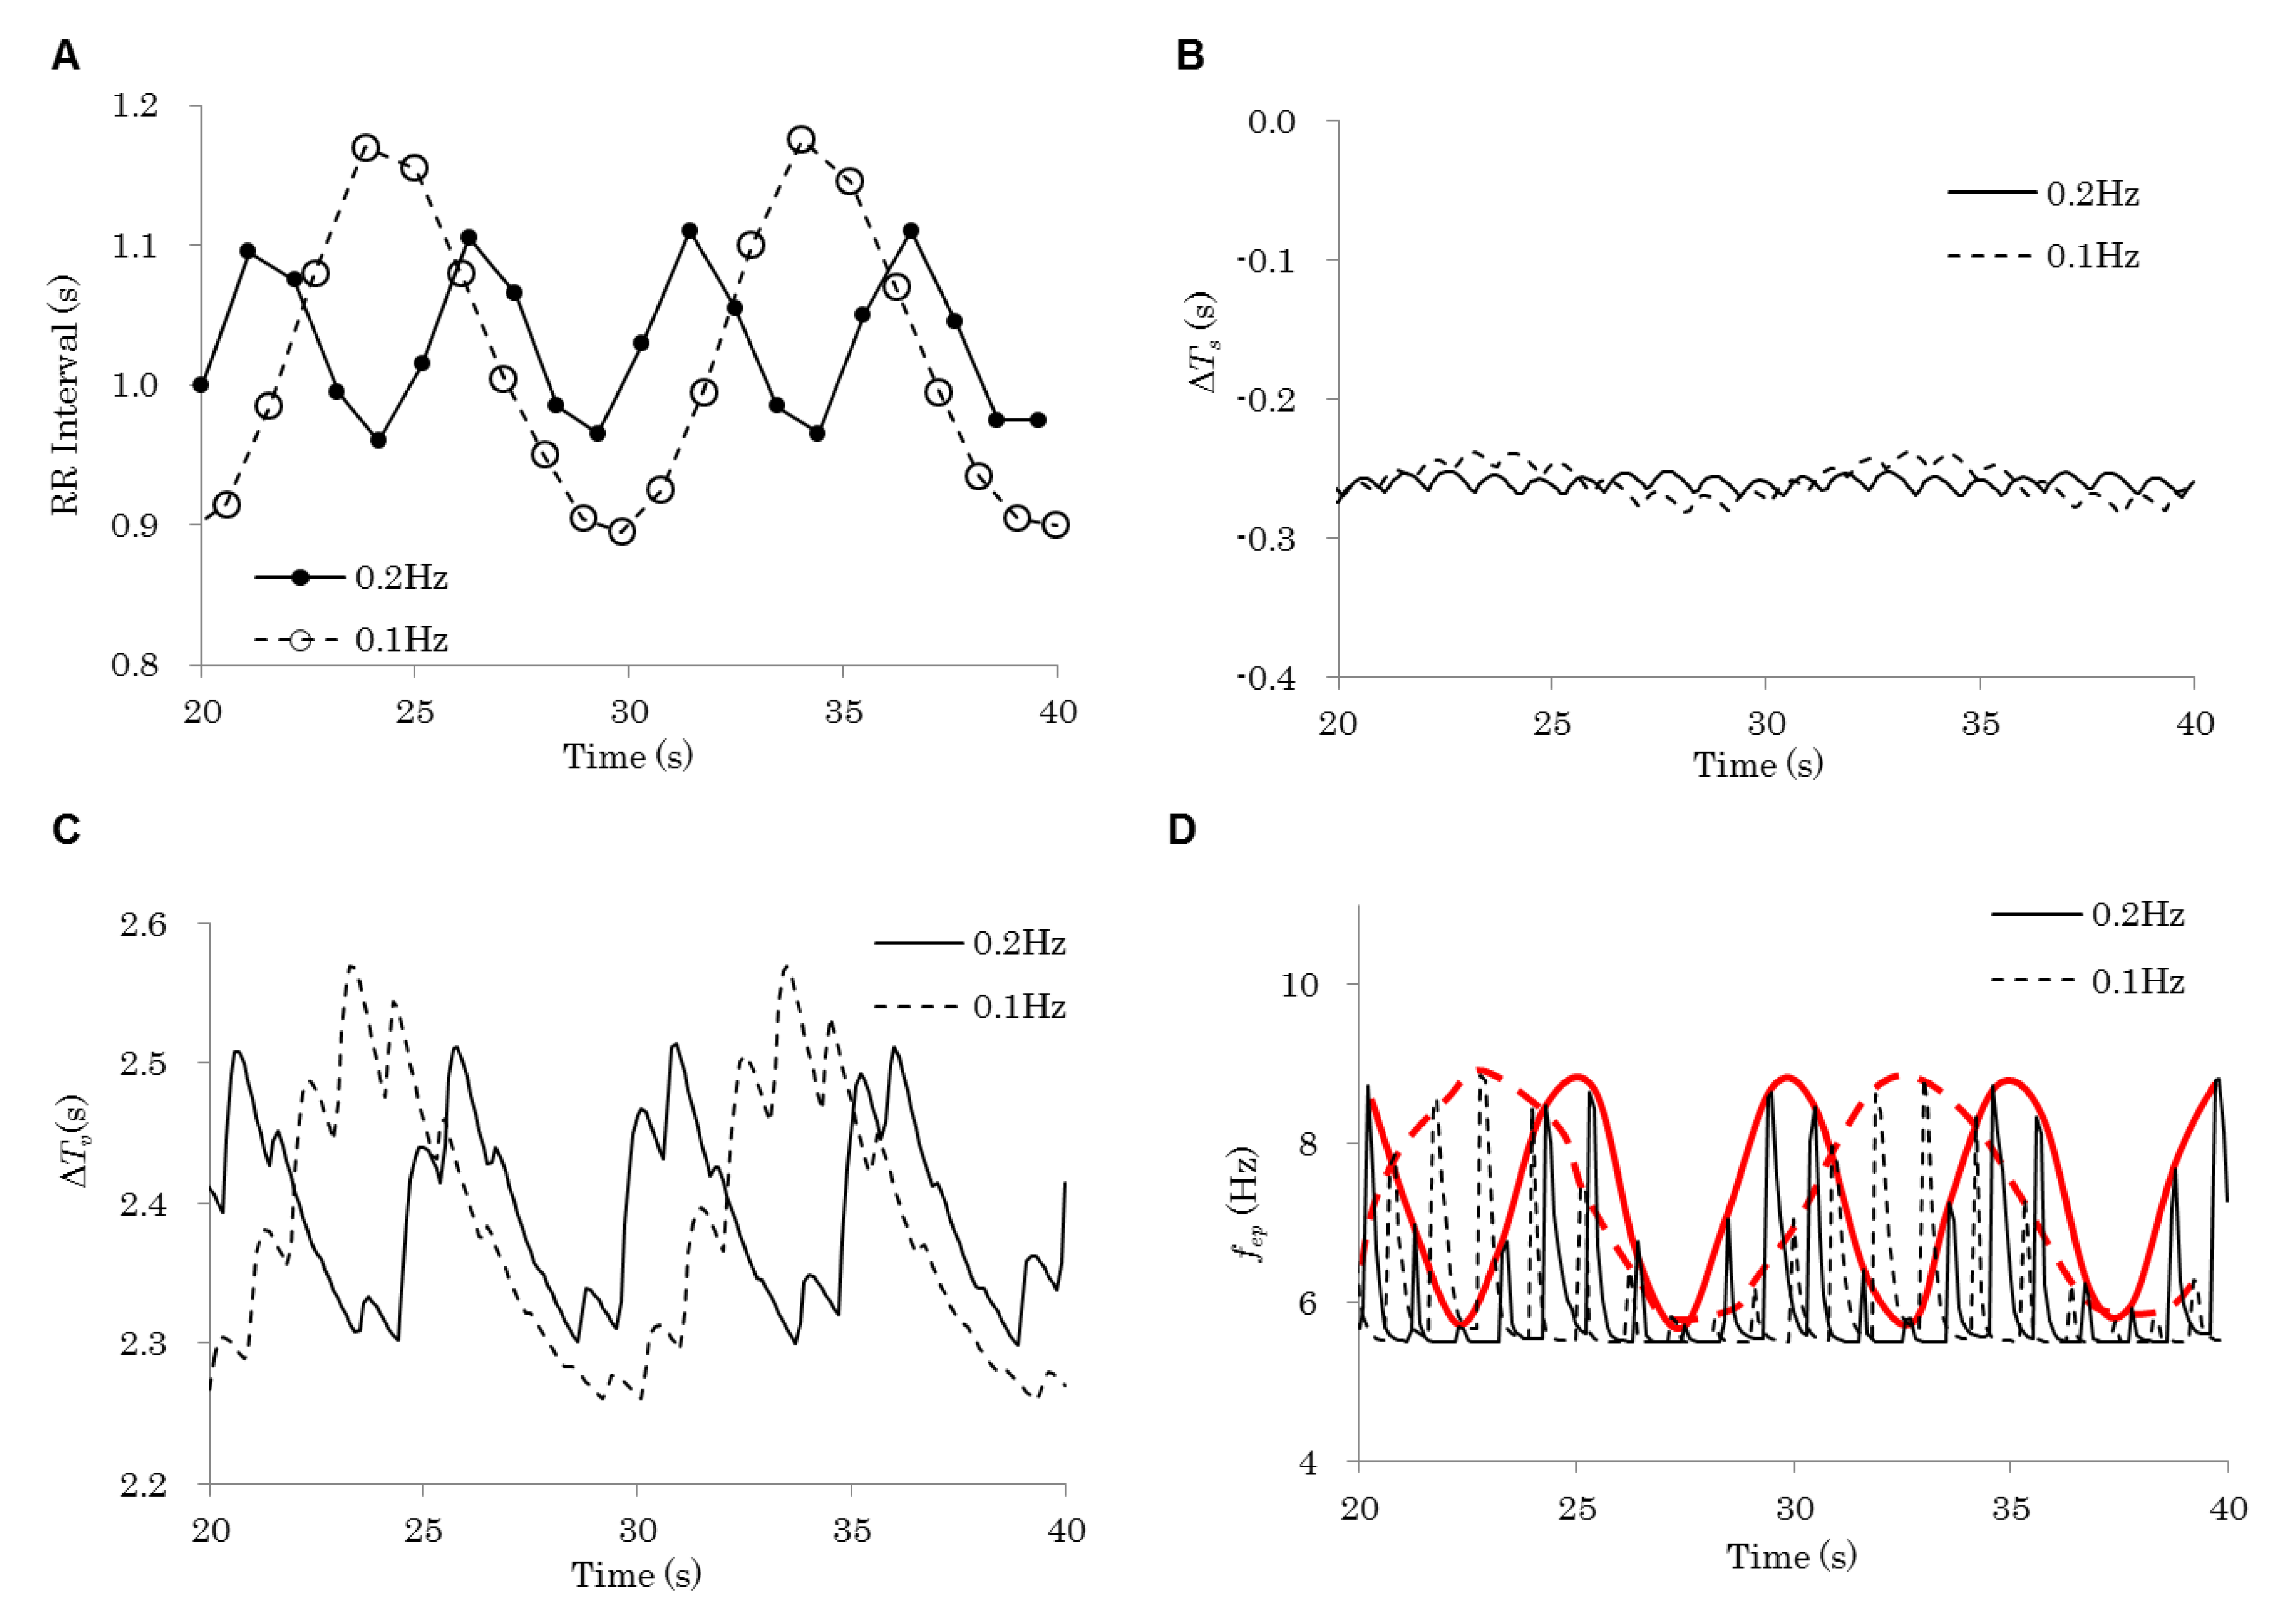
Figure 3 shows details of the simulation via which Figure 2A is obtained. Figure 3A shows that the HRV amplitude increased by roughly two-fold when the respiratory frequency decreased from 0.2 Hz to 0.1 Hz, as shown in the experiments performed by Yildiz and Ider [14]. The fluctuation of the heart period change controlled by the sympathetic nerve (Figure 3B) is considerably small compared with that of the heart period change controlled by the parasympathetic nerve (Figure 3C), which shows good accordance with the fluctuation of RRI (Figure 3A). The black lines in Figure 3D indicate the time histories of the firing frequencies of the parasympathetic nerve . They reflect the blood pressure fluctuations in cardiac cycles (roughly 1 Hz). The upper peaks of the fluctuations fluctuate, reflecting the respiration (red lines in Figure 3D).
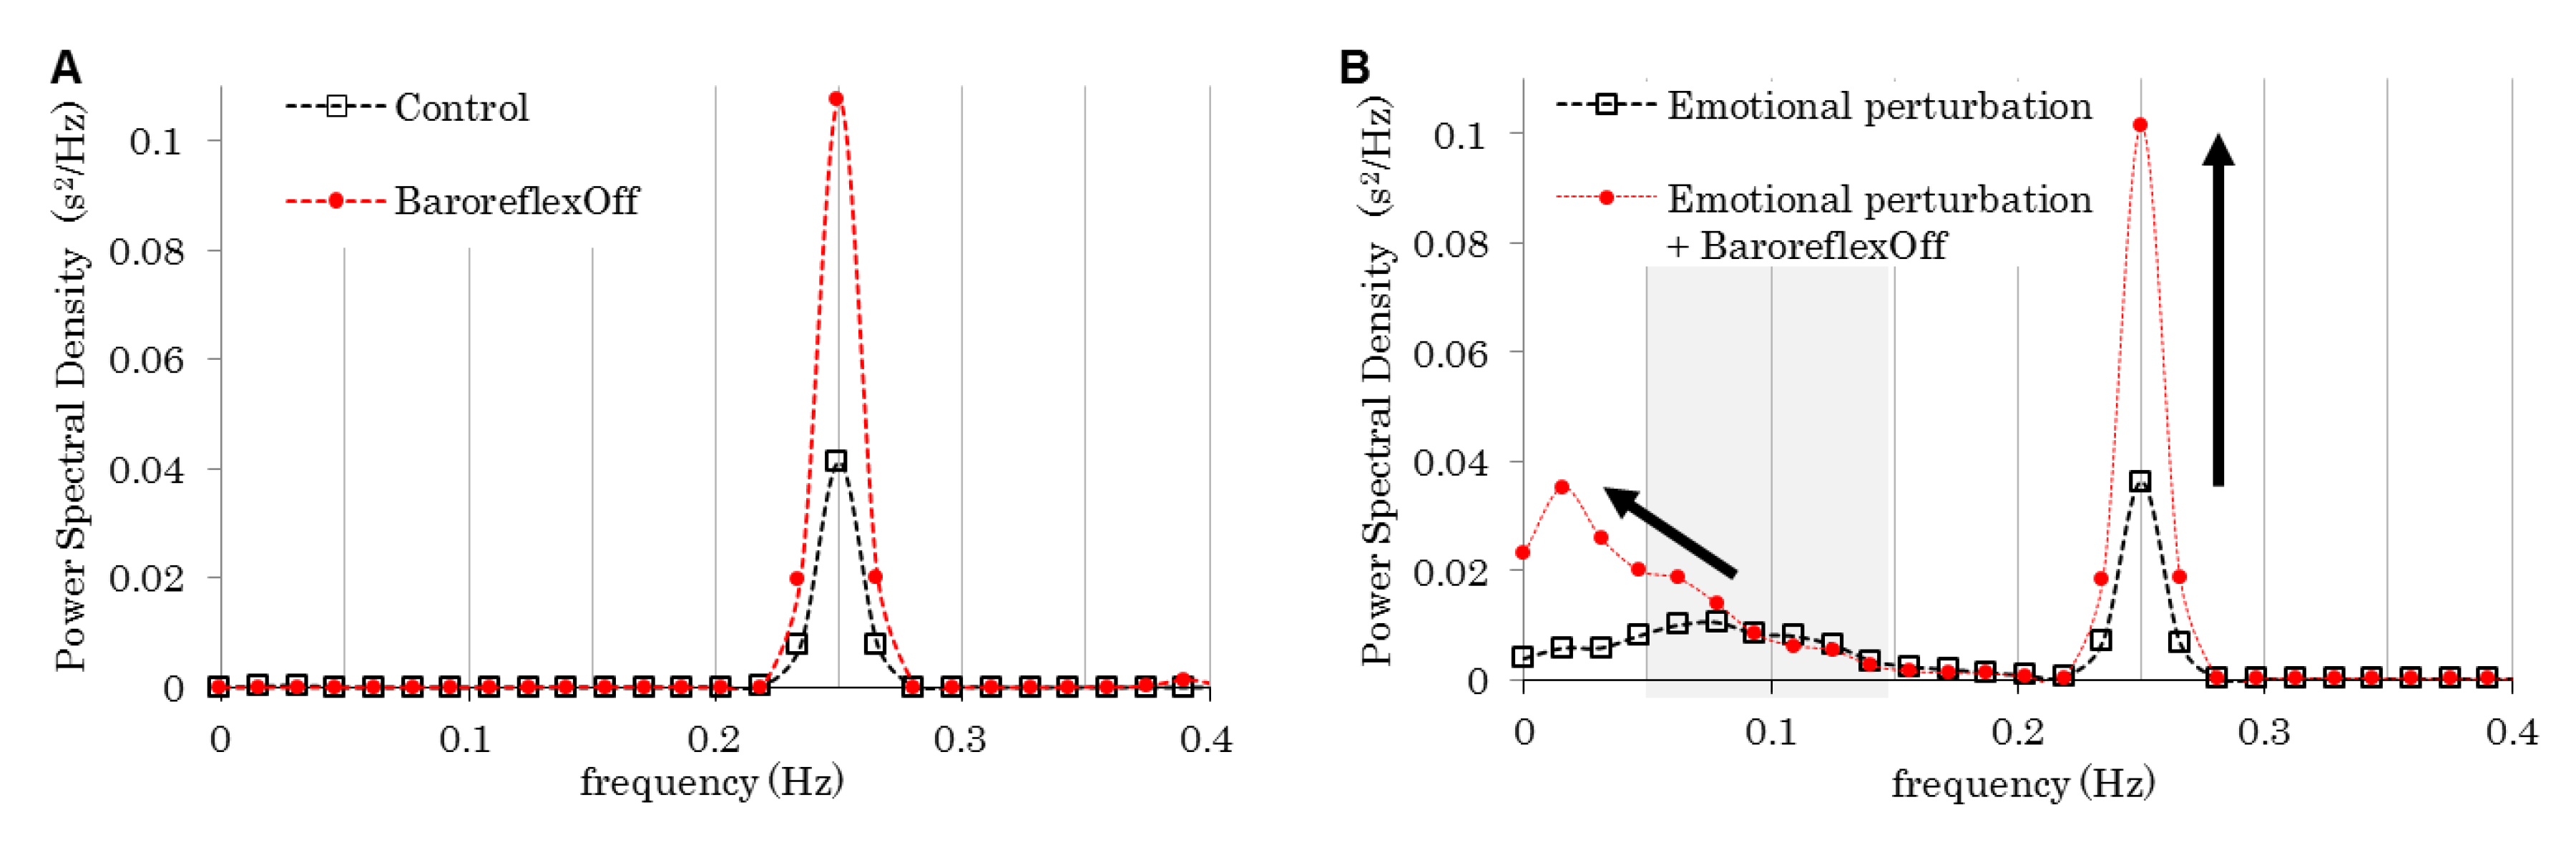
Figure 4A shows “0.25 Hz” in Figure 2A as “control.” By removing the baroreflex ( is fixed), the spectral component at the respiration frequency increased (BaroreflexOff). In contrast, the emotional perturbation (shown in upper-right in Figure 1) slightly reduced the spectral component at the respiration frequency and added another spectral component, the peak of which was around 0.08 Hz (Figure 4B). By removing the baroreflex, the spectral components increased at almost the same rate with the “control.” Moreover, the baroreflex removal moved the added peak to a lower frequency.
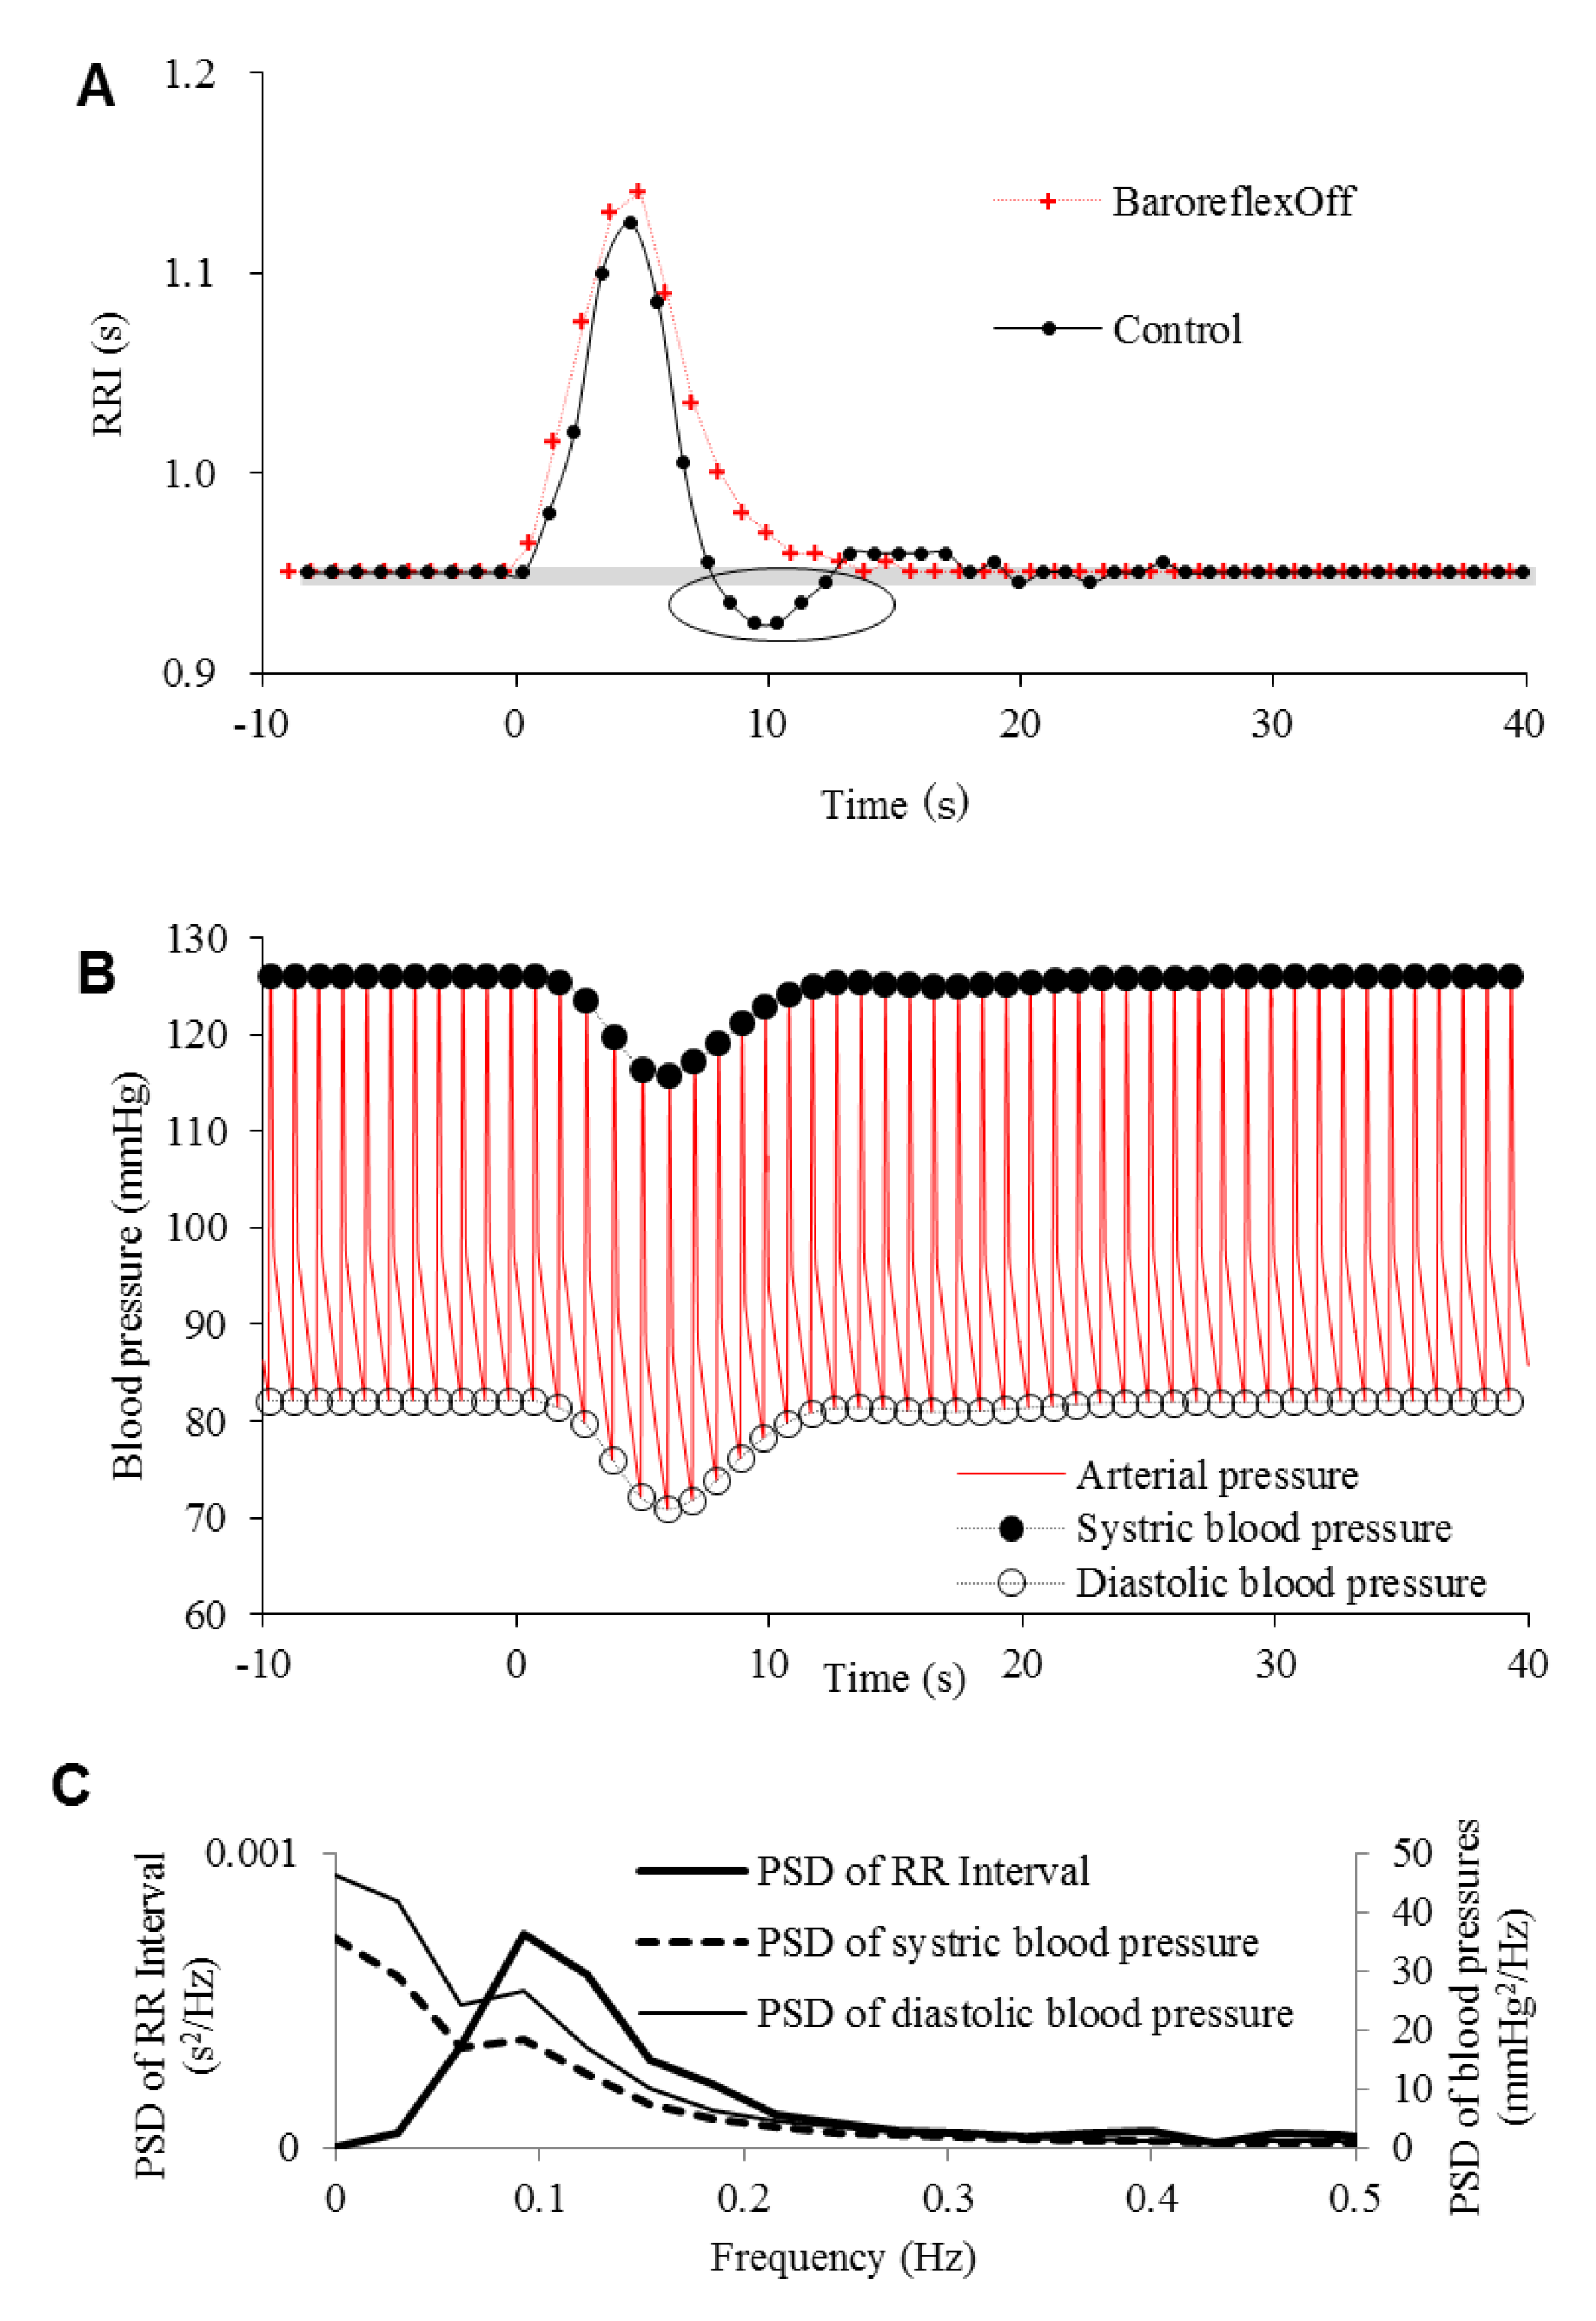
The time evolutions of RRI at a short-term alerting stimulus are shown in Figure 5A. Here, the emotional stimuli described as Equation (1) are induced. To render the RRI constant and clarify the effect of the emotional stimulation, the PSR effect was removed. The beginning of the RRI elongation was gradual despite an abrupt rise in the emotional intensity. With the baroreflex (“control” in Figure 5A), this stimulus caused an oscillation of RRI during the recovery from the increase induced by an emotional stimulus. The oscillations of the systolic and diastolic blood pressures are shown in Figure 5B. The oscillations were damped until they disappeared over time. During these oscillations, the RRI temporarily reached under the original status (circled in Figure 5A). The PSDs of these oscillations after this point show peaks at approximately 0.1 Hz (Figure 5C). As the oscillations of the systolic and diastolic blood pressures start later than the RRI oscillation, the PSDs of them include a spectral component at a lower frequency. Figure 5A also shows the result where the baroreflex is removed 1000 s before the stimulus onset (“BaroreflexOff”). Without the baroreflex, the oscillations were not observed.
4. Discussion
We developed a mathematical model by integrating emotion, the nervous system, and the cardiovascular system. As shown in previous experiments [14], the PSD of HRVs have single spectral components exactly at the respiration frequency (Figure 2A), which is considered to represent respiratory sinus arrhythmia (RSA). Moreover, the relation between HRV total power and the respiration frequency in our simulation showed good accordance with the experiments [14] (Figure 2C). In addition, the removal of the baroreflex increased the amplitude of the HRV fluctuation (Figure 4), possibly because the baroreflex suppressed the RRI change for homeostatic maintenance. The peak of the HRV spectral component in the range of LF (0.05–0.15 Hz) observed in Figure 4B, which moved to a lower frequency when the baroreflex was removed, is considered to be LF. Therefore, we can say that our model reproduces experimental and clinical results [1,2,3,4,5,6,7,8,9,10,11,12,13,14] quite well, though the parameters describing nerve interactions in the proposed model (Table 1) were not directly measured. Further experimental studies using human subjects are needed to investigate the validity of the parameters.
The simulation analyses using this model allowed us to unveil the possible cause of the decrease in HRV total power with a higher respiration frequency. The delay, which is modeled by Equation (13) and is revealed as the gradual RRI reaction at the stimulation onset in Figure 5A, works as a low-pass filter in the process where the parasympathetic activity reflects to the heart period change, and weakens the high frequency component, reflecting the blood pressure fluctuations. The filter also works on the fluctuations, reflecting the respiration (red lines in Figure 3D), and makes the fluctuation amplitude of the heart period change smaller when the respiration frequency is higher (Figure 3C). The RRI fluctuation shows good accordance with the fluctuation of the heart period change controlled by the parasympathetic nerve (Figure 3A,C), while the fluctuation of the heart period change controlled by the sympathetic nerve is considerably small (Figure 3B). This indicates that the RRI fluctuation is mainly controlled by the parasympathetic nerve. In short, the delay in the process where the parasympathetic activity controls the heart period change removes the high frequency component and decreases the HRV total power with a higher respiration frequency. By removing the delay in the process where the parasympathetic activity controls the heart period, the decrease in HRV total power disappears (Figure 2B,C). Thus, we can say that the delay in the process where the parasympathetic activity controls the heart period may be the cause of the decrease in HRV total power with a higher respiration frequency.
The baroreflex feedback control contains the delay in the sinus nerve response to the arterial pressure, adding to the delay in the heart period response to the efferent nerve activities. We assume that these delays generate the oscillations of RRI (Figure 5A) and the arterial pressure (Figure 5B) as transient responses to the simple emotional stimulation. As their frequencies are 0.1 Hz (Figure 5C) and decrease when the baroreflex is removed, the oscillations of RRI and the arterial pressure may be considered the LF and the Mayer wave, respectively. Thus, we successfully reproduced the LF component of HRV (Figure 4B) by inducing continuous emotional stimulation as a constant emotional perturbation. Although this assumption follows the baroreflex feedback theory, rhythmic vasomotor activity or centrogenic rhythm in the brain stem, which are considered to be responsible for LF generation [16,17], are not included in our simulation. Instead, we proposed a baroreflex feedback theory where the emotional perturbation generates the LF component by inducing the RRI perturbation. The oscillation of neural activity in the brain stem observed by Montano et al. [18] may be generated by continuous emotional perturbation because the emotion worked on the brain stem without sinus or vagal nerves (Figure 1). Besides the oscillations at the frequency corresponding to LF, oscillations at other frequencies observed in the brain stem [16,18] can also be generated by emotion. Regardless of their frequencies, these oscillations can generate LF according to the baroreflex feedback theory.
Assuming that a state of emotional perturbation in this study represents a state of anxiety, where one has continuous emotional turmoil, the results predicted by our model, where emotional perturbation increases the LF/HF ratio by generating LF (Figure 4), reproduced well-known facts such as negative emotion increasing the LF/HF ratio [3,8,10,11,15]. On the contrary, a short-term alerting stimulus did not generate the continuous oscillations of RRI, that is, LF (Figure 5). These results suggest that a state of emotional perturbation, where CeA activity is oscillated, is one of the emotional conditions generating LF, and the increase of the CeA activity is one of the emotional conditions increasing HR. Furthermore, we assumed that it may be because the subject’s concentration on breathing achieved “a state of concentration” that the LF was removed when the subject controlled breathing in the experiments performed by Yildiz and Ider [14]. This means that one can reduce LF power by concentrating on breathing to remove emotional perturbation. Moreover, as indicated in the experiments [14], one can increase HF power by reducing the respiration frequency intentionally. In short, one can reduce the LF/HF ratio by concentrating on breathing and reducing the respiration frequency. Note that when the respiration frequency is reduced significantly and reaches under 0.15 Hz, RSA moved out from the range of HF (0.15–1.0 Hz) and HF was eliminated. Whether a task generates emotional perturbations or calms them is dependent on the task and the subject, where it can generate concentration or upset. Moreover, the respiration frequency with the task can increase or decrease, and even be controlled intentionally. This might be the cause of the instability of the LF/HF for task evaluation [3,15].
The cardiac behaviors can be fed back to the emotional status [24]. Thus, the LF/HF decreased by concentrating on breathing and reducing the respiration frequency may be fed back to the emotional status [24] and may be perceived as the status free from tasks. Similarly, temporal excess of RRI during the recovery from the increase induced by an emotional stimulus (circled in Figure 5A) can be fed back and perceived as an emotion different from the emotion given as the stimulation.
As stress levels increase in society, controlling emotional status has become increasingly more important. The establishment of objective measurement methodologies of emotions may be valuable to help people control their emotions. The simulation analysis in our study can be used to unveil how an increase in the respiration frequency decreases RSA and how an emotional perturbation generates LF. Although this study has some limitations regarding model validation against experimental data on physiological measurement and psychological evaluations of human subjects, our novel mathematical model and the insights about the relation between CeA activity and HR/HRV presented in this paper can help establish a method to measure emotions, which may later be applied to emotion management and monitoring.
Author Contributions
S.H. conceived and designed the study and performed the analysis and interpretation of data; M.I. helped to draft the manuscript and was accountable for every aspect of the study; S.H. and M.I. read and approved the final version of the manuscript.
Funding
This research received no external funding.
Acknowledgments
We thank Editage (www.editage.jp) for English language editing.
Conflicts of Interest
The authors declare no conflict of interest.
Nomenclature
| (-) | Intensity of emotion triggering the synaptic projection of the CeA |
| (-) | Intensity of the influence of the synaptic projection on the RVLM |
| (-) | Intensity of the influence of the synaptic projection on the NTS |
| (Hz) | Firing frequency of the sinus nerve |
| (Hz) | Firing frequency of the sympathetic nerve |
| (Hz) | Firing frequency of the parasympathetic nerve |
| (Hz) | Firing frequency of the RVLM |
| (Hz) | Firing frequency of the CVLM |
| (Hz) | Firing frequency of the NTS |
| (mmHg) | Intrathoracic pressure |
| (m3) | Lung volume |
| (-) | Inspiration duration (normalized with the respiratory period) |
| (-) | Expiration duration (normalized with the respiratory period) |
| (-) | Time passed since the inspiration starts (normalized with the respiratory period) |
| (-) | Lower saturation of |
| (-) | Upper saturation of |
| (-) | Value of at the center of the sigmoid function representing |
| (-) | Constant related to the shape of the sigmoid function representing |
| (-) | Lower saturation of |
| (-) | Upper saturation of |
| (-) | Value of at the center of the sigmoid function representing |
| (-) | Constant related to the shape of the sigmoid function representing |
| (Hz) | Lower saturation of |
| (Hz) | Upper saturation of |
| (Hz) | Value of at the center of the sigmoid function representing |
| (Hz) | Constant related to the shape of the sigmoid function representing |
| (m3) | Value of at the center of the sigmoid function representing |
| (m3) | Constant related to the shape of the sigmoid function representing |
| (Hz) | Strength of the effect on |
| (-) | Constant representing the relationship between and |
| (Hz) | in the condition with extremely large |
| (Hz) | Strength of the effect on |
| (s) | Constant related to the shape of the exponential function representing |
| (Hz) | Strength of the effect on |
| (-) | Constant representing the relationship between and |
| (-) | Strength of the effect on |
| (-) | Strength of the effect on |
| (s) | Heart period |
| (s) | Heart period change controlled by the sympathetic nerve |
| (s) | Heart period change controlled by the parasympathetic nerve |
| (s) | Time constant of |
| (s) | Time constant of |
| (s/Hz) | Constant gain factors of |
| (s/Hz) | Constant gain factors of |
| (Hz) | 2 s before |
| (Hz) | 0.2 s before |
| (s) | Offset of the heart period |
References
- Albracht-Schulte, K.; Robert-McComb, J. The effects of yoga and quiet rest on subjective levels of anxiety and physiological correlates: A 2-way crossover randomized trial. BMC Complement. Altern. Med. 2018, 18, 280. [Google Scholar] [CrossRef] [PubMed]
- Lang, P.J.; Greenwald, M.K.; Bradley, M.M.; Hamm, A.O. Looking at pictures: Affective, facial, visceral, and behavioral reactions. Psychophysiology 1993, 30, 261–273. [Google Scholar] [CrossRef] [PubMed]
- Shinba, T.; Kariya, N.; Matsui, Y.; Ozawa, N.; Matsuda, Y.; Yamamoto, K. Decrease in heart rate variability response to task is related to anxiety and depressiveness in normal subjects. Psychiatry Clin. Neurosci. 2008, 62, 603–609. [Google Scholar] [CrossRef] [PubMed]
- Baek, H.J.; Lee, H.B.; Kim, J.S.; Choi, J.M.; Kim, K.K.; Park, K.S. Nonintrusive biological signal monitoring in a car to evaluate a driver’s stress and health state. Telemed. J. e-Health 2009, 15, 182–189. [Google Scholar] [CrossRef]
- Critchley, H.D.; Rotshtein, P.; Nagai, Y.; O’Doherty, J.; Mathias, C.J.; Dolan, R.J. Activity in the human brain predicting differential heart rate responses to emotional facial expressions. NeuroImage 2005, 24, 751–762. [Google Scholar] [CrossRef]
- Hamann, S.B.; Ely, T.D.; Grafton, S.T.; Kilts, C.D. Amygdala activity related to enhanced memory for pleasant and aversive stimuli. Nat. Neurosci. 1999, 2, 289–293. [Google Scholar] [CrossRef]
- Wager, T.D.; Waugh, C.E.; Lindquist, M.; Noll, D.C.; Fredrickson, B.L.; Taylor, S.F. Brain mediators of cardiovascular responses to social threat: Part I: Reciprocal dorsal and ventral sub-regions of the medial prefrontal cortex and heart-rate reactivity. NeuroImage 2009, 47, 821–835. [Google Scholar] [CrossRef]
- Kemp, A.H.; Quintana, D.S.; Gray, M.A.; Felmingham, K.L.; Brown, K.; Gatt, J.M. Impact of depression and antidepressant treatment on heart rate variability: A review and meta-analysis. Biol. Psychiatry 2010, 67, 1067–1074. [Google Scholar] [CrossRef]
- Napadow, V.; Dhond, R.; Conti, G.; Makris, N.; Brown, E.N.; Barbieri, R. Brain correlates of autonomic modulation: Combining heart rate variability with fMRI. NeuroImage 2008, 42, 169–177. [Google Scholar] [CrossRef]
- Wallentin, M.; Nielsen, A.H.; Vuust, P.; Dohn, A.; Roepstorff, A.; Lund, T.E. Amygdala and heart rate variability responses from listening to emotionally intense parts of a story. NeuroImage 2011, 58, 963–973. [Google Scholar] [CrossRef]
- Yang, T.T.; Simmons, A.N.; Matthews, S.C.; Tapert, S.F.; Bischoff-Grethe, A.; Frank, G.K.; Arce, E.; Paulus, M.P. Increased amygdala activation is related to heart rate during emotion processing in adolescent subjects. Neurosci. Lett. 2007, 428, 109–114. [Google Scholar] [CrossRef] [PubMed]
- Berntson, G.G.; Cacioppo, J.T.; Quigley, K.S. Respiratory sinus arrhythmia: Autonomic origins, physiological mechanisms, and psychophysiological implications. Psychophysiology 1993, 30, 183–196. [Google Scholar] [CrossRef] [PubMed]
- Berntson, G.G.; Bigger, J.T.; Eckberg, D.L.; Grossman, P.; Kaufmann, P.G.; Malik, M.; Nagaraja, H.N.; Porges, S.W.; Saul, J.P.; Stone, P.H.; et al. Heart rate variability: Origins, methods, and interpretive caveats. Psychophysiology 1997, 34, 623–648. [Google Scholar] [CrossRef] [PubMed]
- Yildiz, M.; Ider, Y.Z. Model based and experimental investigation of respiratory effect on the HRV power spectrum. Physiol. Meas. 2006, 27, 973–988. [Google Scholar] [CrossRef] [PubMed]
- Taelman, J.; Vandeput, S.; Spaepen, A.; Van Huffel, S. Influence of mental stress on heart rate and heart rate variability. In 4th European Conference of the International Federation for Medical and Biological Engineering 23–27 November 2008, Antwerp, Belgium, 1st ed.; van der Sloten, J., Verdonck, P., Nyssen, M., Haueisen, J., Eds.; Springer: Berlin/Heidelberg, Germany, 2009; Volume 22, pp. 1366–1369. [Google Scholar] [CrossRef]
- Malpas, S.C. Neural influences on cardiovascular variability: Possibilities and pitfalls. Am. J. Physiol. 2002, 282, H6–H20. [Google Scholar] [CrossRef] [PubMed]
- Papaioannou, V.E. Heart rate variability, baroreflex function and heart rate turbulence: Possible origin and implications. Hell. J. Cardiol. 2007, 48, 278–289. [Google Scholar]
- Montano, N.; Gnecchi-Ruscone, T.; Porta, A.; Lombardi, F.; Malliani, A.; Barman, S.M. Presence of vasomotor and respiratory rhythms in the discharge of single medullary neurons involved in the regulation of cardiovascular system. J. Auton. Nerv. Syst. 1996, 57, 116–122. [Google Scholar] [CrossRef]
- Ursino, M. Interaction between carotid baroregulation and the pulsating heart: A mathematical model. Am. J. Physiol. 1998, 275, H1733–H1747. [Google Scholar] [CrossRef]
- Ursino, M.; Magosso, E. Acute cardiovascular response to isocapnic hypoxia. I. A mathematical model. Am. J. Physiol. 2000, 279, H149–H165. [Google Scholar] [CrossRef]
- Magosso, E.; Ursino, M. Cardiovascular response to dynamic aerobic exercise: A methematical model. Med. Biol. Eng. Comput. 2002, 40, 660–674. [Google Scholar] [CrossRef]
- Ursino, M.; Magosso, E. Role of short-term cardiovascular regulation in heart period variability: A modeling study. Am. J. Physiol. 2003, 284, H1479–H1493. [Google Scholar] [CrossRef] [PubMed]
- Saha, S. Role of the central nucleus of the amygdala in the control of blood pressure: Descending pathways to medullary cardiovascular nuclei. Clin. Exp. Pharmacol. Physiol. 2005, 32, 450–456. [Google Scholar] [CrossRef] [PubMed]
- Critchley, H.D.; Eccles, J.; Garfinkel, S.N. Interaction between cognition, emotion, and the autonomic nervous system. Handb. Clin. Neurol. 2013, 117, 59–77. [Google Scholar] [CrossRef] [PubMed]
Figure 1.
Schematic of proposed mathematical model. The area surrounded by the double line is modeled based on Ursino′s model [19]. An example of the time history of the emotion intensity given in our model is shown on the upper-right of the figure. CeA, central nucleus of the amygdala; NTS, nucleus tractus solitarii; CVLM, caudal ventrolateral medulla; RVLM, rostral ventrolateral medulla; DVN, dorsal vagal motor nucleus; NA, nucleus ambiguus.

Figure 2.
Power spectral density (PSD) of the heart rate variability (HRV) with various respiration frequencies. The delay in the parasympathetic nerve control of the heart period is removed in (B). (C) The relation between the HRV total power and the respiratory frequency. The squares are experimental results [14]. The circles and the crosses are obtained by integrating PSDs shown in (A) and (B), respectively.

Figure 3.
Time histories of various variables obtained by the simulation with 0.1 and 0.2 Hz of respiration frequencies. (A) R-R interval (the time from the start of a contraction of the heart to the start of the next contraction). (B) The heart period change controlled by the sympathetic nerve. (C) The heart period change controlled by the parasympathetic nerve. (D) Black lines show the firing frequencies of the parasympathetic nerve. Red lines show the fluctuations of the upper peaks of the parasympathetic nerve firing frequencies.

Figure 4.
Power spectral densities (PSDs) of the heart rate variabilities (HRVs) with/without baroreflex. (A) With constant emotion. (B) With emotional perturbation.
Figure 4.
Power spectral densities (PSDs) of the heart rate variabilities (HRVs) with/without baroreflex. (A) With constant emotion. (B) With emotional perturbation.

Figure 5.
Time evolutions of (A) RR interval (RRI) and (B) arterial blood pressures at a short-term alerting stimulus. (A) The result without baroreflex. (C) The periodogram power spectral densities (PSDs) of the systolic and diastolic blood pressures and RRI with baroreflex.
Figure 5.
Time evolutions of (A) RR interval (RRI) and (B) arterial blood pressures at a short-term alerting stimulus. (A) The result without baroreflex. (C) The periodogram power spectral densities (PSDs) of the systolic and diastolic blood pressures and RRI with baroreflex.


Table 1.
Describing nerve interactions in the proposed model.
| Equation | Parameters | |||
|---|---|---|---|---|
| Equation (4) | ||||
| Equation (5) | ||||
| Equation (6) | Hz | Hz | Hz | Hz |
| m3 | = 8.0 m3 | |||
| Equation (7) | Hz | |||
| Equation (8) | Hz | Hz | s | |
| Hz | ||||
| Equation (9) | ||||
| Equation (10) | ||||
| Equation (11) | s | s/Hz | ||
| Equation (12) | s | s/Hz | ||
| Equation (13) | s | |||
Table 2.
Analyses.
| Figure | Model | Respiration Frequency (Hz) | Baroreflex | Emotion | |
|---|---|---|---|---|---|
| 2 | A and “control” in C | Control | 0.10, 0.15, 0.20, 0.25 | On | Flat |
| B and “rapid model” in C | Rapid | ||||
| 3 | 0.2 Hz | Control | 0.20 | On | Flat |
| 0.1 Hz | 0.10 | ||||
| 4 | Control | Control | 0.25 | On | Flat |
| Emotional perturbation | Perturbed | ||||
| Baroreflex off | Off | Flat | |||
| Emotional perturbation & Baroreflex off | Perturbed | ||||
| 5 | Control | Control | Pulmonary stretch receptor (PSR) is removed | On | Stimulation |
| Baroreflex off | Off | ||||
© 2019 by the authors. Licensee MDPI, Basel, Switzerland. This article is an open access article distributed under the terms and conditions of the Creative Commons Attribution (CC BY) license (http://creativecommons.org/licenses/by/4.0/).
Share and Cite
MDPI and ACS Style
Hirabayashi, S.; Iwamoto, M. Emotion, Respiration, and Heart Rate Variability: A Mathematical Model and Simulation Analyses. Appl. Sci. 2019, 9, 5008. https://doi.org/10.3390/app9235008
AMA Style
Hirabayashi S, Iwamoto M. Emotion, Respiration, and Heart Rate Variability: A Mathematical Model and Simulation Analyses. Applied Sciences. 2019; 9(23):5008. https://doi.org/10.3390/app9235008
Chicago/Turabian StyleHirabayashi, Satoko, and Masami Iwamoto. 2019. "Emotion, Respiration, and Heart Rate Variability: A Mathematical Model and Simulation Analyses" Applied Sciences 9, no. 23: 5008. https://doi.org/10.3390/app9235008
Note that from the first issue of 2016, this journal uses article numbers instead of page numbers. See further details here.