
Phase- and Workload-Dependent Changes in Corticospinal Excitability to the Biceps and Triceps Brachii during Arm Cycling

 ,
, 
Abstract
:1. Introduction
2. Materials and Methods
2.1. Ethical Approval
2.2. Participants
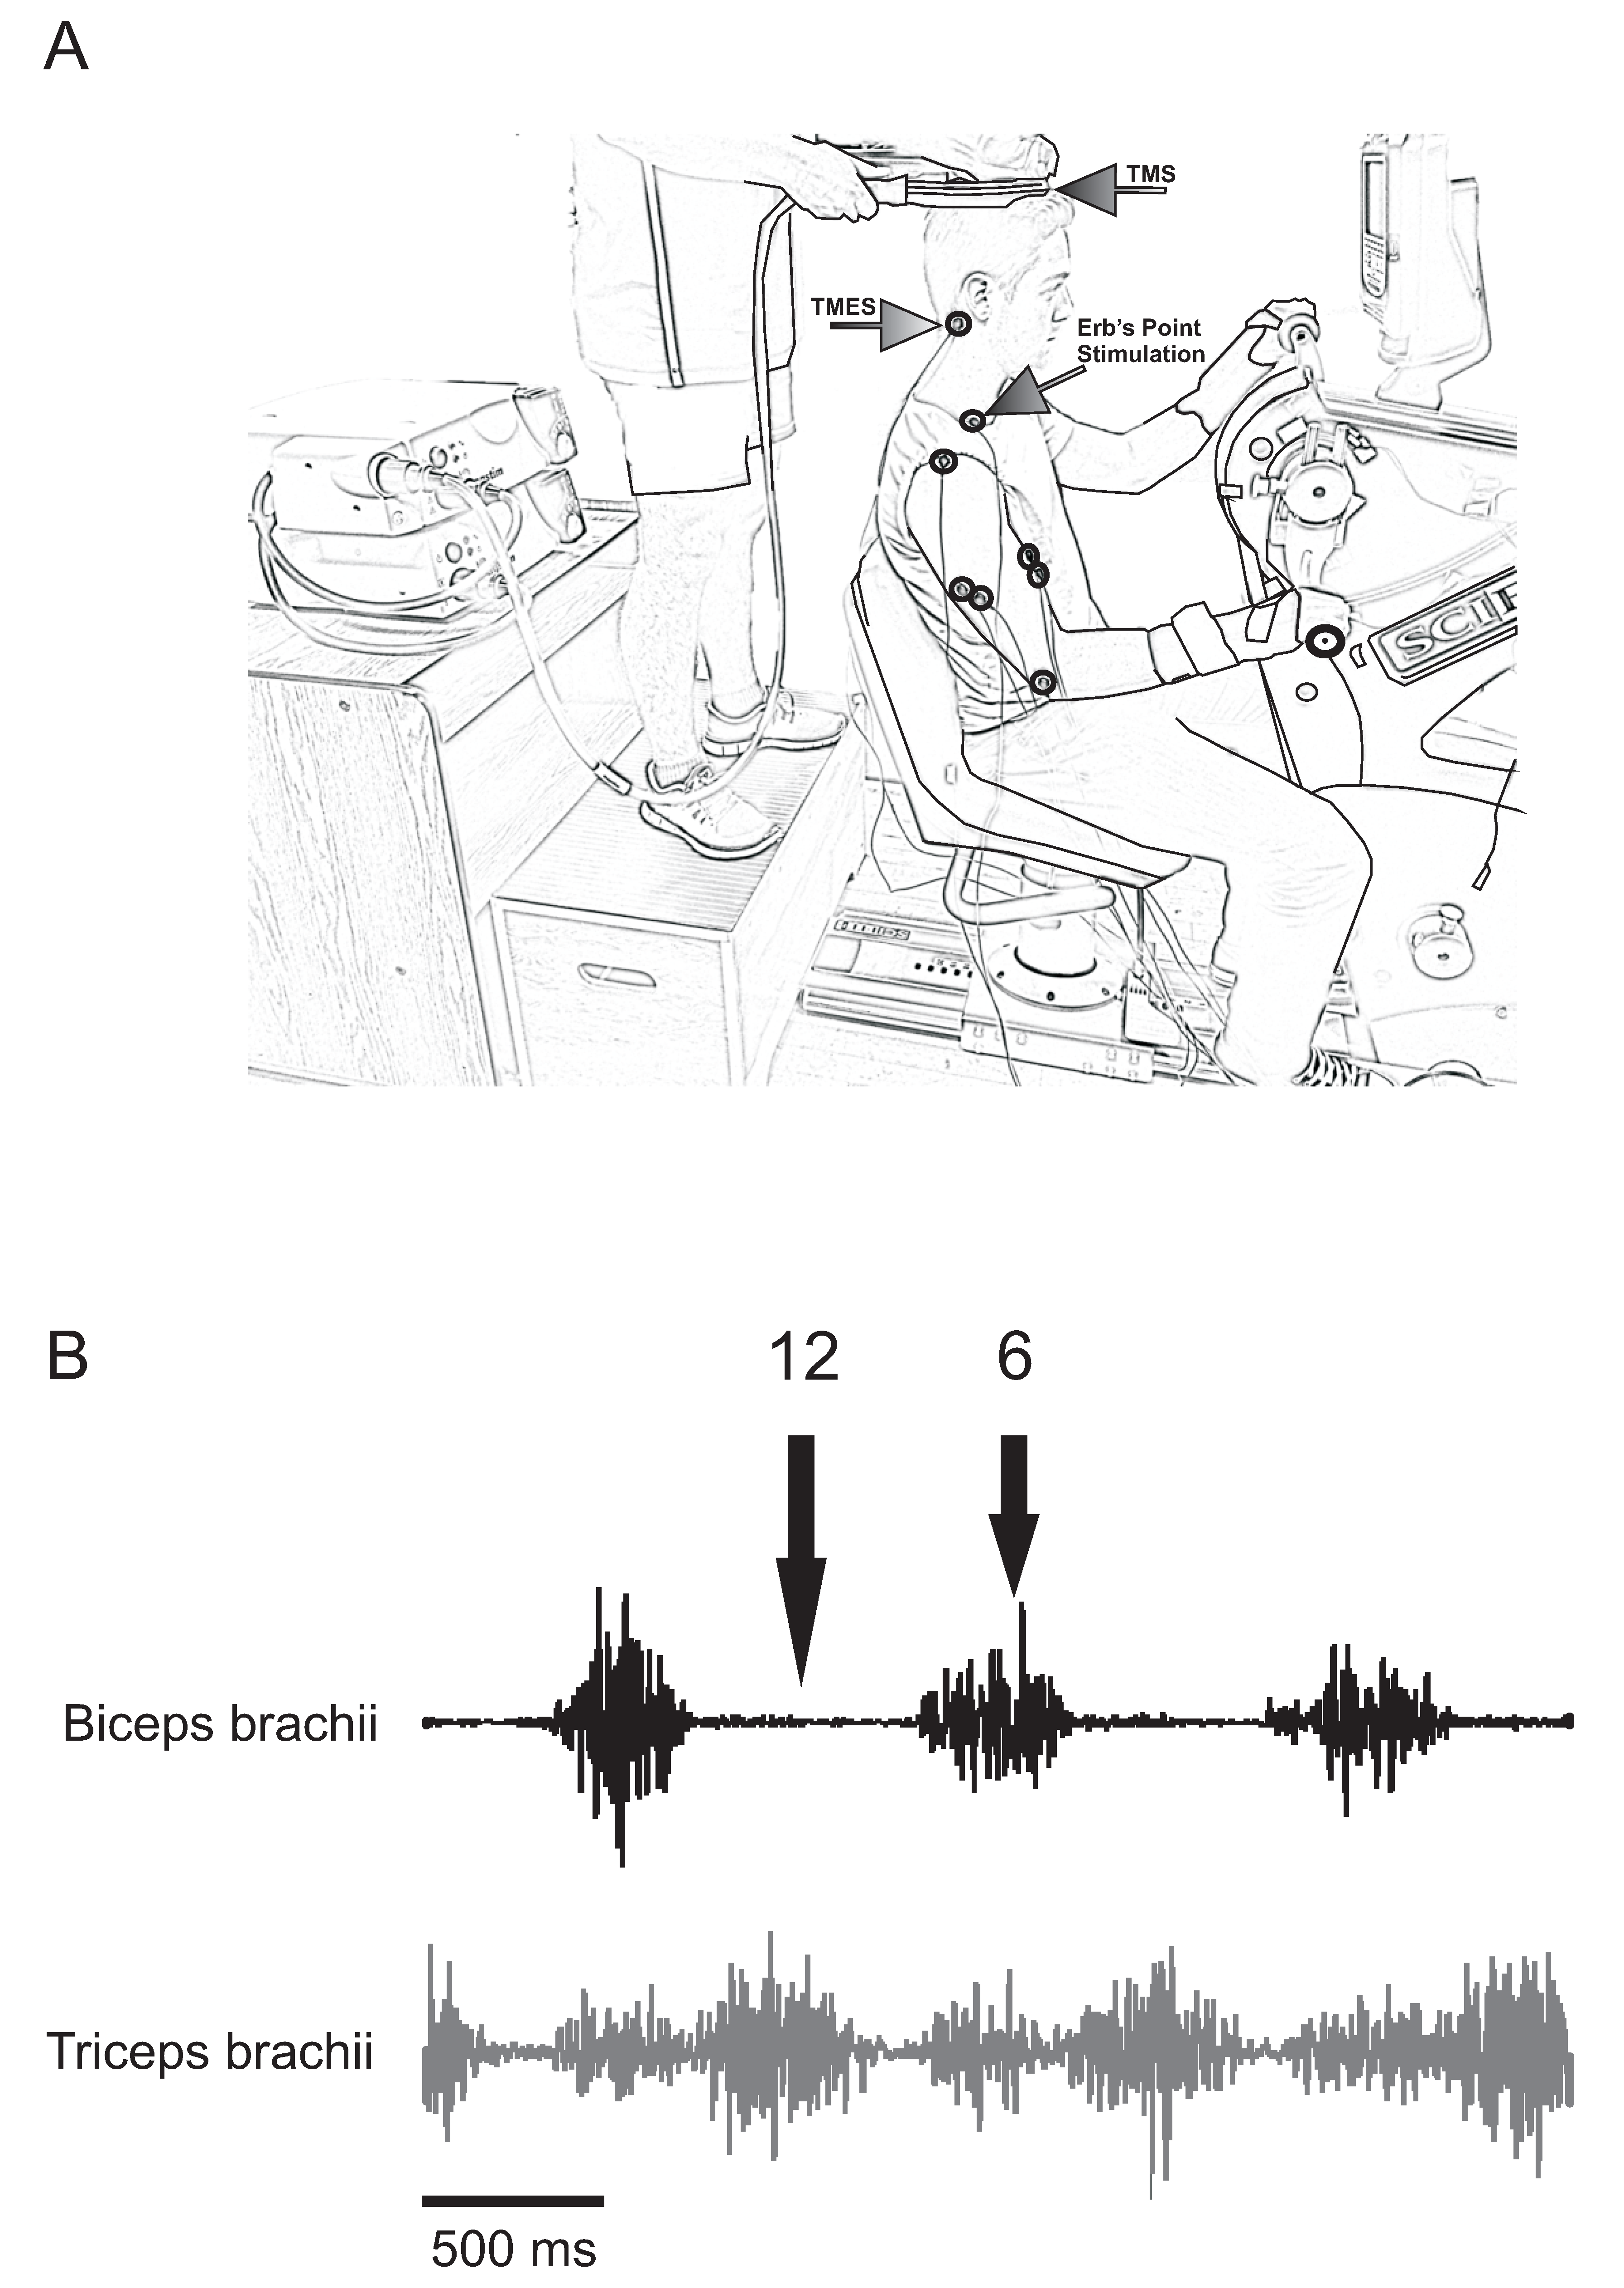
2.3. Experimental Set-Up
2.4. Electromyography Recordings
2.5. Stimulation Conditions
2.6. Brachial Plexus Stimulation
2.7. Transcranial Magnetic Stimulation
2.8. Transmastoid Electrical Stimulation
2.9. Experimental Protocol
2.10. Measurements
2.11. Statistics
3. Results
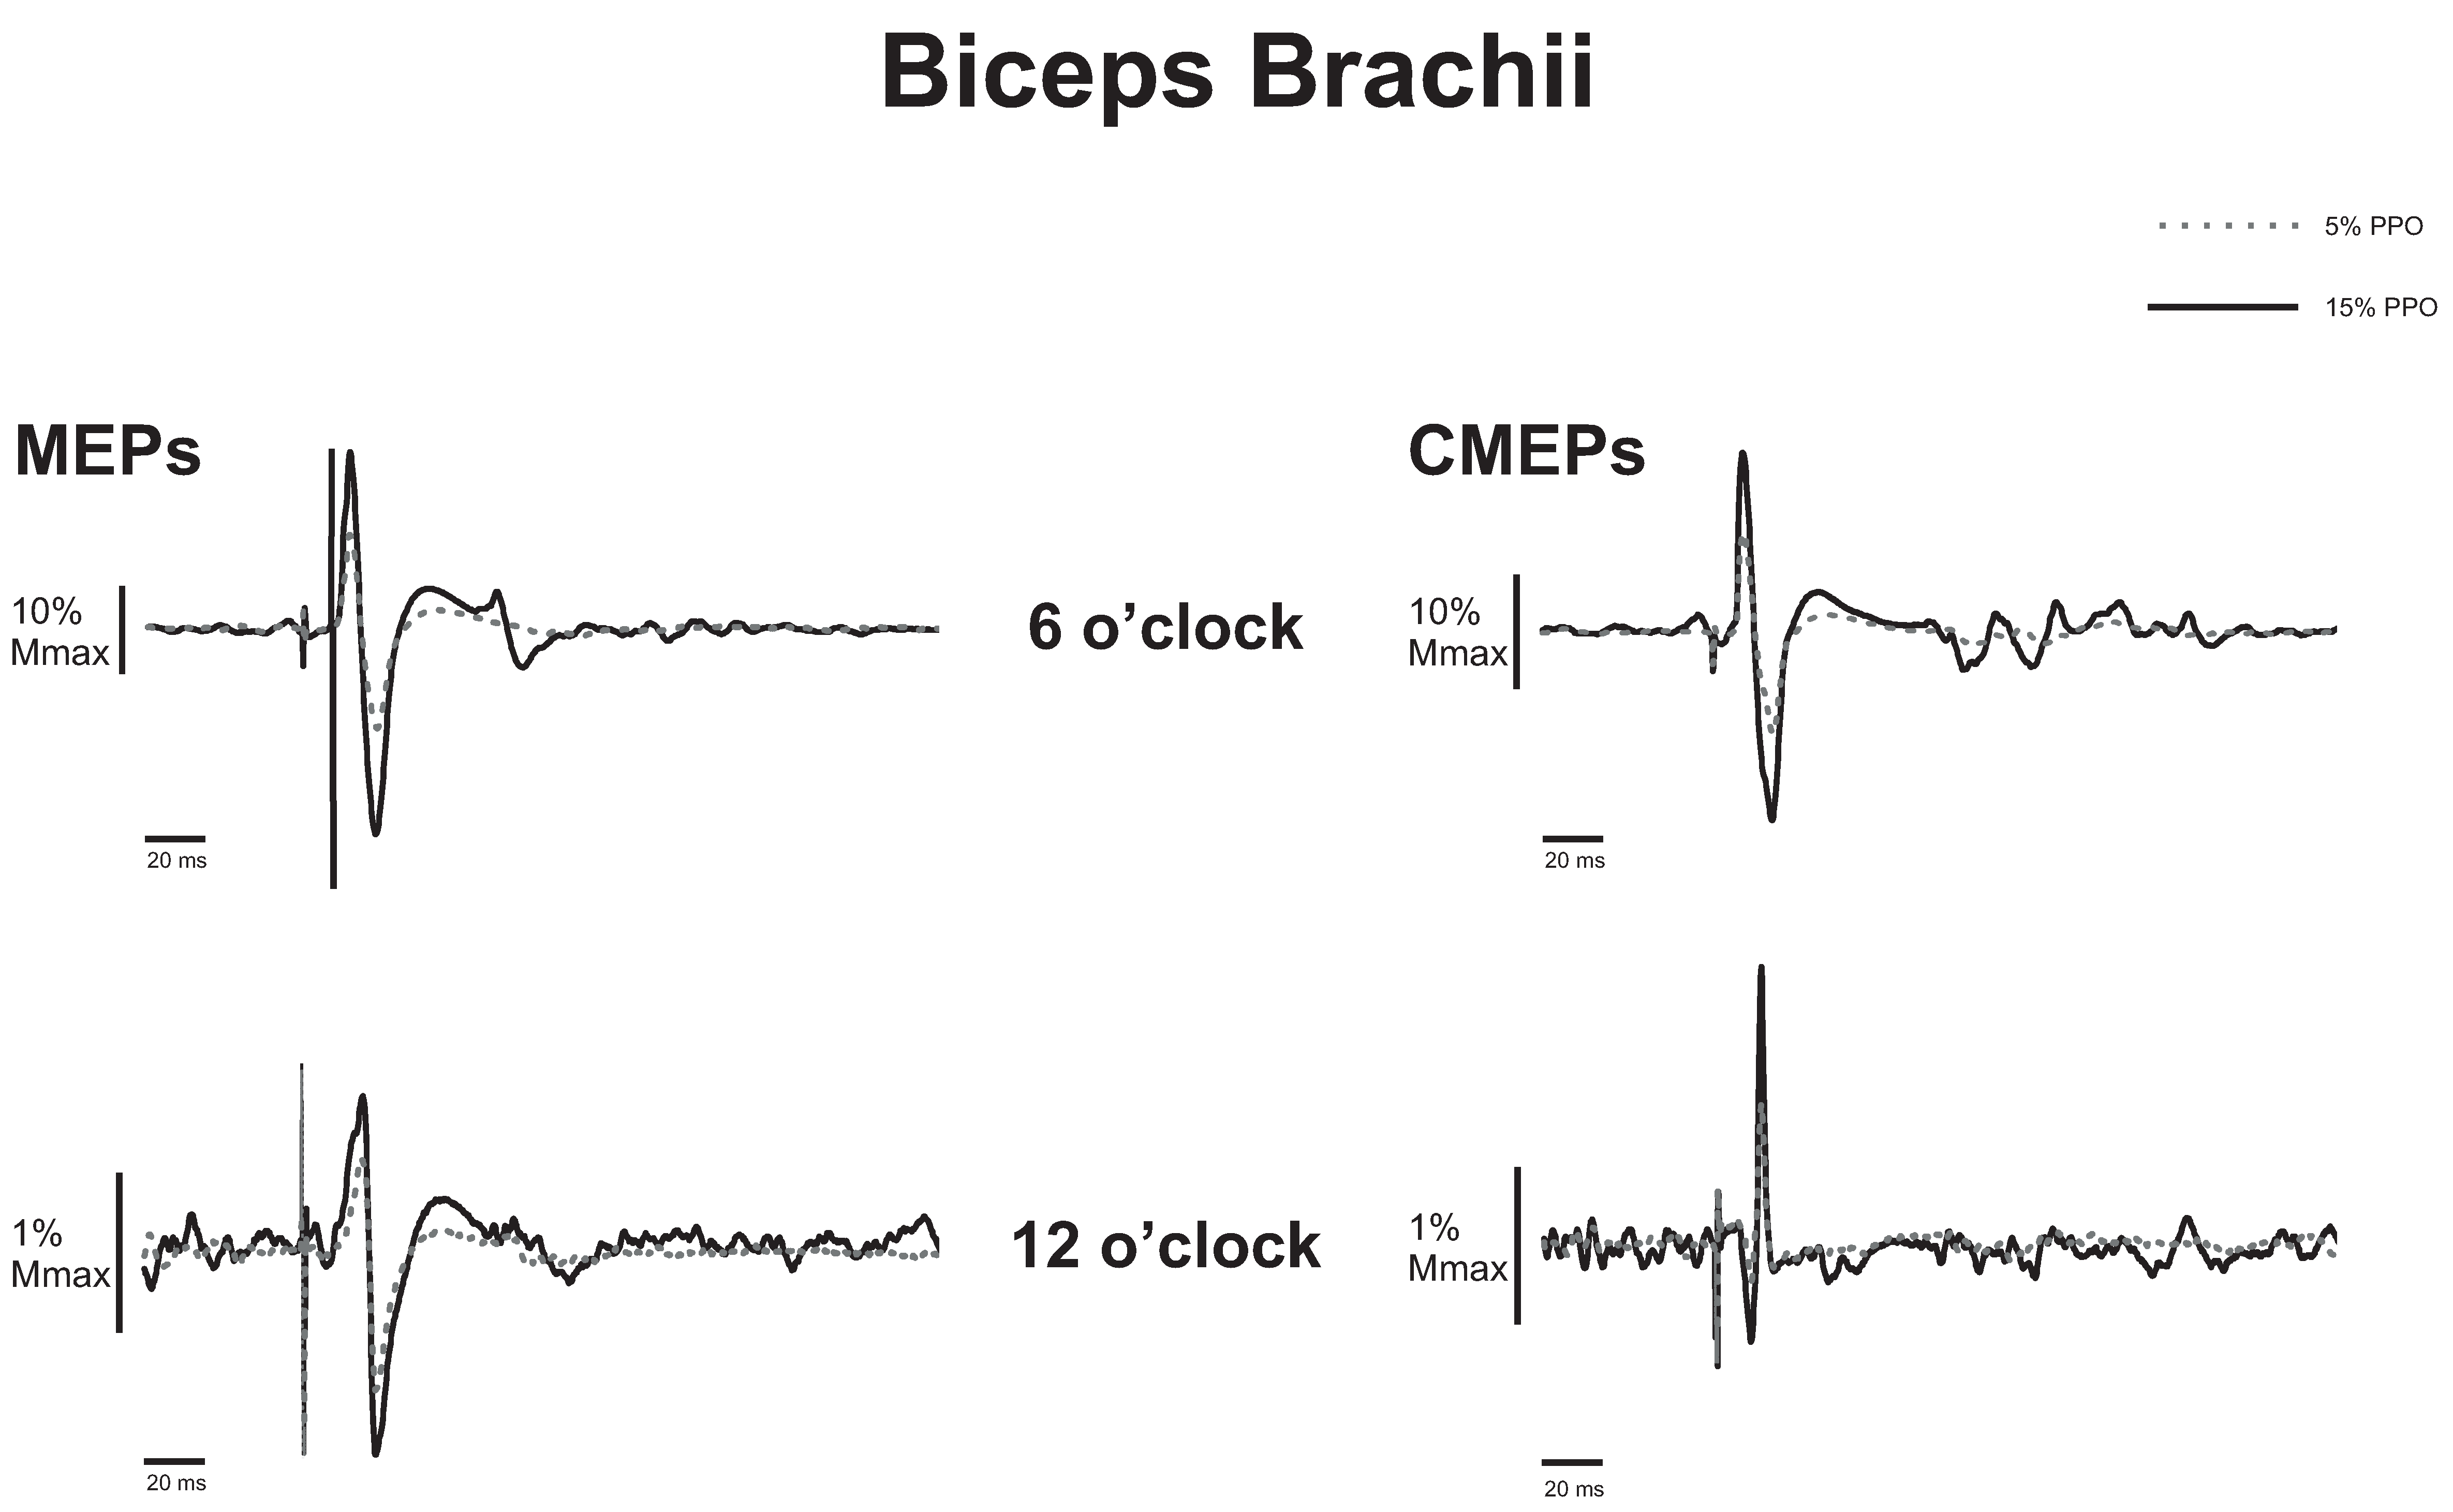
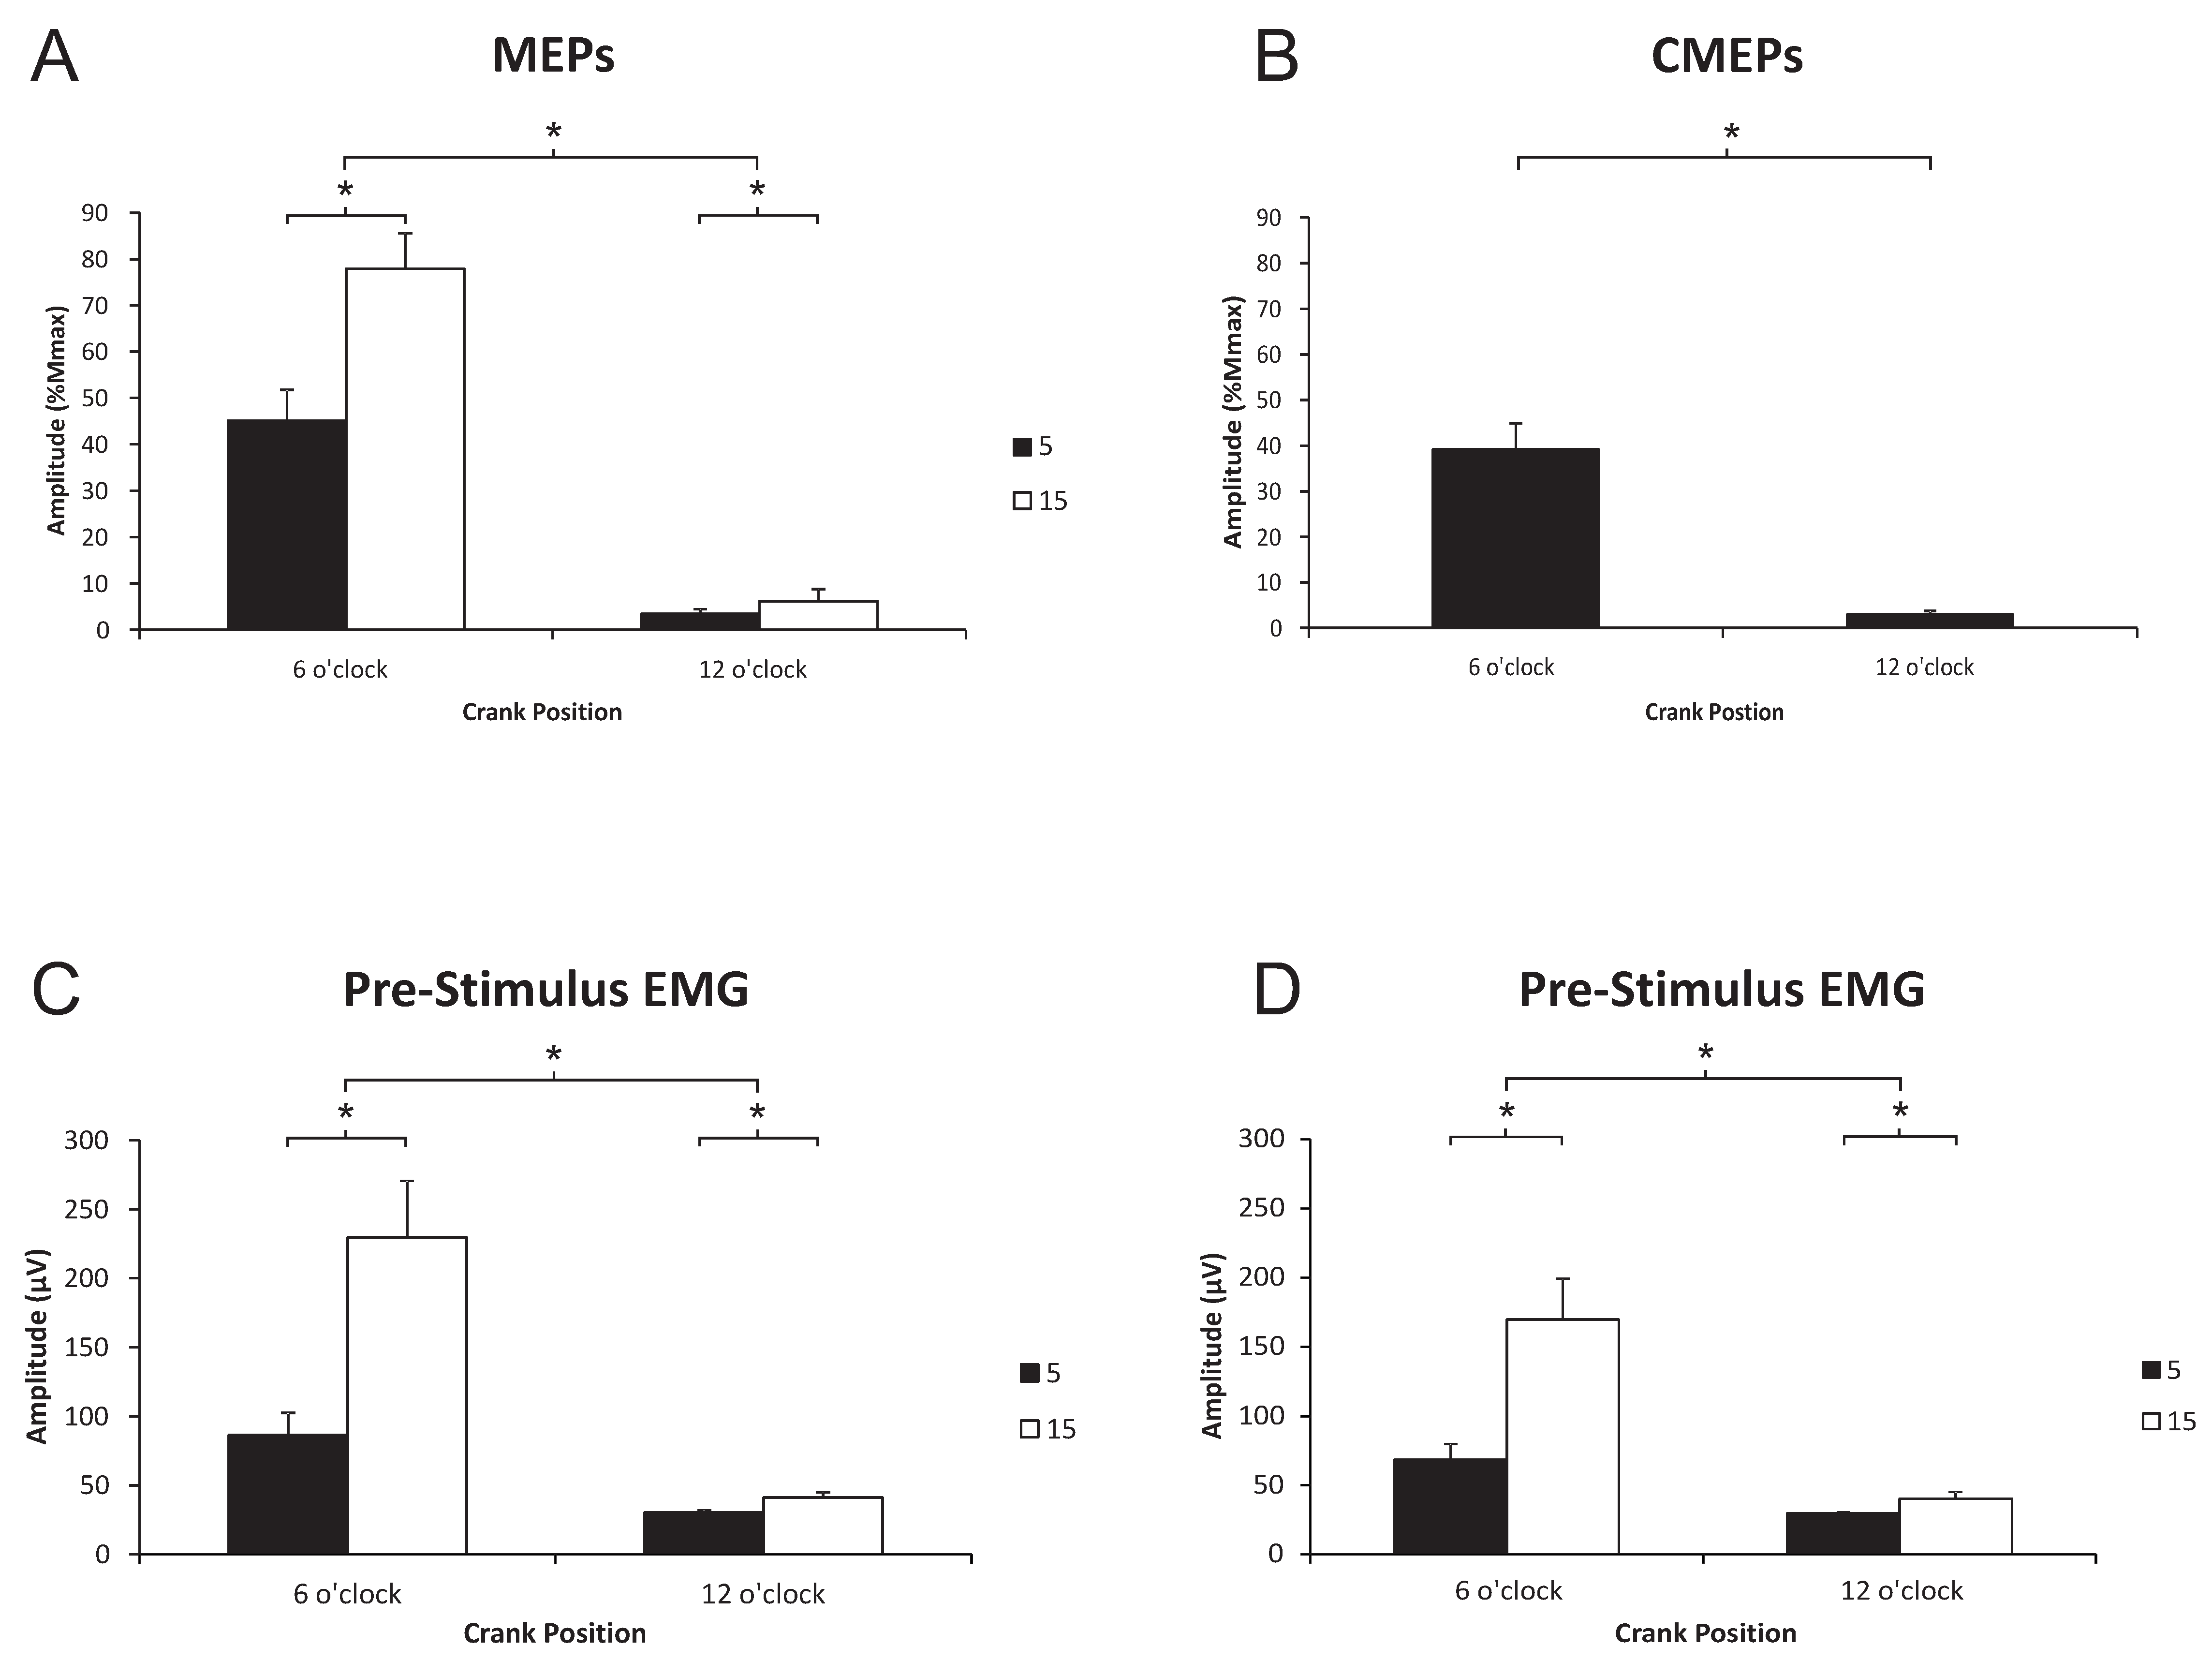
3.1. Biceps Brachii
3.1.1. Corticospinal Excitability to the Biceps Brachii during Arm Cycling
3.1.2. Spinal Excitability to the Biceps Brachii during Arm Cycling
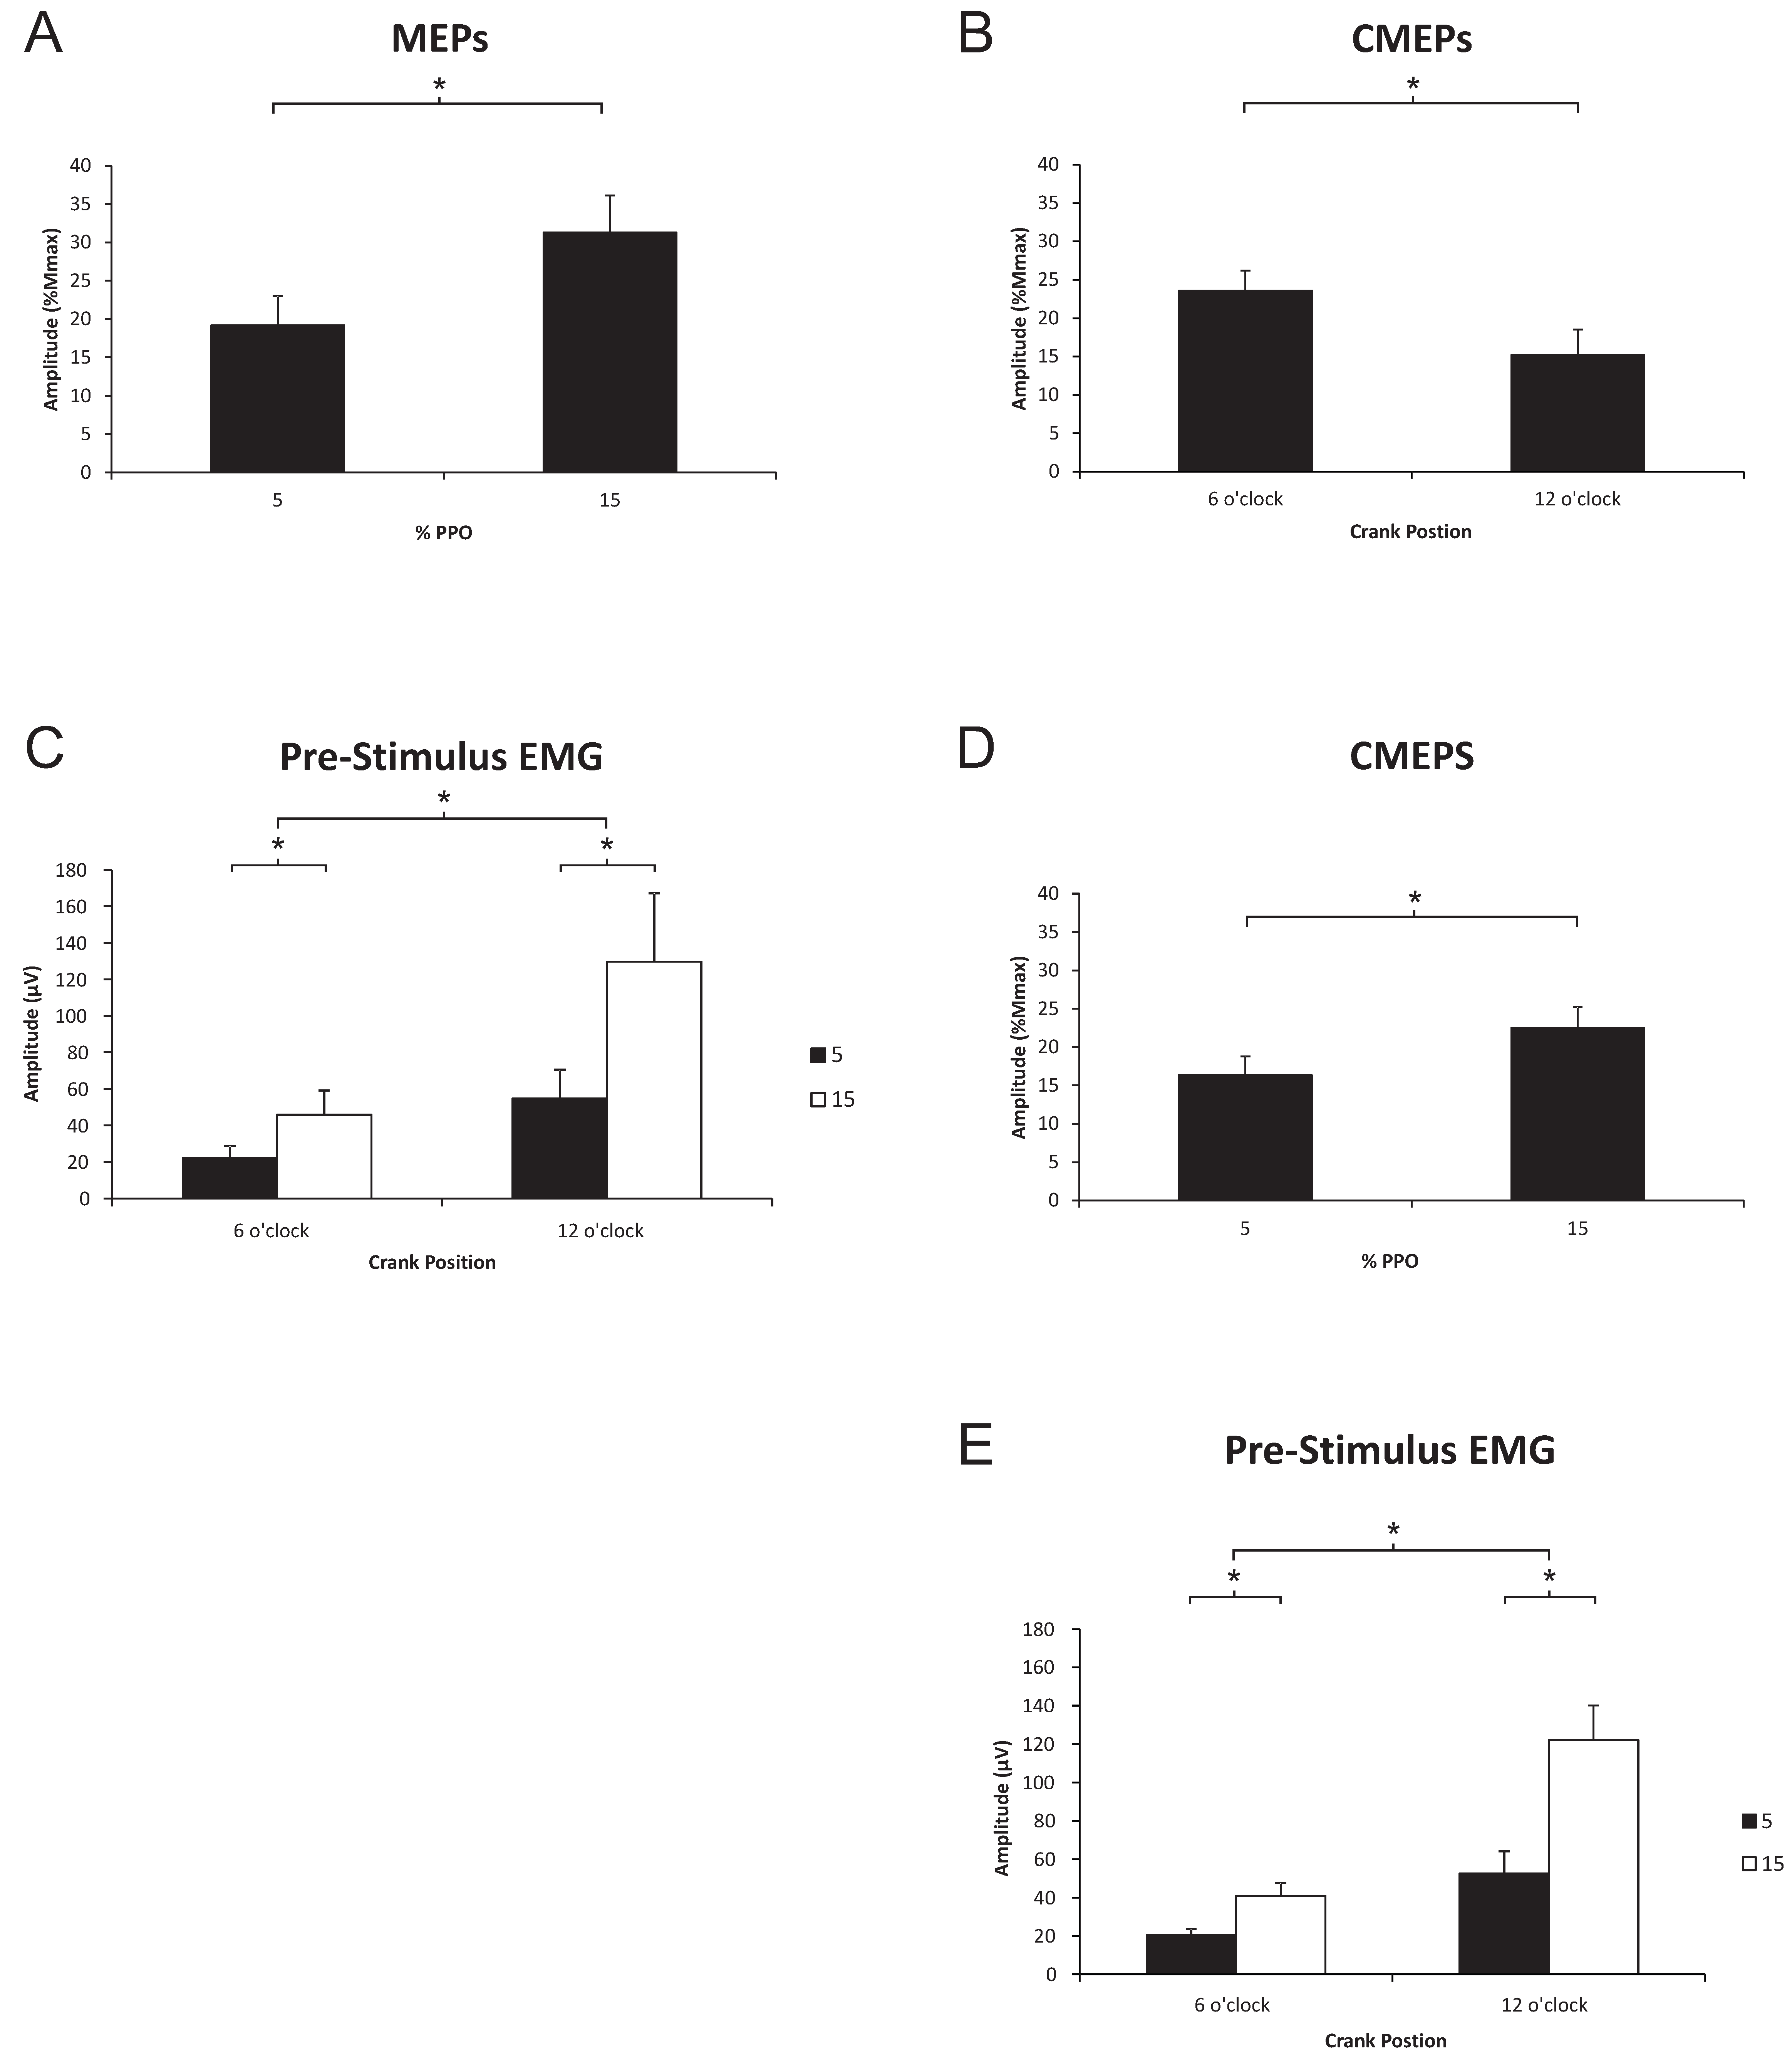
3.2. Triceps Brachii
3.2.1. Corticospinal Excitability to the Triceps Brachii during Arm Cycling
3.2.2. Spinal Excitability to the Triceps Brachii during Arm Cycling
4. Discussion
4.1. Phase-Dependent Modulation of Corticospinal and Spinal Excitability
4.2. Load-Dependent Modulation of Corticospinal and Spinal Excitability
5. Conclusions
Acknowledgments
Author Contributions
Conflicts of Interest
References
- Capaday, C.; Lavoie, B.A.; Barbeau, H.; Schneider, C.; Bonnard, M. Studies on the corticospinal control of human walking. I. Responses to focal transcranial magnetic stimulation of the motor cortex. J. Neurophysiol. 1999, 81, 129–139. [Google Scholar] [PubMed]
- Zehr, E.P.; Hundza, S.R.; Vasudevan, E.V. The quadrupedal nature of human bipedal locomotion. Exerc. Sport Sci. Rev. 2009, 37, 102–108. [Google Scholar] [CrossRef] [PubMed]
- Zehr, E.P.; Stein, R.B. What functions do reflexes serve during human locomotion? Prog. Neurobiol. 1999, 58, 185–205. [Google Scholar] [CrossRef]
- Pyndt, H.S.; Nielsen, J.B. Modulation of transmission in the corticospinal and group ia afferent pathways to soleus motoneurons during bicycling. J. Neurophysiol. 2003, 89, 304–314. [Google Scholar] [CrossRef] [PubMed]
- Carroll, T.J.; Baldwin, E.R.; Collins, D.F.; Zehr, E.P. Corticospinal excitability is lower during rhythmic arm movement than during tonic contraction. J. Neurophysiol. 2006, 95, 914–921. [Google Scholar] [CrossRef] [PubMed]
- Petersen, N.T.; Butler, J.E.; Marchand-Pauvert, V.; Fisher, R.; Ledebt, A.; Pyndt, H.S.; Hansen, N.L.; Nielsen, J.B. Suppression of EMG activity by transcranial magnetic stimulation in human subjects during walking. J. Physiol. 2001, 537, 651–656. [Google Scholar] [CrossRef] [PubMed] [Green Version]
- Sidhu, S.K.; Hoffman, B.W.; Cresswell, A.G.; Carroll, T.J. Corticospinal contributions to lower limb muscle activity during cycling in humans. J. Neurophysiol. 2012, 107, 306–314. [Google Scholar] [CrossRef] [PubMed]
- Forman, D.; Raj, A.; Button, D.C.; Power, K.E. Corticospinal excitability of the biceps brachii is higher during arm cycling than an intensity-matched tonic contraction. J. Neurophysiol. 2014, 112, 1142–1151. [Google Scholar] [CrossRef] [PubMed]
- Brooke, J.D.; Cheng, J.; Collins, D.F.; McIlroy, W.E.; Misiaszek, J.E.; Staines, W.R. Sensori-sensory afferent conditioning with leg movement: Gain control in spinal reflex and ascending paths. Prog. Neurobiol. 1997, 51, 393–421. [Google Scholar] [CrossRef]
- Zehr, E.P.; Collins, D.F.; Frigon, A.; Hoogenboom, N. Neural control of rhythmic human arm movement: Phase dependence and task modulation of Hoffmann reflexes in forearm muscles. J. Neurophysiol. 2003, 89, 12–21. [Google Scholar] [CrossRef] [PubMed]
- Zehr, E.P.; Chua, R. Modulation of human cutaneous reflexes during rhythmic cyclical arm movement. Exp. Brain Res. 2000, 135, 241–250. [Google Scholar] [CrossRef] [PubMed]
- Weavil, J.C.; Sidhu, S.K.; Mangum, T.S.; Richardson, R.S.; Amann, M. Intensity-dependent alterations in the excitability of cortical and spinal projections to the knee extensors during isometric and locomotor exercise. Am. J. Physiol. Regul. Integr. Comp. Physiol. 2015, 308, R998–R1007. [Google Scholar] [CrossRef] [PubMed]
- Sidhu, S.K.; Cresswell, A.G.; Carroll, T.J. Short-interval intracortical inhibition in knee extensors during locomotor cycling. Acta Physiol. 2013, 207, 194–201. [Google Scholar] [CrossRef] [PubMed]
- Forman, D.A.; Philpott, D.T.; Button, D.C.; Power, K.E. Differences in corticospinal excitability to the biceps brachii between arm cycling and tonic contraction are not evident at the immediate onset of movement. Exp. Brain Res. 2016, 234, 2339–2349. [Google Scholar] [CrossRef] [PubMed]
- Copithorne, D.B.; Forman, D.A.; Power, K.E. Premovement changes in corticospinal excitability of the biceps brachii are not different between arm cycling and an intensity-matched tonic contraction. Motor Control 2015, 19, 223–241. [Google Scholar] [CrossRef] [PubMed]
- Forman, D.A.; Philpott, D.T.; Button, D.C.; Power, K.E. Cadence-dependent changes in corticospinal excitability of the biceps brachii during arm cycling. J. Neurophysiol. 2015, 114, 2285–2294. [Google Scholar] [CrossRef] [PubMed]
- McNeil, C.J.; Butler, J.E.; Taylor, J.L.; Gandevia, S.C. Testing the excitability of human motoneurons. Front. Hum. Neurosci. 2013, 7, 152. [Google Scholar] [CrossRef] [PubMed]
- Pearcey, G.E.; Power, K.E.; Button, D.C. Differences in supraspinal and spinal excitability during various force outputs of the biceps brachii in chronic- and non-resistance trained individuals. PLoS ONE 2014, 9, e98468. [Google Scholar] [CrossRef] [PubMed]
- Taylor, J.L. Stimulation at the cervicomedullary junction in human subjects. J. Electromyogr. Kinesiol. 2006, 16, 215–223. [Google Scholar] [CrossRef] [PubMed]
- Zehr, E.P.; Carroll, T.J.; Chua, R.; Collins, D.F.; Frigon, A.; Haridas, C.; Hundza, S.R.; Thompson, A.K. Possible contributions of CPG activity to the control of rhythmic human arm movement. Can. J. Physiol. Pharmacol. 2004, 82, 556–568. [Google Scholar] [CrossRef] [PubMed]
- Rossi, S.; Hallett, M.; Rossini, P.M.; Pascual-Leone, A. Safety, ethical considerations, and application guidelines for the use of transcranial magnetic stimulation in clinical practice and research. Clin. Neurophysiol. 2009, 120, 2008–2039. [Google Scholar] [CrossRef] [PubMed]
- Veale, J.F. Edinburgh handedness inventory-short form: A revised version based on confirmatory factor analysis. Laterality 2014, 19, 164–177. [Google Scholar] [CrossRef] [PubMed]
- Daligadu, J.; Murphy, B.; Brown, J.; Rae, B.; Yielder, P. TMS stimulus-response asymmetry in left- and right-handed individuals. Exp. Brain Res. 2013, 224, 411–416. [Google Scholar] [CrossRef] [PubMed]
- Philpott, D.T.G.; Pearcey, G.E.P.; Forman, D.; Power, K.E.; Button, D.C. Chronic resistance training enhances the spinal excitability of the biceps brachii in the non-dominant arm at moderate contraction intensities. Neurosci. Lett. 2014, 585, 12–16. [Google Scholar] [CrossRef] [PubMed]
- Manning, C.D.; Bawa, P. Heteronymous reflex connections in human upper limb muscles in response to stretch of forearm muscles. J. Neurophysiol. 2011, 106, 1489–1499. [Google Scholar] [CrossRef] [PubMed]
- Nuzzo, J.L.; Trajano, G.S.; Barry, B.K.; Gandevia, S.C.; Taylor, J.L. Arm posture-dependent changes in corticospinal excitability are largely spinal in origin. J. Neurophysiol. 2016, 115, 2076–2082. [Google Scholar] [CrossRef] [PubMed]
- Power, K.E.; Copithorne, D.B. Increased corticospinal excitability prior to arm cycling is due to enhanced supraspinal but not spinal motoneurone excitability. Appl. Physiol. Nutr. Metab. 2013, 38, 1154–1161. [Google Scholar] [CrossRef] [PubMed]
- Forman, D.A.; Richards, M.; Forman, G.N.; Holmes, M.W.; Power, K.E. Changes in corticospinal and spinal excitability to the biceps brachii with a neutral vs. Pronated handgrip position differ between arm cycling and tonic elbow flexion. Front. Hum. Neurosci. 2016, 10, 543. [Google Scholar] [CrossRef] [PubMed]
- Crone, C.; Johnsen, L.L.; Hultborn, H.; Orsnes, G.B. Amplitude of the maximum motor response (Mmax) in human muscles typically decreases during the course of an experiment. Exp. Brain Res. 1999, 124, 265–270. [Google Scholar] [CrossRef] [PubMed]
- Katz, R.; Penicaud, A.; Rossi, A. Reciprocal Ia inhibition between elbow flexors and extensors in the human. J. Physiol. 1991, 437, 269–286. [Google Scholar] [CrossRef] [PubMed]
- Zehr, E.P.; Duysens, J. Regulation of arm and leg movement during human locomotion. Neuroscientist 2004, 10, 347–361. [Google Scholar] [CrossRef] [PubMed]
- Zehr, E.P.; Kido, A. Neural control of rhythmic, cyclical human arm movement: Task dependency, nerve specificity and phase modulation of cutaneous reflexes. J. Physiol. 2001, 537, 1033–1045. [Google Scholar] [CrossRef] [PubMed]
- Davidson, A.W.; Rice, C.L. Effect of shoulder angle on the activation pattern of the elbow extensors during a submaximal isometric fatiguing contraction. Muscle Nerve 2010, 42, 514–521. [Google Scholar] [CrossRef] [PubMed]
- Lee, R.H.; Heckman, C.J. Bistability in spinal motoneurons in vivo: Systematic variations in rhythmic firing patterns. J. Neurophysiol. 1998, 80, 572–582. [Google Scholar] [PubMed]
- Heckman, C.J.; Lee, R.H. The role of voltage-sensitive dendritic conductances in generating bistable firing patterns in motoneurons. J Physiol. Paris 1999, 93, 97–100. [Google Scholar] [CrossRef]
- Wilson, J.M.; Thompson, C.K.; Miller, L.C.; Heckman, C.J. Intrinsic excitability of human motoneurons in biceps brachii versus triceps brachii. J. Neurophysiol. 2015, 113, 3692–3699. [Google Scholar] [CrossRef] [PubMed]
- Hounsgaard, J.; Hultborn, H.; Jespersen, B.; Kiehn, O. Bistability of alpha-motoneurones in the decerebrate cat and in the acute spinal cat after intravenous 5-hydroxytryptophan. J. Physiol. 1988, 405, 345–367. [Google Scholar] [CrossRef] [PubMed]
- Cotel, F.; Antri, M.; Barthe, J.Y.; Orsal, D. Identified ankle extensor and flexor motoneurons display different firing profiles in the neonatal rat. J. Neurosci. 2009, 29, 2748–2753. [Google Scholar] [CrossRef] [PubMed]
- Hyngstrom, A.S.; Johnson, M.D.; Miller, J.F.; Heckman, C.J. Intrinsic electrical properties of spinal motoneurons vary with joint angle. Nat. Neurosci. 2007, 10, 363–369. [Google Scholar] [CrossRef] [PubMed]
- Brouwer, B.; Ashby, P. Corticospinal projections to upper and lower limb spinal motoneurons in man. Electroencephalogr. Clin. Neurophysiol. 1990, 76, 509–519. [Google Scholar] [CrossRef]
- Palmer, E.; Ashby, P. Corticospinal projections to upper limb motoneurones in humans. J. Physiol. 1992, 448, 397–412. [Google Scholar] [CrossRef] [PubMed]
- Power, K.E.; McCrea, D.A.; Fedirchuk, B. Intraspinally mediated state-dependent enhancement of motoneurone excitability during fictive scratch in the adult decerebrate cat. J. Physiol. 2010, 588, 2839–2857. [Google Scholar] [CrossRef] [PubMed]
- Krawitz, S.; Fedirchuk, B.; Dai, Y.; Jordan, L.M.; McCrea, D.A. State-dependent hyperpolarization of voltage threshold enhances motoneurone excitability during fictive locomotion in the cat. J. Physiol. 2001, 532, 271–281. [Google Scholar] [CrossRef] [PubMed]
- Brownstone, R.M.; Jordan, L.M.; Kriellaars, D.J.; Noga, B.R.; Shefchyk, S.J. On the regulation of repetitive firing in lumbar motoneurones during fictive locomotion in the cat. Exp. Brain Res. 1992, 90, 441–455. [Google Scholar] [CrossRef] [PubMed]
- Zehr, E.P. Neural control of rhythmic human movement: The common core hypothesis. Exerc. Sport Sci. Rev. 2005, 33, 54–60. [Google Scholar] [PubMed]
- Brownstone, R.M.; Bui, T.V. Spinal interneurons providing input to the final common path during locomotion. Prog. Brain Res. 2010, 187, 81–95. [Google Scholar] [PubMed]


© 2016 by the authors; licensee MDPI, Basel, Switzerland. This article is an open access article distributed under the terms and conditions of the Creative Commons Attribution (CC-BY) license (http://creativecommons.org/licenses/by/4.0/).
Share and Cite
Spence, A.-J.; Alcock, L.R.; Lockyer, E.J.; Button, D.C.; Power, K.E. Phase- and Workload-Dependent Changes in Corticospinal Excitability to the Biceps and Triceps Brachii during Arm Cycling. Brain Sci. 2016, 6, 60. https://doi.org/10.3390/brainsci6040060
Spence A-J, Alcock LR, Lockyer EJ, Button DC, Power KE. Phase- and Workload-Dependent Changes in Corticospinal Excitability to the Biceps and Triceps Brachii during Arm Cycling. Brain Sciences. 2016; 6(4):60. https://doi.org/10.3390/brainsci6040060
Chicago/Turabian StyleSpence, Alyssa-Joy, Lynsey R. Alcock, Evan J. Lockyer, Duane C. Button, and Kevin E. Power. 2016. "Phase- and Workload-Dependent Changes in Corticospinal Excitability to the Biceps and Triceps Brachii during Arm Cycling" Brain Sciences 6, no. 4: 60. https://doi.org/10.3390/brainsci6040060