A Pilot Study on Brain Plasticity of Functional Connectivity Modulated by Cognitive Training in Mild Alzheimer’s Disease and Mild Cognitive Impairment

 , ,
, ,
Abstract
:1. Introduction
- (1)
- Cognitive changes, measured with NPS tests, after a period of CT vs. a period of AC in memory, executive functions and attentional abilities;
- (2)
- Functional brain changes of the DMN, measured with RS-fMRI, after a period of CT vs. a period of AC;
- (3)
- Functional connectomics brain changes, measured with RS-fMRI, in the coupling between pairs of brain regions of the whole brain and in global and local topological properties of large-scale brain networks through graph theoretical approach after a period of CT and, separately, after a period of AC.
2. Methods
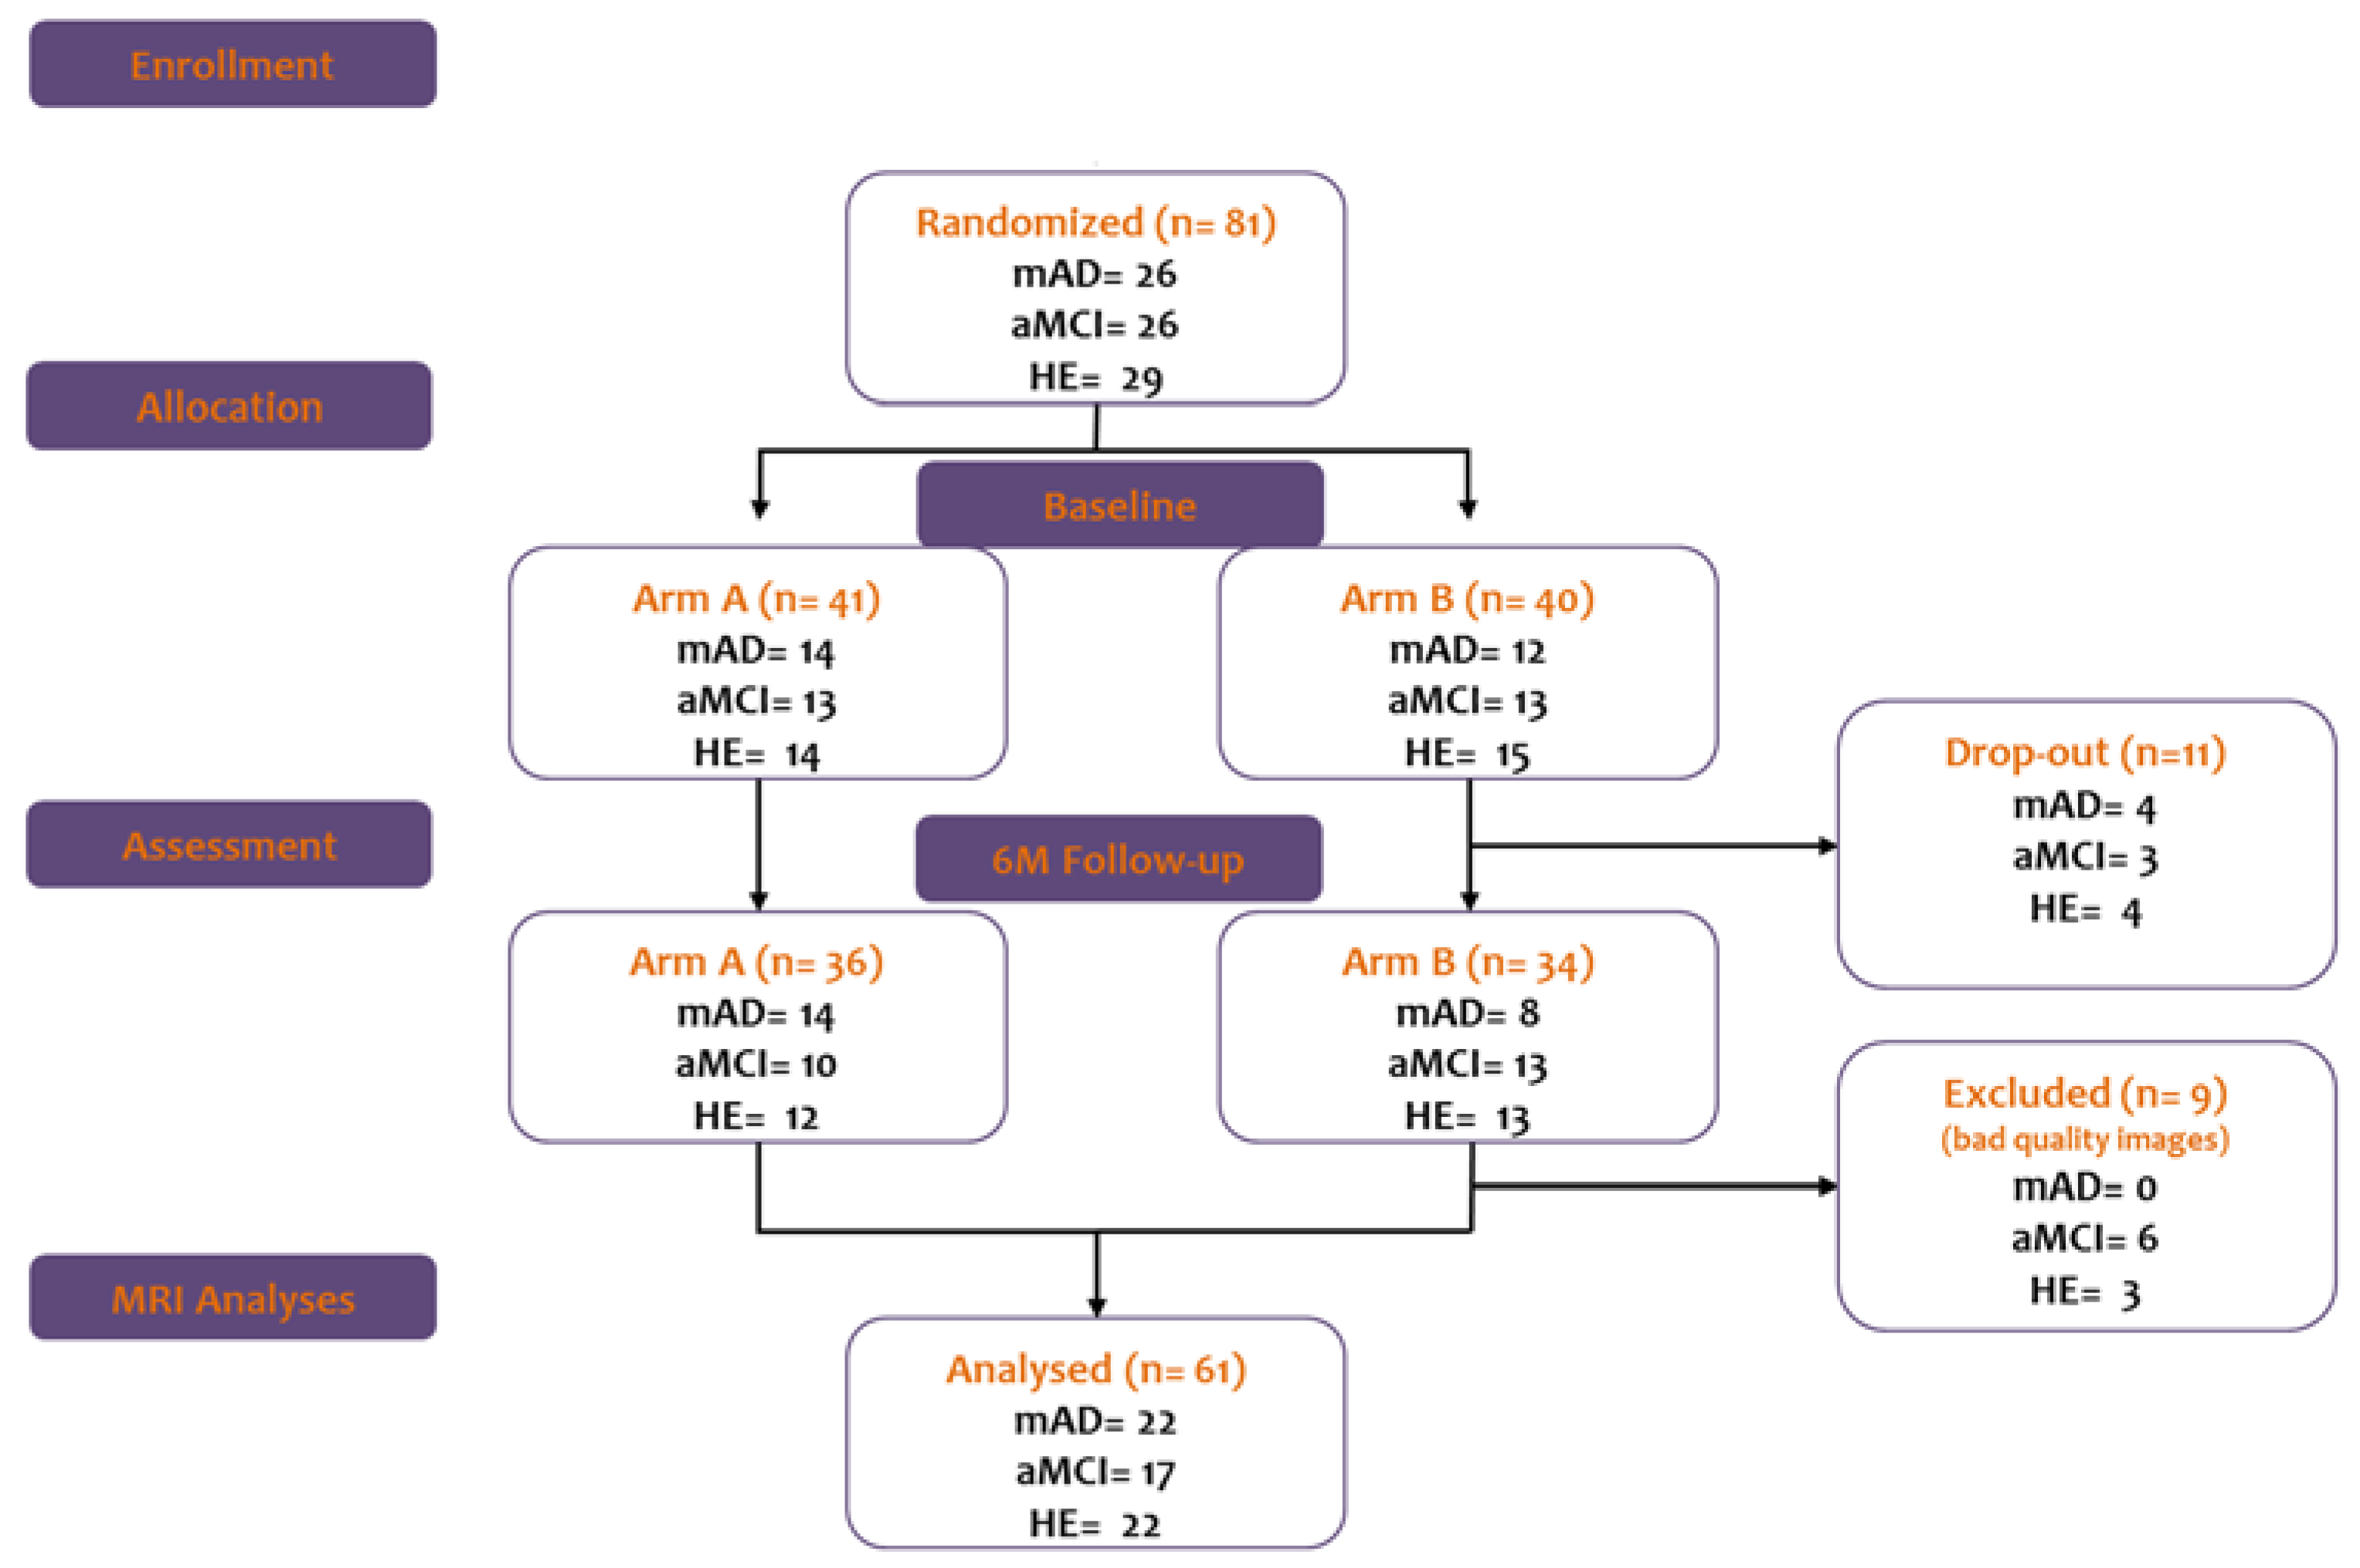
2.1. Participants
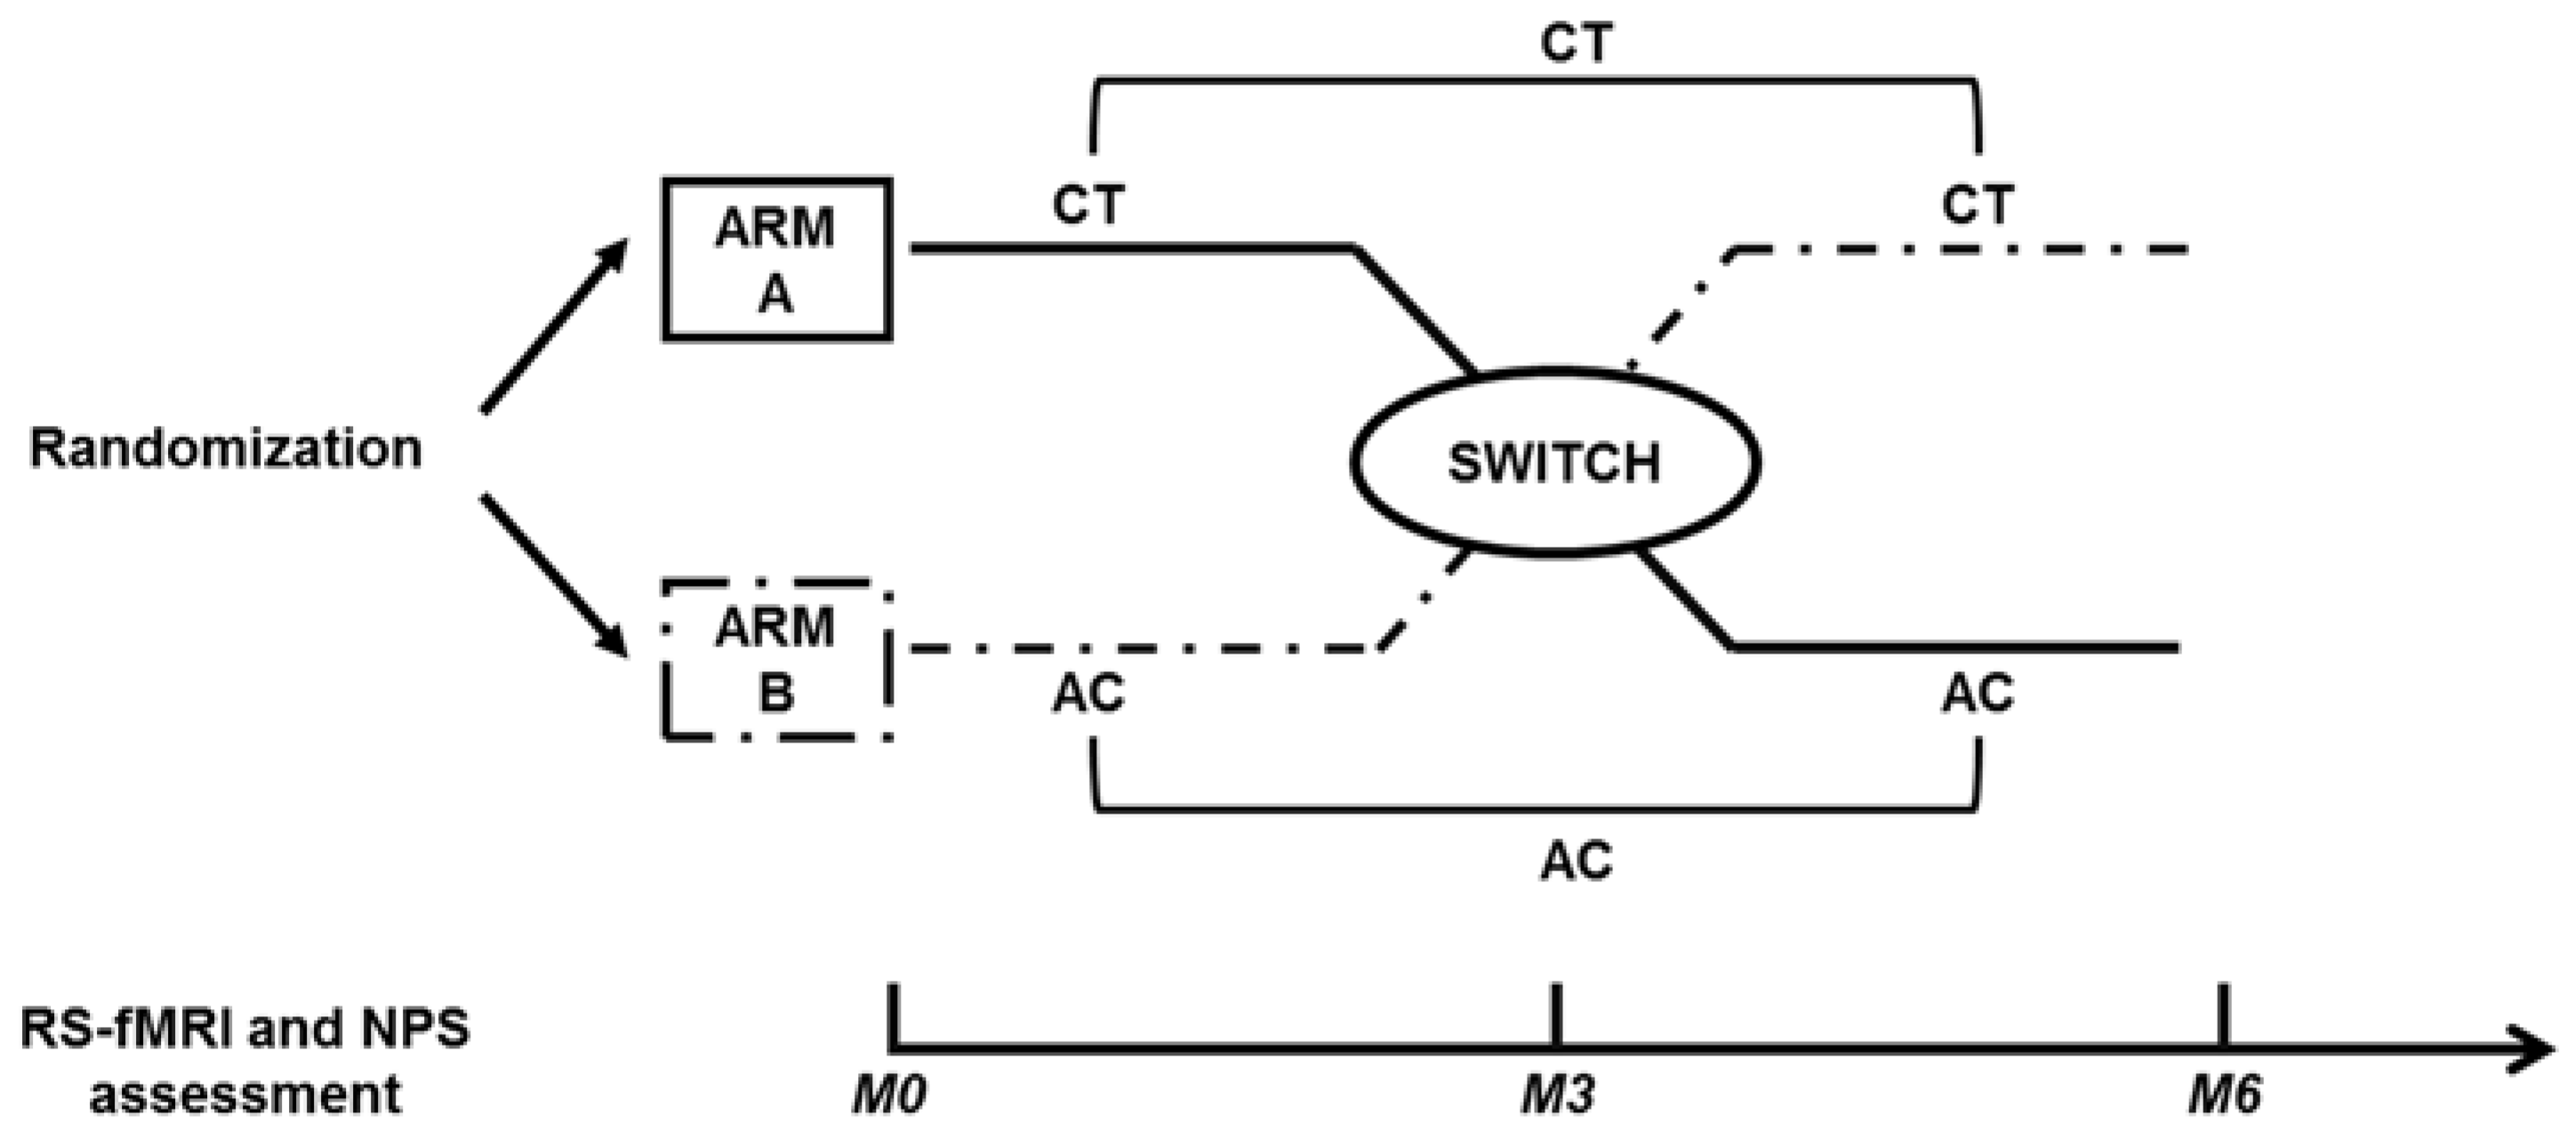
2.2. Study Design
2.3. Cognitive Treatment and Active Control
2.4. Cognitive Outcomes
2.5. RS-fMRI Outcomes
2.5.1. RS-fMRI Image Acquisition
2.5.2. RS-fMRI Images Pre-Processing
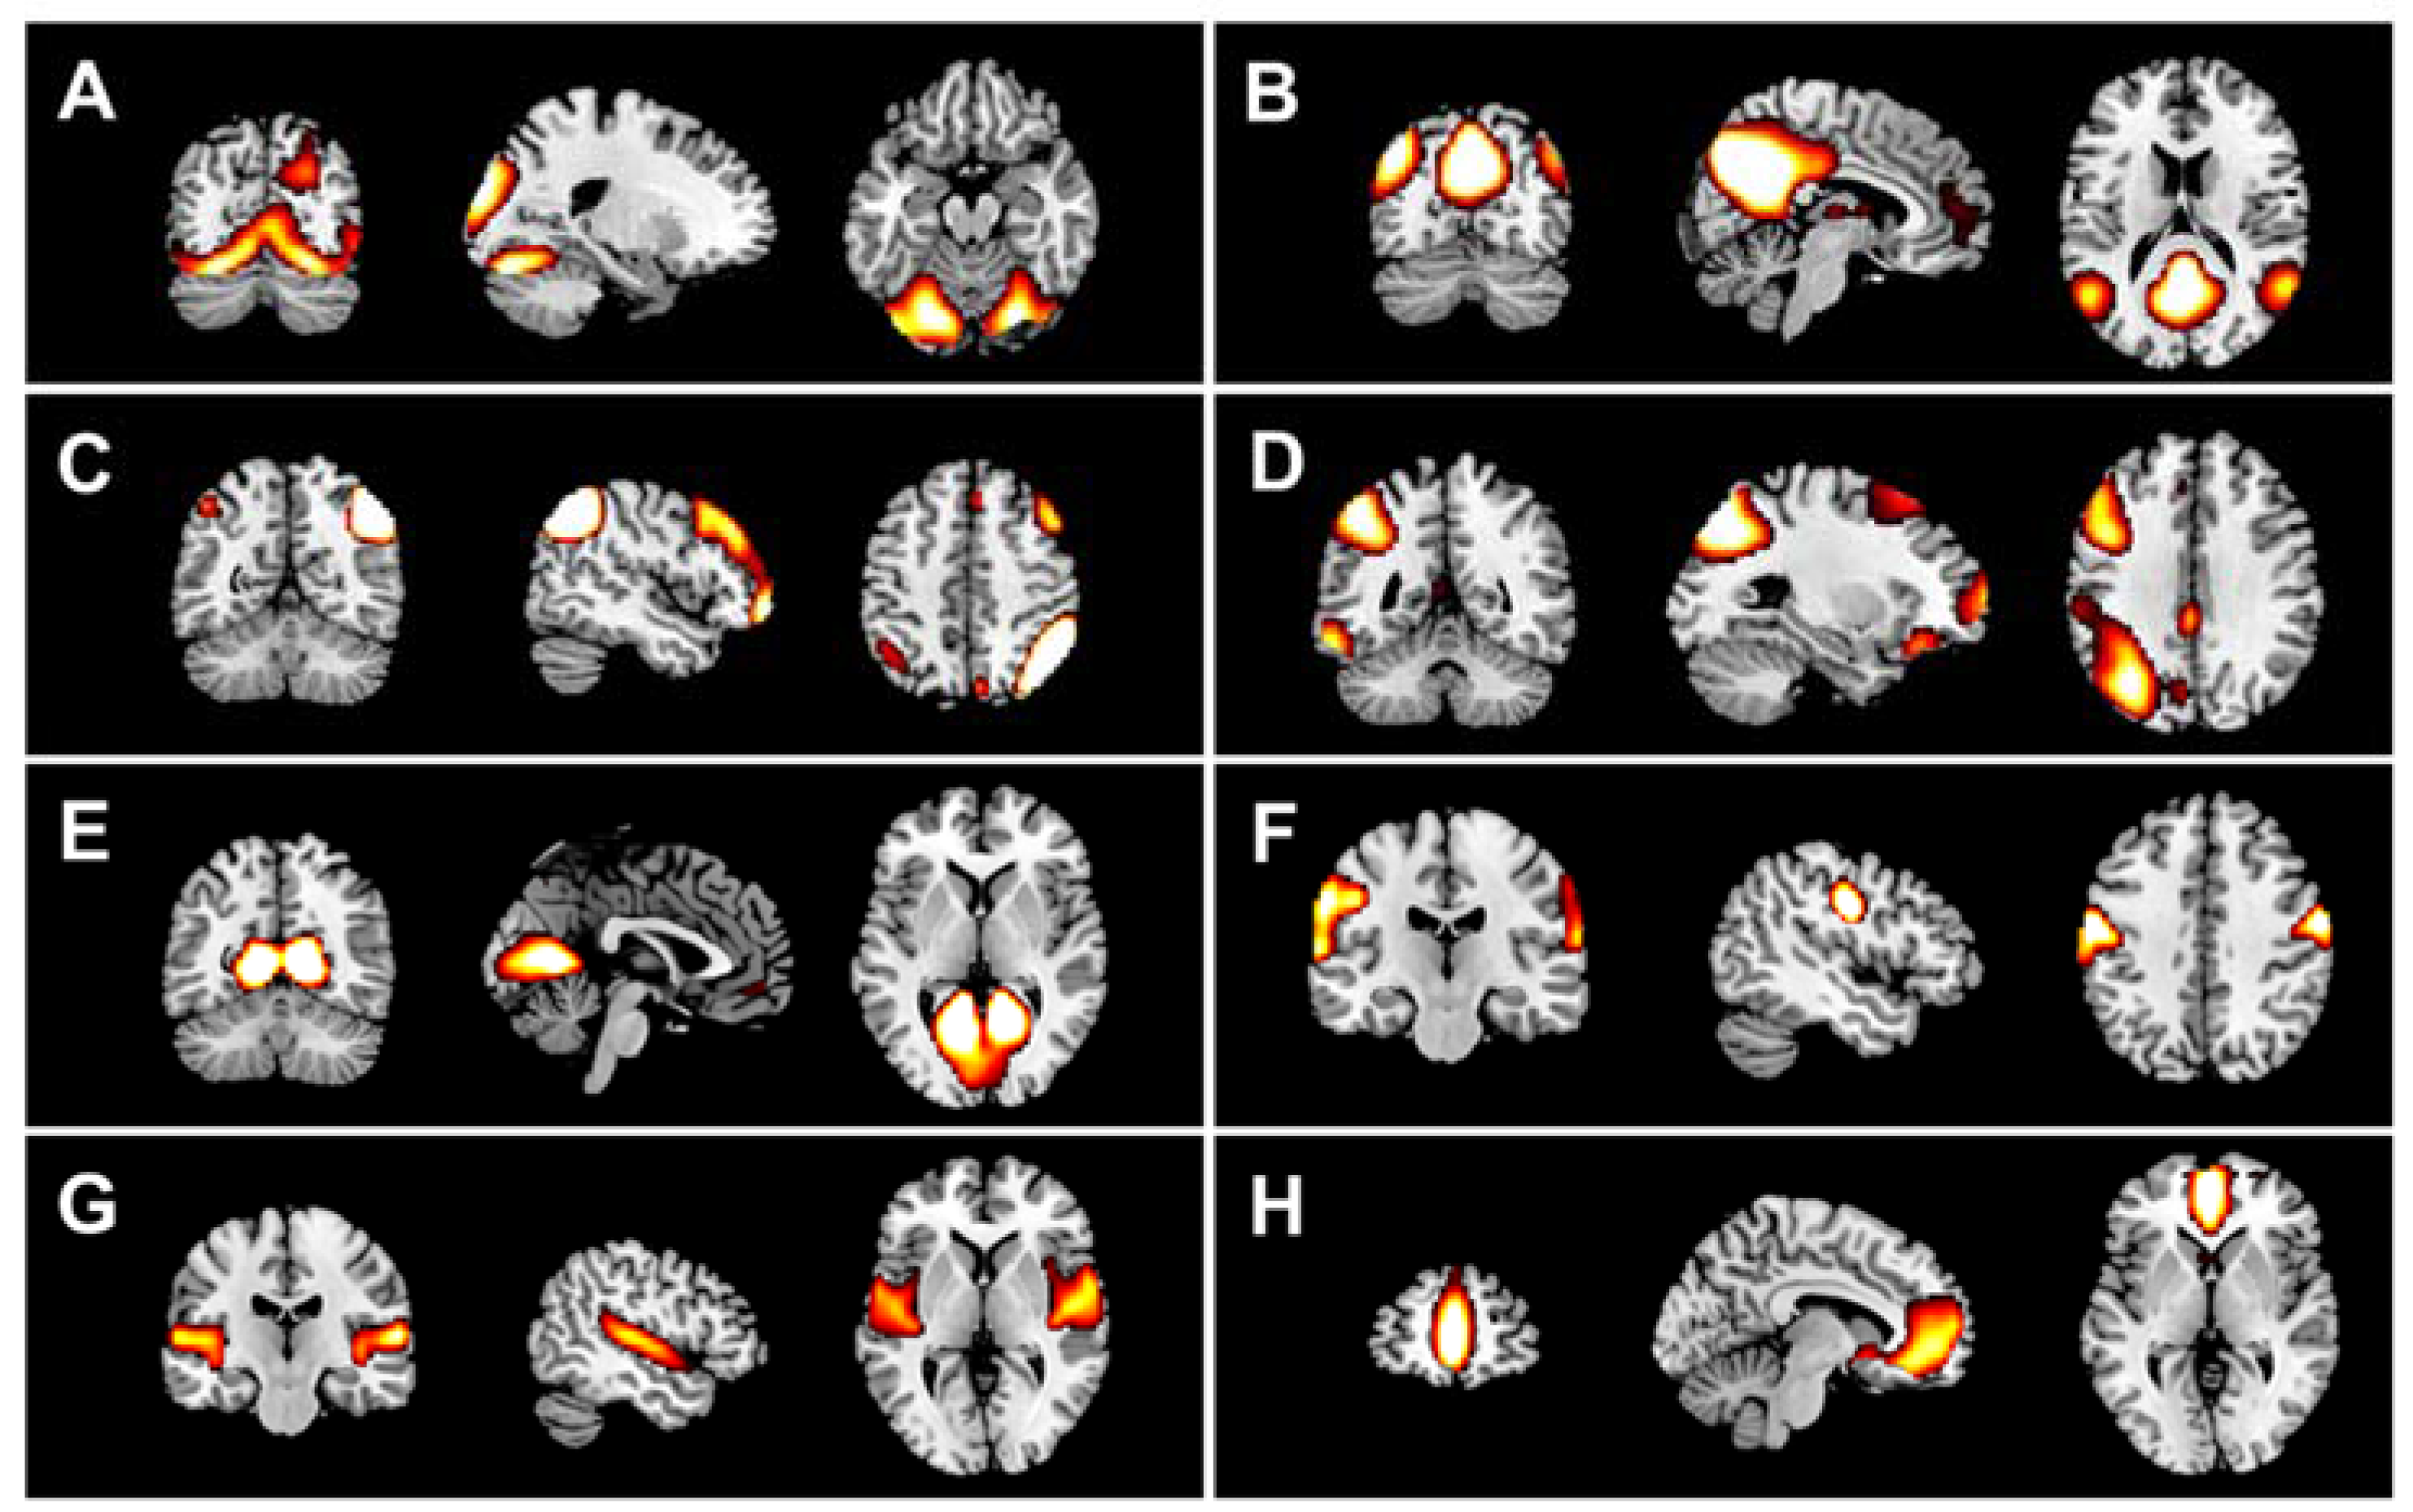
2.6. DMN Extraction
2.7. Construction of Connectivity Matrices
2.8. Graph Analyses: Extraction of Local and Global Metrics
2.9. Statistical Analyses
3. Results
3.1. Cognitive Outcomes
3.2. Neuroimaging Outcomes
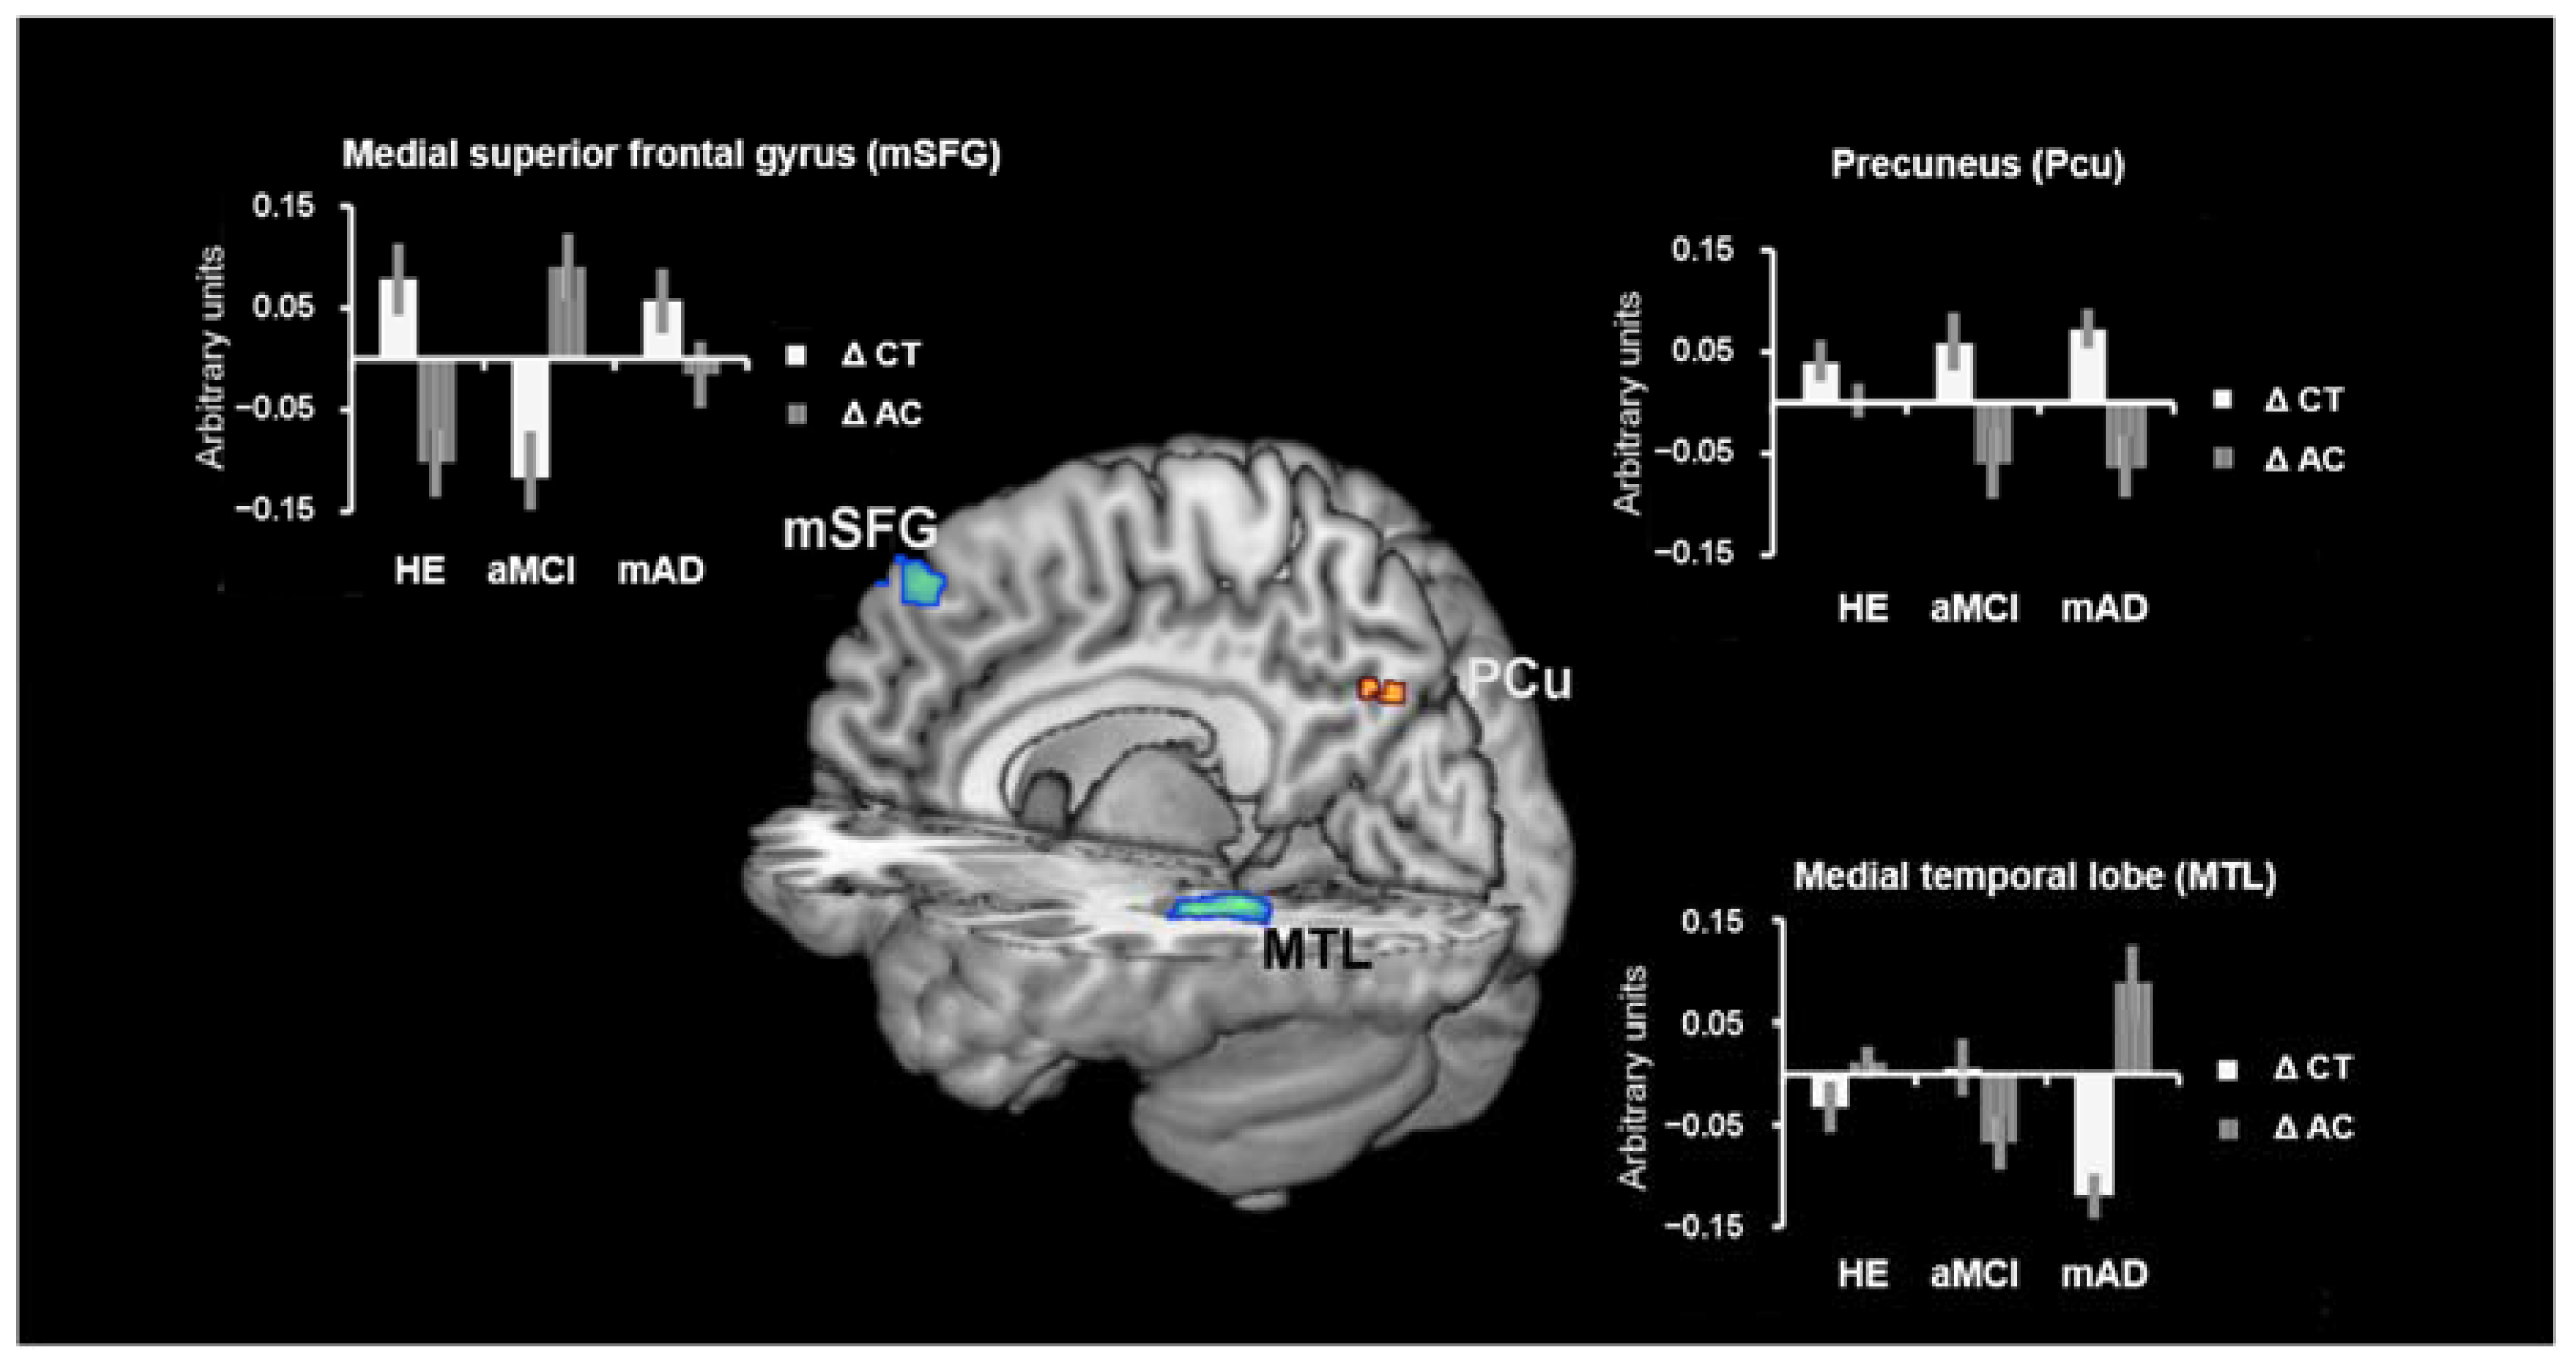
3.2.1. DMN Analyses
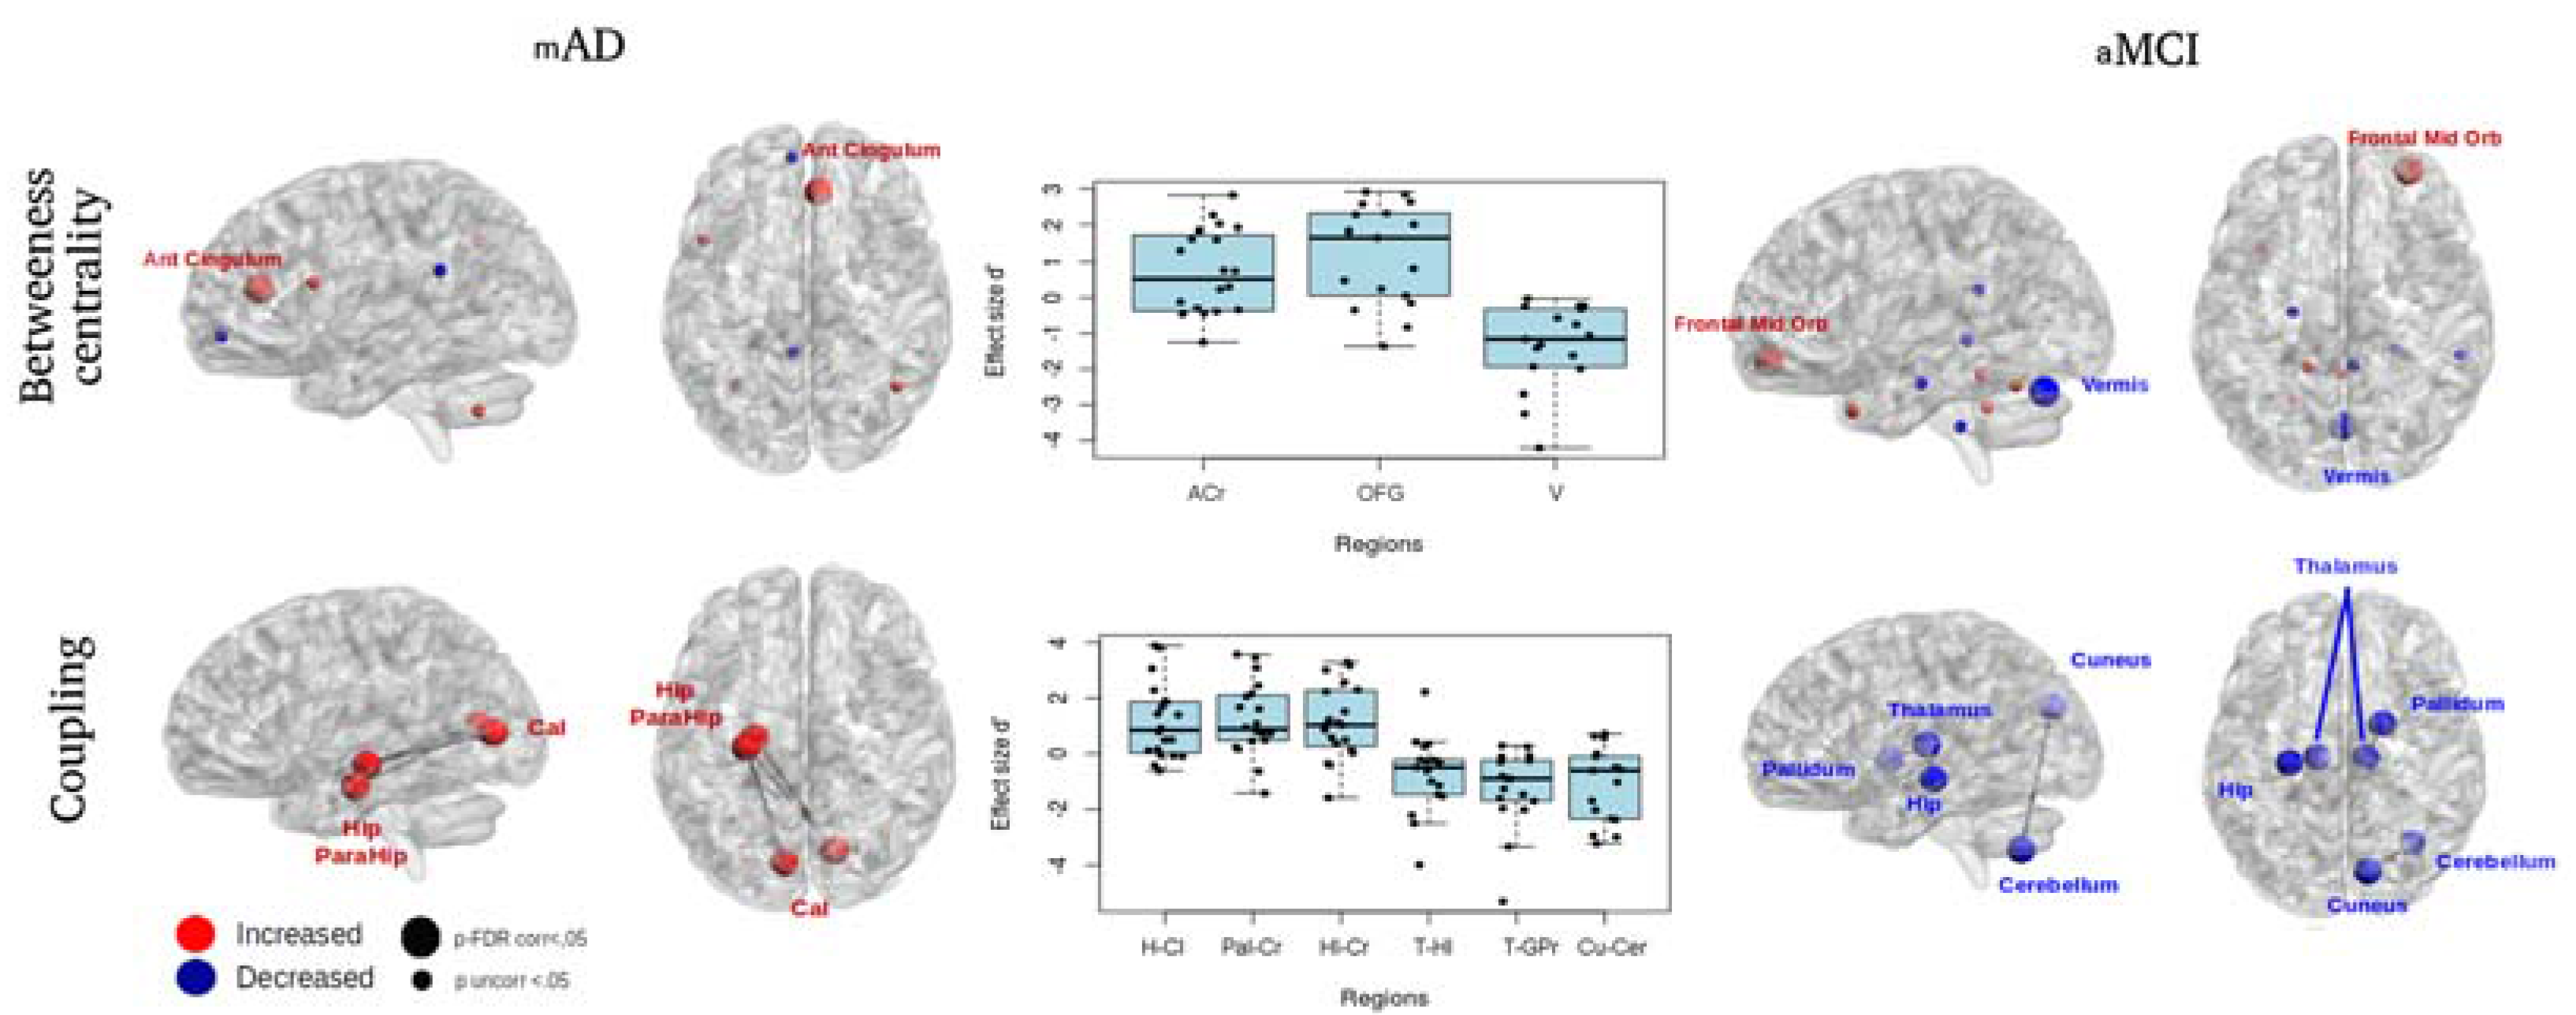
3.2.2. Connectomics Analyses
4. Discussion
5. Conclusions
Acknowledgments
Author Contributions
Conflicts of Interest
Appendix A

| Exercise | Contents | Objective of Training |
|---|---|---|
| Memory | ||
| Person–name learning | The user is presented with pictures of people associated with a name and is asked to memorize their names. After a distracting visual–spatial attentional task, the same pictures are represented but their names might be correct or switched with one of the others. The user has to indicate whether the name associated with each face is correct or not. | Declarative episodic long-term visual–spatial memory |
| Executive functions | ||
| Remember the sequence. | The user is asked to remember an increasing sequence of images placed on an n × n grid forming a path. At the same time, he must press a button each time an item from a target category is presented (e.g., animals). | Working memory |

References
- Alzheimer’s Association. 2015 Alzheimer’s Disease Facts and Figures. Alzheimers Dement. 2015, 11, 332–384. [Google Scholar]
- Serra, L.; Cercignani, M.; Mastropasqua, C.; Torso, M.; Spanò, B.; Makovac, E.; Viola, V.; Giulietti, G.; Marra, C.; Caltagirone, C.; et al. Longitudinal Changes in Functional Brain Connectivity Predicts Conversion to Alzheimer’s Disease. J. Alzheimers Dis. 2016, 51, 377–389. [Google Scholar] [CrossRef] [PubMed]
- Damoiseaux, J.S.; Prater, K.E.; Miller, B.L.; Greicius, M.D. Functional connectivity tracks clinical deterioration in Alzheimer’s disease. Neurobiol. Aging 2012, 33, 828.e19–828.e30. [Google Scholar] [CrossRef] [PubMed]
- Mevel, K.; Chételat, G.; Eustache, F.; Desgranges, B. The default mode network in healthy aging and Alzheimer’s disease. Int. J. Alzheimers Dis. 2011, 2011, 535816. [Google Scholar] [CrossRef] [PubMed]
- Gili, T.; Cercignani, M.; Serra, L.; Perri, R.; Giove, F.; Maraviglia, B.; Caltagirone, C.; Bozzali, M. Regional brain atrophy and functional disconnection across Alzheimer’s disease evolution. J. Neurol. Neurosurg. Psychiatry 2011, 82, 58–66. [Google Scholar] [CrossRef] [PubMed]
- Li, X.; Li, T.Q.; Andreasen, N.; Wiberg, M.K.; Westman, E.; Wahlund, L.O. The association between biomarkers in cerebrospinal fluid and structural changes in the brain in patients with Alzheimer’s disease. J. Intern. Med. 2014, 275, 418–427. [Google Scholar] [CrossRef] [PubMed]
- Mormino, E.C.; Smiljic, A.; Hayenga, A.O.; Onami, S.H.; Greicius, M.D.; Rabinovici, G.D.; Janabi, M.; Baker, S.L.; Yen, I.V.; Madison, C.M.; et al. Relationships between β-amyloid and functional connectivity in different components of the default mode network in aging. Cereb. Cortex 2011, 21, 2399–2407. [Google Scholar] [CrossRef] [PubMed]
- Buckner, R.L.; Andrews-Hanna, J.R.; Schacter, D.L. The brain’s default network: Anatomy, function, and relevance to disease. Ann. N. Y. Acad. Sci. 2008, 1124, 1–38. [Google Scholar] [CrossRef] [PubMed]
- Castellazzi, G.; Palesi, F.; Casali, S.; Vitali, P.; Sinforiani, E.; Wheeler-Kingshott, C.A.; D’Angelo, E. A comprehensive assessment of resting state networks: Bidirectional modification of functional integrity in cerebro-cerebellar networks in dementia. Front. Neurosci. 2014, 8, 223. [Google Scholar] [CrossRef] [PubMed]
- Seeley, W.W.; Crawford, R.K.; Zhou, J.; Miller, B.L.; Greicius, M.D. Neurodegenerative diseases target large-scale human brain networks. Neuron 2009, 62, 42–52. [Google Scholar] [CrossRef] [PubMed]
- Zhou, B.; Nakatani, E.; Teramukai, S.; Nagai, Y.; Fukushima, M. Alzheimer’s Disease Neuroimaging Initiative. Risk classification in mild cognitive impairment patients for developing Alzheimer’s disease. J. Alzheimers Dis. 2012, 30, 367–375. [Google Scholar] [PubMed]
- Massoud, F.; Léger, G.C. Pharmacological treatment of Alzheimer disease. Can. J. Psychiatry 2011, 56, 579–588. [Google Scholar] [CrossRef] [PubMed]
- Kelly, C.; Foxe, J.J.; Garavan, H. Patterns of normal human brain plasticity after practice and their implications for neurorehabilitation. Arch. Phys. Med. Rehabil. 2006, 87, S20–S29. [Google Scholar] [CrossRef] [PubMed]
- Lampit, A.; Hallock, H.; Valenzuela, M. Computerized Cognitive Training in Cognitively Healthy Older Adults: A Systematic Review and Meta-Analysis of Effect Modifiers. PLoS Med. 2014, 11, e1001756. [Google Scholar] [CrossRef] [PubMed]
- Coyle, H.; Traynor, V.; Solowij, N. Computerized and virtual reality cognitive training for individuals at high risk of cognitive decline: Systematic review of the literature. Am. J. Geriatr. Psychiatry 2015, 23, 335–359. [Google Scholar] [CrossRef] [PubMed]
- Hill, N.T.; Mowszowski, L.; Naismith, S.L.; Chadwick, V.L.; Valenzuela, M.; Lampit, A. Computerized Cognitive Training in Older Adults with Mild Cognitive Impairment or Dementia: A Systematic Review and Meta-Analysis. Am. J. Psychiatry 2016, 174, 329–340. [Google Scholar] [CrossRef] [PubMed]
- Bamidis, P.D.; Vivas, A.B.; Styliadis, C.; Frantzidis, C.; Klados, M.; Schlee, W.; Siountas, A.; Papageorgiou, S.G. A review of physical and cognitive interventions in aging. Neurosci. Biobehav. Rev. 2014, 44, 206–220. [Google Scholar] [CrossRef] [PubMed]
- Van Paasschen, J.; Clare, L.; Yuen, K.S.; Woods, R.T.; Evans, S.J.; Parkinson, C.H.; Rugg, M.D.; Linden, D.E. Cognitive rehabilitation changes memory-related brain activity in people with Alzheimer disease. Neurorehabil. Neural Repair 2013, 27, 448–459. [Google Scholar] [CrossRef] [PubMed]
- Hosseini, S.M.; Kramer, J.H.; Kesler, S.R. Neural correlates of cognitive intervention in persons at risk of developing Alzheimer’s disease. Front. Aging Neurosci. 2014, 6, 231. [Google Scholar] [CrossRef] [PubMed]
- Hampstead, B.M.; Stringer, A.Y.; Stilla, R.F.; Deshpande, G.; Hu, X.; Moore, A.B.; Sathian, K. Activation and effective connectivity changes following explicit-memory training for face-name pairs in patients with mild cognitive impairment: A pilot study. Neurorehabil. Neural Repair 2011, 25, 210–222. [Google Scholar] [CrossRef] [PubMed]
- Damoiseaux, J.S.; Rombouts, S.A.; Barkhof, F.; Scheltens, P.; Stam, C.J.; Smith, S.M.; Beckmann, C.F. Consistent resting-state networks across healthy subjects. Proc. Natl. Acad. Sci. USA 2006, 103, 13848–13853. [Google Scholar] [CrossRef] [PubMed]
- Styliadis, C.; Kartsidis, P.; Paraskevopoulos, E.; Ioannides, A.A.; Bamidis, P.D. Neuroplastic effects of combined computerized physical and cognitive training in elderly individuals at risk for dementia: An eLORETA controlled study on resting states. Neural Plast. 2015, 2015, 172192. [Google Scholar] [CrossRef] [PubMed]
- Cao, W.; Cao, X.; Hou, C.; Li, T.; Cheng, Y.; Jiang, L.; Luo, C.; Li, C.; Yao, D. Effects of Cognitive Training on Resting-State Functional Connectivity of Default Mode, Salience, and Central Executive Networks. Front. Aging Neurosci. 2016, 8, 70. [Google Scholar] [CrossRef] [PubMed]
- Kraft, E. Cognitive function, physical activity, and aging: Possible biological links and implications for multimodal interventions. Neuropsychol. Dev. Cogn. B Aging Neuropsychol. Cogn. 2012, 19, 248–263. [Google Scholar] [CrossRef] [PubMed]
- Zalesky, A.; Fornito, A.; Bullmore, E.T. Network-based statistic: Identifying differences in brain networks. Neuroimage 2010, 53, 1197–1207. [Google Scholar] [CrossRef] [PubMed]
- Bullmore, E.; Sporns, O. Complex brain networks: Graph theoretical analysis of structural and functional systems. Nat. Rev. Neurosci. 2009, 10, 186–198. [Google Scholar] [CrossRef] [PubMed]
- Rubinov, M.; Sporns, O. Complex network measures of brain connectivity: Uses and interpretations. Neuroimage 2010, 52, 1059–1069. [Google Scholar] [CrossRef] [PubMed]
- Dai, Z.; He, Y. Disrupted structural and functional brain connectomes in mild cognitive impairment and Alzheimer’s disease. Neurosci. Bull. 2014, 30, 217–232. [Google Scholar] [CrossRef] [PubMed]
- Frantzidis, C.A.; Vivas, A.B.; Tsolaki, A.; Klados, M.A.; Tsolaki, M.; Bamidis, P.D. Functional disorganization of small-world brain networks in mild Alzheimer’s Disease and amnestic Mild Cognitive Impairment: An EEG study using Relative Wavelet Entropy (RWE). Front. Aging Neurosci. 2014, 6, 224. [Google Scholar] [CrossRef] [PubMed]
- Seo, E.H.; Lee, D.Y.; Lee, J.M.; Park, J.S.; Sohn, B.K.; Lee, D.S.; Choe, Y.M.; Woo, J.I. Whole-brain functional networks in cognitively normal, mild cognitive impairment, and Alzheimer’s disease. PLoS ONE 2013, 8, e53922. [Google Scholar] [CrossRef] [PubMed]
- Klados, M.A.; Styliadis, C.; Frantzidis, C.A.; Paraskevopoulos, E.; Bamidis, P.D. Beta-Band Functional Connectivity is Reorganized in Mild Cognitive Impairment after Combined Computerized Physical and Cognitive Training. Front. Neurosci. 2016, 10, 55. [Google Scholar] [CrossRef] [PubMed]
- Barban, F.; Annicchiarico, R.; Pantelopoulos, S.; Federici, A.; Perri, R.; Fadda, L.; Carlesimo, G.A.; Ricci, C.; Giuli, S.; Scalici, F.; et al. Protecting cognition from aging and Alzheimer’s disease: A computerized cognitive training combined with reminiscence therapy. Int. J. Geriatr. Psychiatry 2016, 31, 340–348. [Google Scholar] [CrossRef] [PubMed]
- Büsch, D.; Hagemann, N.; Bender, N. The dimensionality of the Edinburgh Handedness Inventory: An analysis with models of the item response theory. Laterality 2010, 15, 610–628. [Google Scholar] [CrossRef] [PubMed]
- Carlesimo, G.A.; Caltagirone, C.; Gainotti, G. The Mental Deterioration Battery: Normative data, diagnostic reliability and qualitative analyses of cognitive impairment. The Group for the Standardization of the Mental Deterioration Battery. Eur. Neurol. 1996, 36, 378–384. [Google Scholar] [CrossRef] [PubMed]
- Carlesimo, G.A.; Buccione, I.; Fadda, L.; Graceffa, A.; Mauri, M.; Lo Russo, S.; Bevilacqua, G.; Caltagirone, C. Standardizzazione di due test di memoria per uso clinico: Breve Racconto e Figura di Rey. Nuova Riv. Neurol. 2002, 12, 1–13. [Google Scholar]
- Giovagnoli, A.R.; Del Pesce, M.; Mascheroni, S.; Simoncelli, M.; Laiacona, M.; Capitani, E. Trail making test: Normative values from 287 normal adults controls. Ital. J. Neurol. Sci. 1996, 17, 305–309. [Google Scholar] [CrossRef] [PubMed]
- Monaco, M.; Costa, A.; Caltagirone, C.; Carlesimo, G.A. Forward and backward span for verbal and visuo-spatial data: Standardization and normative data from an Italian adult population. Neurol. Sci. 2013, 34, 749–754. [Google Scholar] [CrossRef] [PubMed]
- Spinnler, H.; Tognoni, G. Standardizzazione e taratura di test neuropsicologici. Ital. J. Neurol. Sci. 1987, 8, 1–20. [Google Scholar]
- Mondini, S.; Mapelli, D.; Vestri, A.; Bisiacchi, P.S. Esame Neuropsicologico Breve. Una Batteria di Test per lo Screening Neuropsicologico; Raffaello Cortina Editore: Milano, Italy, 2003. [Google Scholar]
- Nocentini, U.; DiVincenzo, S.; Panella, P.; Pasqualetti, P.; Caltagirone, C. La valutazione delle funzioni esecutive nella pratica neuropsicologica: Dal Modified Card Sorting Test al Modified Card Sorting Test-Roma Version. Dati di standardizzazione. Nuova Riv. Neurol. 2002, 12, 14–24. [Google Scholar]
- Miceli, G.; Laudanna, A.; Burani, C.; Capasso, R. Batteria per l’Analisi dei Deficit Afasici. BADA; Università Cattolica del Sacro Cuore CEPSA: Roma, Italy, 1994. [Google Scholar]
- Lawton, M.P.; Brody, E.M. Assessment of older people: Self-maintaining and instrumental activities of daily living. Gerontologist 1969, 9, 179–186. [Google Scholar] [CrossRef] [PubMed]
- McKhann, G.M.; Knopman, D.S.; Chertkow, H.; Hyman, B.T.; Jack, C.R., Jr.; Kawas, C.H.; Klunk, W.E.; Koroshetz, W.J.; Manly, J.J.; Mayeux, R.; et al. The diagnosis of dementia due to Alzheimer’s disease: Recommendations from the National Institute on Aging-Alzheimer’s Association workgroups on diagnostic guidelines for Alzheimer’s disease. Alzheimers Dement. 2011, 7, 263–269. [Google Scholar] [CrossRef] [PubMed]
- Folstein, M.F.; Folstein, S.E.; McHugh, P.R. “Mini-mental state”. A practical method for grading the cognitive state of patients for the clinician. J. Psychiatr. Res. 1975, 12, 189–198. [Google Scholar] [CrossRef]
- Hughes, C.P.; Berg, L.; Danziger, W.L.; Coben, L.A.; Martin, R.L. A new clinical scale for the staging of dementia. Br. J. Psychiatry 1982, 140, 566–572. [Google Scholar] [CrossRef] [PubMed]
- Olazarán, J.; Muñiz, R.; Reisberg, B.; Peña-Casanova, J.; del Ser, T.; Cruz-Jentoft, A.J.; Serrano, P.; Navarro, E.; García de la Rocha, M.L.; Frank, A.; et al. Benefits of cognitive-motor intervention in MCI and mild to moderate Alzheimer disease. Neurology 2004, 63, 2348–2353. [Google Scholar] [CrossRef] [PubMed]
- Petersen, R.C. Mild cognitive impairment as a diagnostic entity. J. Intern. Med. 2004, 256, 183–194. [Google Scholar] [CrossRef] [PubMed]
- Scheltens, P.; Launer, L.J.; Barkhof, F.; Weinstein, H.C.; van Gool, W.A. Visual assessment of medial temporal lobe atrophy on magnetic resonance imaging: Interobserver reliability. J. Neurol. 1995, 242, 557–560. [Google Scholar] [CrossRef] [PubMed]
- Pereira, J.B.; Cavallin, L.; Spulber, G.; Aguilar, C.; Mecocci, P.; Vellas, B.; Tsolaki, M.; Kłoszewska, I.; Soininen, H.; Spenger, C.; et al. Influence of age, disease onset and ApoE4 on visual medial temporal lobe atrophy cut-offs. J. Intern. Med. 2014, 275, 317–330. [Google Scholar] [CrossRef] [PubMed]
- Torgerson, D.J.; Roberts, C. Understanding controlled trials. Randomisation methods: Concealment. BMJ 1999, 319, 375–376. [Google Scholar] [CrossRef] [PubMed]
- Suresh, K. An overview of randomization techniques: An unbiased assessment of outcome in clinical research. J. Hum. Reprod. Sci. 2011, 4, 8–11. [Google Scholar] [CrossRef] [PubMed]
- Sociable. The Way Cognitive Training Should Be! Available online: http://www.cognitivetraining.eu (accessed on 27 April 2017).
- Barca, L.; Burani, C.; Arduino, L.S. Word naming times and psycholinguistic norms for Italian nouns. Behav. Res. Methods Instrum. Comput. 2002, 34, 424–434. [Google Scholar] [CrossRef] [PubMed]
- Li, H.; Li, J.; Li, N.; Li, B.; Wang, P.; Zhou, T. Cognitive intervention for persons with mild cognitive impairment: A meta-analysis. Ageing Res. Rev. 2011, 10, 285–296. [Google Scholar] [CrossRef] [PubMed]
- Barnes, D.E.; Yaffe, K.; Belfor, N.; Jagust, W.J.; DeCarli, C.; Reed, B.R.; Kramer, J.H. Computer-based cognitive training for mild cognitive impairment: Results from a pilot randomized, controlled trial. Alzheimer Dis. Assoc. Disord. 2009, 23, 205–210. [Google Scholar] [CrossRef] [PubMed]
- SPM—Statistical Parametrical Mapping. Available online: http://www.fil.ion.ucl.ac.uk/spm/ (accessed on 27 April 2017).
- Bozzali, M.; Dowling, C.; Serra, L.; Spanò, B.; Torso, M.; Marra, C.; Castelli, D.; Dowell, N.G.; Koch, G.; Caltagirone, C.; et al. The impact of cognitive reserve on brain functional connectivity in Alzheimer’s disease. J. Alzheimers Dis. 2015, 44, 243–250. [Google Scholar] [PubMed]
- Ashburner, J.; Friston, K.J. Unified segmentation. Neuroimage 2005, 26, 839–851. [Google Scholar] [CrossRef] [PubMed]
- Mastropasqua, C.; Bozzali, M.; Spanò, B.; Koch, G.; Cercignani, M. Functional anatomy of the thalamus as a model of integrated structural and functional connectivity of the human brain in civo. Brain Topogr. 2015, 28, 548–558. [Google Scholar] [CrossRef] [PubMed]
- Mialab—Medical Image Analysis Lab. Available online: http://mialab.mrn.org/software/#gica (accessed on 27 April 2017).
- De Luca, M.; Beckmann, C.F.; De Stefano, N.; Matthews, P.M.; Smith, S.M. fMRI resting state networks define distinct modes of long-distance interactions in the human brain. Neuroimage 2006, 29, 1359–1367. [Google Scholar] [CrossRef] [PubMed]
- Tzourio-Mazoyer, N.; Landeau, B.; Papathanassiou, D.; Crivello, F.; Etard, O.; Delcroix, N.; Mazoyer, B.; Joliot, M. Automated anatomical labeling of activations in SPM using a macroscopic anatomical parcellation of the MNI MRI single-subject brain. Neuroimage 2002, 15, 273–289. [Google Scholar] [CrossRef] [PubMed]
- De Vico Fallani, F.; Richiardi, J.; Chavez, M.; Achard, S. Graph analysis of functional brain networks: Practical issues in translational neuroscience. Philos. Trans. R Soc. Lond. B Biol. Sci. 2014, 369. [Google Scholar] [CrossRef] [PubMed]
- Van Wijk, B.C.; Stam, C.J.; Daffertshofer, A. Comparing brain networks of different size and connectivity density using graph theory. PLoS ONE 2010, 5, e13701. [Google Scholar] [CrossRef] [PubMed]
- Brain Connectivity Toolbox. Available online: https://sites.google.com/site/bctnet/ (accessed on 27 April 2017).
- Yao, Z.; Zhang, Y.; Lin, L.; Zhou, Y.; Xu, C.; Jiang, T. Alzheimer’s Disease Neuroimaging Initiative. Abnormal cortical networks in mild cognitive impairment and Alzheimer’s disease. PLoS Comput. Biol. 2010, 6, e1001006. [Google Scholar] [CrossRef] [PubMed]
- Shim, M.; Kim, D.W.; Lee, S.H.; Im, C.H. Disruptions in small-world cortical functional connectivity network during an auditory oddball paradigm task in patients with schizophrenia. Schizophr. Res. 2014, 156, 197–203. [Google Scholar] [CrossRef] [PubMed]
- Benjamini, Y.; Yekutieli, D. The control of the false discovery rate in multiple testing under dependency. Ann. Stat. 2001, 29, 1165–1188. [Google Scholar]
- Cohen, J. A power primer. Psychol. Bull. 1992, 112, 155–159. [Google Scholar] [CrossRef] [PubMed]
- Bozzali, M.; Giulietti, G.; Basile, B.; Serra, L.; Spanò, B.; Perri, R.; Giubilei, F.; Marra, C.; Caltagirone, C.; Cercignani, M. Damage to the cingulum contributes to Alzheimer’s disease pathophysiology by deafferentation mechanism. Hum. Brain Mapp. 2012, 33, 1295–1308. [Google Scholar] [CrossRef] [PubMed]
- Bokde, A.L.; Ewers, M.; Hampel, H. Assessing neuronal networks: Understanding Alzheimer’s disease. Prog. Neurobiol. 2009, 89, 125–133. [Google Scholar] [CrossRef] [PubMed]
- Mallio, C.A.; Schmidt, R.; de Reus, M.A.; Vernieri, F.; Quintiliani, L.; Curcio, G.; Beomonte Zobel, B.; Quattrocchi, C.C.; van den Heuvel, M.P. Epicentral disruption of structural connectivity in Alzheimer’s disease. CNS Neurosci. Ther. 2015, 21, 837–845. [Google Scholar] [CrossRef] [PubMed]
- Crossley, N.A.; Mechelli, A.; Scott, J.; Carletti, F.; Fox, P.T.; McGuire, P.; Bullmore, E.T. The hubs of the human connectome are generally implicated in the anatomy of brain disorders. Brain 2014, 137, 2382–2395. [Google Scholar] [CrossRef] [PubMed]
- Buckner, R.L.; Sepulcre, J.; Talukdar, T.; Krienen, F.M.; Liu, H.; Hedden, T.; Andrews-Hanna, J.R.; Sperling, R.A.; Johnson, K.A. Cortical Hubs Revealed by Intrinsic Functional Connectivity: Mapping, Assessment of Stability, and Relation to Alzheimer’s Disease. J. Neurosci. 2009, 29, 1860–1873. [Google Scholar] [CrossRef] [PubMed]
- Li, W.; Antuono, P.G.; Xie, C.; Chen, G.; Jones, J.L.; Ward, B.D.; Franczak, M.B.; Goveas, J.S.; Li, S.J. Changes in regional cerebral blood flow and functional connectivity in the cholinergic pathway associated with cognitive performance in subjects with mild Alzheimer’s disease after 12-week donepezil treatment. Neuroimage 2012, 60, 1083–1091. [Google Scholar] [CrossRef] [PubMed]
- Hongo, J.; Nakaaki, S.; Shinagawa, Y.; Murata, Y.; Sato, J.; Tatsumi, H.; Tohyama, J.; Soma, T.; Iidaka, T.; Fukui, T.; et al. SPECT-identified neuroanatomical predictor of the cognitive effects of donepezil treatment in patients with Alzheimer’s disease. Dement. Geriatr. Cogn. Disord. 2008, 26, 556–566. [Google Scholar] [CrossRef] [PubMed]
- Greicius, M.D.; Srivastava, G.; Reiss, A.L.; Menon, V. Default-mode network activity distinguishes Alzheimer’s disease from healthy aging: Evidence from functional MRI. Proc. Natl. Acad. Sci. USA 2004, 101, 4637–4642. [Google Scholar] [CrossRef] [PubMed]
- Supekar, K.; Menon, V.; Rubin, D.; Musen, M.; Greicius, M.D. Network analysis of intrinsic functional brain connectivity in Alzheimer’s disease. PLoS Comput. Biol. 2008, 4, e1000100. [Google Scholar] [CrossRef] [PubMed]
- Hao, J.; Li, K.; Li, K.; Zhang, D.; Wang, W.; Yang, Y.; Yan, B.; Shan, B.; Zhou, X. Visual attention deficits in Alzheimer’s disease: An fMRI study. Neurosci. Lett. 2005, 385, 18–23. [Google Scholar] [CrossRef] [PubMed]
- Bai, F.; Zhang, Z.; Yu, H.; Shi, Y.; Yuan, Y.; Zhu, W.; Zhang, X.; Qian, Y. Default-mode network activity distinguishes amnestic type mild cognitive impairment from healthy aging: A combined structural and resting-state functional MRI study. Neurosci. Lett. 2008, 438, 111–115. [Google Scholar] [CrossRef] [PubMed]
- Gardini, S.; Venneri, A.; Sambataro, F.; Cuetos, F.; Fasano, F.; Marchi, M.; Crisi, G.; Caffarra, P. Increased functional connectivity in the default mode network in mild cognitive impairment: A maladaptive compensatory mechanism associated with poor semantic memory performance. J. Alzheimers Dis. 2015, 45, 457–470. [Google Scholar] [PubMed]
- Cai, S.; Chong, T.; Zhang, Y.; Li, J.; von Deneen, K.M.; Ren, J.; Dong, M.; Huang, L. Alzheimer’s Disease Neuroimaging Initiative. Altered Functional Connectivity of Fusiform Gyrus in Subjects with Amnestic Mild Cognitive Impairment: A Resting-State fMRI Study. Front. Hum. Neurosci. 2015, 9, 471. [Google Scholar] [CrossRef] [PubMed]
- Carlesimo, G.A.; Lombardi, M.G.; Caltagirone, C.; Barban, F. Recollection and familiarity in the human thalamus. Neurosci. Biobehav. Rev. 2015, 54, 18–28. [Google Scholar] [CrossRef] [PubMed]
- McCormick, C.; Protzner, A.B.; Barnett, A.J.; Cohn, M.; Valiante, T.A.; McAndrews, M.P. Linking DMN connectivity to episodic memory capacity: What can we learn from patients with medial temporal lobe damage? Neuroimage Clin. 2014, 5, 188–196. [Google Scholar] [CrossRef] [PubMed]
- Bai, F.; Liao, W.; Watson, D.R.; Shi, Y.; Wang, Y.; Yue, C.; Teng, Y.; Wu, D.; Yuan, Y.; Jia, J.; et al. Abnormal whole-brain functional connection in amnestic mild cognitive impairment patients. Behav. Brain Res. 2011, 216, 666–672. [Google Scholar] [CrossRef] [PubMed]
- Belleville, S.; Bherer, L. Biomarkers of Cognitive Training Effects in Aging. Curr. Transl. Geriatr. Exp. Gerontol. Rep. 2012, 1, 104–110. [Google Scholar] [CrossRef] [PubMed]
- Tsvetanov, K.A.; Henson, R.N.; Tyler, L.K.; Davis, S.W.; Shafto, M.A.; Taylor, J.R.; Williams, N.; Cam-Can; Rowe, J.B. The effect of ageing on fMRI: Correction for the confounding effects of vascular reactivity evaluated by joint fMRI and MEG in 335 adults. Hum. Brain Mapp. 2015, 36, 2248–2269. [Google Scholar] [CrossRef] [PubMed]
- Tsvetanov, K.A.; Henson, R.N.; Tyler, L.K.; Razi, A.; Geerligs, L.; Ham, T.E.; Rowe, J.B. Cambridge Centre for Ageing and Neuroscience. Extrinsic and Intrinsic Brain Network Connectivity Maintains Cognition across the Lifespan Despite Accelerated Decay of Regional Brain Activation. J. Neurosci. 2016, 36, 3115–3126. [Google Scholar] [CrossRef] [PubMed]

| mAD (n = 22) | aMCI (n = 23) | HE (n = 25) | All | |||||||||||
|---|---|---|---|---|---|---|---|---|---|---|---|---|---|---|
| Arm A (n = 14) | Arm B (n = 8) | Χ2/U | p | Arm A (n = 10) | Arm B (n = 13) | Χ2/U | p | Arm A (n = 12) | Arm B (n = 13) | Χ2/U | p | Χ2/H | p | |
| Sex (male/female) | 5/9 | 3/5 | 0.007 | 0.993 | 7/3 | 7/6 | 0.619 | 0.431 | 4/8 | 3/10 | 0.326 | 0.568 | 5.673 | 0.059 |
| Education (year) | 9.6 (3.7) | 10.1 (3.2) | 50 | 0.714 | 10.7 (3.1) | 12.2 (4) | 50 | 0.376 | 11.2 (4.2) | 11 (4.2) | 79 | 1 | 2.63 | 0.268 |
| Age (year) | 76.4 (6) | 73.9 (4.7) | 64 | 0.616 | 71.4 (6.6) | 72.8 (5.7) | 53 | 0.446 | 69.9 (5.6) | 71 (6.8) | 70 | 0.650 | 7.15 | 0.028 |
| Memory (z) | −2 (0.5) | −1.6 (0.63) | 30 | 0.082 | −0.67 (0.65) | −0.87 (0.67) | 73 | 0.648 | 0.44 (0.93) | 0.18 (0.96) | 89 | 0.547 | 42.98 | <0.001 |
| Attention (z) | −0.87 (1.25) | −0.10 (1.05) | 38 | 0.238 | 0.76 (0.78) | 0.71 (0.73) | 72 | 0.693 | 1.05 (0.43) | 1.36 (0.36) | 47 | 0.098 | 28.02 | <0.001 |
| EF (z) | −0.27 (0.89) | −0.79 (1.03) | 70 | 0.365 | 0.15 (0.75) | −0.03 (0.86) | 73 | 0.648 | 0.57 (0.61) | 0.61 (0.52) | 84 | 0.769 | 15.95 | <0.001 |
| ALL | mAD | aMCI | HE | |||||||||||||||||||||
|---|---|---|---|---|---|---|---|---|---|---|---|---|---|---|---|---|---|---|---|---|---|---|---|---|
| ΔCT | ΔAC | T | p | N | r | ΔCT | ΔAC | T | p | N | r | ΔCT | ΔAC | T | p | N | r | ΔCT | ΔAC | T | p | N | r | |
| Memory (z) | 0.30 (0.54) | 0.10 (0.55) | 903 | 0.05 | 70 | 0.17 | 0.14 (0.36) | −0.14 (0.51) | 81 | 0.14 | 22 | 0.22 | 0.32 (0.47) | 0.03 (0.51) | 73 | 0.05 | 23 | 0.29 | 0.42 (0.7) | 0.38 (0.5) | 158 | 0.9 | 25 | 0.02 |
| Attention (z) | 0.20 (0.65) | −0.20 (0.74) | 778 | 0.01 | 70 | 0.23 | 0.28 (0.94) | −0.47 (1.14) | 71 | 0.07 | 22 | 0.27 | 0.21 (0.42) | −0.01 (0.46) | 92 | 0.16 | 23 | 0.21 | 0.12 (0.5) | −0.14 (0.38) | 103 | 0.11 | 25 | 0.23 |
| EF (z) | 0.08 (0.66) | 0.05 (0.6) | 1093 | 0.38 | 70 | 0.07 | −0.06 (0.82) | 0.12 (0.79) | 129 | 0.94 | 22 | −0.01 | 0.04 (0.66) | 0.01 (0.6) | 129 | 0.78 | 23 | 0.04 | 0.24 (0.45) | 0.03 (0.39) | 112 | 0.17 | 25 | 0.19 |
| Contrast | Sample | H | Region | Cluster (voxel) | t | FWE_corr p Cluster | MNI Coordinates | ||
|---|---|---|---|---|---|---|---|---|---|
| x | y | z | |||||||
| Baseline | aMCI > HE | L | Postcentral gyrus | 360 | 4.98 | 0.014 | −34 | −20 | 40 |
| L | PCu | 1253 | 4.63 | <0.001 | −2 | −46 | 50 | ||
| R | PCu | 4.62 | 10 | −60 | 34 | ||||
| mAD < aMCI | L | PCu | 610 | 4.79 | <0.001 | −4 | −70 | 28 | |
| R | PCu | 3.97 | 10 | −62 | 28 | ||||
| ΔCT > ΔAC | ALL groups | R | PCu | 288 | 4.22 | 0.033 | 14 | −64 | 48 |
| ΔCT < ΔAC | mAD | L | MTL | 302 | 5.21 | 0.026 | −28 | −42 | −4 |
| INT | aMCI (ΔCT < ΔAC) > HE (ΔCT < ΔAC) | R | mSFG | 288 | 4.56 | 0.033 | 2 | 46 | 44 |
| L | mSFG | 3.93 | −8 | 50 | 30 | ||||
| Method | Group | CT Effect | Measure | Brain Area | Side | ΔCT (Post-Pre) | ΔAC (Post-Pre) | T | p (2-Tailed) | N | r | |
| BCT | mAD | (post CT > pre CT) | Betweenness centrality | Anterior cingulum | R | 8.26 (10.66) | −0.91 (14.46) | 51 | 0.044 | 20 | 0.32 | |
| aMCI | (post CT > pre CT) | Betweenness centrality | Orbito-frontal region | R | 7.77 (5.25) | −2.39 (8.52) | 21 | 0.009 | 17 | 0.45 | ||
| aMCI | (pre CT > post CT) | Betweenness centrality | Cerebellum-Vermis | −10.7 (10.28) | 6.61 (8.53) | 155 | <0.001 | 17 | −0.62 | |||
| Method | Group | CT Effect | Edge | ΔCT (Post-Pre) | ΔAC (Post-Pre) | T | p (2-Tailed) | N | r | |||
| Brain Area | Side | Brain Area | Side | |||||||||
| NBS | mAD | (post CT > pre CT) | Calcarine cortex | L | Hippocampus | L | 0.19 (0.23) | −0.16 (0.27) | 21 | 0.002 | 20 | 0.5 |
| Calcarine cortex | R | Parahippocampal gyrus | L | 0.22 (0.23) | −0.16 (0.27) | 17 | 0.001 | 20 | 0.52 | |||
| Calcarine cortex | R | Hippocampus | L | 0.19 (0.18) | −0.11 (0.26) | 22 | 0.002 | 20 | 0.49 | |||
| aMCI | (pre CT > post CT) | Thalamus | L | Hippocampus | L | −0.17 (0.17) | 0.05 (0.34) | 122 | 0.031 | 17 | −0.37 | |
| Thalamus | R | Globus pallidus | R | −0.17 (0.18) | 0.13 (0.18) | 144 | 0.001 | 17 | −0.55 | |||
| Cerebellum | R | Cuneus | R | −0.2 (0.2) | 0.13 (0.29) | 130 | 0.011 | 17 | −0.43 | |||
© 2017 by the authors. Licensee MDPI, Basel, Switzerland. This article is an open access article distributed under the terms and conditions of the Creative Commons Attribution (CC BY) license (http://creativecommons.org/licenses/by/4.0/).
Share and Cite
Barban, F.; Mancini, M.; Cercignani, M.; Adriano, F.; Perri, R.; Annicchiarico, R.; Carlesimo, G.A.; Ricci, C.; Lombardi, M.G.; Teodonno, V.; et al. A Pilot Study on Brain Plasticity of Functional Connectivity Modulated by Cognitive Training in Mild Alzheimer’s Disease and Mild Cognitive Impairment. Brain Sci. 2017, 7, 50. https://doi.org/10.3390/brainsci7050050
Barban F, Mancini M, Cercignani M, Adriano F, Perri R, Annicchiarico R, Carlesimo GA, Ricci C, Lombardi MG, Teodonno V, et al. A Pilot Study on Brain Plasticity of Functional Connectivity Modulated by Cognitive Training in Mild Alzheimer’s Disease and Mild Cognitive Impairment. Brain Sciences. 2017; 7(5):50. https://doi.org/10.3390/brainsci7050050
Chicago/Turabian StyleBarban, Francesco, Matteo Mancini, Mara Cercignani, Fulvia Adriano, Roberta Perri, Roberta Annicchiarico, Giovanni Augusto Carlesimo, Claudia Ricci, Maria Giovanna Lombardi, Valeria Teodonno, and et al. 2017. "A Pilot Study on Brain Plasticity of Functional Connectivity Modulated by Cognitive Training in Mild Alzheimer’s Disease and Mild Cognitive Impairment" Brain Sciences 7, no. 5: 50. https://doi.org/10.3390/brainsci7050050