
OSAnalyzer: A Bioinformatics Tool for the Analysis of Gene Polymorphisms Enriched with Clinical Outcomes

 ,
, 

Abstract
:
1. Introduction
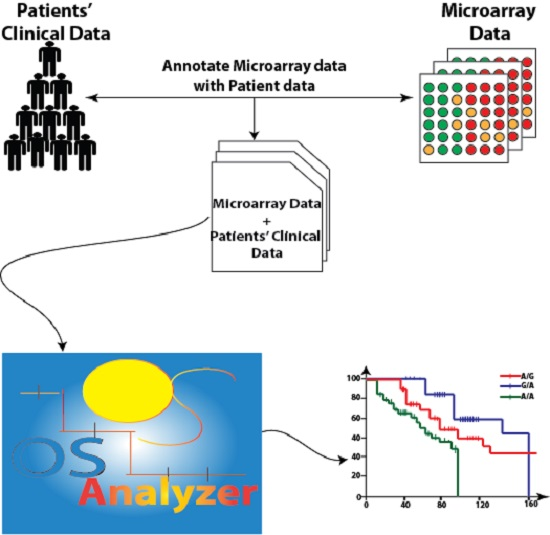
2. Materials and Methods
2.1. OSAnalyzer and SNPs Handling for Computing Kaplan-Meier
2.2. Related Works
3. Results
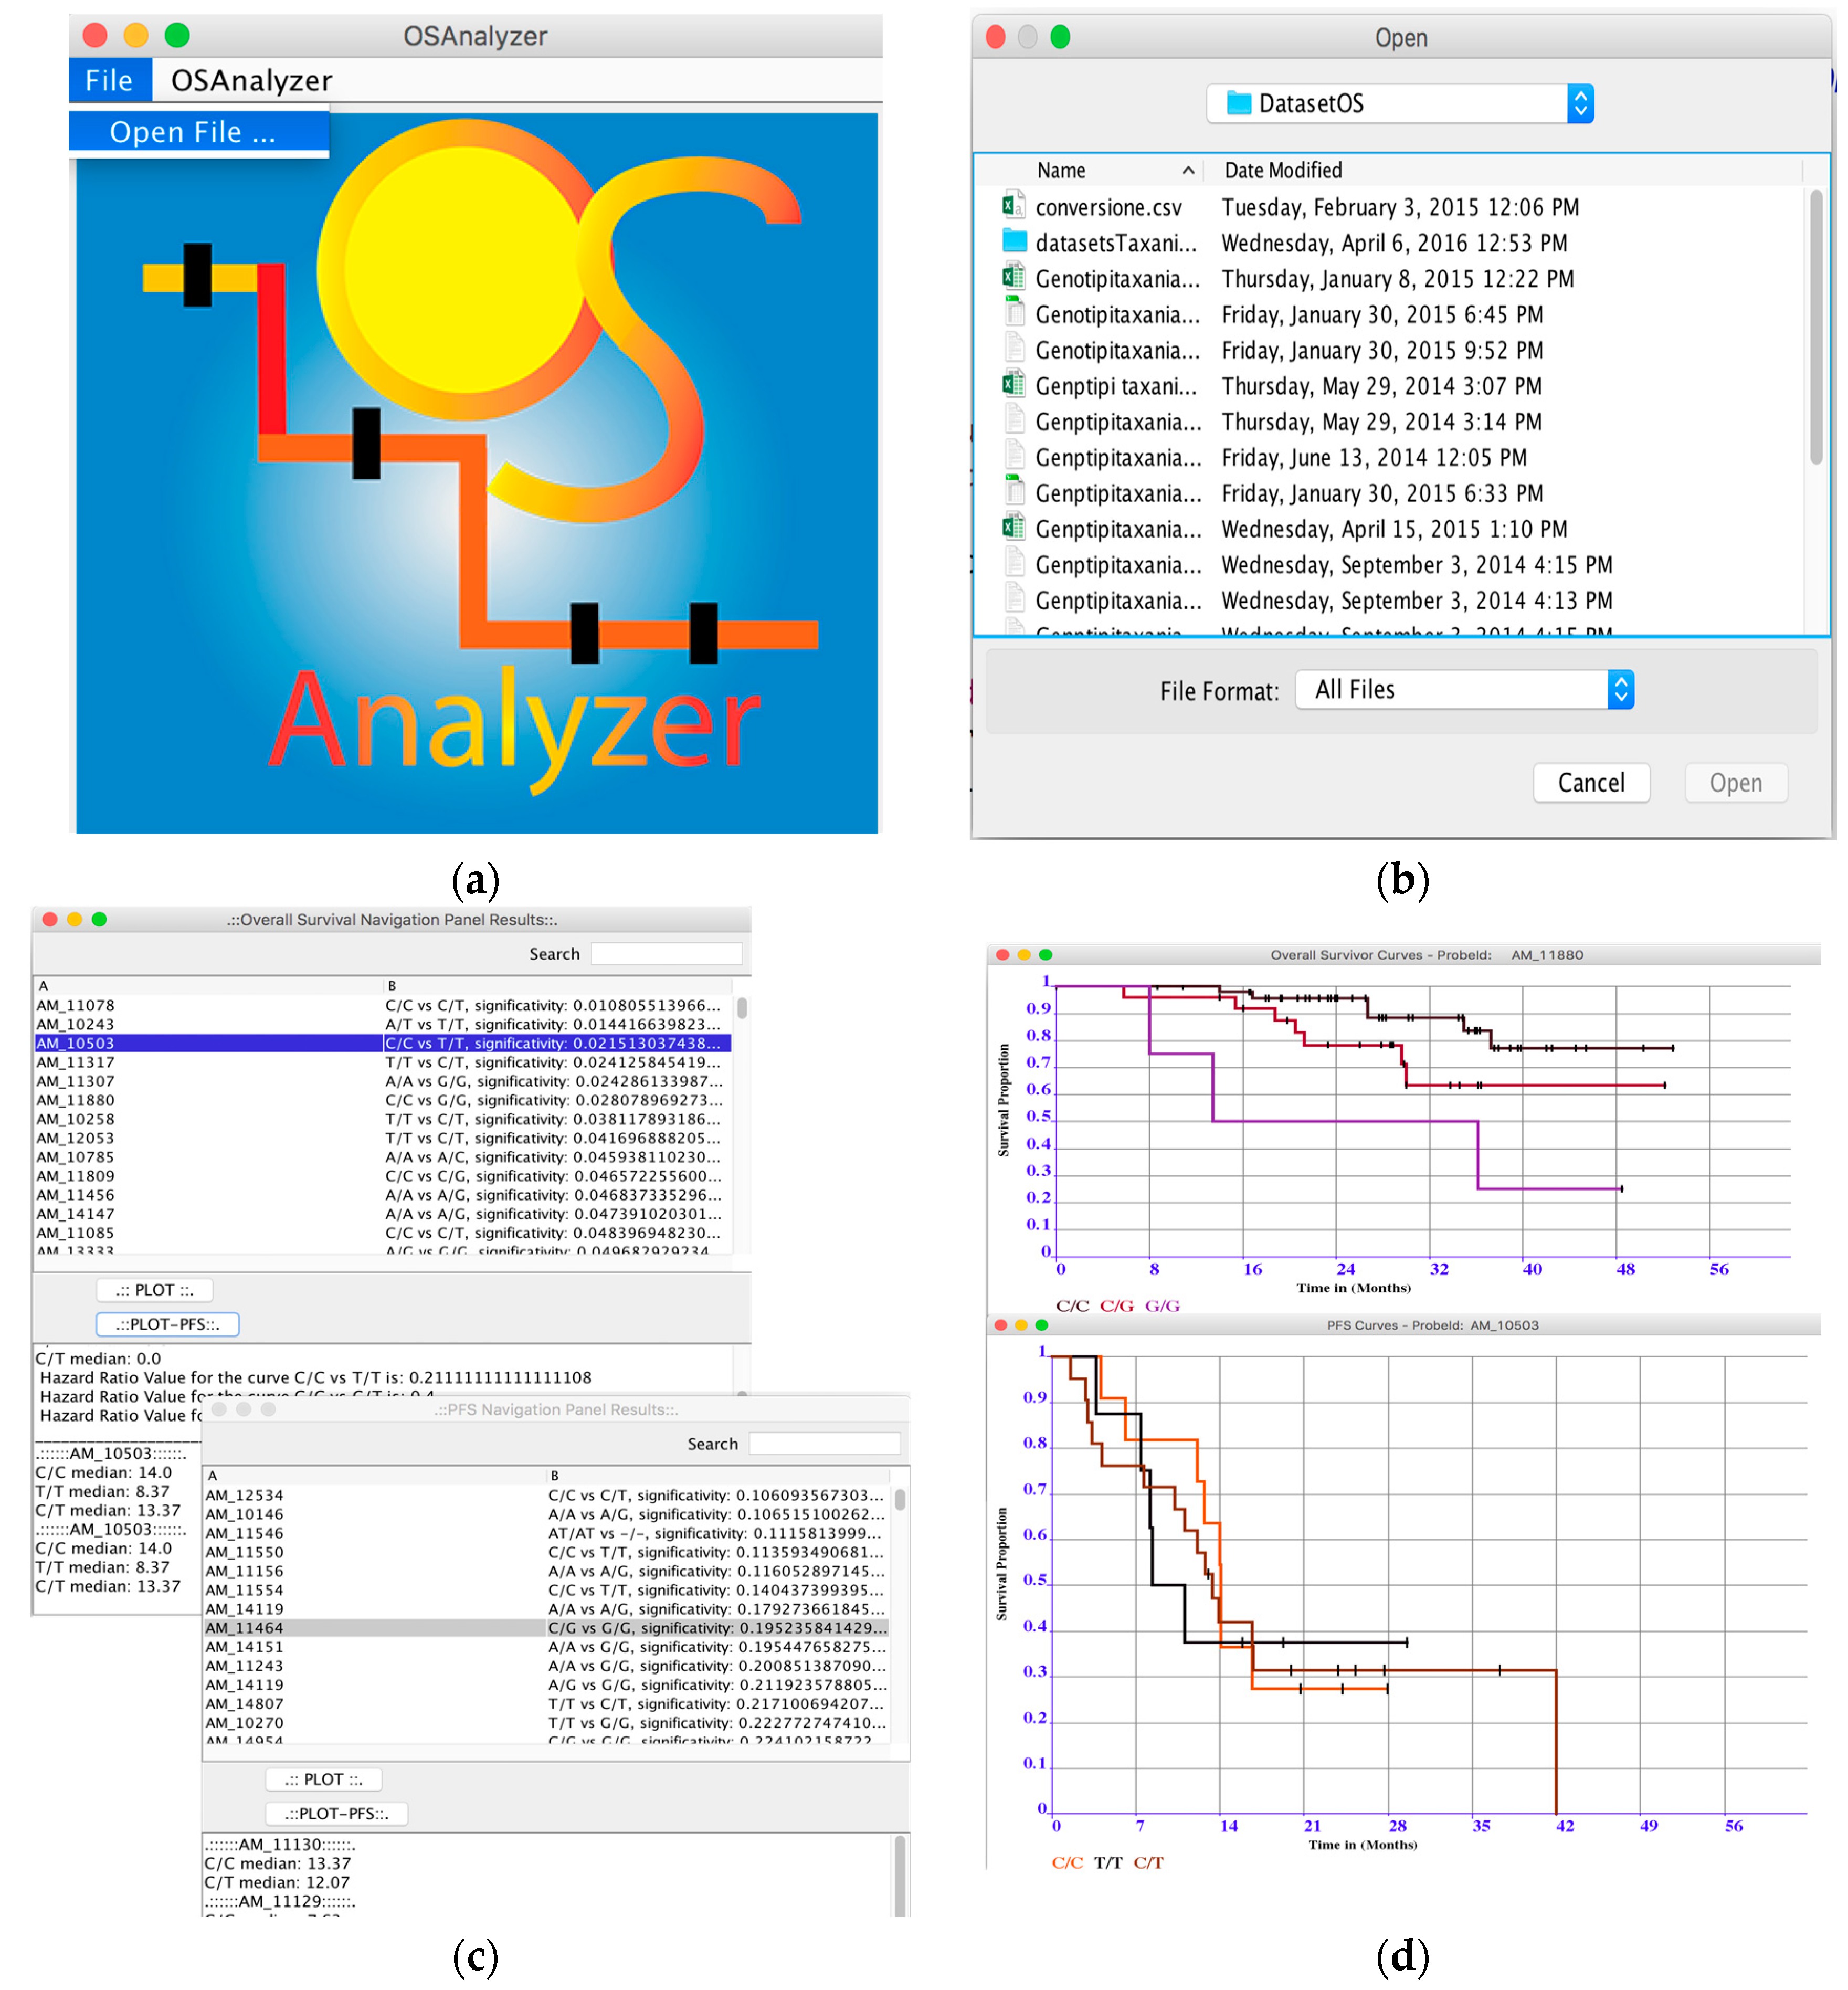
3.1. OSAnalyzer
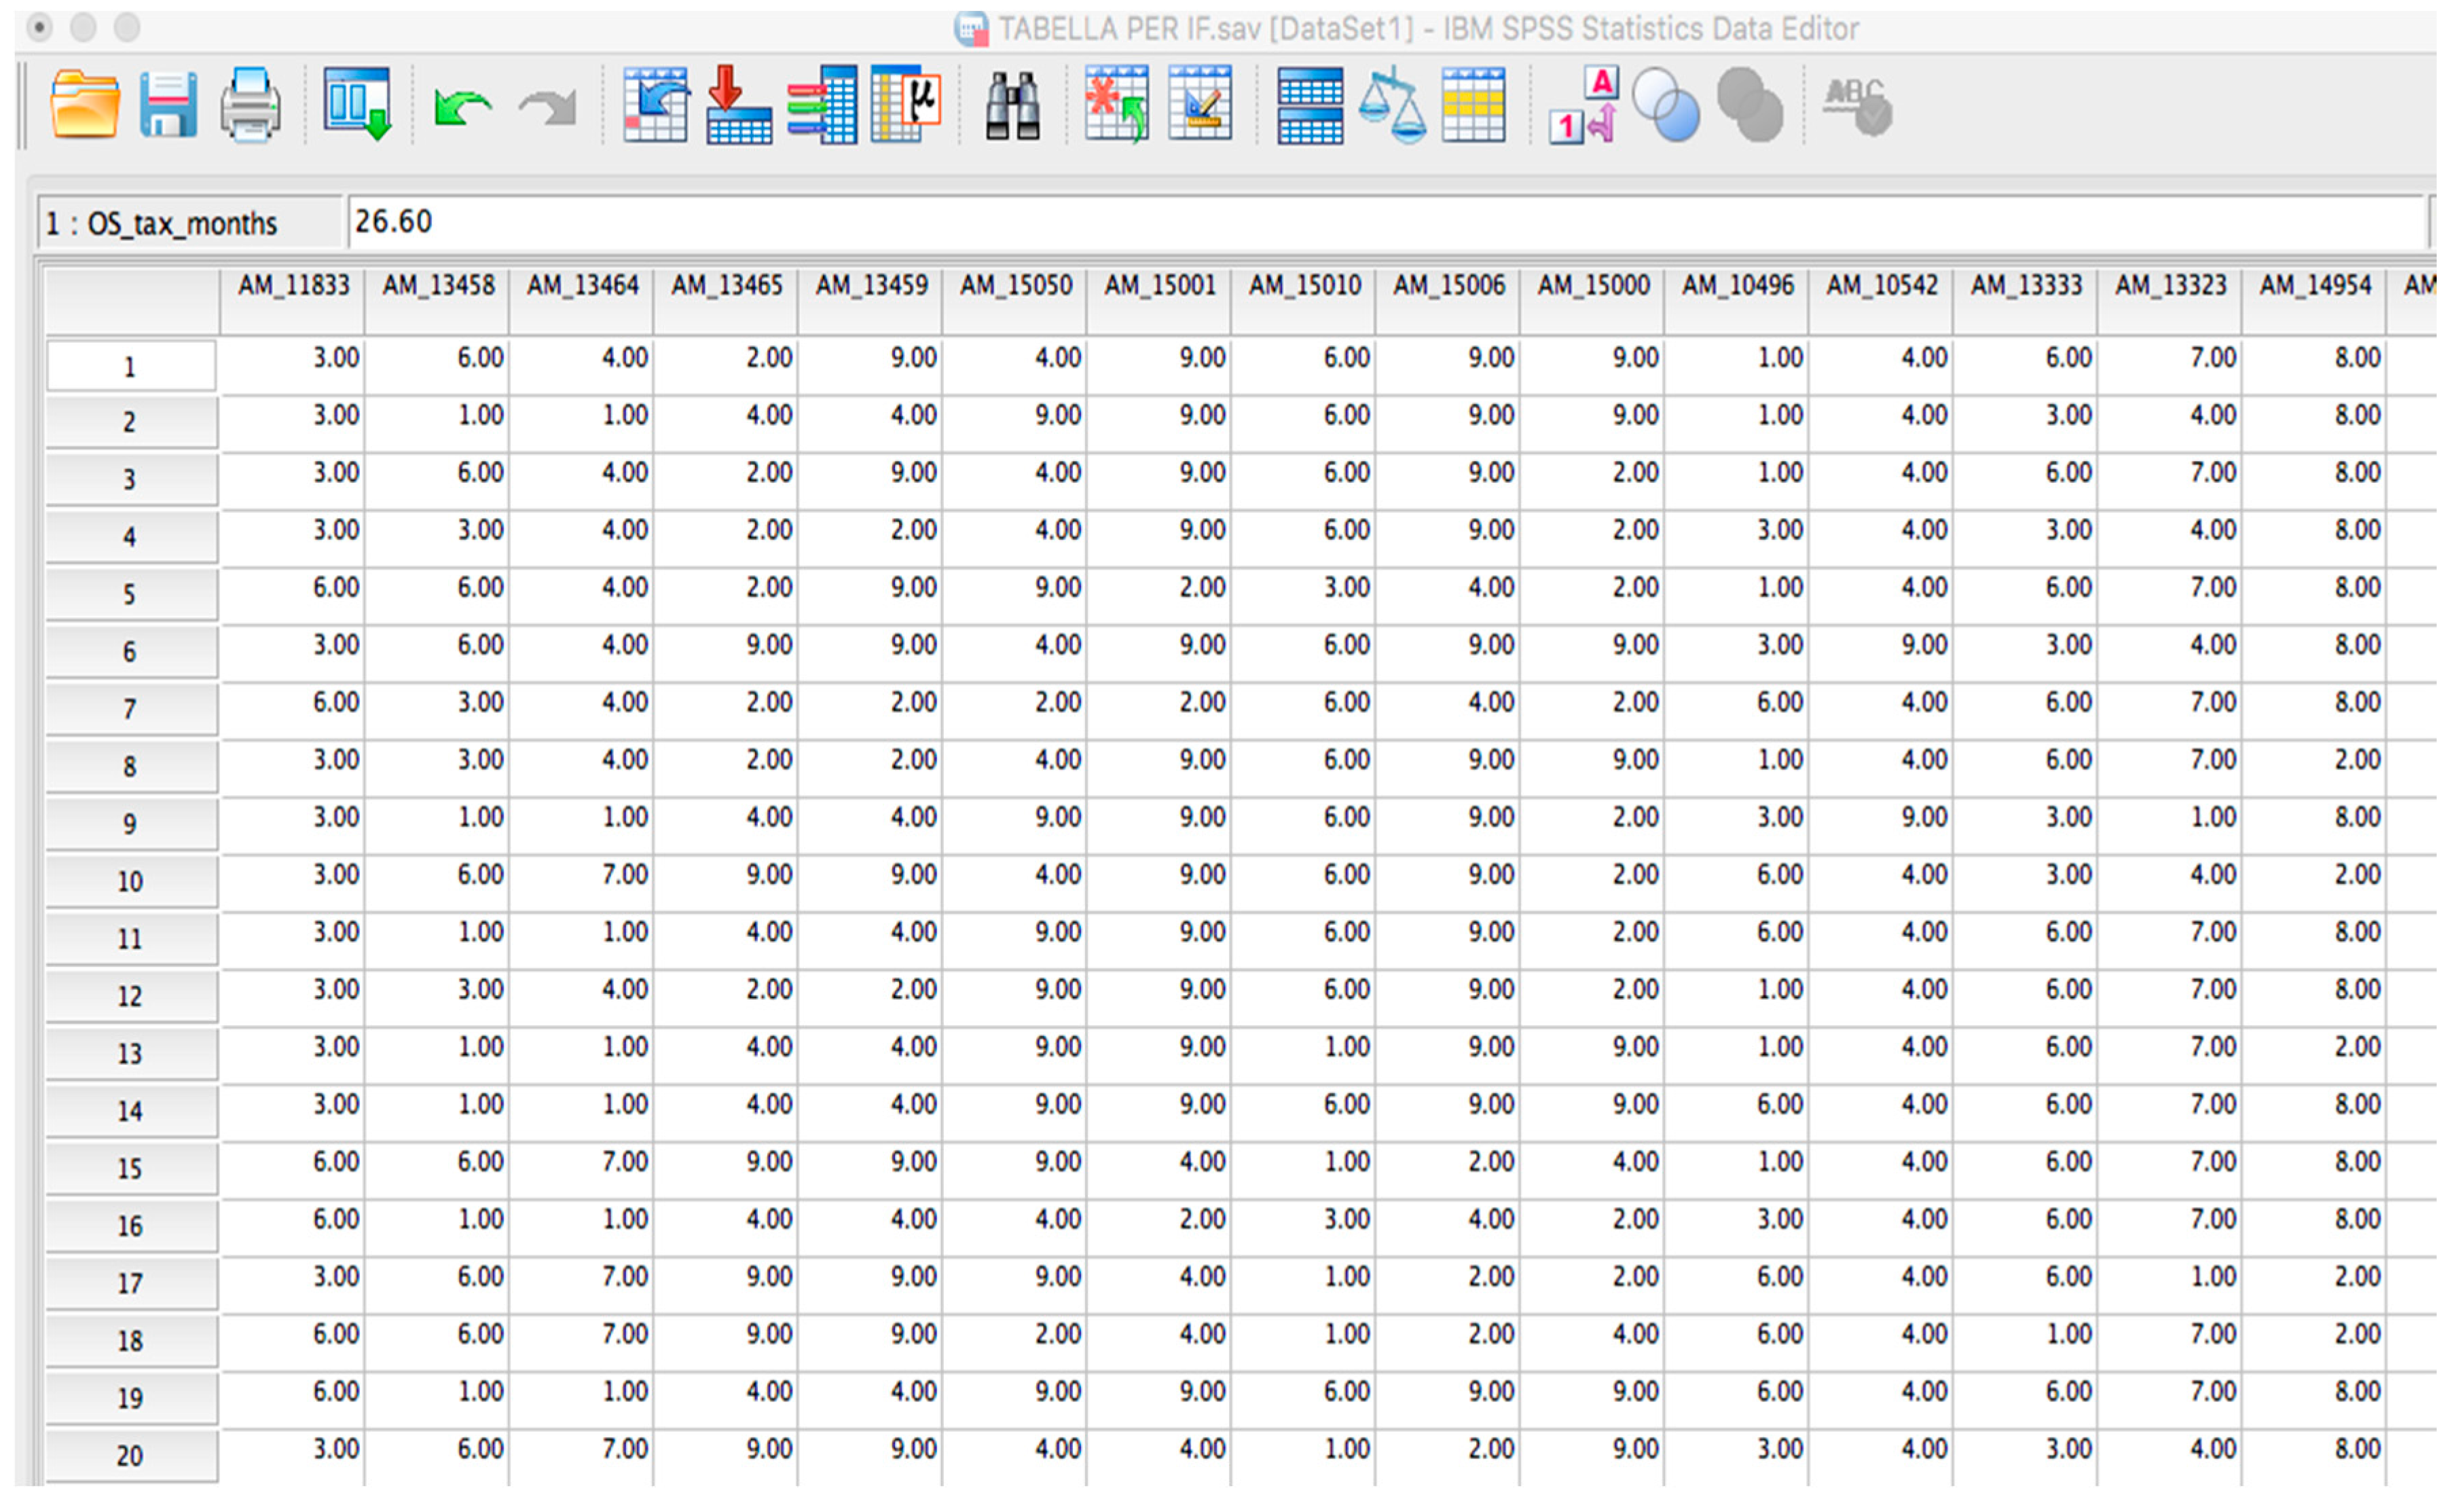
- Loading and Analysis of OS-datasets: OSAnalyzer is currently able to parse information encoded in xlsx format (file format defined by Excel) and CSV (comma-separated value) data files, as well as tab-delimited files. This way users may also prepare their own dataset, e.g., merging together samples coming from different experimental batches;
- Overall survival significance: OSAnalyzer automatically computes and visualizes the overall survival significance related with all probes, showing to the users the probes ranked by p-value significance;
- Progression-Free Survival significance: OSAnalyzer automatically computes and visualizes the progression-free survival significance related with all probes, showing to the users the probes ranked by p-value significance;
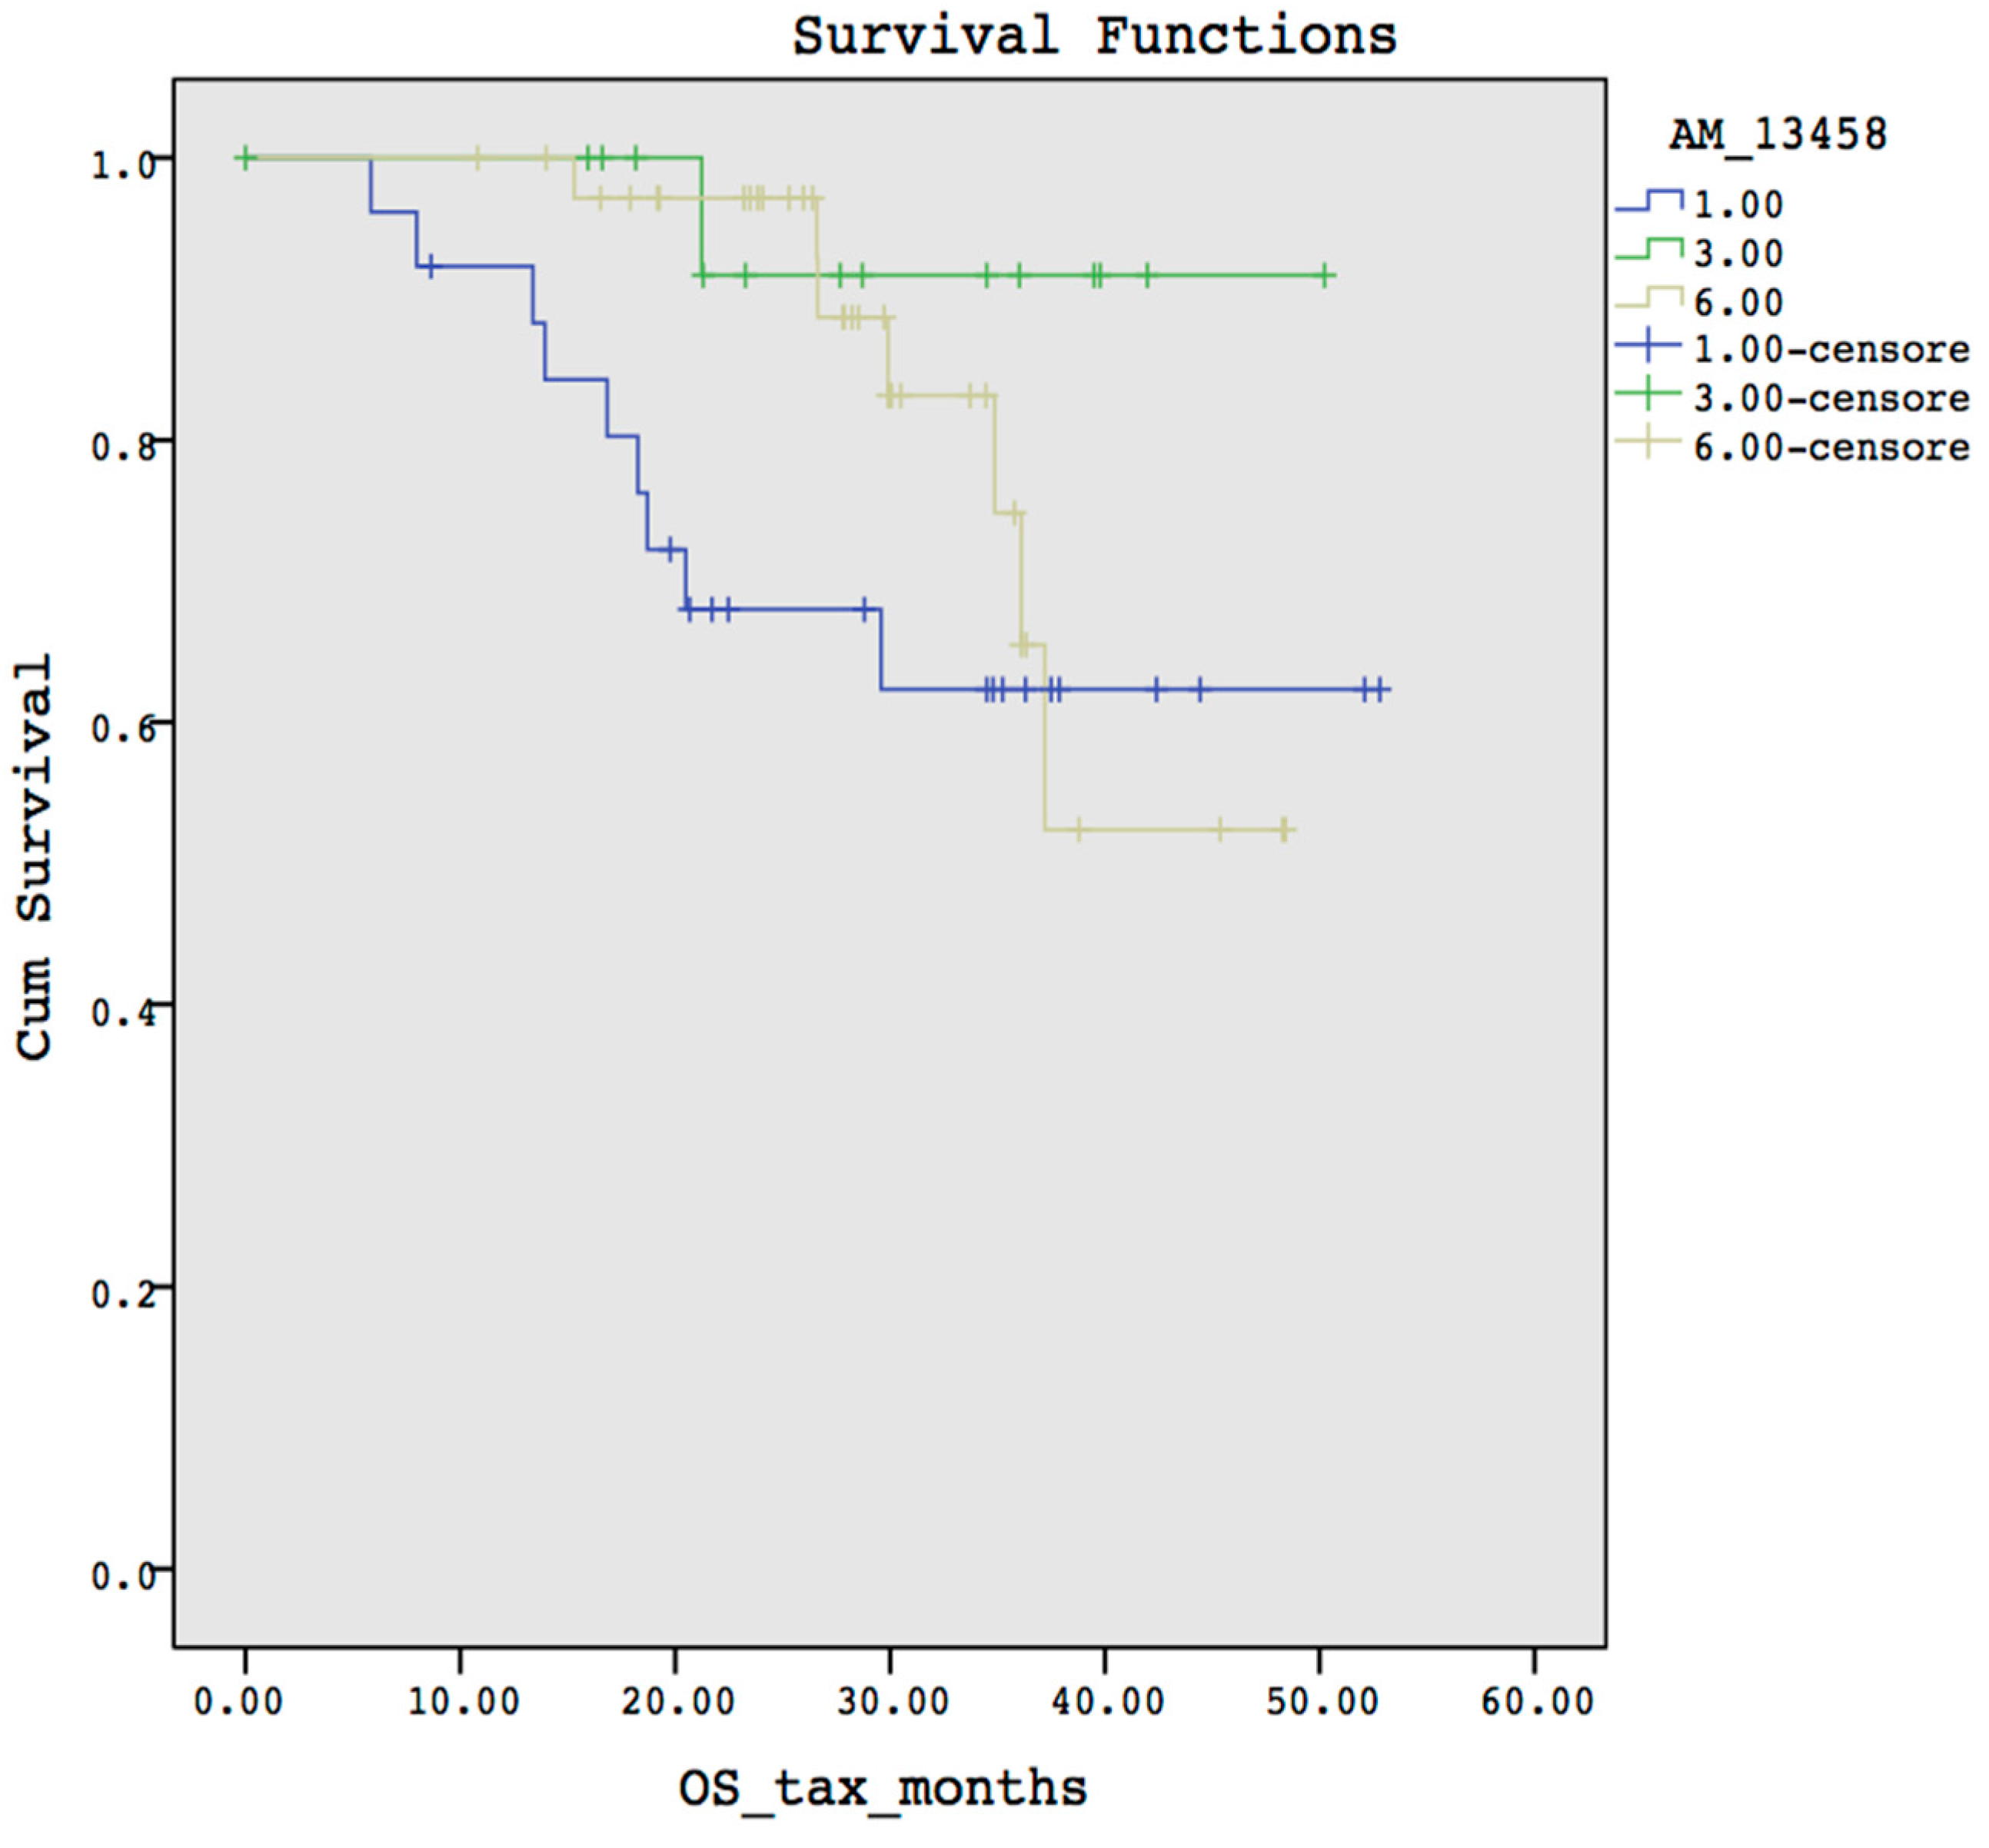
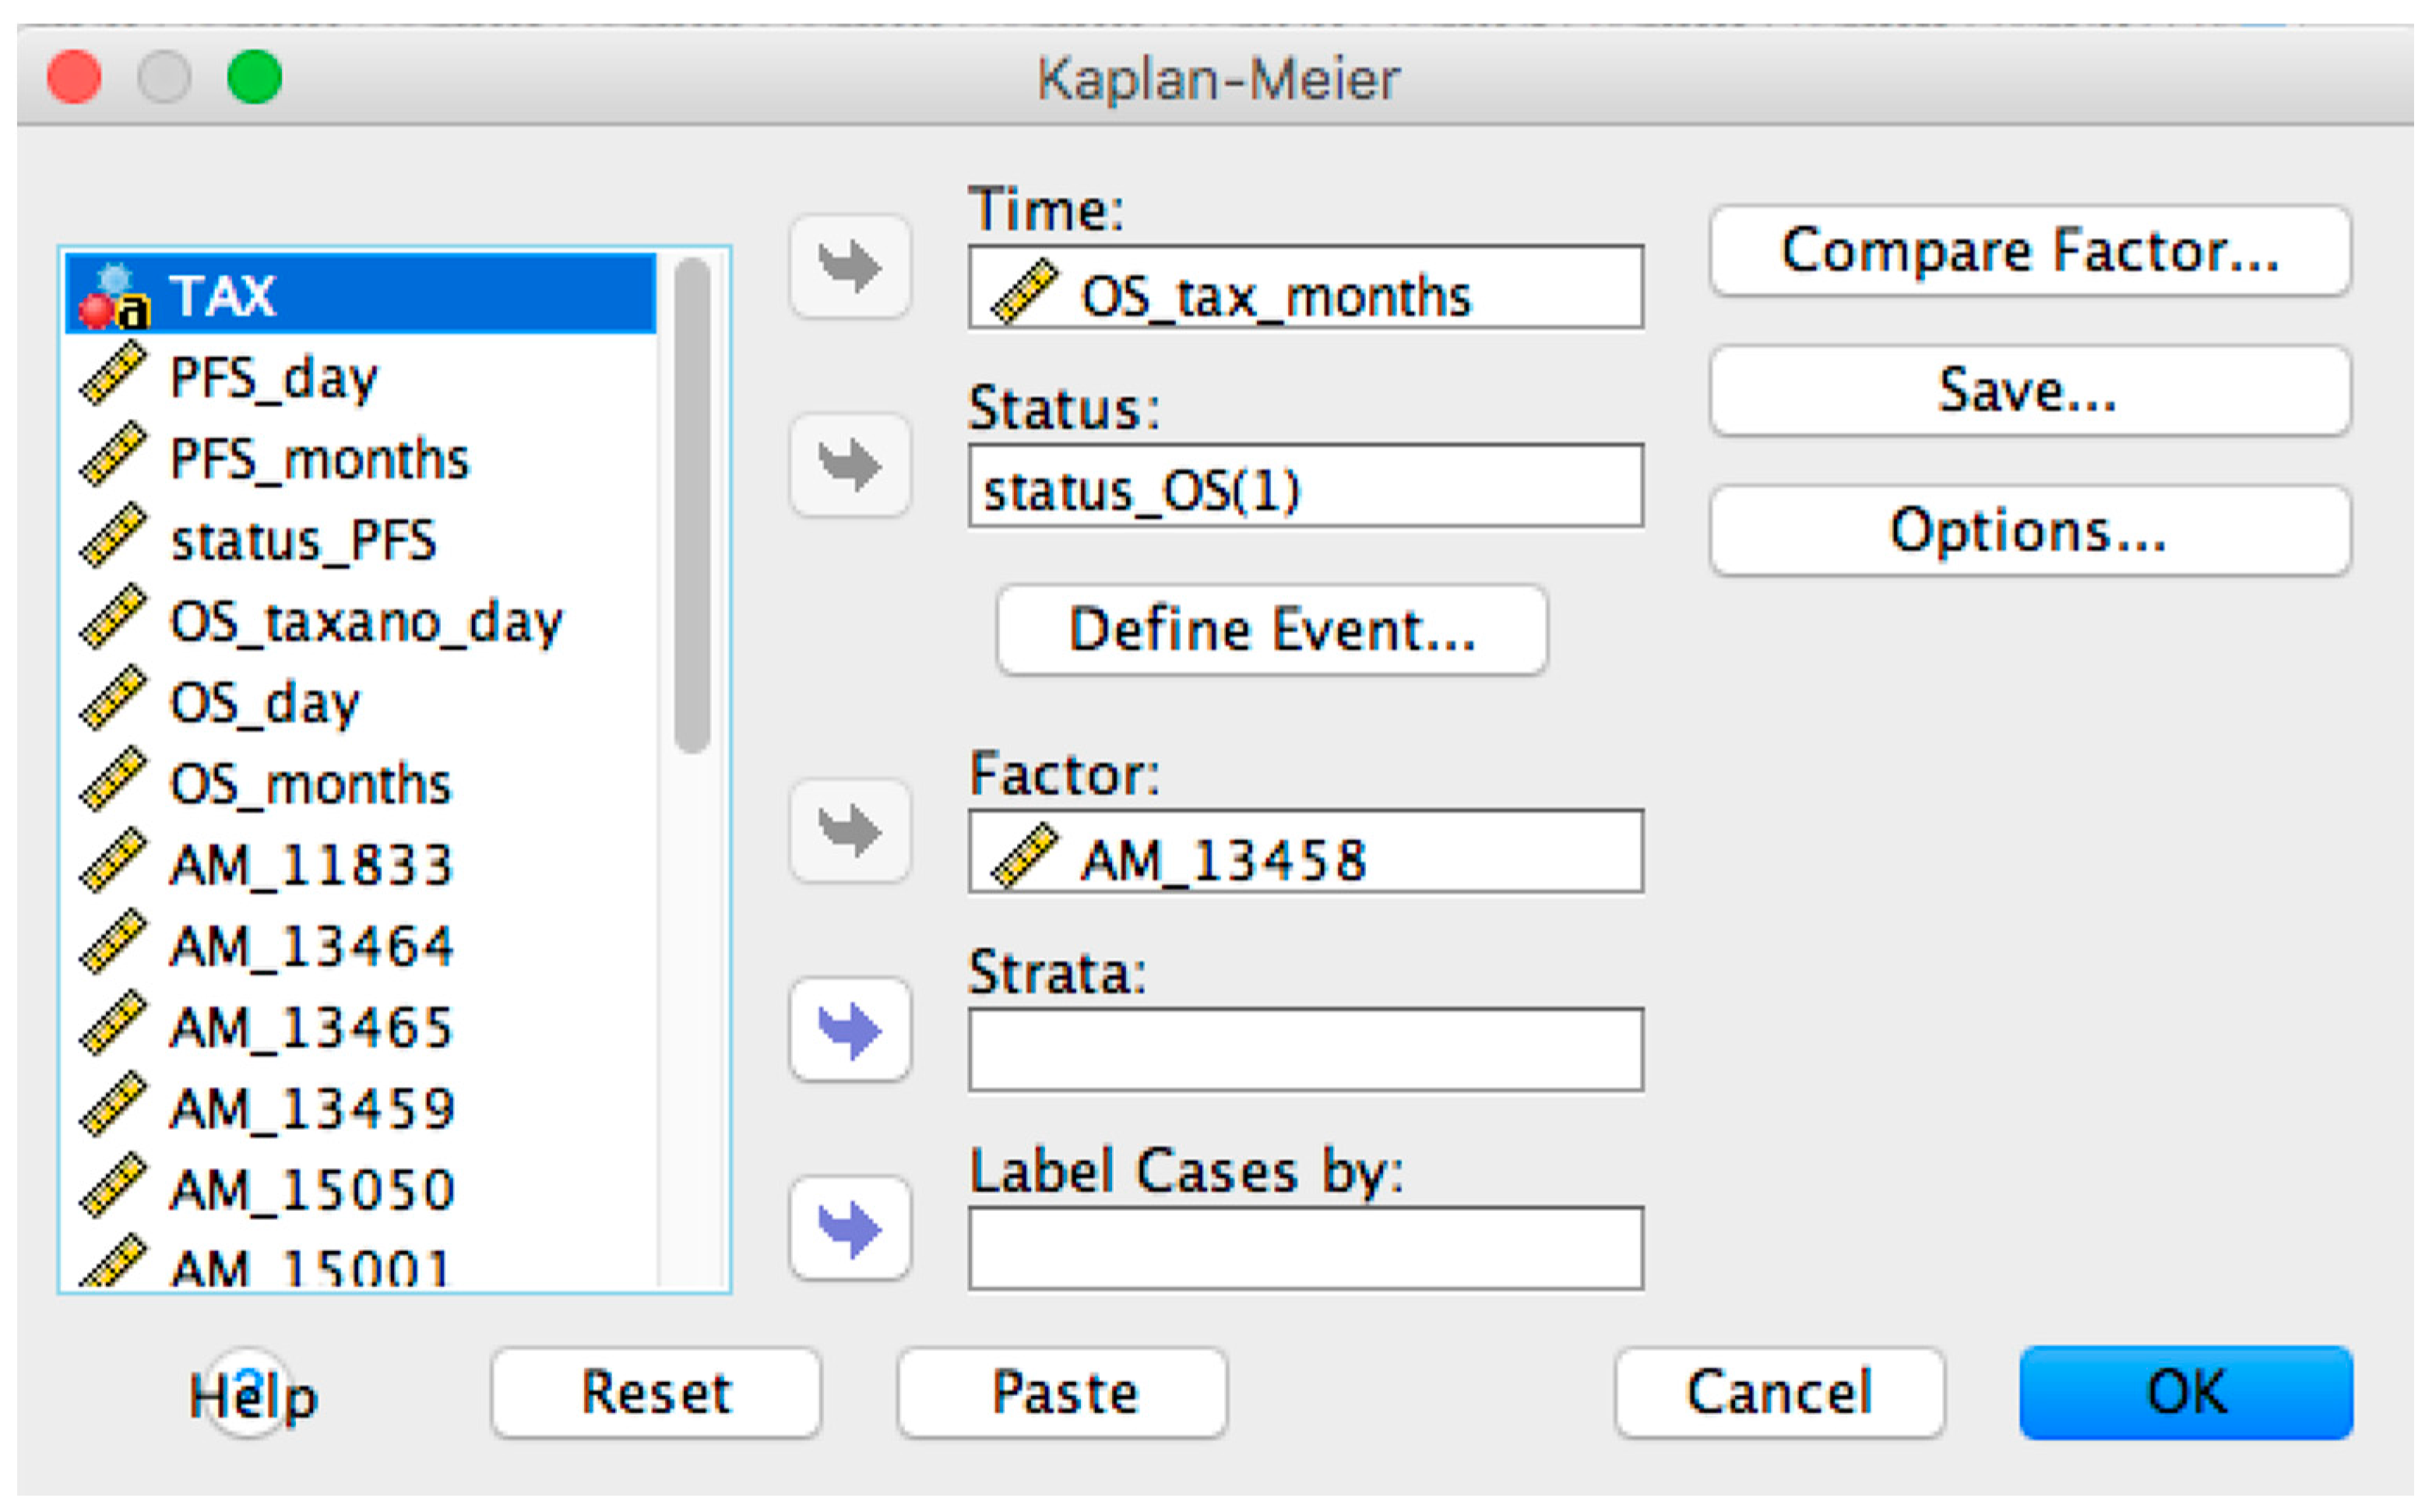
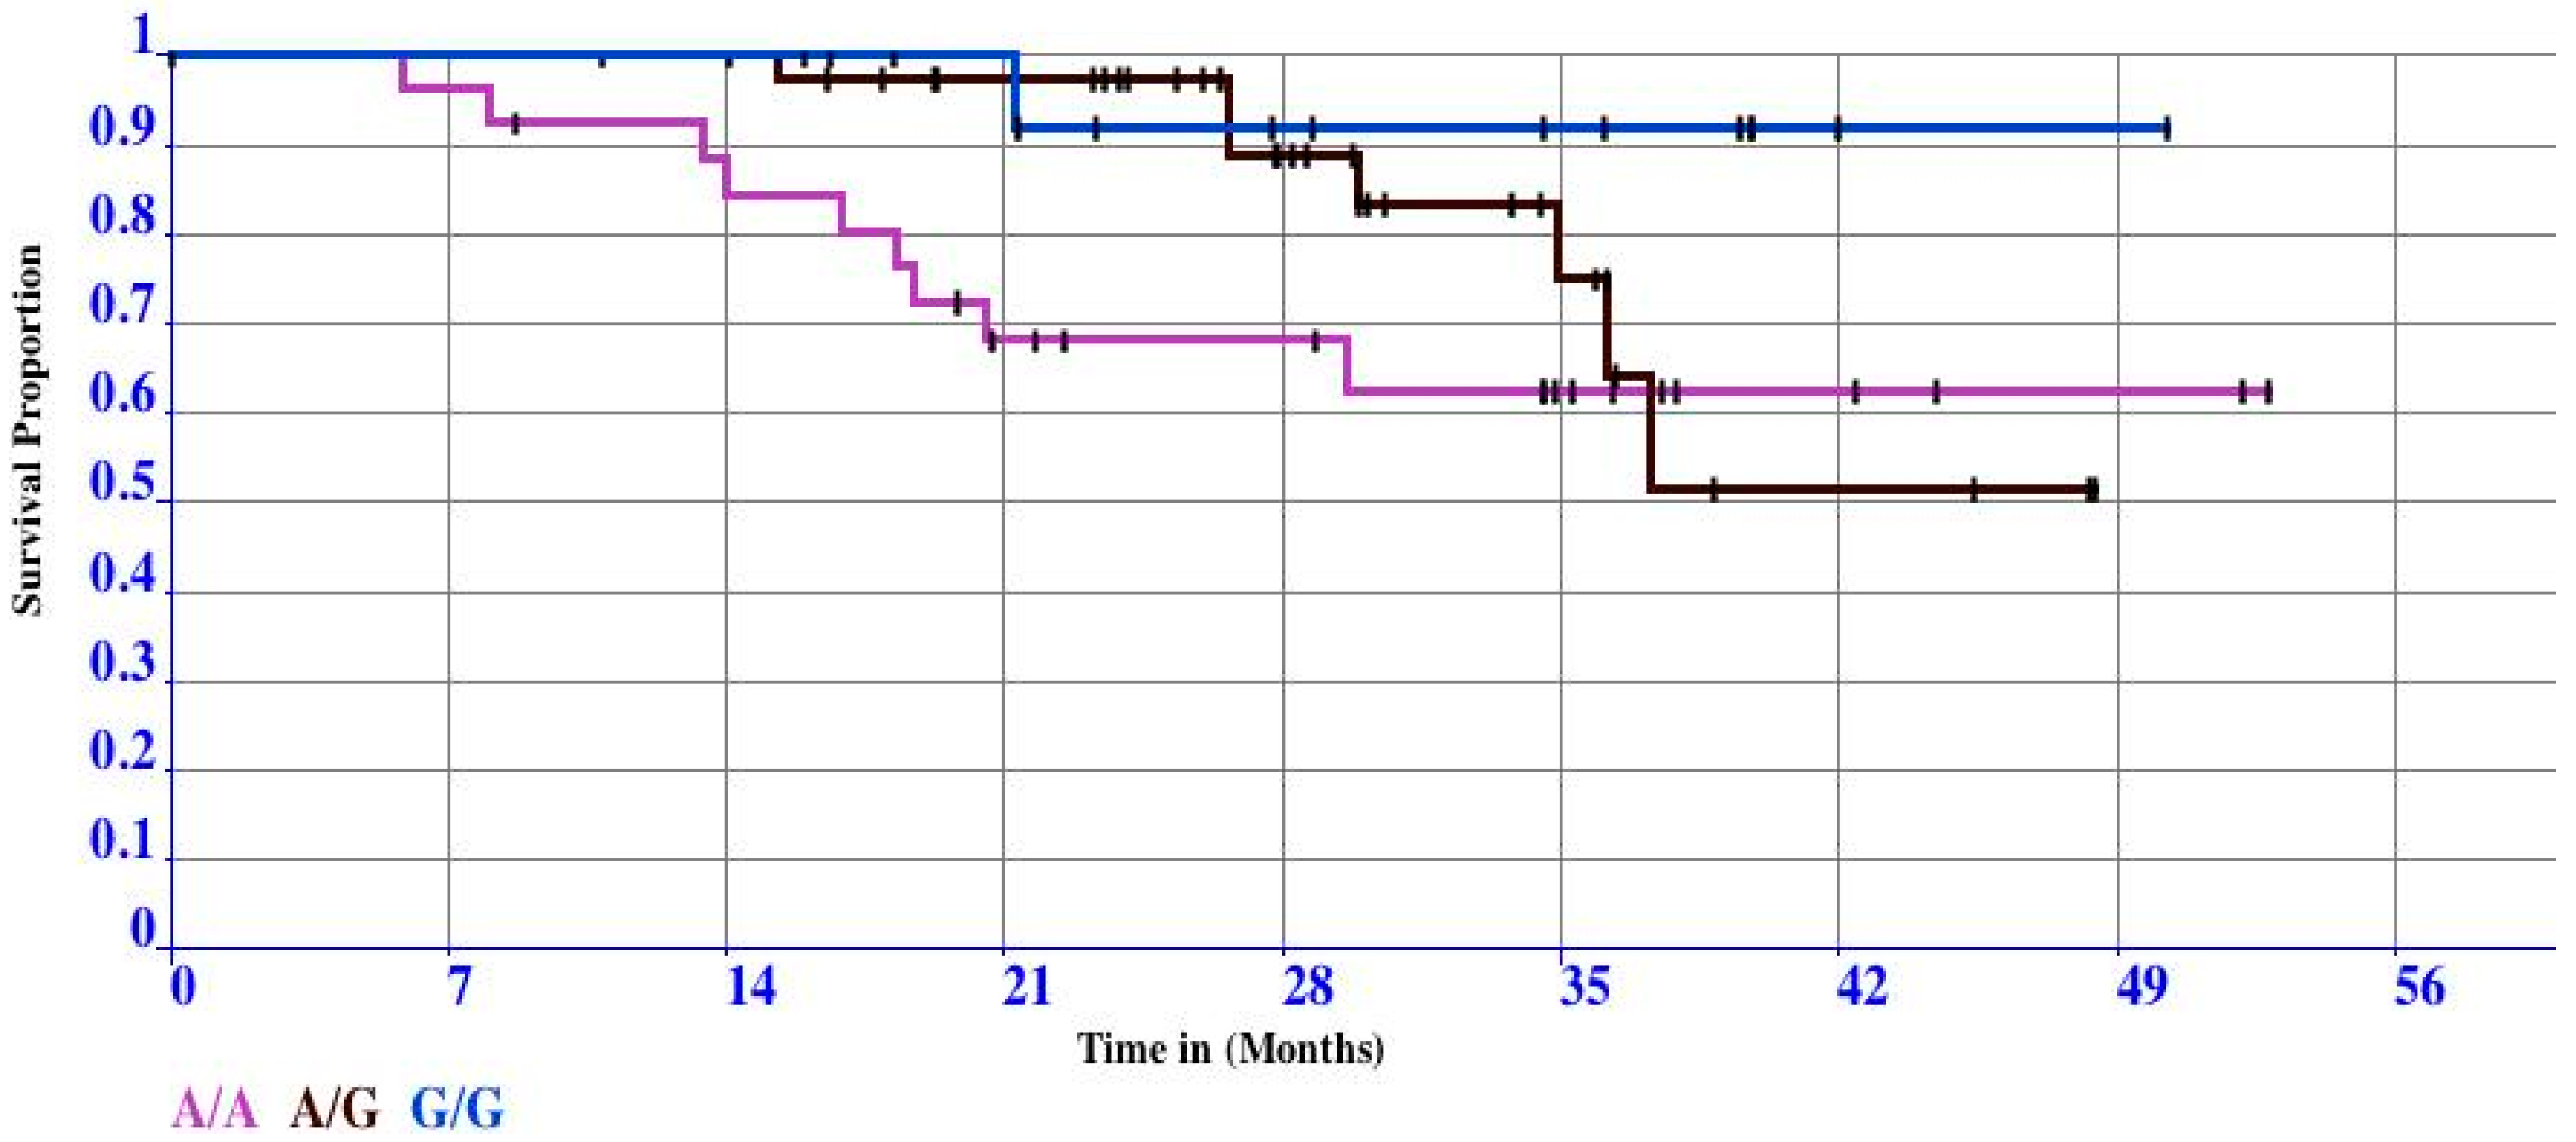
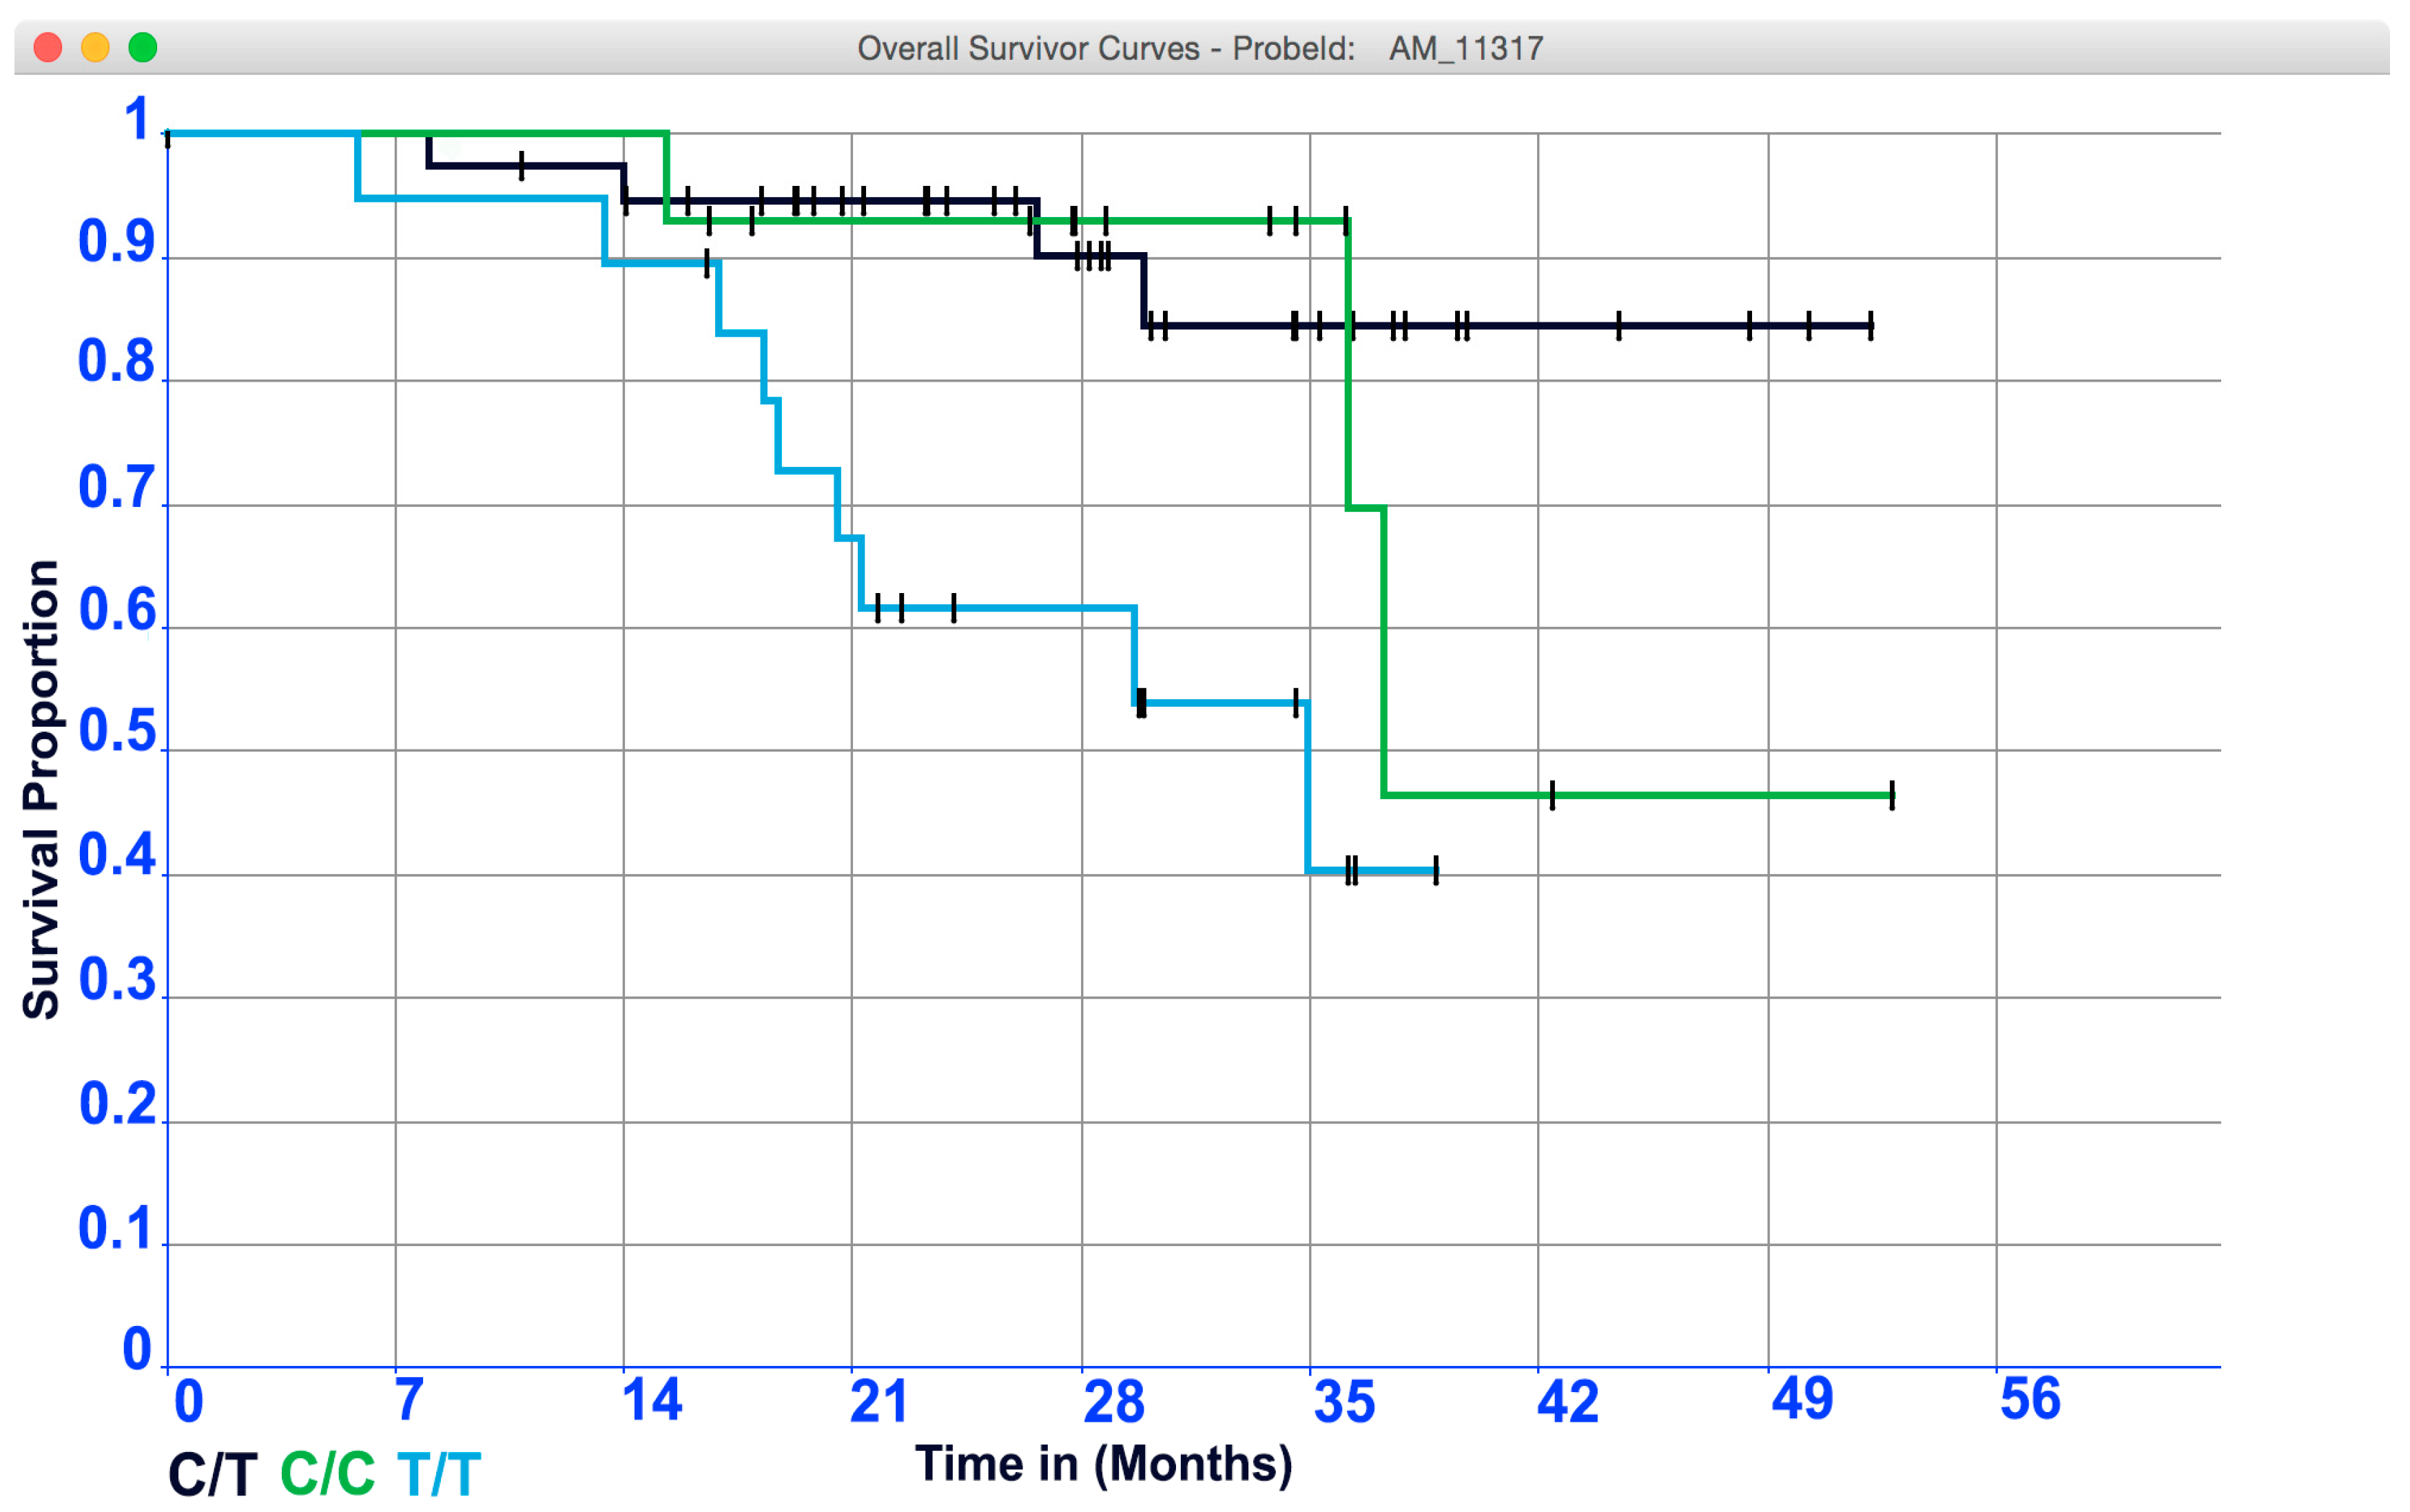
- Overall and Progression-Free survival curves visualizer: it is possible to display the survival curve related with a selected probe. Furthermore, the current version of OSAnalyzer provides the users with additional information for the median related with each curve, the log-rank p-value and the hazard-ratio value;
3.2. Case Study
4. Discussion
5. Conclusions
Acknowledgments
Author Contributions
Conflicts of Interest
Abbreviations
| SNP | Single Polymorphism Nucleotide |
| K and M | Kaplan-Meier |
| DMET | (Drug Metabolizing Enzymes and Transporters) |
| ADME | (Absorption, Distribution, Metabolism, and Excretion) |
| NGS | Next Generation Sequencing |
| GWAS | Genome Wide-Association Studies |
| OS | Overall Survival Analysis |
| PFS | Progression-Free Survival |
References
- Qin, L.X.; Levine, D.A. Study design and data analysis considerations for the discovery of prognostic molecular biomarkers: A case study of progression free survival in advanced serous ovarian cancer. BMC Med. Genom. 2016, 9, 1–6. [Google Scholar] [CrossRef] [PubMed]
- Wagle, N.; Berger, M.F.; Davis, M.J.; Blumenstiel, B.; DeFelice, M.; Pochanard, P.; Ducar, M.; van Hummelen, P.; MacConaill, L.E.; Hahn, W.C.; et al. High-Throughput Detection of Actionable Genomic Alterations in Clinical Tumor Samples by Targeted, Massively Parallel Sequencing. Cancer Discov. 2012, 2, 82–93. [Google Scholar] [CrossRef] [PubMed]
- Voelkerding, K.V.; Dames, S.; Durtschi, J.D. Next Generation Sequencing for Clinical Diagnostics-Principles and Application to Targeted Resequencing for Hypertrophic Cardiomyopathy: A Paper from the 2009 William Beaumont Hospital Symposium on Molecular Pathology. J. Mol. Diagn. 2010, 12, 539–551. [Google Scholar] [CrossRef] [PubMed]
- Agapito, G.; Cannataro, M.; Guzzi, P.H.; Milano, M. Using GO-WAR for mining cross-ontology weighted association rules. Comput. Methods Progr. Biomed. 2015, 120, 113–122. [Google Scholar] [CrossRef] [PubMed]
- Cannataro, M.; Guzzi, P.H.; Sarica, A. Data mining and life sciences applications on the grid. Wiley Interdiscip. Rev. Data Min. Knowl. Discov. 2013, 3, 216–238. [Google Scholar] [CrossRef]
- Guzzi, P.H.; Agapito, G.; Di Martino, M.T.; Arbitrio, M.; Tassone, P.; Tagliaferri, P.; Cannataro, M. DMET-Analyzer: Automatic analysis of Affymetrix DMET Data. BMC Bioinform. 2012, 13, 258. [Google Scholar] [CrossRef] [PubMed]
- Guzzi, P.H.; Di Martino, M.T.; Tradigo, G.; Veltri, P.; Tassone, P.; Tagliaferri, P.; Cannataro, M. Automatic summarisation and annotation of microarray data. Soft Comput. 2011, 15, 1505–1512. [Google Scholar] [CrossRef]
- Iafrate, A.J.; Feuk, L.; Rivera, M.N.; Listewnik, M.L.; Donahoe, P.K.; Qi, Y.; Scherer, S.W.; Lee, C. Detection of large-scale variation in the human genome. Nat. Genet. 2004, 36, 949–951. [Google Scholar] [CrossRef] [PubMed]
- Jörnsten, R.; Wang, H.Y.; Welsh, W.J.; Ouyang, M. DNA microarray data imputation and significance analysis of differential expression. Bioinformatics 2005, 21, 4155–4161. [Google Scholar] [CrossRef] [PubMed]
- Mizuno, H.; Kitada, K.; Nakai, K.; Sarai, A. PrognoScan: A new database for meta-analysis of the prognostic value of genes. BMC Med. Genom. 2009, 2, 18. [Google Scholar] [CrossRef] [PubMed]
- Guzzi, P.H.; Cannataro, M. Cannataro, μ-CS: An extension of the TM4 platform to manage Affymetrix binary data. BMC Bioinform. 2010, 11, 1–13. [Google Scholar] [CrossRef] [PubMed]
- Clark, T.G.; Bradburn, M.J.; Love, S.B.; Altman, D.G. Survival Analysis Part I: Basic concepts and first analyses. Br. J.Cancer 2003, 89, 232–238. [Google Scholar] [CrossRef] [PubMed]
- Kaplan, E.L.; Meier, P. Nonparametric Estimation from Incomplete Observations. J. Am. Stat. Assoc. 1958, 53, 457–481. [Google Scholar] [CrossRef]
- Mantel, N.; Haenszel, W. Statistical aspects of the analysis of data from retrospective studies of disease. J. Natl. Cancer Inst. 1959, 22, 719–748. [Google Scholar] [PubMed]
- Li, H.; Gui, J. Partial Cox regression analysis for high-dimensional microarray gene expression data. Bioinformatics 2004, 20 (Suppl. 1), i208–i215. [Google Scholar] [CrossRef] [PubMed]
- Tusher, V.G.; Tibshirani, R.; Chu, G. Significance analysis of microarrays applied to the ionizing radiation response. Proc. Natl. Acad. Sci. USA 2001, 98, 5116–5121. [Google Scholar] [CrossRef] [PubMed]
- Reich, M.; Liefeld, T.; Gould, J.; Lerner, J.; Tamayo, P.; Mesirov, J.P. GenePattern 2.0. Nat. Genet. 2006, 38, 500–501. [Google Scholar] [CrossRef] [PubMed]
- Győrffy, B.; Surowiak, P.; Budczies, J.; Lánczky, A. Online Survival Analysis Software to Assess the Prognostic Value of Biomarkers Using Transcriptomic Data in Non-Small-Cell Lung Cancer. PLoS ONE 2013, 8, e82241. [Google Scholar] [CrossRef] [PubMed] [Green Version]
- Zhang, W.; Ota, T.; Shridhar, V.; Chien, J.; Wu, B.; Kuang, R. Network-based Survival Analysis Reveals Subnetwork Signatures for Predicting Outcomes of Ovarian Cancer Treatment. PLoS Comput. Biol. 2013, 9, e1002975. [Google Scholar] [CrossRef] [PubMed]
- Schröder, M.S.; Culhane, A.C.; Quackenbush, J.; Haibe-Kains, B. Survcomp: An R/Bioconductor package for performance assessment and comparison of survival models. Bioinformatics 2011, 27, 3206–3208. [Google Scholar] [CrossRef] [PubMed]
- Gao, J.; Aksoy, B.A.; Dogrusoz, U.; Dresdner, G.; Gross, B.; Sumer, S.O.; Sun, Y.; Jacobsen, A.; Sinha, R.; Larsson, E.; et al. Integrative Analysis of Complex Cancer Genomics and Clinical Profiles Using the cBioPortal. Sci. Signal. 2013, 6. [Google Scholar] [CrossRef] [PubMed] [Green Version]
- Aguirre-Gamboa, R.; Gomez-Rueda, H.; Martínez-Ledesma, E.; Martínez-Torteya, A.; Chacolla-Huaringa, R.; Rodriguez-Barrientos, A.; Tamez-Pena, J.G.; Trevino, V. SurvExpress: An Online Biomarker Validation Tool and Database for Cancer Gene Expression Data Using Survival Analysis. PLoS ONE 2013, 8, e74250. [Google Scholar] [CrossRef] [PubMed]
- Battke, F.; Symons, S.; Nieselt, K. Mayday—Integrative analytics for expression data. BMC Bioinform. 2010, 11, 121. [Google Scholar] [CrossRef] [PubMed]


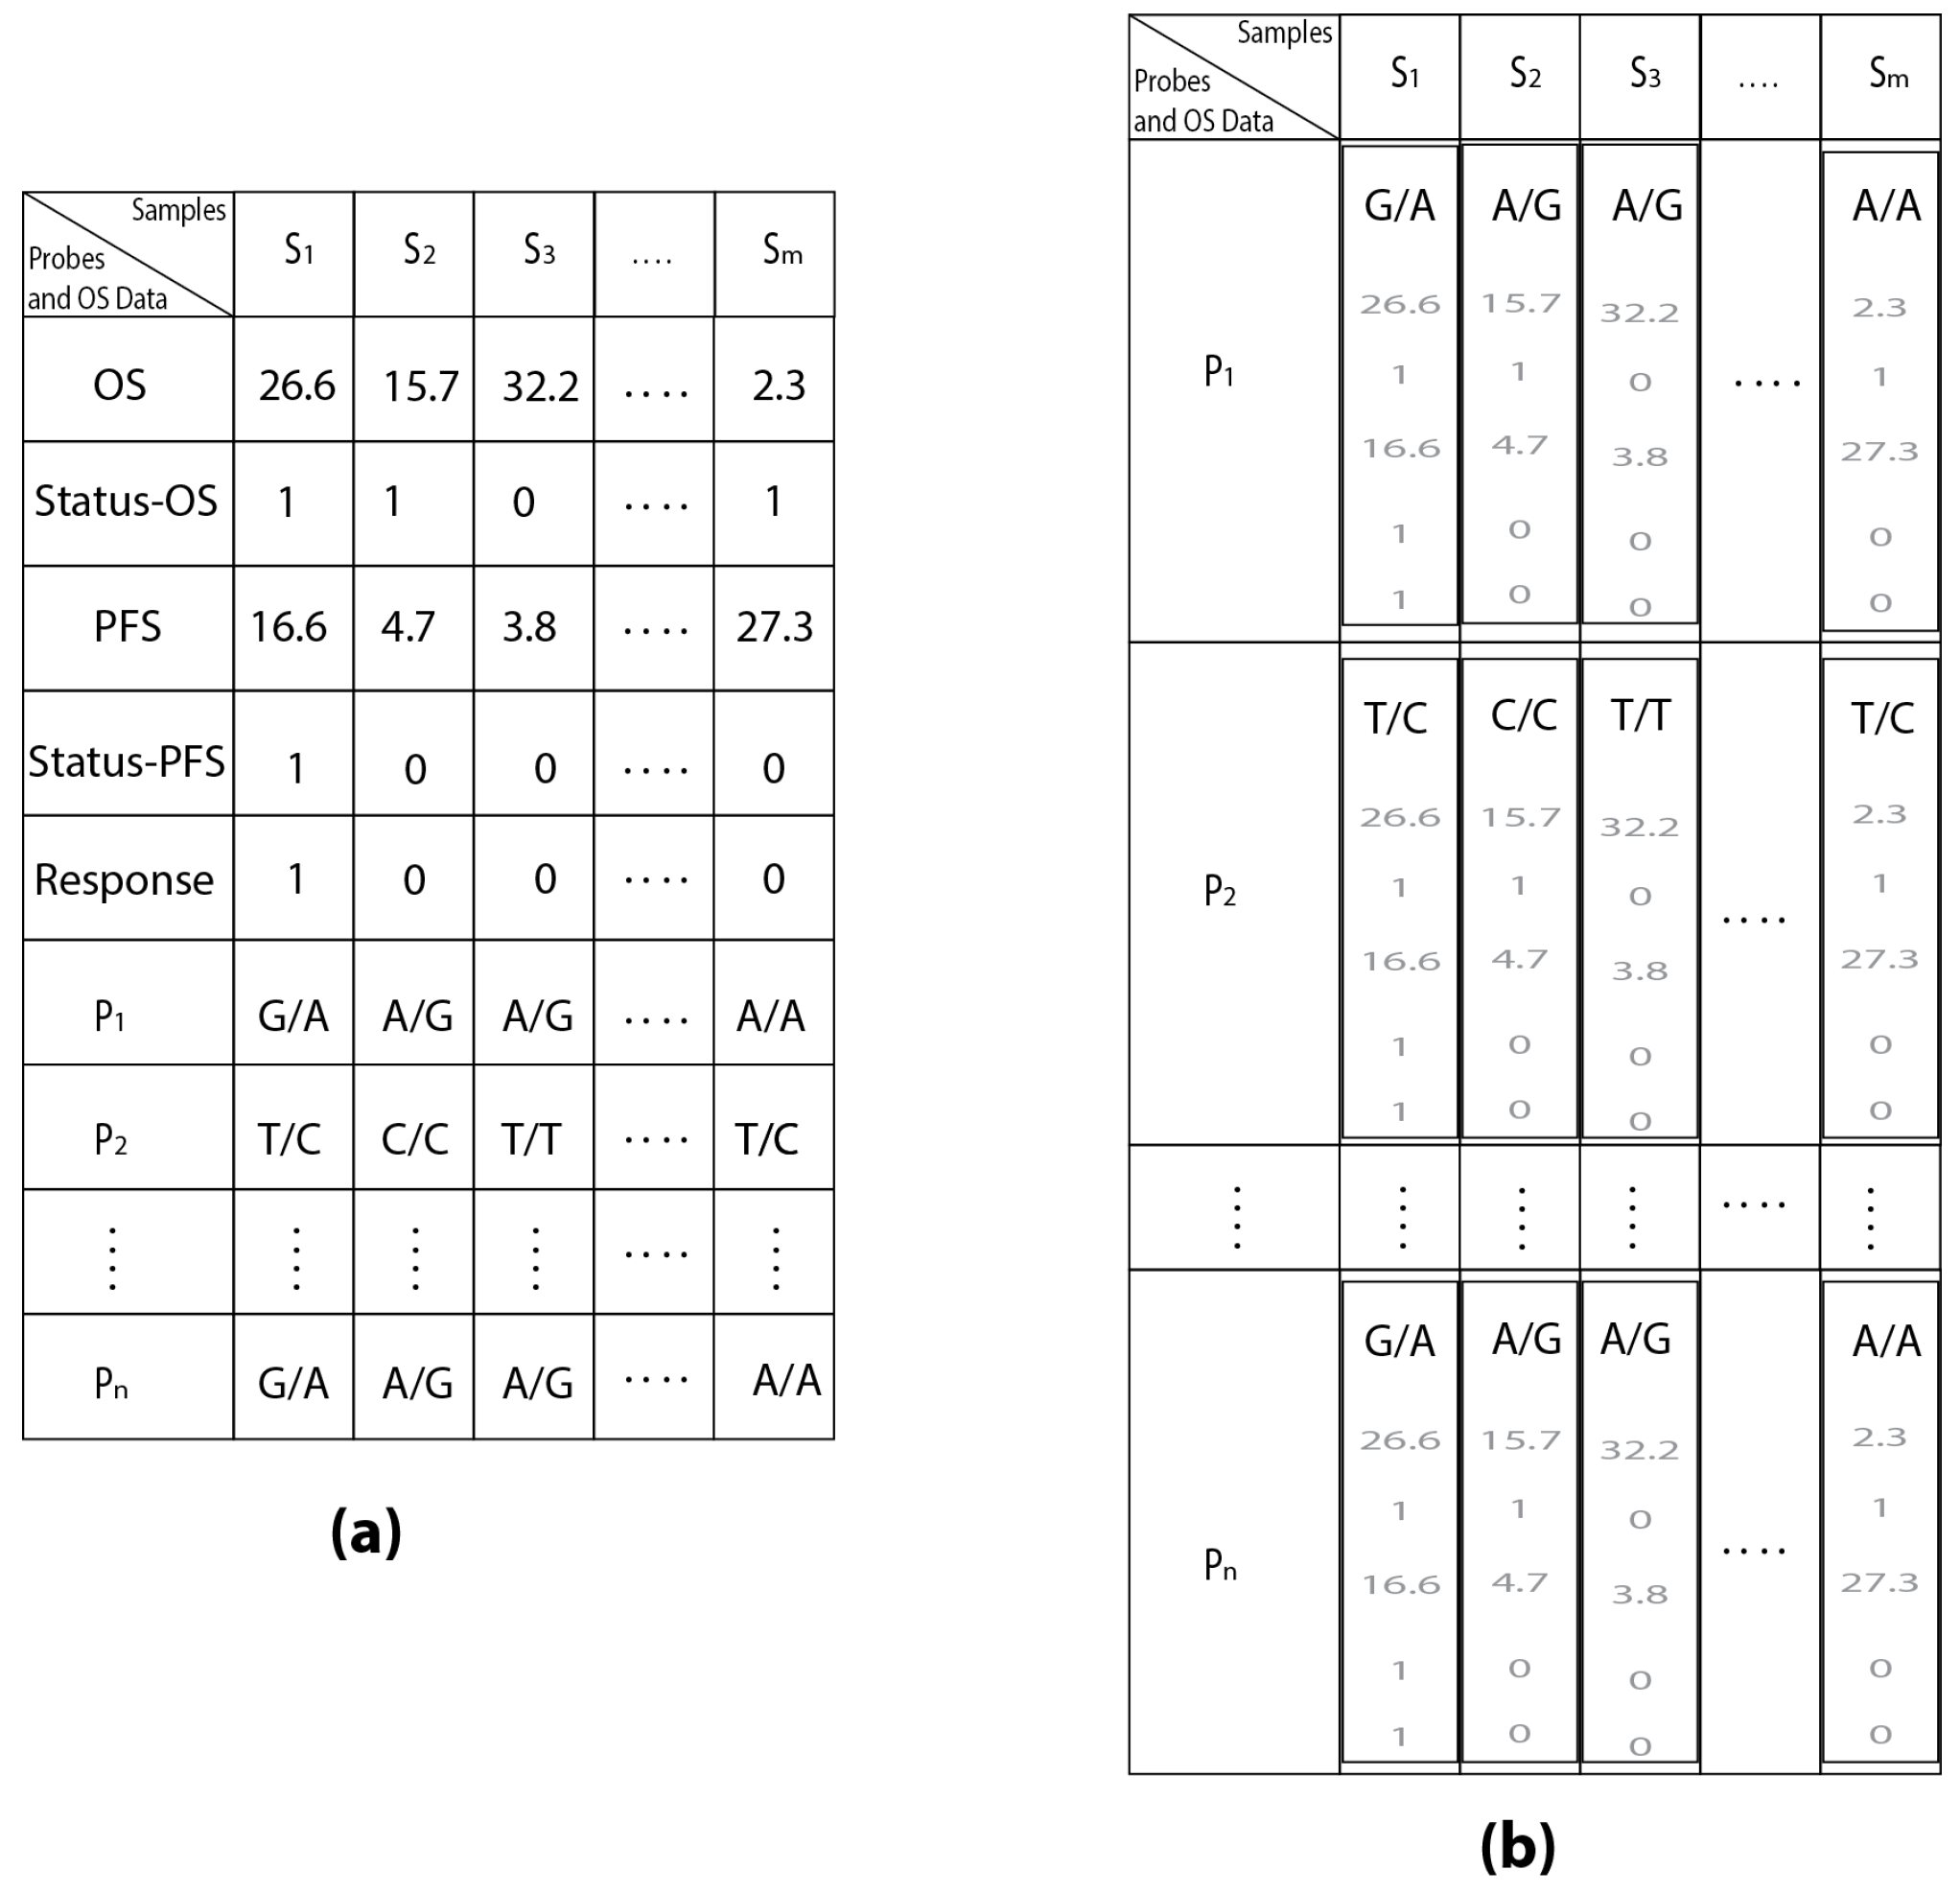
| Samples | S1 | S2 | S3 | ... | Sm | |
|---|---|---|---|---|---|---|
| Probes | ||||||
| P1 | G/A | A/G | A/G | ... | A/A | |
| P2 | T/C | C/C | T/T | ... | T/C | |
| ⋮ | ⋮ | ⋮ | ⋮ | ⋮ | ⋮ | |
| Pn | G/A | A/G | A/G | ... | A/G | |
| Samples | S1 | S2 | S3 | ... | Sm | |
|---|---|---|---|---|---|---|
| Probes and OS Data | ||||||
| OS | 26.6 | 15.7 | 32.2 | ... | 2.3 | |
| Status-OS | 1 | 1 | 0 | ... | 1 | |
| PFS | 16.6 | 4.7 | 3.8 | ... | 27.3 | |
| Status-PFS | 1 | 0 | 0 | ... | 1 | |
| Response | 1 | 0 | 0 | ... | 0 | |
| P1 | G/A | A/G | A/G | ... | A/A | |
| P2 | T/C | C/C | T/T | ... | T/C | |
| ⋮ | ⋮ | ⋮ | ⋮ | ⋮ | ⋮ | |
| Pn | G/A | A/G | A/G | ... | A/A | |
© 2016 by the authors; licensee MDPI, Basel, Switzerland. This article is an open access article distributed under the terms and conditions of the Creative Commons Attribution (CC-BY) license (http://creativecommons.org/licenses/by/4.0/).
Share and Cite
Agapito, G.; Botta, C.; Guzzi, P.H.; Arbitrio, M.; Di Martino, M.T.; Tassone, P.; Tagliaferri, P.; Cannataro, M. OSAnalyzer: A Bioinformatics Tool for the Analysis of Gene Polymorphisms Enriched with Clinical Outcomes. Microarrays 2016, 5, 24. https://doi.org/10.3390/microarrays5040024
Agapito G, Botta C, Guzzi PH, Arbitrio M, Di Martino MT, Tassone P, Tagliaferri P, Cannataro M. OSAnalyzer: A Bioinformatics Tool for the Analysis of Gene Polymorphisms Enriched with Clinical Outcomes. Microarrays. 2016; 5(4):24. https://doi.org/10.3390/microarrays5040024
Chicago/Turabian StyleAgapito, Giuseppe, Cirino Botta, Pietro Hiram Guzzi, Mariamena Arbitrio, Maria Teresa Di Martino, Pierfrancesco Tassone, Pierosandro Tagliaferri, and Mario Cannataro. 2016. "OSAnalyzer: A Bioinformatics Tool for the Analysis of Gene Polymorphisms Enriched with Clinical Outcomes" Microarrays 5, no. 4: 24. https://doi.org/10.3390/microarrays5040024