
Blueberry Consumption Affects Serum Uric Acid Concentrations in Older Adults in a Sex-Specific Manner


Abstract
:1. Introduction
2. Research Design and Methods
2.1. Study Population
2.2. Uric Acid
2.3. Physical Examination
2.4. Statistical Analysis
3. Results
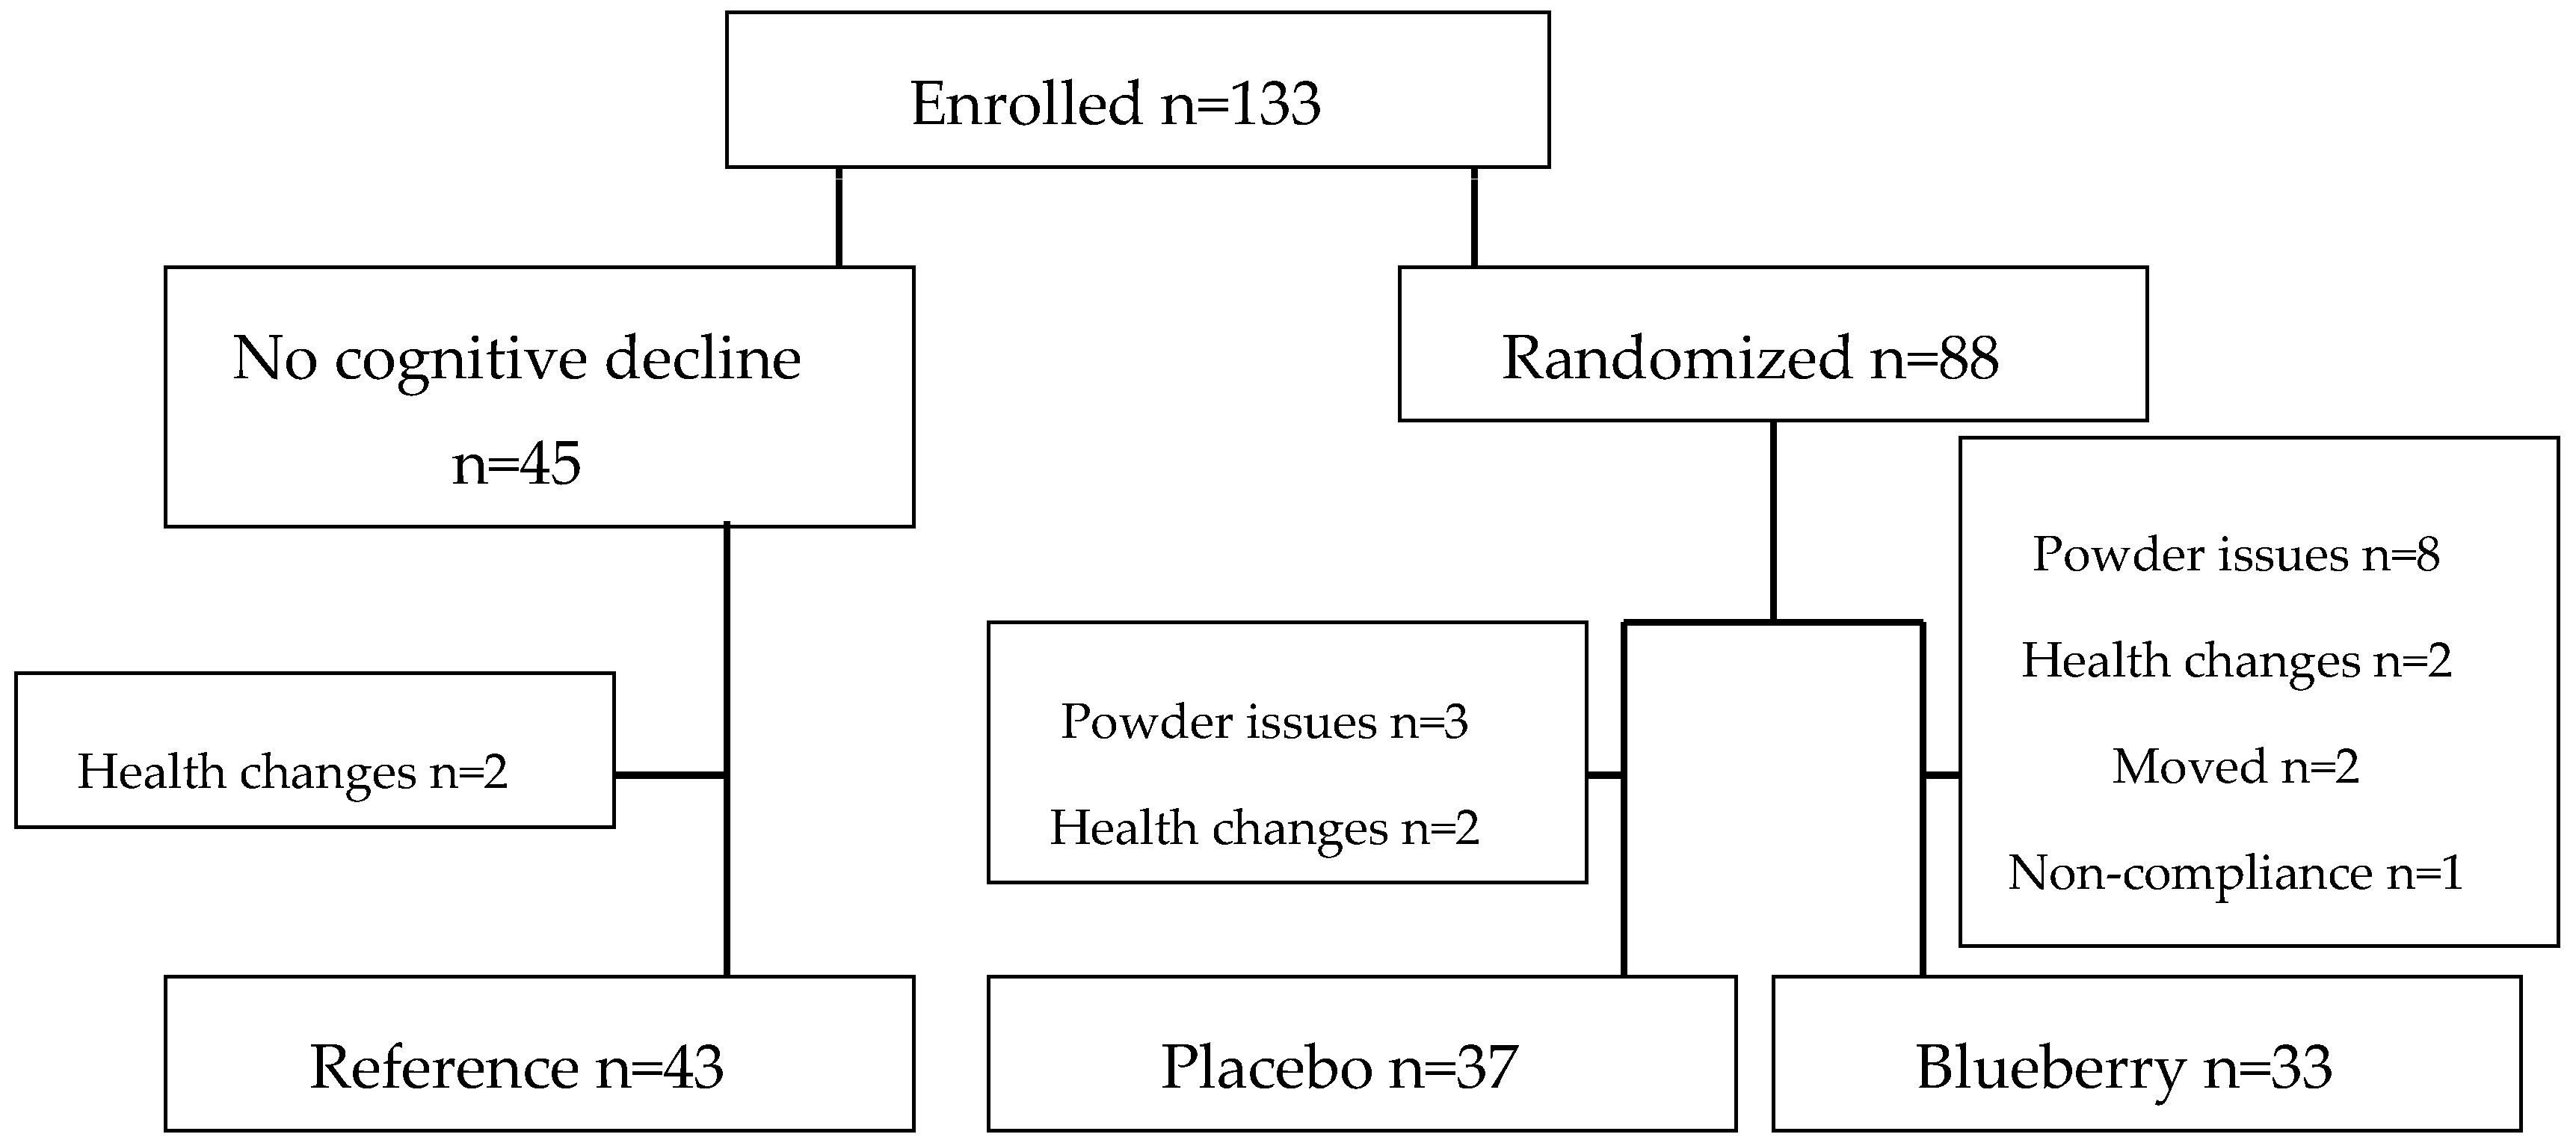
3.1. Compliance
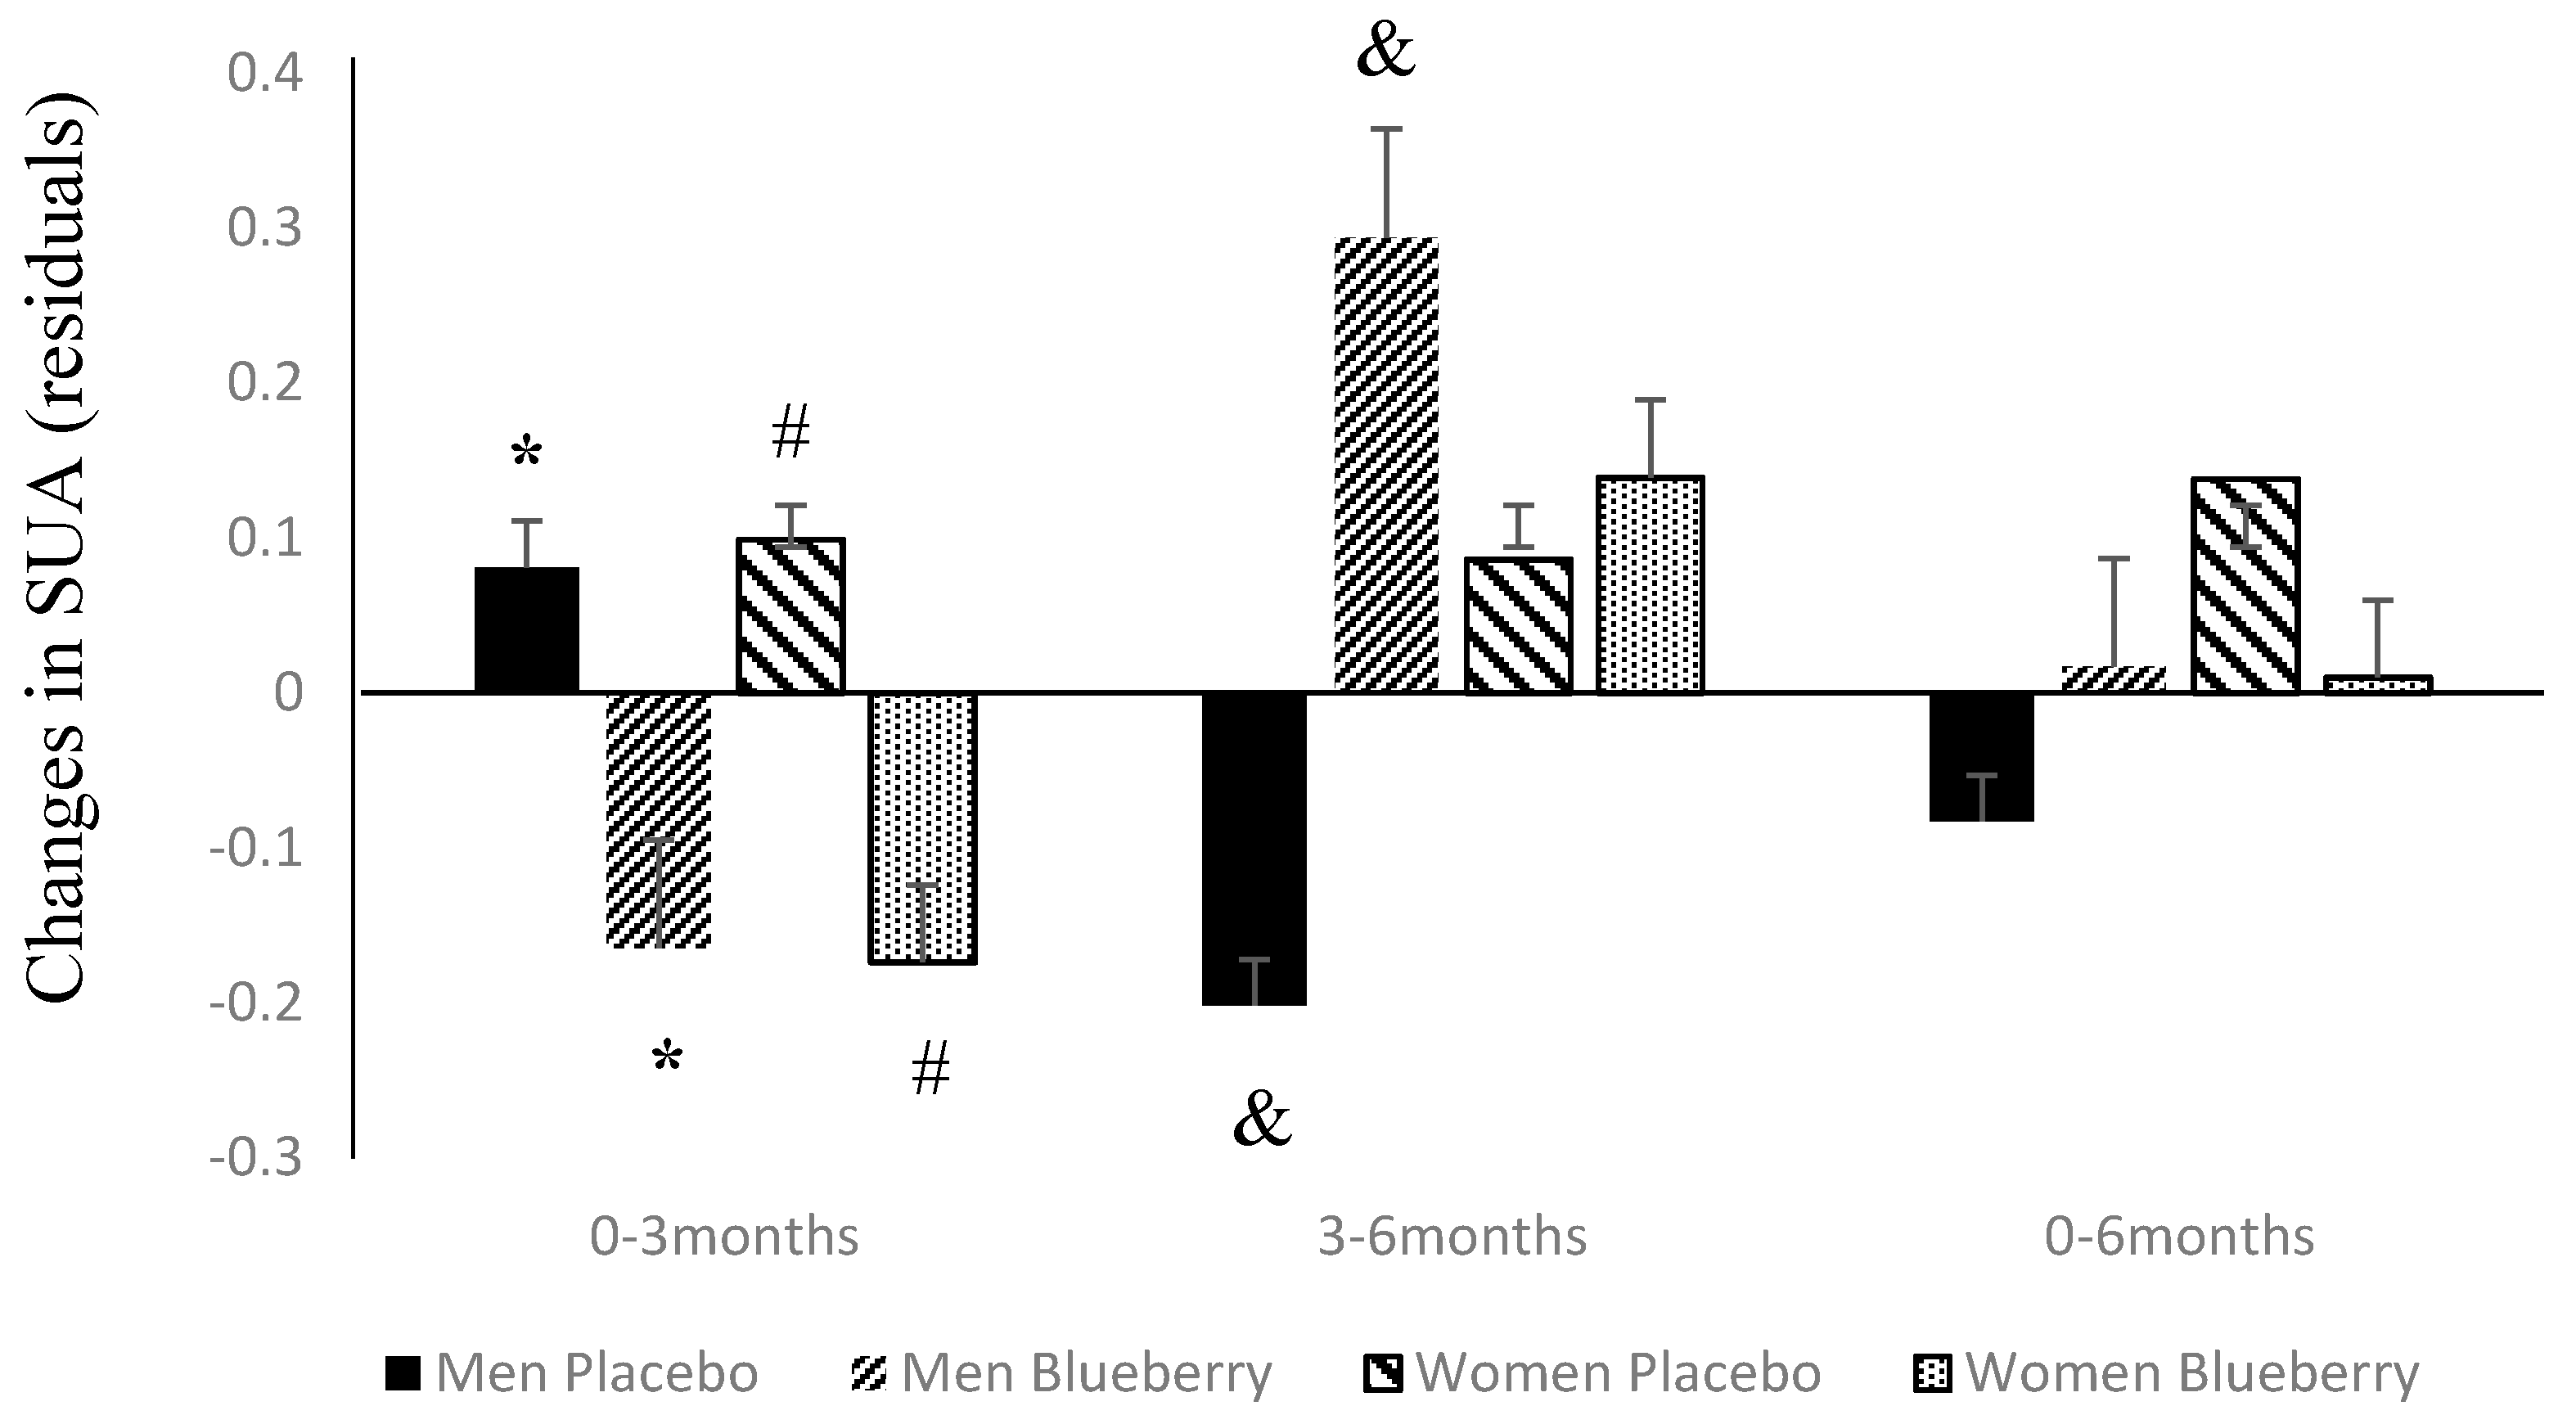
3.2. Changes in SUA Following Supplementation with Blueberries or Placebo
3.3. Changes in SUA and Its Relation to Changes in Other CVD Risk Factors
4. Discussion
5. Conclusions
Acknowledgments
Author Contributions
Conflicts of Interest
Abbreviations
| BMI | body mass index |
| CKD | chronic kidney disease |
| CVD | cardiovascular disease |
| SUA | serum uric acid |
References
- Lippi, G.; Montagnana, M.; Franchini, M.; Favaloro, E.J.; Targher, G. The paradoxical relationship between serum uric acid and cardiovascular disease. Clin. Chim. Acta 2008, 392, 1–7. [Google Scholar] [CrossRef] [PubMed]
- Ames, B.N.; Cathcart, R.; Schwiers, E.; Hochstein, P. Uric acid provides an antioxidant defense in humans against oxidant- and radical-caused aging and cancer: A hypothesis. Proc. Natl. Acad. Sci. USA 1981, 78, 6858–6862. [Google Scholar] [CrossRef] [PubMed]
- Fabrinni, E.; Serafini, M.; Baric, I.C.; Hazen, S.L.; Klein, S. Effect of plasma uric acid on antioxidant capcaity, oxidative stress, and insulin sensitivity in obese subjects. Diabetes 2014, 63, 976–981. [Google Scholar] [CrossRef] [PubMed]
- Sautin, Y.Y.; Nakagawa, T.; Zharikov, S.; Johnson, R.J. Adverse effects of the classic antioxidant uric acid in adipocytes: NADPH oxidase-mediated oxidative/nitrosative stress. Am. J. Physiol. Cell. Physiol. 2007, 293, C584–C596. [Google Scholar] [CrossRef] [PubMed]
- Fang, J.; Alderman, M.H. Serum uric acid and cardiovascular mortality the NHANES I epidemiologic follow-up study, 1971–1992. National health and nutrition examination survey. JAMA 2000, 283, 2404–2410. [Google Scholar] [CrossRef] [PubMed]
- Niskanen, L.K.; Laaksonen, D.E.; Nyyssonen, K.; Alfthan, G.; Lakka, H.M.; Lakka, T.A.; Salonen, J.T. Uric acid level as a risk factor for cardiovascular and all-cause mortality in middle-aged men: A prospective cohort study. Arch. Intern. Med. 2004, 164, 1546–1551. [Google Scholar] [CrossRef] [PubMed]
- Culleton, B.F.; Larson, M.G.; Kannel, W.B.; Levy, D. Serum uric acid and risk for cardiovascular disease and death: The framingham heart study. Ann. Intern. Med. 1999, 131, 7–13. [Google Scholar] [CrossRef] [PubMed]
- Arts, I.C.; Hollman, P.C. Polyphenols and disease risk in epidemiologic studies. Am. J. Clin. Nutr. 2005, 81, 317S–325S. [Google Scholar] [PubMed]
- Scalbert, A.; Manach, C.; Morand, C.; Remesy, C.; Jimenez, L. Dietary polyphenols and the prevention of diseases. Crit. Rev. Food Sci. Nutr. 2005, 45, 287–306. [Google Scholar] [CrossRef] [PubMed]
- Manach, C.; Mazur, A.; Scalbert, A. Polyphenols and prevention of cardiovascular diseases. Curr. Opin. Lipidol. 2005, 16, 77–84. [Google Scholar] [CrossRef] [PubMed]
- Pandey, K.B.; Rizvi, S.I. Plant polyphenols as dietary antioxidants in human health and disease. Oxid. Med. Cell. Longev. 2009, 2, 270–278. [Google Scholar] [CrossRef] [PubMed]
- Boban, M.; Modun, D.; Music, I.; Vukovic, J.; Brizic, I.; Salamunic, I.; Obad, A.; Palada, I.; Dujic, Z. Red wine induced modulation of vascular functioin: Separating the role of polyphenols, ethanol and urates. J. Cardiovasc. Pharmacol. 2006, 47, 695–701. [Google Scholar] [CrossRef] [PubMed]
- Modun, D.; Music, I.; Vukovic, J.; Brizic, I.; Katalinic, V.; Obad, A.; Palada, I.; Dujic, Z.; Boban, M. The increase in human plasma antioxidant capacity after red wine consumption is due to both plasma urate and wine polyphenols. Atherosclerosis 2008, 197, 250–256. [Google Scholar] [CrossRef] [PubMed]
- Jacob, R.A.; Spinozzi, G.M.; Simon, V.A.; Kelley, D.S.; Prior, R.L.; Hess-Pierce, B.; Kader, A.A. Consumption of cherries lowers plasma urate in healthy women. J. Nutr. 2003, 133, 1826–1829. [Google Scholar] [PubMed]
- Sadowska-Krepa, E.; Klapcinska, B.; Podgorski, T.; Szade, B.; Tyl, K.; Hadzik, A. Effects of supplementation with acai (Euterpe oleracea Mart.) berry-based juice blend on the blood antioxidant defence capcacity and lipid profile in junior hurdlers. A pilot study. Biol. Sport 2015, 32, 161–168. [Google Scholar] [CrossRef] [PubMed]
- Cassidy, A.; Mukamal, K.J.; Liu, L.; Franz, M.; Eliassen, A.H.; Rimm, E.B. High anthocyanin intake is associated with a reduced risk of myocardial infarction in young and middle-aged women. Circulation 2013, 127, 188–196. [Google Scholar] [CrossRef] [PubMed]
- Cassidy, A.; O’Reilly, E.J.; Kay, C.; Sampson, L.; Franz, M.; Forman, J.P.; Curhan, G.; Rimm, E.B. Habitual intake of flavonoid subclasses and incident hypertension in adults. Am. J. Clin. Nutr. 2011, 93, 338–347. [Google Scholar] [CrossRef] [PubMed]
- Wedick, N.M.; Pan, A.; Cassidy, A.; Rimm, E.B.; Sampson, L.; Rosner, B.; Willett, W.; Hu, F.B.; Sun, Q.; van Dam, R.M. Dietary flavonoid intakes and risk of type 2 diabetes in US men and women. Am. J. Clin. Nutr. 2012, 95, 925–933. [Google Scholar] [CrossRef] [PubMed]
- Stull, A.J.; Cash, K.C.; Champagne, C.M.; Gupta, A.K.; Boston, R.; Beyl, R.A.; Johnson, W.D.; Cefalu, W.T. Blueberries improve endothelial function, but not blood pressure, in adults with metabolic syndrome: A randomized, double-blind, placebo-controlled clinical trial. Nutrient 2015, 7, 4107–4123. [Google Scholar] [CrossRef] [PubMed]
- Johnson, S.A.; Figueroa, A.; Navaei, N.; Wong, A.; Kalfon, R.; Ormsbee, L.T.; Feresin, R.G.; Elam, M.L.; Hooshmand, S.; Payton, M.E.; et al. Daily bluberry consumption improves blood pressure and arterial stiffness in postmenopausal women with pre and stage1 hypertension: A randomized, double-blind, placebo-controlled clinical trial. J. Acad. Nutr. Diet. 2015, 115, 369–377. [Google Scholar] [CrossRef] [PubMed]
- Rodriguez-Mateos, A.; Rendeiro, C.; Bergillos-Meca, T.; Tabatabaee, S.; George, T.W.; Heiss, C.; Spencer, J.P. Intake and time dependence of bluberry flavonoid-induced improvements in vascular function: A randolized, controlled, double-blind, crossover intervention study with mechanistic insights into biological activity. Am. J. Clin. Nutr. 2013, 98, 1179–1191. [Google Scholar] [CrossRef] [PubMed]
- Blacker, B.C.; Snyder, S.M.; Eggett, D.L.; Parker, T.L. Consumption of blueberries with a high-carbohydrate, low-fat breakfast decreases postprandial serum markers of oxidation. Br. J. Nutr. 2013, 109, 1670–1677. [Google Scholar] [CrossRef] [PubMed]
- Gustafson, S.J.; Yousef, G.G.; Grusak, M.A.; Lila, M.A. Effect of postharvest handling on phytochemical concentrations and bioactive potential in wild blueberry fruit. J. Berry Res. 2012, 2, 215–227. [Google Scholar]
- Serafini, M.; Testa, M.F.; Villano, D.; Pecorari, M.; van Wieren, K.; Azzini, E.; Brambilla, A.; Maiani, G. Antioxidant activity of blueberry fruit is impaired by association with milk. Free Radic. Biol. Med. 2009, 46, 769–774. [Google Scholar] [CrossRef] [PubMed]
- Wu, A.H.; Gladden, J.D.; Ahmed, M.; Ahmed, A.; Filippatos, G. Relation of serum uric acid to cardiovascular disease. Int. J. Cardiol. 2016, 213, 4–7. [Google Scholar] [CrossRef] [PubMed]
- Voruganti, V.S.; Franceschini, N.; Haack, K.; Laston, S.; MacCluer, J.W.; Umans, J.G.; Comuzzie, A.G.; North, K.E.; Cole, S.A. Replication of the effect of SLC2A9 genetic variation on serum uric acid levels in American Indians. Eur. J. Hum. Genet. 2014, 22, 938–943. [Google Scholar] [CrossRef] [PubMed]
- Voruganti, V.S.; Laston, S.; Haack, K.; Mehta, N.R.; Cole, S.A.; Butte, N.F.; Comuzzie, A.G. Serum uric acid concentrations and SLC2A9 genetic variation in Hispanic children: The Viva La Familia Study. Am. J. Clin. Nutr. 2015, 101, 725–732. [Google Scholar] [CrossRef] [PubMed]
- Voruganti, V.S.; Nath, S.D.; Cole, S.A.; Thameem, F.; Jowett, J.B.; Bauer, R.; MacCluer, J.W.; Blangero, J.; Comuzzie, A.G.; Abboud, H.E.; et al. Genetics of variation in serum uric acid and cardiovascular risk factors in Mexican Americans. J. Clin. Endocrinol. Metab. 2009, 94, 632–638. [Google Scholar] [CrossRef] [PubMed]
- Liu, M.; He, Y.; Jiang, B.; Wu, L.; Yang, S.; Wang, Y.; Li, X. Association between serum uric acid level and metabolic syndrome and its sex difference in a Chinese community elderly population. Int. J. Endocrinol. 2014, 2014, 754678. [Google Scholar] [CrossRef] [PubMed]
- MacCluer, J.W.; Scavini, M.; Shah, V.O.; Cole, S.A.; Laston, S.L.; Voruganti, V.S.; Paine, S.S.; Eaton, A.J.; Comuzzie, A.G.; Tentori, F.; et al. Heritability of measures of kidney disease among Zuni Indians: The Zuni Kidney Project. Am. J. Kidney Dis. 2010, 56, 289–302. [Google Scholar] [CrossRef] [PubMed]
- Zurlo, A.; Veronese, N.; Giantin, V.; Maselli, M.; Zambon, S.; Maggi, S.; Musacchio, E.; Toffanello, E.D.; Sartori, L.; Perissinotto, E.; et al. High serum uric acid levels increase the risk of metabolic syndrome in elderly women: The PRO. VA study. Nutr. Metab. Cardiovasc. Dis. 2016, 26, 27–35. [Google Scholar] [CrossRef] [PubMed]
- Moulin, S.R.; Baldo, M.P.; Souza, J.B.; Luchi, W.M.; Capingana, D.P.; Magalhaes, P.; Mill, J.G. Distribution of serum uric acid in black africans and its association with cardiovascular risk factors. J. Clin. Hypertens. 2016. [Google Scholar] [CrossRef] [PubMed]
- Kawabe, M.; Sato, A.; Hoshi, T.; Sakai, S.; Hiraya, D.; Watabe, H.; Kakefuda, Y.; Ishibashi, M.; Abe, D.; Takeyasu, N.; et al. Gender differences in the association between serum uric acid and prognosis in patients with acute coronary syndrome. J. Cardiol. 2016, 67, 170–176. [Google Scholar] [CrossRef] [PubMed]
- Chou, P.; Lin, K.C.; Lin, H.Y.; Tsai, S.T. Gender differences in the relationships of serum uric acid with fasting serum insulin and plasma glucose in patients without diabetes. J. Rheumatol. 2001, 28, 571–576. [Google Scholar] [PubMed]
- Lippi, G.; Montagnana, M.; Luca Salvagno, G.; Targher, G.; Cesare Guidi, G. Epidemiological association between uric acid concentration in plasma, lipoprotein(a), and the traditional lipid profile. Clin. Cardiol. 2010, 33, E76–E80. [Google Scholar] [CrossRef] [PubMed]
- Rodrigues, S.L.; Baldo, M.P.; Capingana, P.; Magalhaes, P.; Dantas, E.M.; Molina Mdel, C.; Salaroli, L.B.; Morelato, R.L.; Mill, J.G. Gender distribution of serum uric acid and cardiovascular risk factors: Population based study. Arq. Bras. Cardiol. 2012, 98, 13–21. [Google Scholar] [CrossRef] [PubMed]
- Wang, S.F.; Shu, L.; Wang, S.; Wang, X.Q.; Mu, M.; Hu, C.Q.; Liu, K.Y.; Zhao, Q.H.; Hu, A.L.; Bo, Q.L.; et al. Gender difference in the association of hyperuricemia with hypertension in a middle-aged Chinese population. Blood Press. 2014, 23, 339–344. [Google Scholar] [CrossRef] [PubMed]


| Composition | Blueberry | Placebo |
|---|---|---|
| Calories | 139 | 137 |
| Saturated Fat (g) | 0.084 | 0.000 |
| Monounsaturated Fatty Acids (g) | 0.138 | 0.000 |
| Polyunsaturated Fatty Acids (g) | 0.403 | 0.004 |
| Trans Fatty Acids (g) | 0.003 | 0.000 |
| Cholesterol (g) | 0.37 | 0.35 |
| Sodium (mg) | 2.60 | 7.46 |
| Carbohydrates (g) | 32.08 | 34.26 |
| Fiber (g) | 7.05 | 0.02 |
| Fructose (g) | 11.47 | 4.56 |
| Glucose (g) | 10.65 | 0.30 |
| Sucrose (g) | 0.05 | 0.04 |
| Maltose (g) | 0.07 | 0.54 |
| Lactose (g) | 0.04 | 0.04 |
| Protein (g) | 1.08 | 0.27 |
| Calcium (g) | 37.25 | 3.54 |
| Iron (g) | 0.54 | 0.05 |
| Vitamin C (g) | 9.34 | 0.25 |
| Trait | Baseline | Mean (SD) 3 Months | 6 Months |
|---|---|---|---|
| Age | 72.68 ± 4.3 | ||
| Body weight (lb) | 170.17 ± 31.7 | 171.43 ± 31.2 | 171.52 ± 31.5 |
| Waist circumference (in) | 39.60 ± 4.0 | 39.86 ± 4.2 | 39.61 ± 4.0 |
| Systolic blood pressure (mmHg) | 131.76 ± 17.3 | 129.47 ± 16.3 | 130.59 ± 16.9 |
| Diastolic blood pressure (mmHg) | 74.42 ± 9.1 | 73.68 ± 9.2 | 73.44 ± 10.9 |
| Glucose (mg/dL) | 100.22 ± 11.5 | 98.97 ± 13.3 | 99.88 ± 12.6 |
| Triglycerides (mg/dL) | 137.29 ± 97.7 | 131.28 ± 69.2 | 127.82 ± 64.4 |
| Total cholesterol (mg/dL) | 177.98 ± 34.4 | 179.48 ± 33.0 | 177.70 ± 36.7 |
| LDL cholesterol (mg/dL) | 98.50 ± 28.3 | 99.00 ± 27.0 | 97.10 ± 30.6 |
| HDL cholesterol (mg/dL) | 53.64 ± 16.0 | 54.73 ± 16.5 | 54.68 ± 16.5 |
| SUA (mg/dL) | 5.75 ± 1.3 | 5.21 ± 1.4 | 5.66 ± 1.3 |
| Trait ** | CVD Risk Factor | β (SE) | t | p Value * |
|---|---|---|---|---|
| Baseline—All | Waist circumference | 0.073 (0.03) | 2.67 | 0.009 |
| Glucose | 0.009 (0.009) | 0.96 | 0.34 | |
| Systolic blood pressure | −0.003 (0.008) | −0.42 | 0.67 | |
| Diastolic blood pressure | −0.0004 (0.01) | −0.03 | 0.98 | |
| Triglycerides | 0.003 (0.001) | 2.31 | 0.023 | |
| Total cholesterol | −0.003 (0.01) | 0.44 | 0.66 | |
| LDL cholesterol | 0.005 (0.01) | −0.30 | 0.77 | |
| HDL cholesterol | −0.010 (0.10) | 0.39 | 0.24 | |
| Men | Waist circumference | 0.0102 (0.06) | 0.18 | 0.86 |
| Glucose | −0.002 (0.02) | −0.15 | 0.88 | |
| Systolic blood pressure | −0.16 (0.01) | −1.27 | 0.21 | |
| Diastolic blood pressure | 0.24 (0.02) | 1.08 | 0.29 | |
| Triglycerides | 0.002 (0.002) | 1.51 | 0.14 | |
| Total cholesterol | −0.002 (0.02) | −0.13 | 0.90 | |
| LDL cholesterol | −0.002 (0.01) | 0.12 | 0.91 | |
| HDL cholesterol | −0.002 (0.02) | −0.15 | 0.88 | |
| Women | Waist circumference | 0.085 (0.03) | 2.72 | 0.009 |
| Glucose | 0.018 (0.01) | 1.33 | 0.19 | |
| Systolic blood pressure | 0.003 (0.01) | 0.25 | 0.80 | |
| Diastolic blood pressure | −0.173 (0.02) | −0.95 | 0.35 | |
| Triglycerides | 0.002 (0.01) | −0.78 | 0.44 | |
| Total cholesterol | −0.004 (0.01) | −0.31 | 0.76 | |
| LDL cholesterol | −0.008 (0.02) | 0.51 | 0.61 | |
| HDL cholesterol | −0.09 (0.1) | 1.33 | 0.19 | |
| Changes over 6-month period **—All | Waist circumference | 0.004 (0.1) | 0.08 | 0.94 |
| Glucose | 0.014 (0.01) | 0.96 | 0.34 | |
| Systolic blood pressure | −0.009 (0.01) | −0.84 | 0.41 | |
| Diastolic blood pressure | −0.0003 (0.01) | −0.02 | 0.98 | |
| Triglycerides | −0.0003 (0.002) | −0.17 | 0.87 | |
| Total cholesterol | −0.008 (0.02) | −0.50 | 0.62 | |
| LDL cholesterol | 0.021 (0.02) | 1.1 | 0.28 | |
| HDL cholesterol | 0.036 (0.02) | 1.58 | 0.12 | |
| Men | Waist circumference | 0.083 (0.05) | 1.6 | 0.14 |
| Glucose | −0.045 (0.02) | −2.19 | 0.05 | |
| Systolic blood pressure | −0.022 (0.02) | −1.33 | 0.21 | |
| Diastolic blood pressure | 0.022 (0.02) | 1.23 | 0.24 | |
| Triglycerides | −0.007 (0.002) | −3.21 | 0.008 | |
| Total cholesterol | −0.0001 (0.02) | −0.01 | 0.99 | |
| LDL cholesterol | 0.009 (0.03) | 0.34 | 0.74 | |
| HDL cholesterol | 0.070 (0.04) | 1.81 | 0.098 | |
| Women | Waist circumference | −0.062 (0.07) | −0.87 | 0.40 |
| Glucose | 0.033 (0.02) | 2.02 | 0.06 | |
| Systolic blood pressure | −0.005 (0.1) | −0.48 | 0.64 | |
| Diastolic blood pressure | −0.033 (0.03) | −1.32 | 0.21 | |
| Triglycerides | 0.002 (0.005) | 0.33 | 0.74 | |
| Total cholesterol | −0.025 (0.02) | −1.32 | 0.20 | |
| LDL cholesterol | 0.042 (0.02) | −1.78 | 0.08 | |
| HDL cholesterol | 0.025 (0.02) | 0.63 | 0.54 |
| Trait ** | CVD Risk Factor | β (SE) | t | p Value * |
|---|---|---|---|---|
| Placebo group—Men | Waist circumference | −0.036 (0.06) | −0.63 | 0.59 |
| Glucose | 0.029 (0.14) | 0.21 | 0.86 | |
| Systolic blood pressure | −0.00009 (0.01) | 0.02 | 0.99 | |
| Diastolic blood pressure | 0.006 (0.02) | 0.29 | 0.80 | |
| Triglycerides | 0.0004 (0.001) | 0.36 | 0.75 | |
| Total cholesterol | −0.003 (0.008) | −0.40 | 0.73 | |
| LDL cholesterol | −0.004 (0.007) | −0.59 | 0.57 | |
| HDL cholesterol | −0.047 (0.05) | −0.86 | 0.48 | |
| Women | Waist circumference | −0.107 (0.08) | −1.37 | 0.21 |
| Glucose | 0.0034 (0.01) | 0.19 | 0.85 | |
| Systolic blood pressure | −0.0105 (0.01) | −0.74 | 0.48 | |
| Diastolic blood pressure | 0.0031 (0.02) | 0.14 | 0.90 | |
| Triglycerides | 0.0047 (0.007) | 0.72 | 0.50 | |
| Total cholesterol | −0.0163 (0.02) | −0.96 | 0.37 | |
| LDL cholesterol | 0.002 (0.009) | 0.25 | 0.81 | |
| HDL cholesterol | 0.0043 (0.04) | 0.11 | 0.91 | |
| Blueberry group—Men | Waist circumference | 0.007 (0.04) | 0.18 | 0.86 |
| Glucose | 0.002 (0.06) | 0.03 | 0.98 | |
| Systolic blood pressure | −0.022 (0.01) | −0.19 | 0.86 | |
| Diastolic blood pressure | −0.0003 (0.01) | −0.02 | 0.99 | |
| Triglycerides | 0.0025 (0.002) | 1.21 | 0.28 | |
| Total cholesterol | −0.004 (0.007) | −0.56 | 0.60 | |
| LDL cholesterol | −0.003 (0.005) | −0.05 | 0.96 | |
| HDL cholesterol | 0.077 (0.04) | 2.12 | 0.09 | |
| Women | Waist circumference | −0.029 (0.10) | −1.91 | 0.15 |
| Glucose | −0.198 (0.01) | −2.05 | 0.13 | |
| Systolic blood pressure | 0.0052 (0.003) | 1.65 | 0.20 | |
| Diastolic blood pressure | 0.045 (0.008) | 5.38 | 0.01 | |
| Triglycerides | −0.015 (0.003) | −4.87 | 0.02 | |
| Total cholesterol | 0.011 (0.004) | 2.98 | 0.06 | |
| LDL cholesterol | −0.001 (0.003) | −0.42 | 0.68 | |
| HDL cholesterol | −0.117 (0.02) | −5.83 | 0.01 |
© 2016 by the authors; licensee MDPI, Basel, Switzerland. This article is an open access article distributed under the terms and conditions of the Creative Commons Attribution (CC-BY) license (http://creativecommons.org/licenses/by/4.0/).
Share and Cite
Cheatham, C.L.; Vazquez-Vidal, I.; Medlin, A.; Voruganti, V.S. Blueberry Consumption Affects Serum Uric Acid Concentrations in Older Adults in a Sex-Specific Manner. Antioxidants 2016, 5, 43. https://doi.org/10.3390/antiox5040043
Cheatham CL, Vazquez-Vidal I, Medlin A, Voruganti VS. Blueberry Consumption Affects Serum Uric Acid Concentrations in Older Adults in a Sex-Specific Manner. Antioxidants. 2016; 5(4):43. https://doi.org/10.3390/antiox5040043
Chicago/Turabian StyleCheatham, Carol L., Itzel Vazquez-Vidal, Amanda Medlin, and V. Saroja Voruganti. 2016. "Blueberry Consumption Affects Serum Uric Acid Concentrations in Older Adults in a Sex-Specific Manner" Antioxidants 5, no. 4: 43. https://doi.org/10.3390/antiox5040043