Storage of Fruits and Vegetables in Refrigerator Increases their Phenolic Acids but Decreases the Total Phenolics, Anthocyanins and Vitamin C with Subsequent Loss of their Antioxidant Capacity


Abstract
:1. Introduction
2. Materials and Methods
2.1. Chemicals
2.2. Plant Materials and Treatment
2.3. Extraction of Phenolic Compounds
2.4. Determination of Total Phenolic Content
2.5. Profiling of Phenolic Acids by Ultra Performance Liquid Chromatography (UPLC)
2.6. Determination of Vitamin C Content
2.7. Determination of Total Anthocyanins
2.8. Evaluation of Total Antioxidant Activity
2.9. Statistical Analysis
3. Results
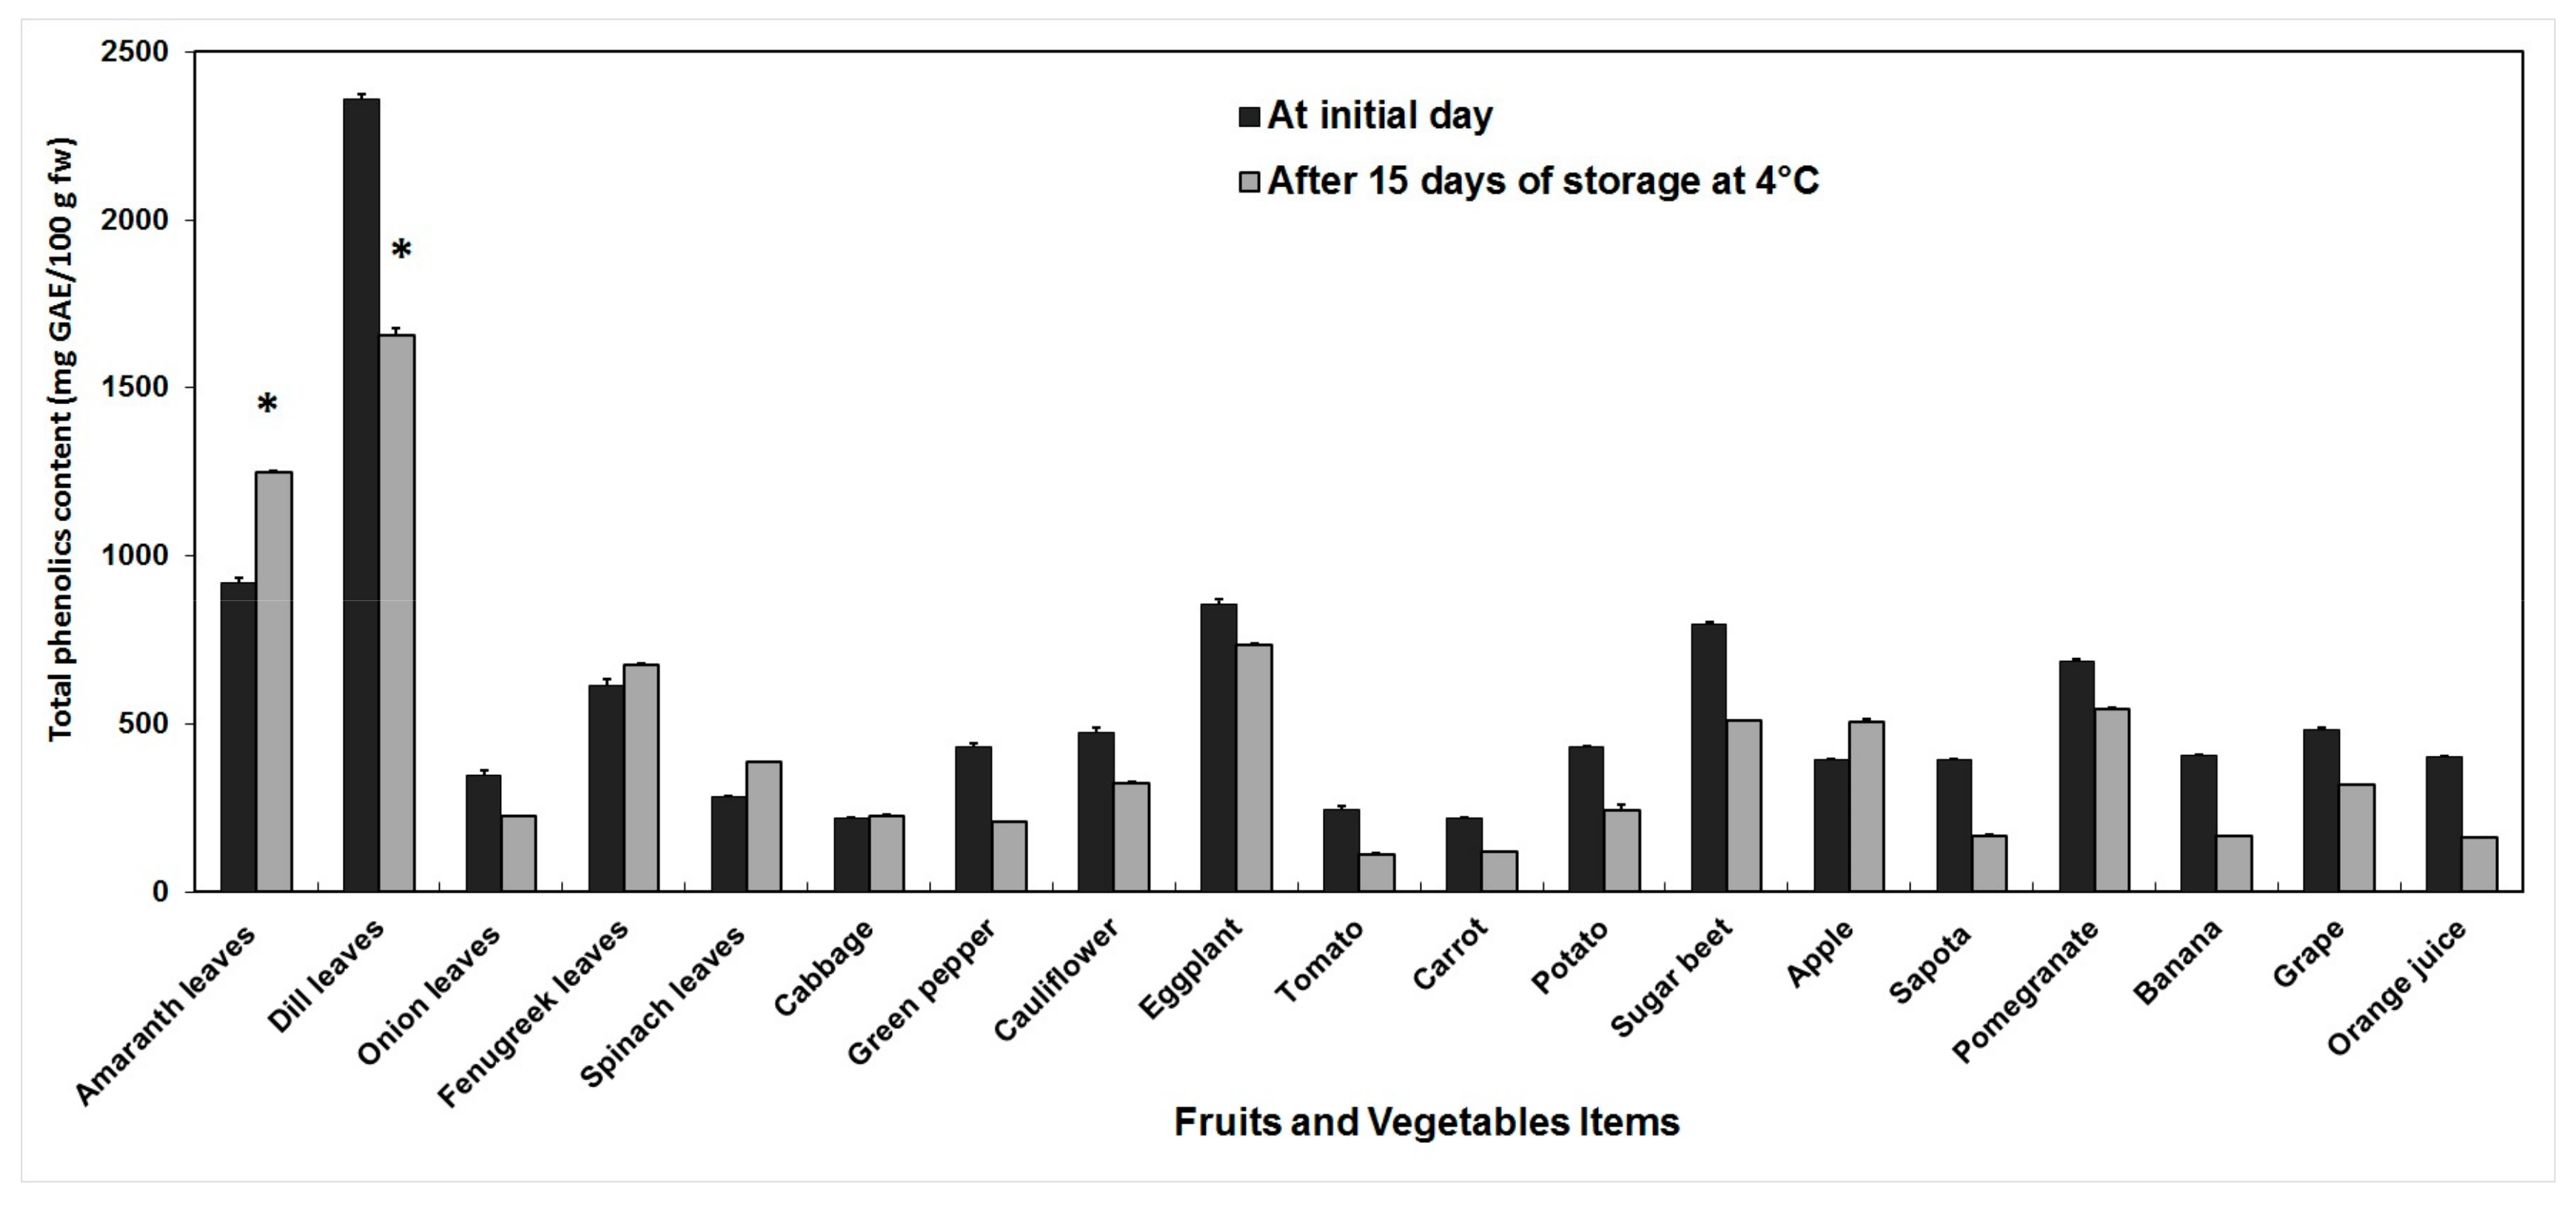
3.1. Total Phenolics
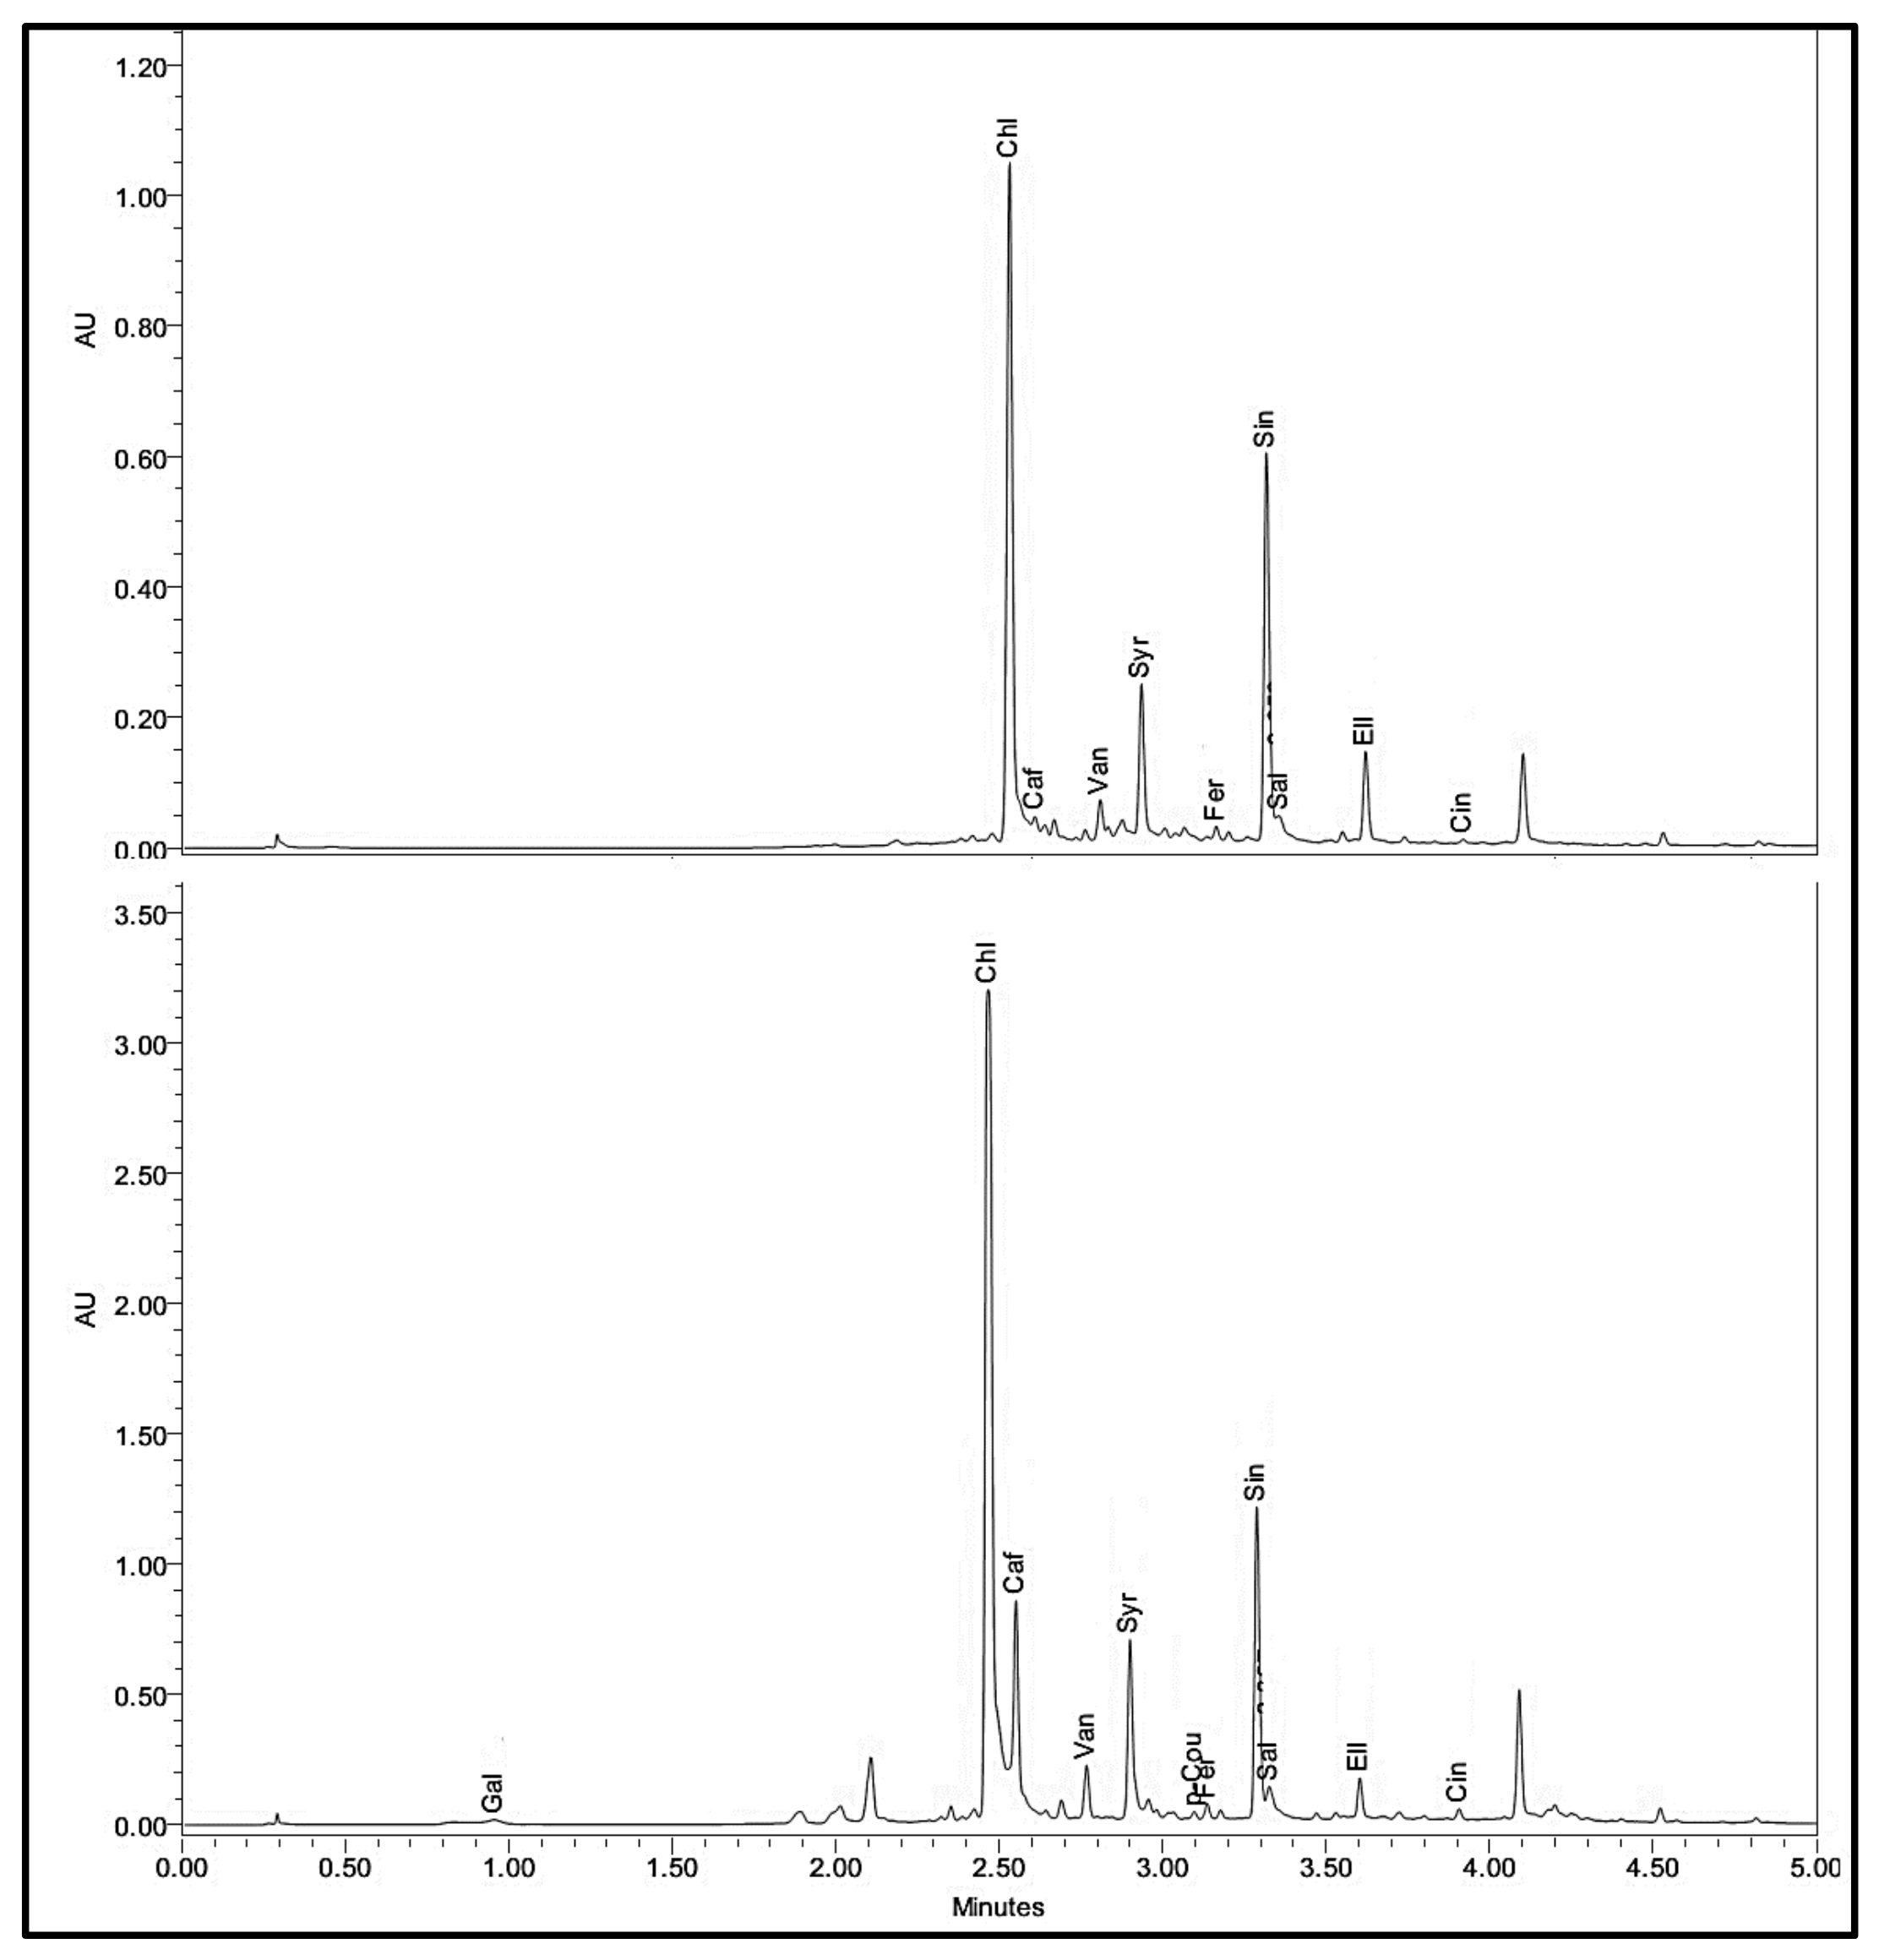
3.2. Phenolic Acids
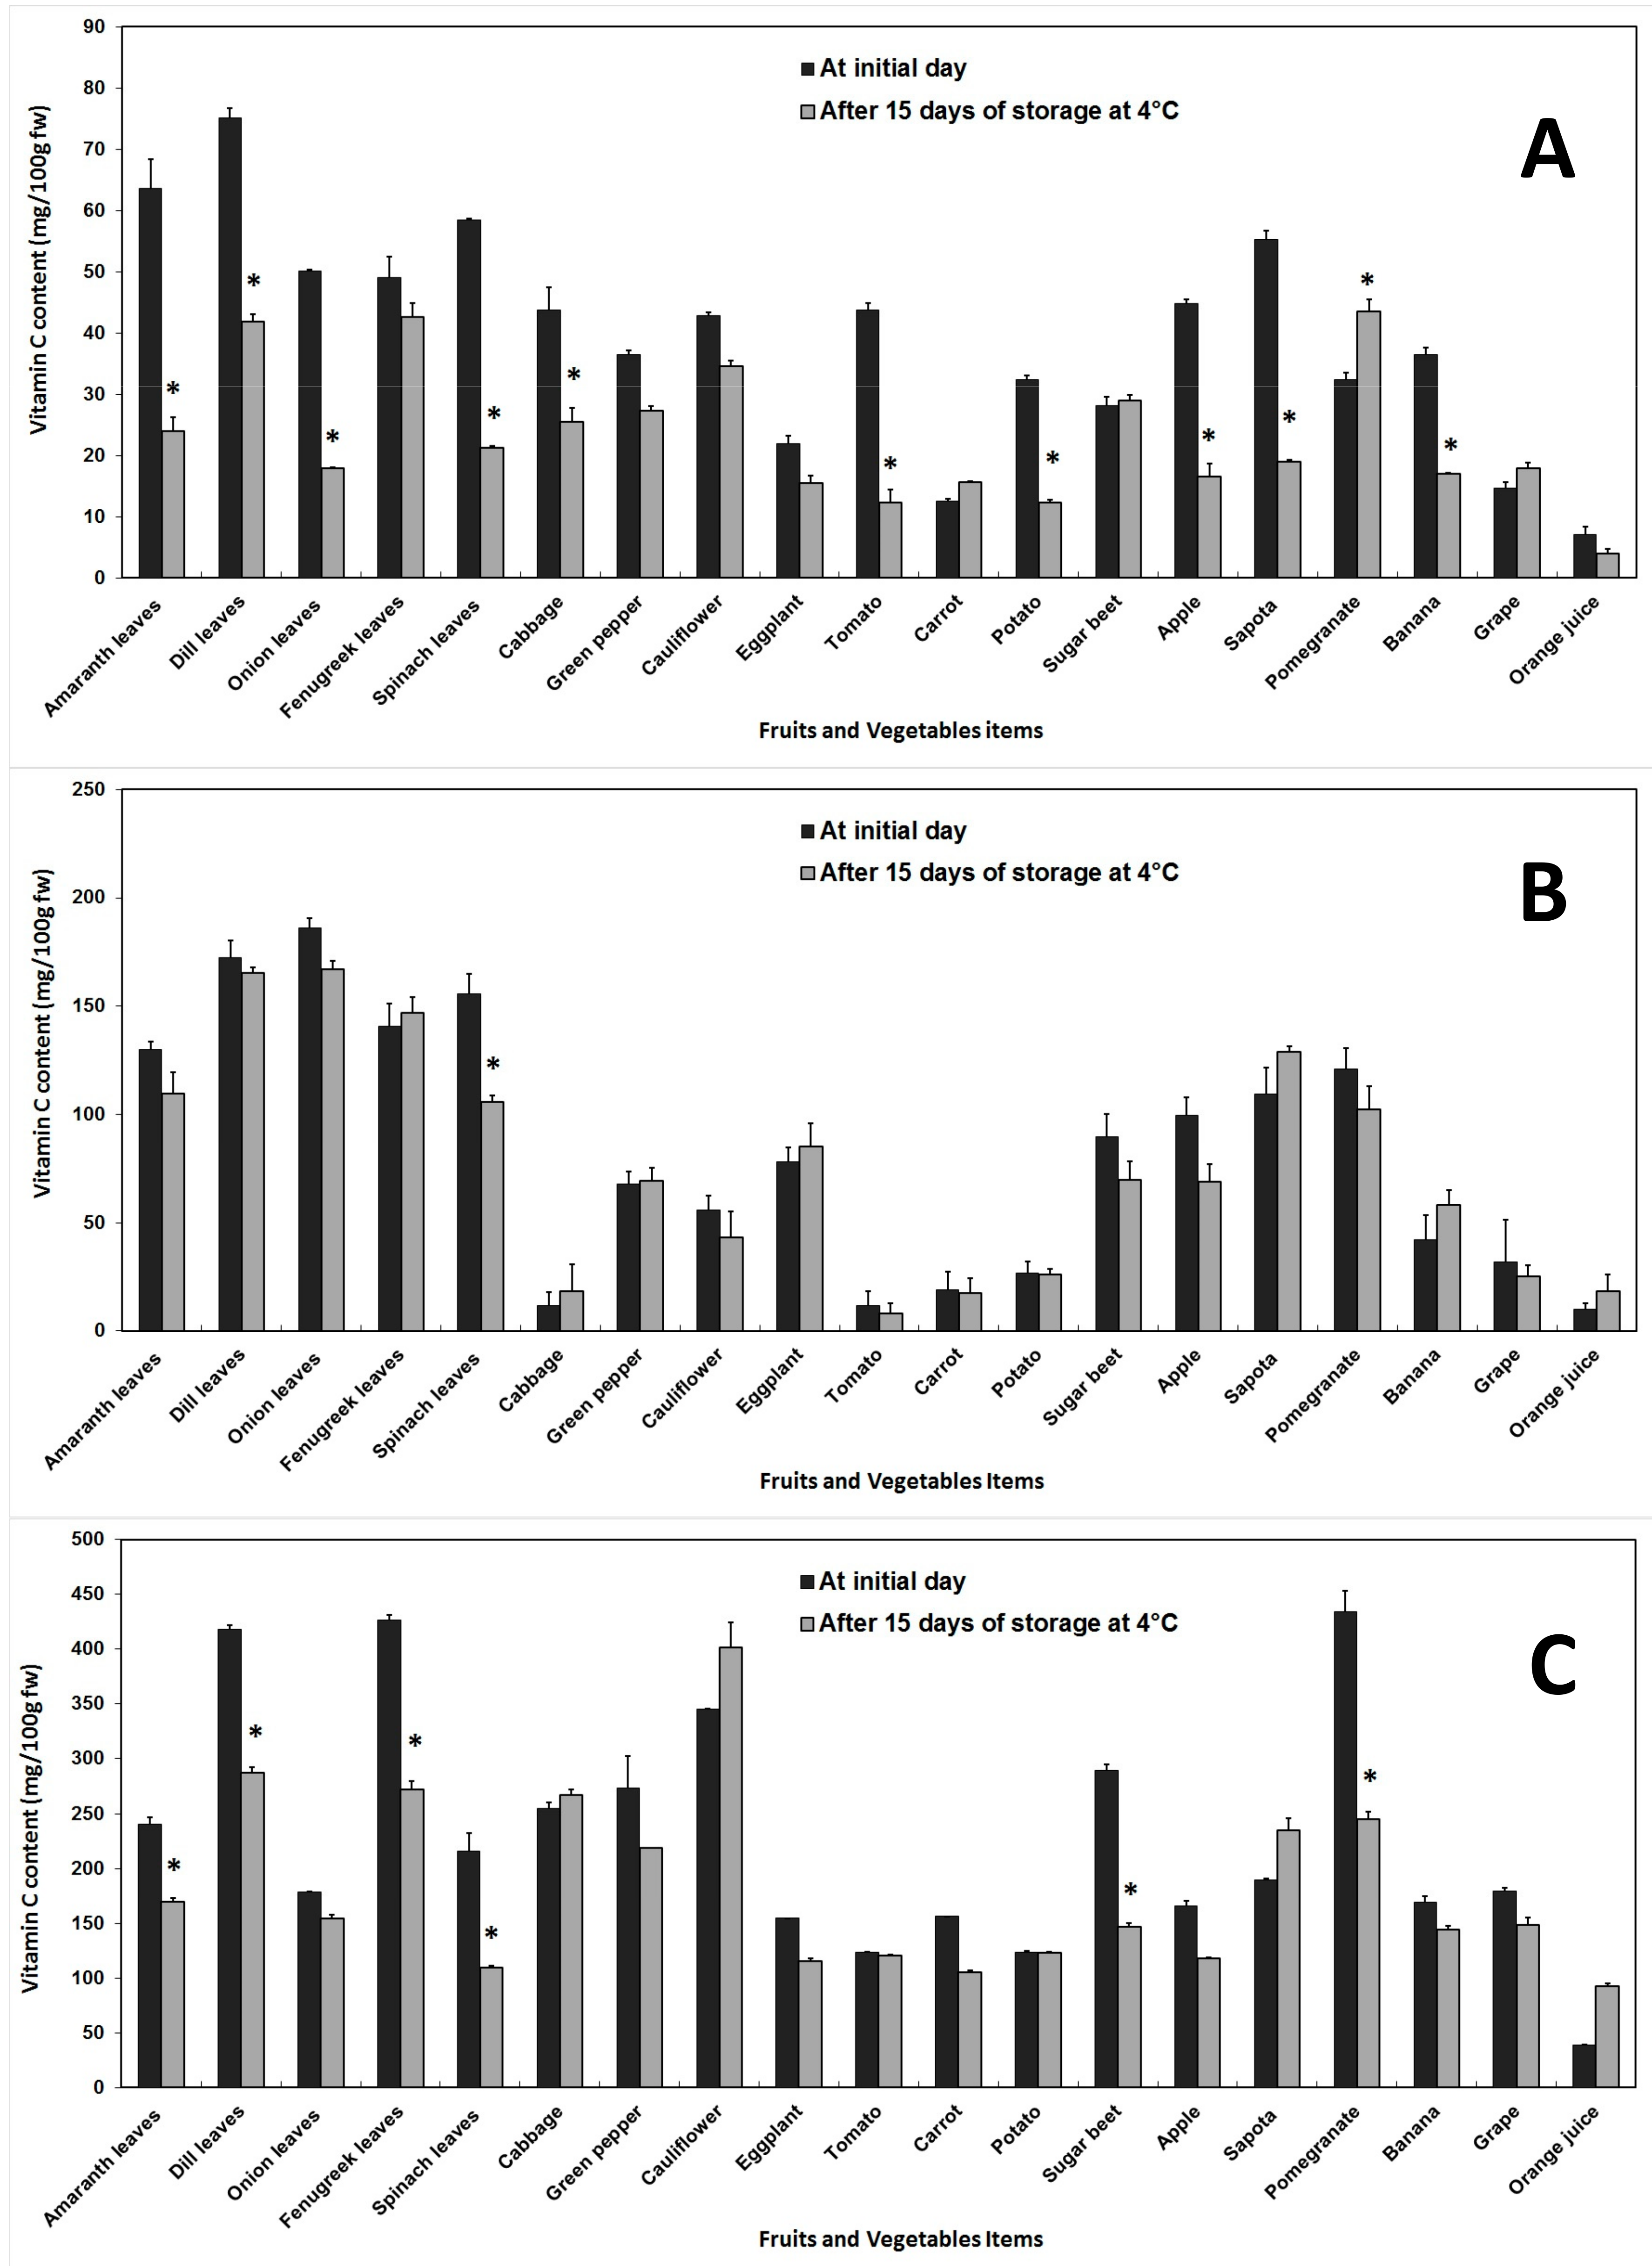
3.3. Vitamin C
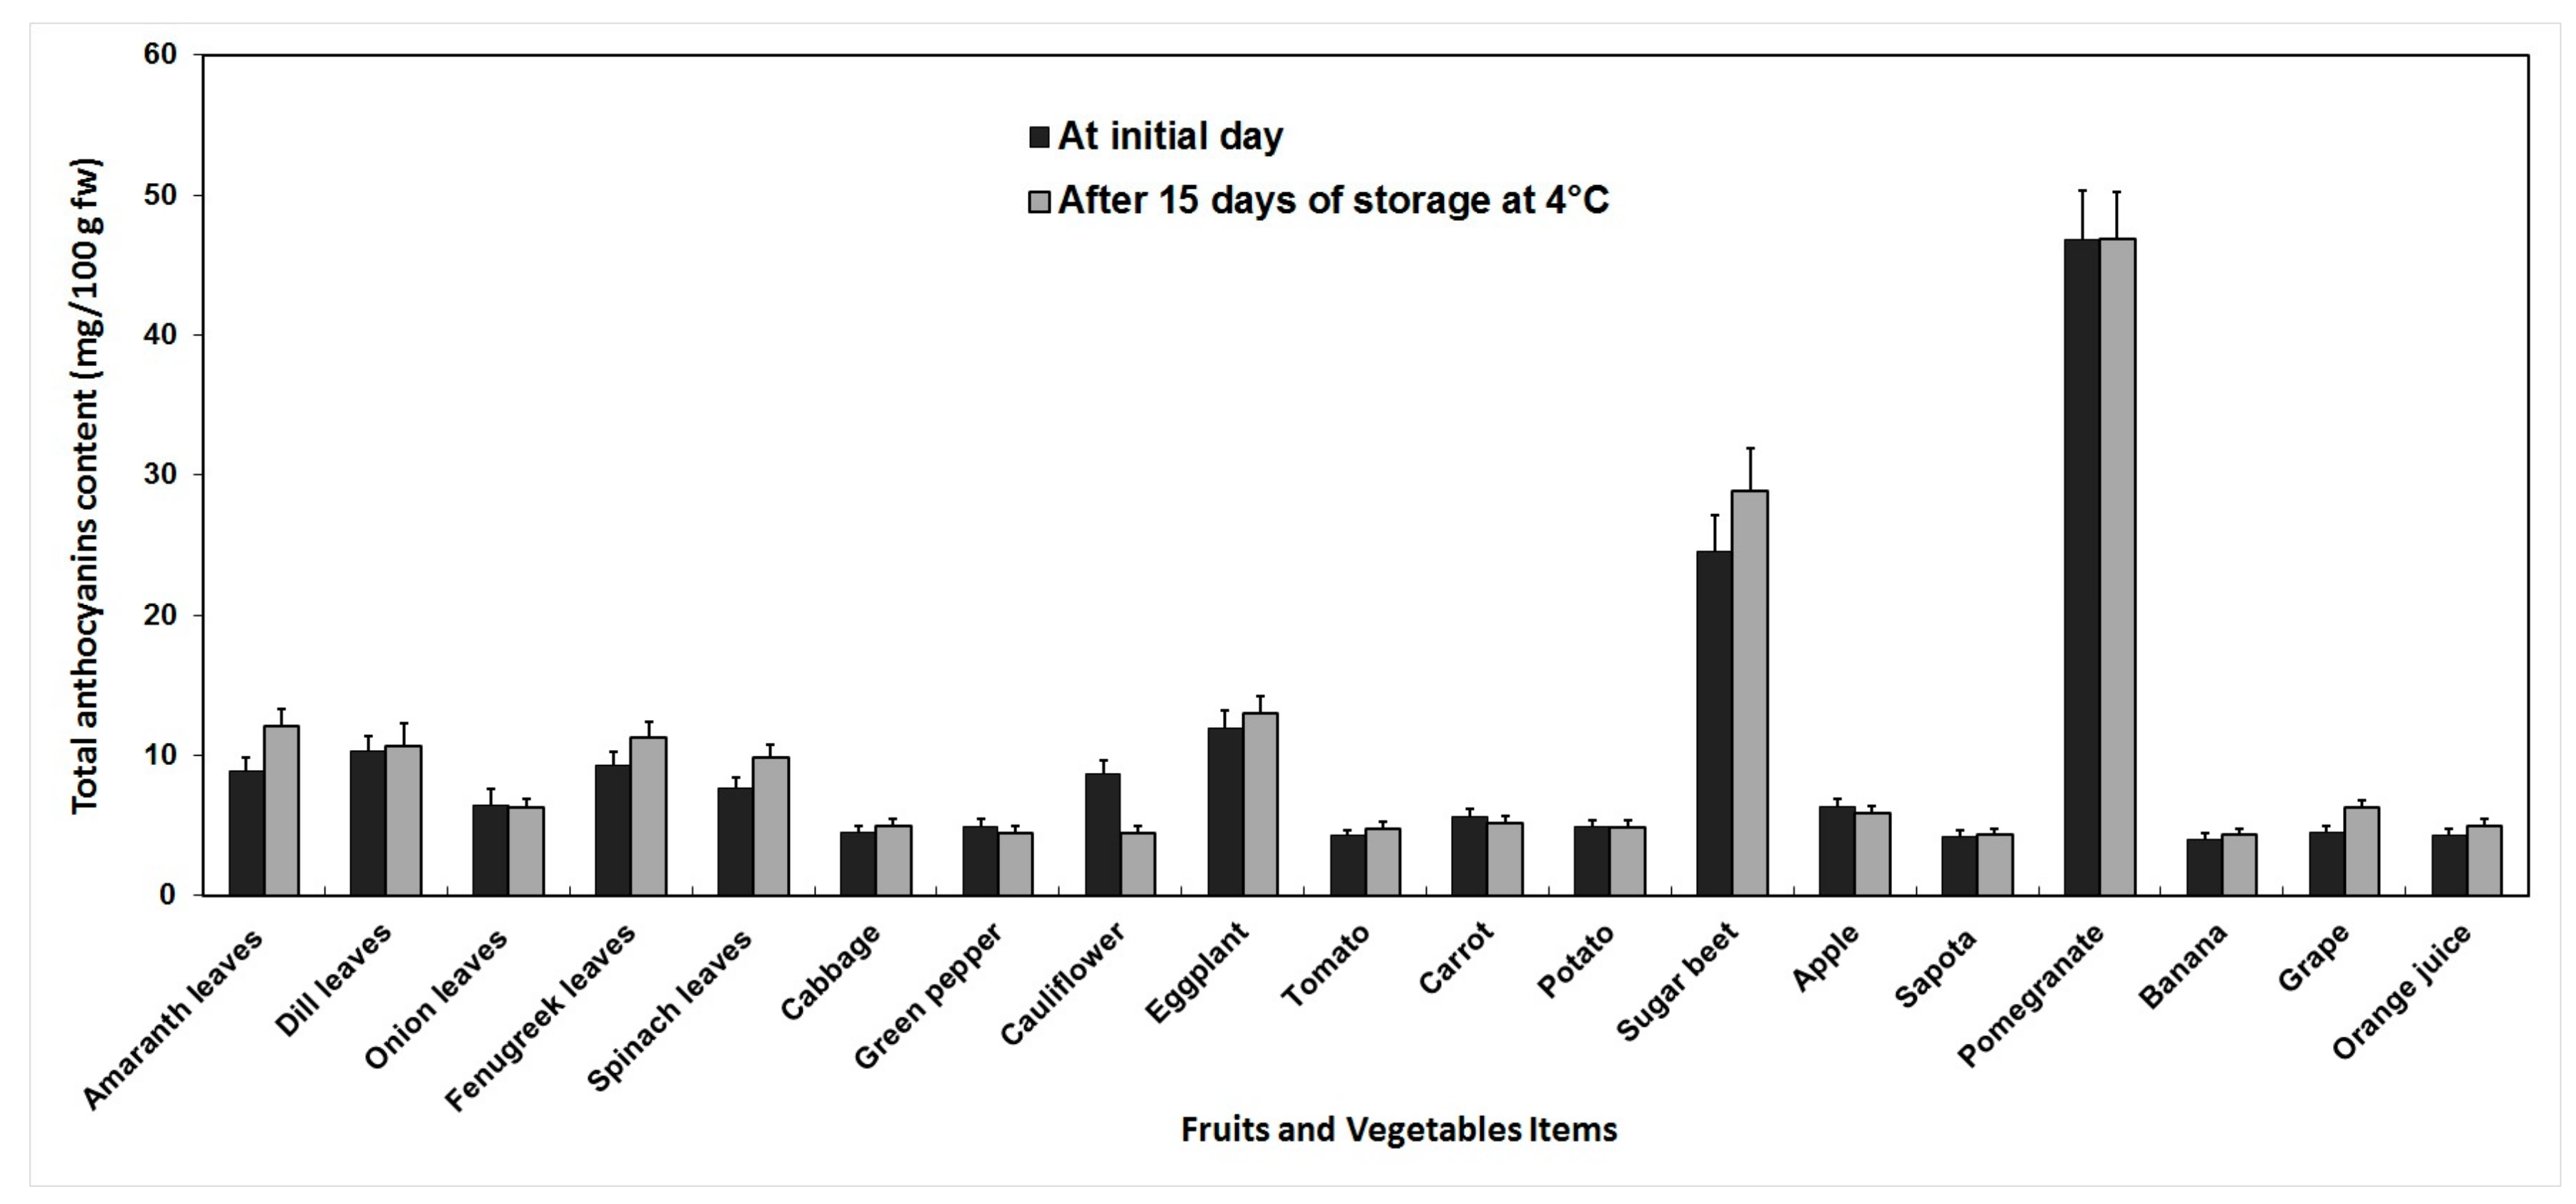
3.4. Anthocyanins
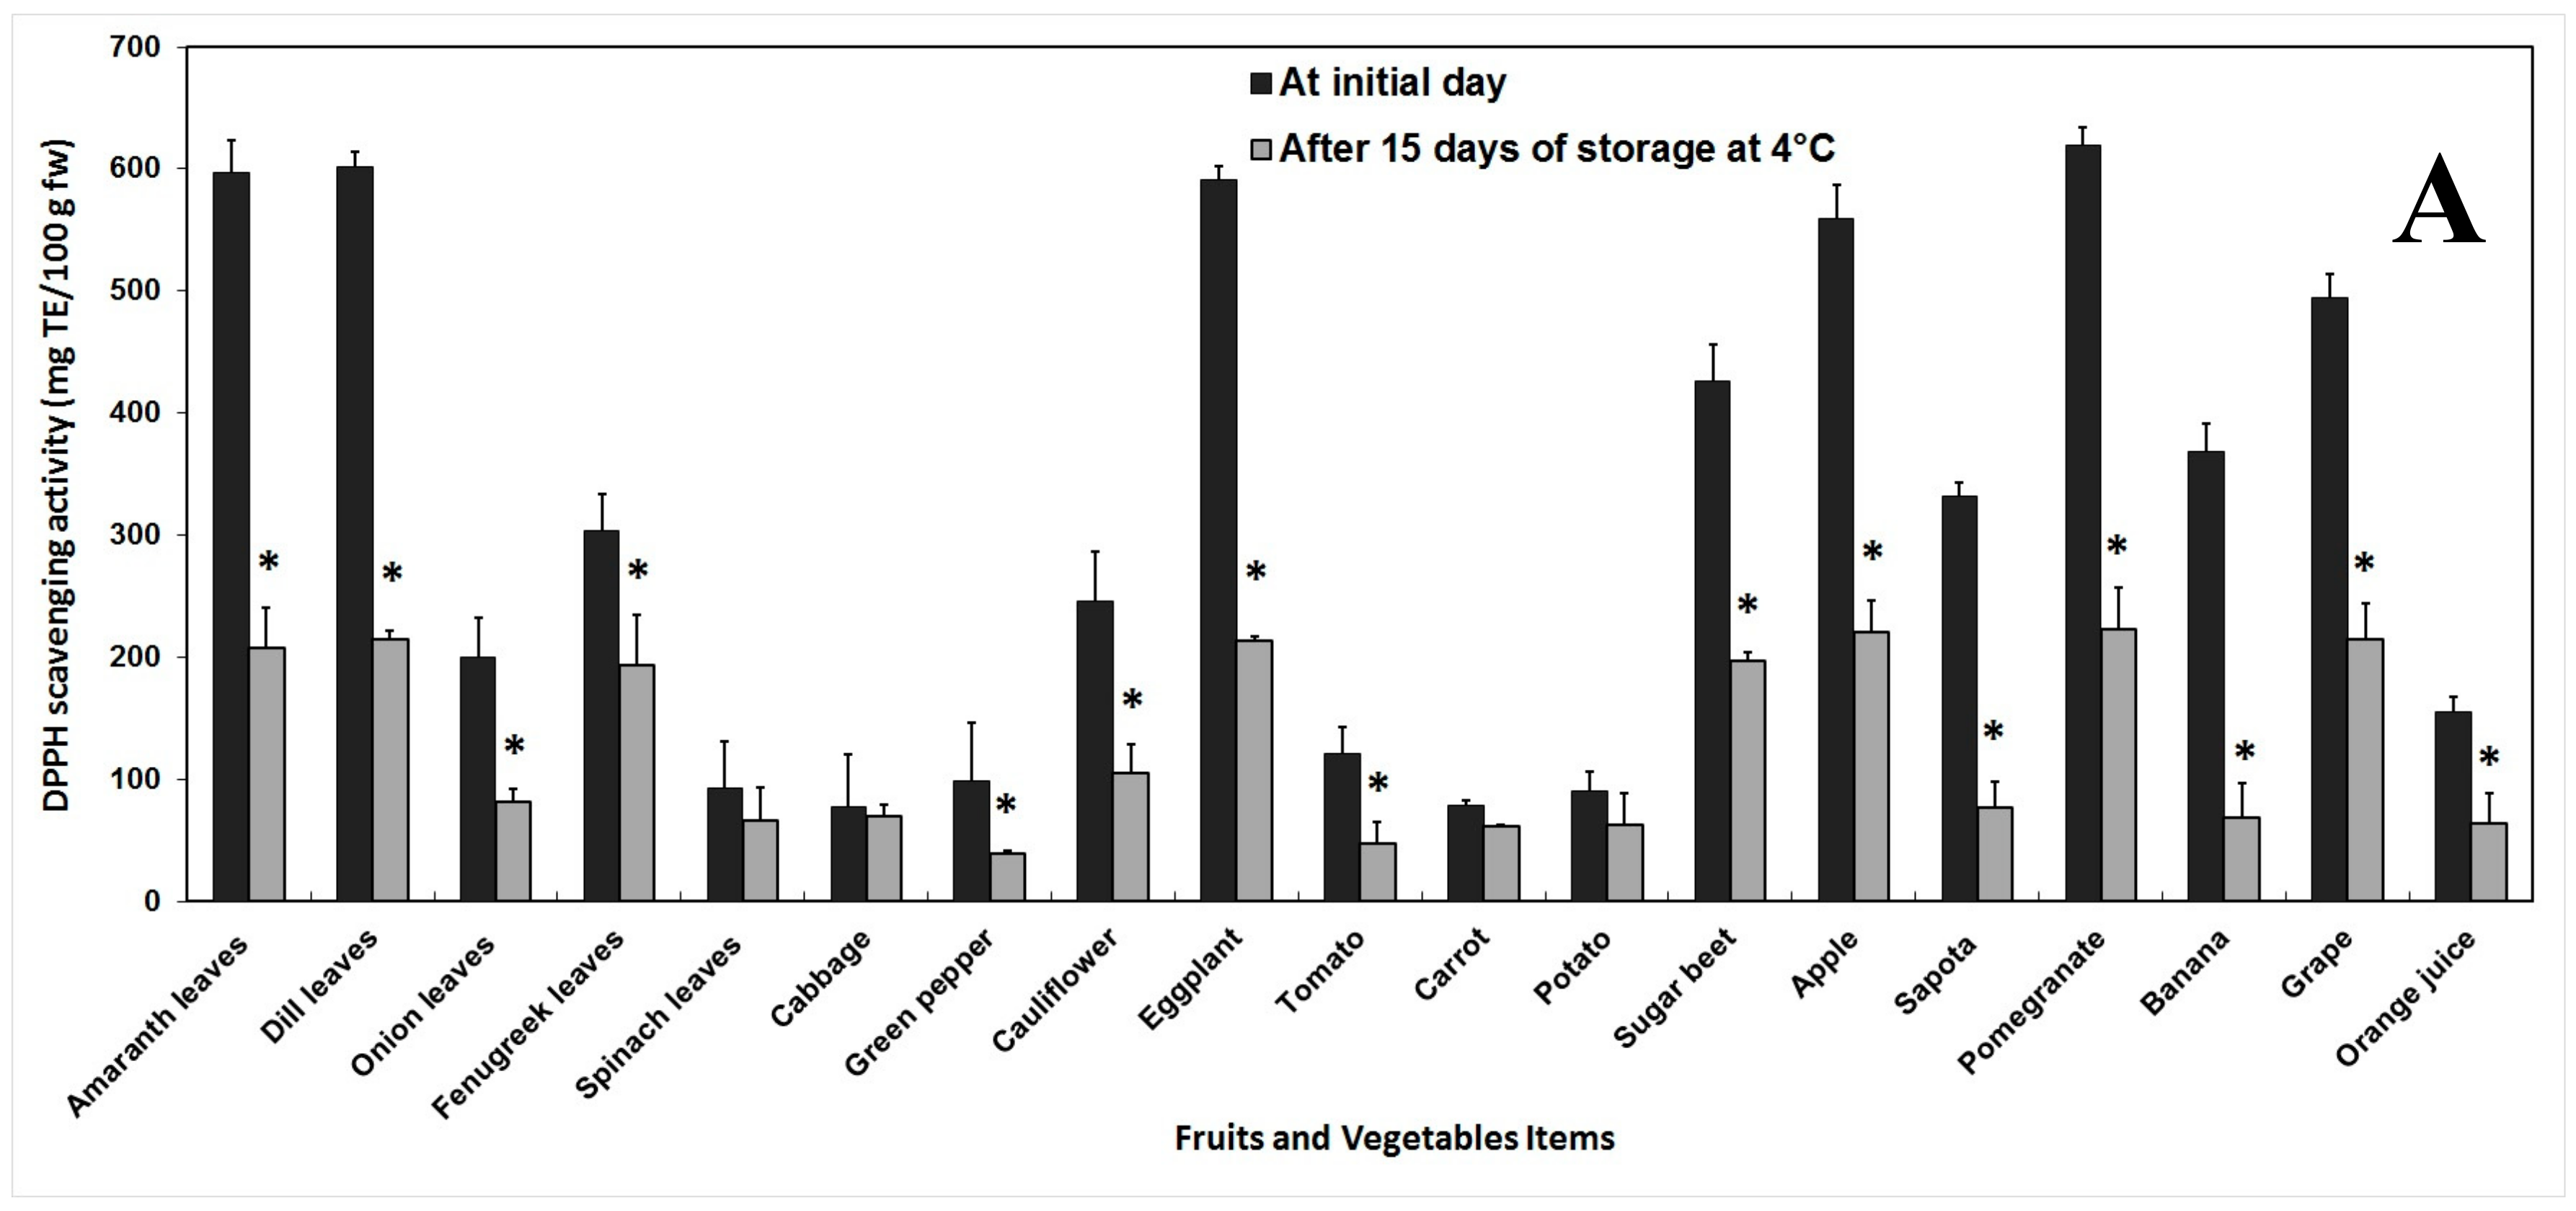
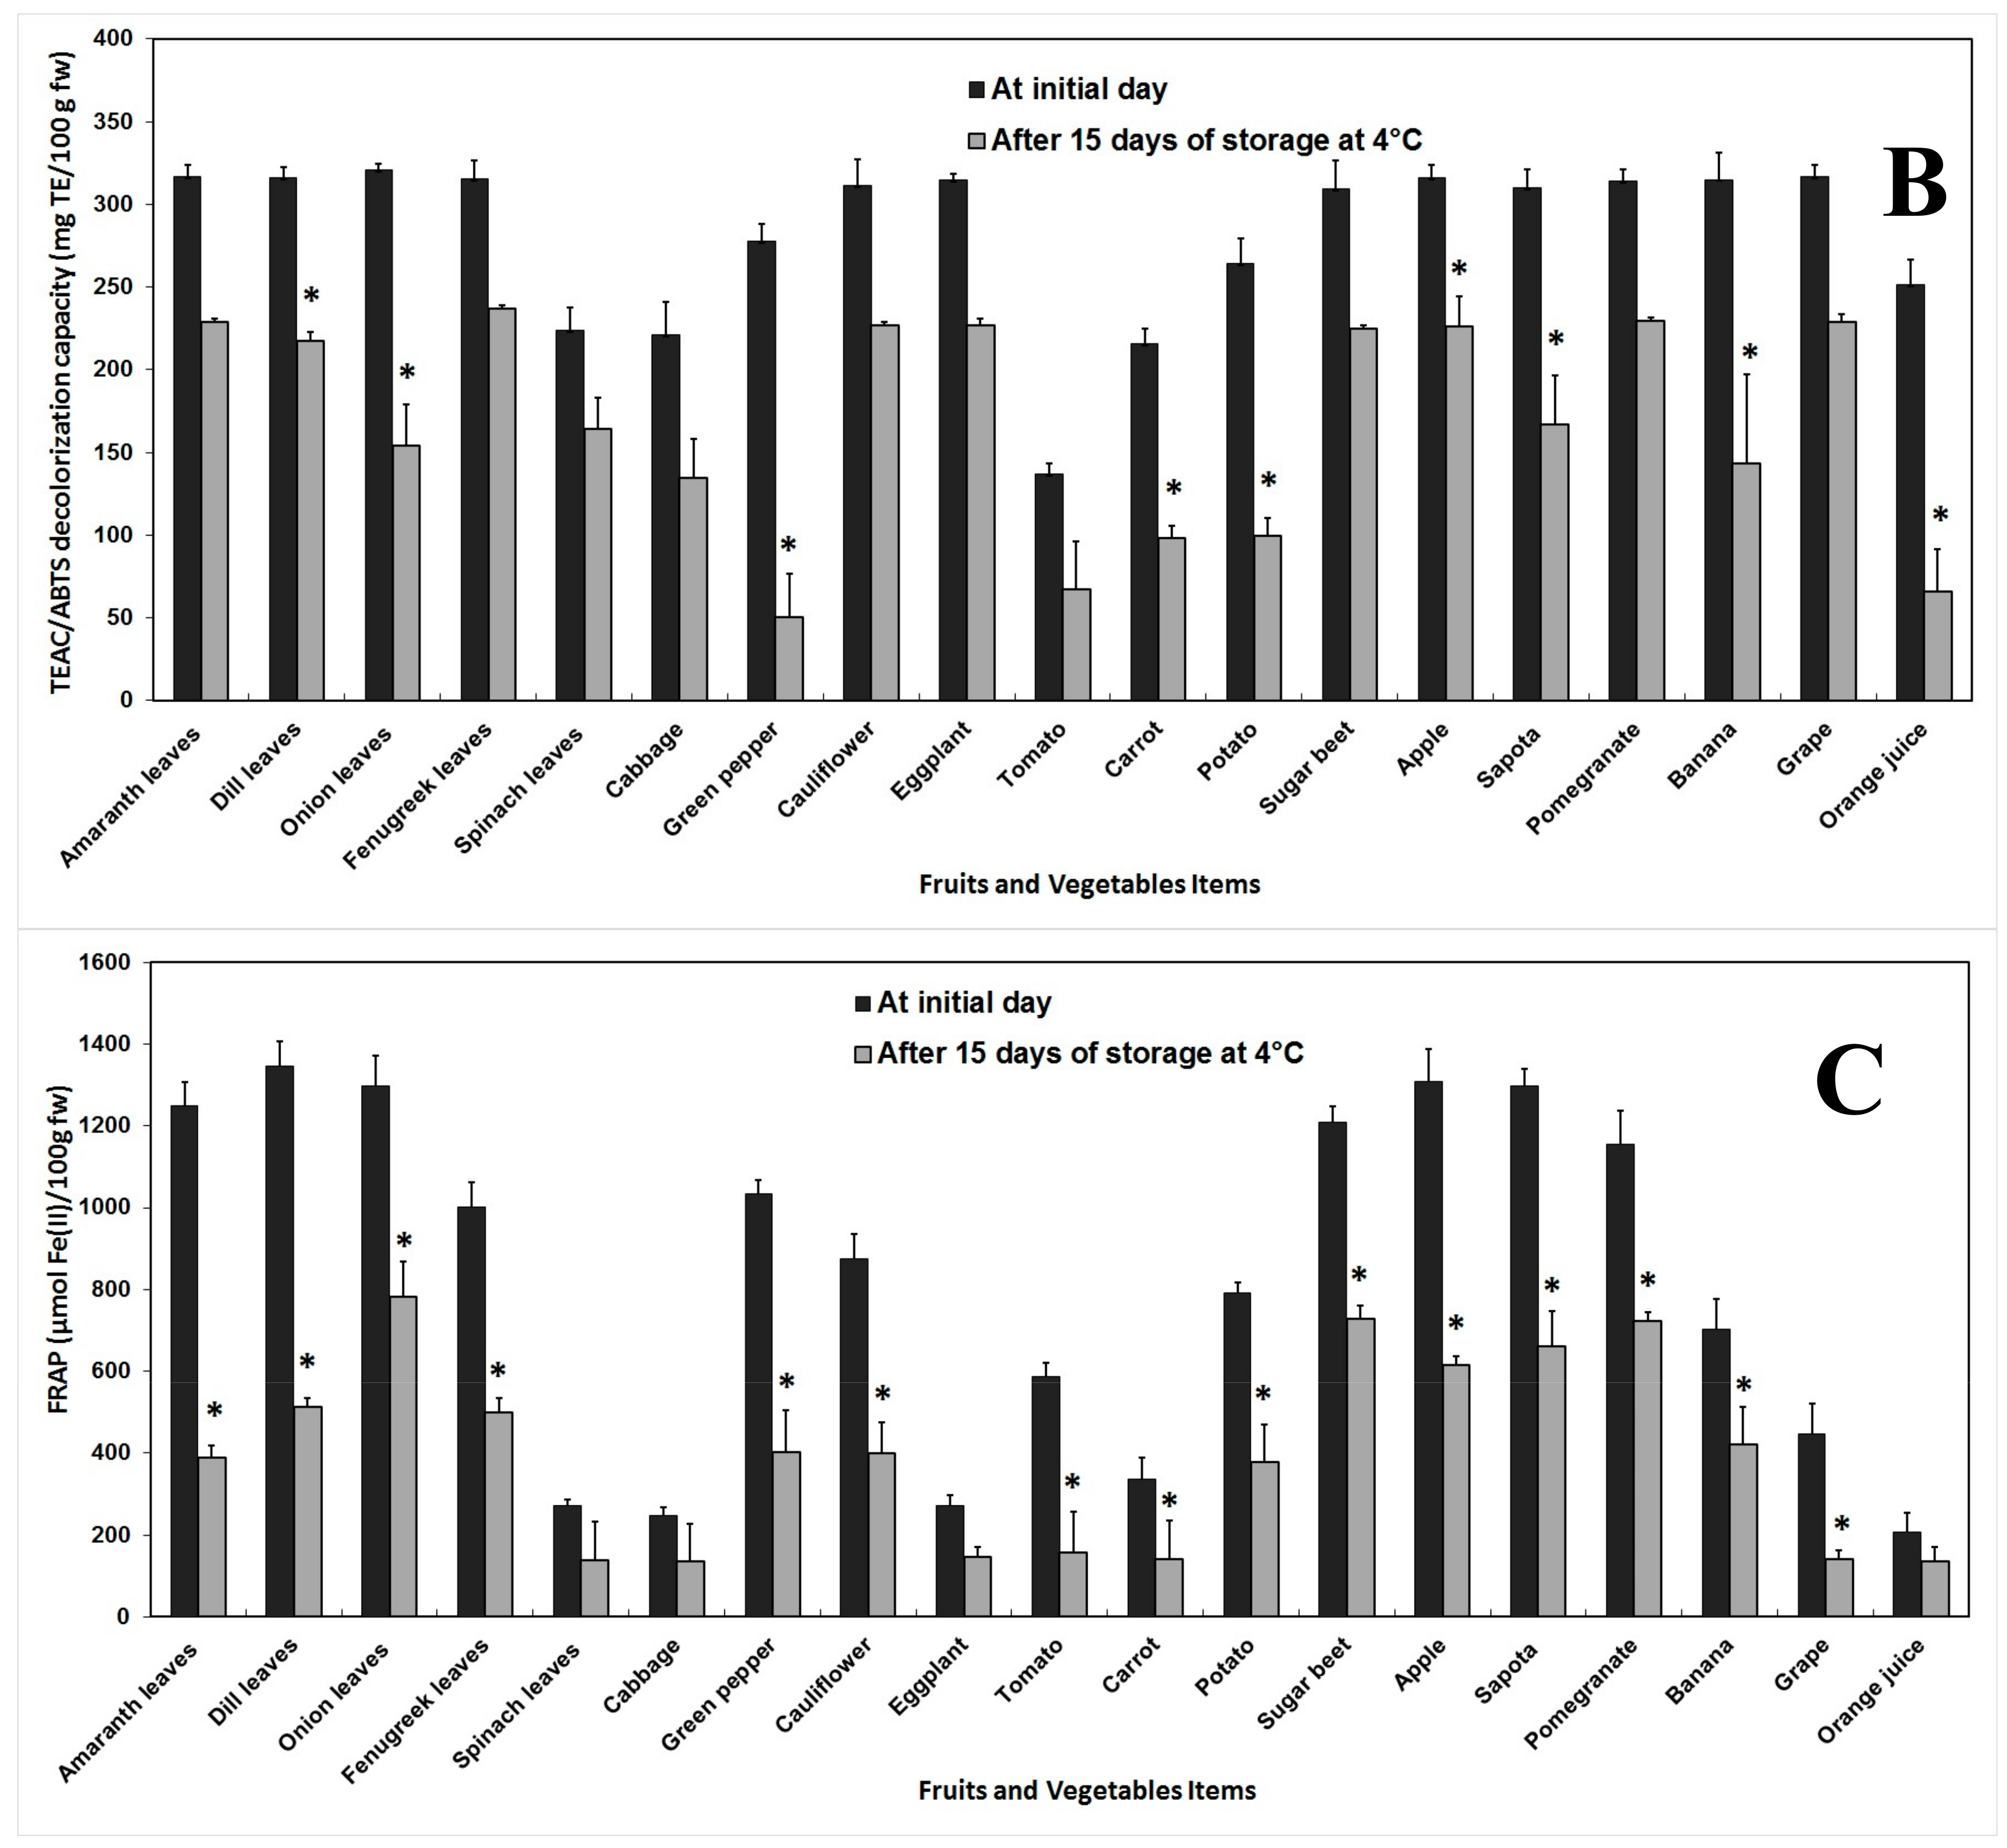
3.5. Antioxidant Activity
3.6. Correlation Analysis
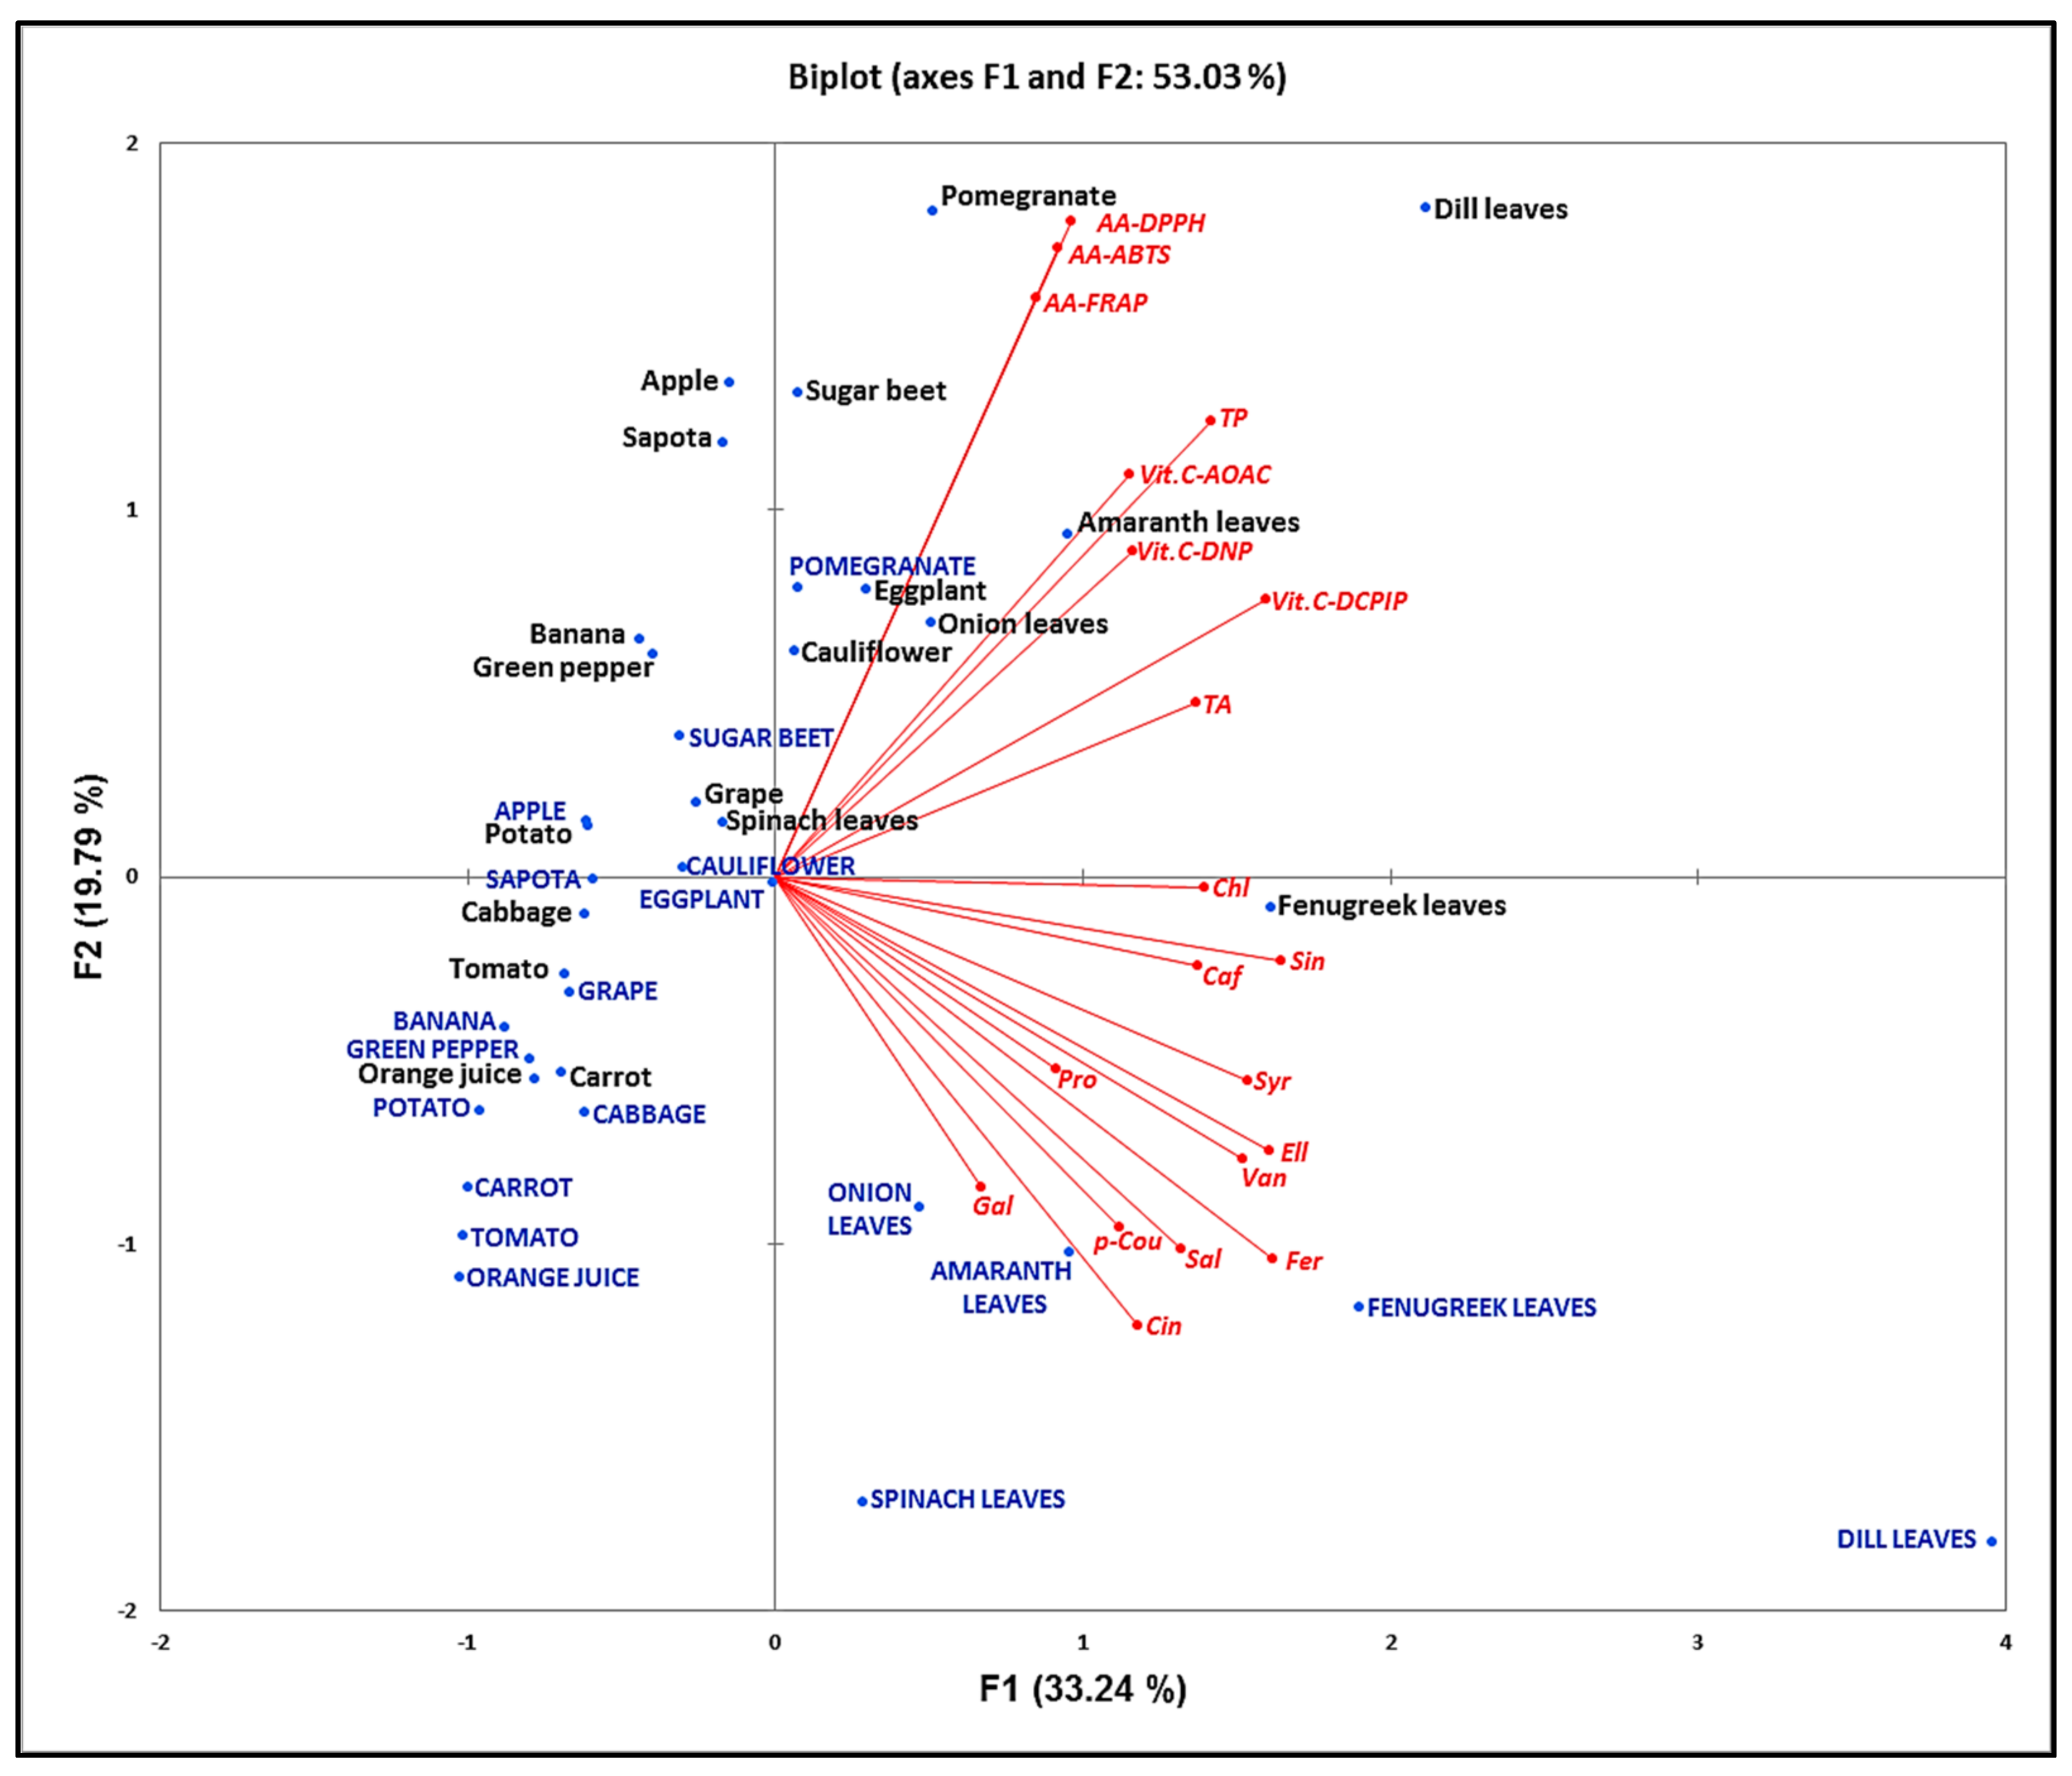
3.7. Principal Component Analysis
4. Discussion
4.1. Total Phenolics
4.2. Phenolic Acids
4.3. Vitamin C
4.4. Anthocyanins
4.5. Antioxidant Activity
4.6. Correlation Analysis
4.7. Principal Component Analysis
5. Conclusions
Acknowledgments
Author Contributions
Conflicts of Interest
References
- Prakash, D.; Gupta, K.R. The Antioxidant Phytochemicals of Nutraceutical Importance. Open Nutraceuticals J. 2009, 2, 20–35. [Google Scholar] [CrossRef]
- Eastwood, M.A. Interaction of dietary antioxidants in vivo: How fruit and vegetables prevent disease? QJM Int. J. Med. 1999, 92, 527–530. [Google Scholar] [CrossRef]
- Grace, M.H.; Yousef, G.G.; Gustafson, S.J.; Truong, V.D.; Yencho, G.C.; Lila, M.A. Phytochemical changes in phenolics, anthocyanins, ascorbic acid, and carotenoids associated with sweetpotato storage and impacts on bioactive properties. Food Chem. 2014, 145, 717–724. [Google Scholar] [CrossRef] [PubMed]
- Stushnoff, C.; Holm, D.; Thompson, M.D.; Jiang, W.; Thompson, H.J.; Joyce, N.I.; Wilson, P. Antioxidant properties of cultivars and selections from the Colorado potato breeding program. Am. J. Potato Res. 2008, 85, 267–276. [Google Scholar] [CrossRef]
- Blessington, T.; Nzaramba, M.N.; Scheuring, D.C.; Hale, A.L.; Reddivari, L.; Miller, J.C. Cooking Methods and Storage Treatments of Potato: Effects on Carotenoids, Antioxidant Activity, and Phenolics. Am. J. Potato Res. 2010, 87, 479–491. [Google Scholar] [CrossRef]
- Madiwale, G.P.; Reddivari, L.; Holm, D.G.; Vanamala, J. Storage elevates phenolic content and antioxidant activity but suppresses antiproliferative and pro-apoptotic properties of colored-flesh potatoes against human colon cancer cell lines. J. Agric. Food Chem. 2011, 59, 8155–8166. [Google Scholar] [CrossRef] [PubMed]
- Külen, O.; Stushnoff, C.; Holm, D.G. Effect of cold storage on total phenolics content, antioxidant activity and vitamin C level of selected potato clones. J. Sci. Food Agric. 2013, 93, 2437–2444. [Google Scholar] [CrossRef] [PubMed]
- Galani, Y.J.H.; Mankad, M.P.; Shah, A.K.; Patel, N.J.; Acharya, R.R.; Talati, J.G. Effect of Storage Temperature on Vitamin C, Total Phenolics, UPLC Phenolic Acids profile and Antioxidant Capacity of Eleven Potato (Solanum tuberosum L.) Varieties. Hortic. Plant J. 2017, 3, 73–89. [Google Scholar] [CrossRef]
- Rapisarda, P.; Lo Bianco, M.; Pannuzzo, P.; Timpanaro, N. Effect of cold storage on vitamin C, phenolics and antioxidant activity. Postharvest Biol. Technol. 2008, 49, 348–354. [Google Scholar]
- Serrano, M.; Martinez-Romero, D.; Guillén, F.; Castillo, S.; Valero, D. Maintenance of broccoli quality and functional properties during cold storage as affected by modified atmosphere packaging. Postharvest Biol. Technol. 2006, 39, 61–68. [Google Scholar] [CrossRef]
- Piljac-Žegarac, J.; Šamec, D. Antioxidant stability of small fruits in postharvest storage at room and refrigerator temperatures. Food Res. Int. 2011, 44, 345–350. [Google Scholar] [CrossRef]
- Navarre, D.A.; Pillai, S.S.; Shakya, R.; Holden, M.J. HPLC profiling of phenolics in diverse potato genotypes. Food Chem. 2011, 127, 34–41. [Google Scholar] [CrossRef]
- Howard, L.A.; Wong, A.D.; Perry, A.K.; Klein, B.P. Beta-carotene and ascorbic acid retention in fresh and processed vegetables. J. Food Sci. 1999, 64, 929–936. [Google Scholar] [CrossRef]
- Lisiewska, Z.; Słupski, J.; Zuchowicz, E. Effect of temperature and storage period on the preservation of vitamin C, thiamine and riboflavin in frozen dill (Anethum graveolens L.). Electron. J. Pol. 2003, 6, 1–7. [Google Scholar]
- Phillips, K.M.; Tarragó-Trani, M.T.; Gebhardt, S.E.; Exler, J.; Patterson, K.Y.; Haytowitz, D.B.; Pehrsson, P.R.; Holden, J.M. Stability of vitamin C in frozen raw fruit and vegetable homogenates. J. Food Compos. Anal. 2010, 23, 253–259. [Google Scholar] [CrossRef]
- Cätunescu, G.M.; Tofanä‚, M.; Mureșan, C.; Ranga, F.; David, A.; Muntean, M. The Effect of Cold Storage on Some Quality Characteristics of Minimally Processed Parsley (Petroselinum crispum), Dill (Anethum graveolens) and Lovage (Levisticum officinale). Bull. Univ. Agric. Sci. Vet. Med. Cluj-Napoca. Agric. 2012, 6, 213–221. [Google Scholar]
- Cho, K.S.; Jeong, H.J.; Cho, J.H.; Park, Y.E.; Hong, S.Y.; Won, H.S.; Kim, H.J. Vitamin C content of potato clones from Korean breeding lines and compositional changes during growth and after storage. Hortic. Environ. Biotechnol. 2013, 54, 70–75. [Google Scholar] [CrossRef]
- Hernandez, Y.; Lobo, M.G.; Gonzalez, M. Determination of vitamin C in tropical fruits: A comparative evaluation of methods. Food Chem. 2006, 96, 654–664. [Google Scholar] [CrossRef]
- Al-Ani, M.; Opara, L.U.; Al-Bahri, D.; Al-Rahbi, N. Spectrophotometric quantification of ascorbic acid contents of fruit and vegetables using the 2, 4-dinitrophenylhydrazine method. J. Food Agric. Environ. 2007, 5, 165–168. [Google Scholar]
- Kumar, G.V.; Ajay, K.K.; Patel, R.G.R.; Manjappa, S. Determination of vitamin C in some fruits and vegetables in Davanagere city, (Karanataka)—India. Int. J. Pharm. Life Sci. 2013, 4, 2489–2491. [Google Scholar]
- Adebayo, E. The Titrimetric and Spectrophotometric Determination of Ascorbic acid levels in Selected Nigerian Fruits. IOSR J. Environ. Sci. Toxicol. Food Technol. 2015, 9, 44–46. [Google Scholar] [CrossRef]
- Guo, C.; Yang, J.; Wei, J.; Li, Y.; Xu, J.; Jiang, Y. Antioxidant activities of peel, pulp and seed fractions of common fruits as determined by FRAP assay. Nutr. Res. 2003, 23, 1719–1726. [Google Scholar] [CrossRef]
- Tavarini, S.; Degl’Innocenti, E.; Remorini, D.; Massai, R.; Guidi, L. Antioxidant capacity, ascorbic acid, total phenols and carotenoids changes during harvest and after storage of Hayward kiwifruit. Food Chem. 2008, 107, 282–288. [Google Scholar] [CrossRef]
- Deng, G.F.; Lin, X.; Xu, X.R.; Gao, L.L.; Xie, J.F.; Li, H. Bin Antioxidant capacities and total phenolic contents of 56 vegetables. J. Funct. Foods 2013, 5, 260–266. [Google Scholar] [CrossRef]
- Awika, J.M.; Rooney, L.W.; Wu, X.; Prior, R.L.; Cisneros-Zevallos, L. Screening methods to measure antioxidant activity of sorghum (Sorghum bicolor) and sorghum products. J. Agric. Food Chem. 2003, 51, 6657–6662. [Google Scholar] [CrossRef] [PubMed]
- Burgos, G.; Amoros, W.; Muñoa, L.; Sosa, P.; Cayhualla, E.; Sanchez, C.; Díaz, C.; Bonierbale, M. Total phenolic, total anthocyanin and phenolic acid concentrations and antioxidant activity of purple-fleshed potatoes as affected by boiling. J. Food Compos. Anal. 2013, 30, 6–12. [Google Scholar] [CrossRef]
- Jansen, G.; Flamme, W. Coloured potatoes (Solanum Tuberosum L.)—Anthocyanin Content and Tuber Quality. Genet. Resour. Crop Evol. 2006, 53, 1321–1331. [Google Scholar] [CrossRef]
- Lee, J.; Durst, R.W.; Wrolstad, R.E. Determination of total monomeric anthocyanin pigment content of fruit juices, beverages, natural colorants, and wines by the pH differential method: Collaborative study. J. AOAC Int. 2005, 88, 1269–1278. [Google Scholar] [CrossRef] [PubMed]
- Kubow, S.; Iskandar, M.M.; Sabally, K.; Azadi, B.; Sadeghi Ekbatan, S.; Kumarathasan, P.; Das, D.D.; Prakash, S.; Burgos, G.; Zum Felde, T. Biotransformation of anthocyanins from two purple-fleshed sweet potato accessions in a dynamic gastrointestinal system. Food Chem. 2016, 192, 171–177. [Google Scholar] [CrossRef] [PubMed]
- Floegel, A.; Kim, D.O.; Chung, S.J.; Koo, S.I.; Chun, O.K. Comparison of ABTS/DPPH assays to measure antioxidant capacity in popular antioxidant-rich US foods. J. Food Compos. Anal. 2011, 24, 1043–1048. [Google Scholar] [CrossRef]
- Patras, A.; Brunton, N.P.; Downey, G.; Rawson, A.; Warriner, K.; Gernigon, G. Application of principal component and hierarchical cluster analysis to classify fruits and vegetables commonly consumed in Ireland based on in vitro antioxidant activity. J. Food Compos. Anal. 2011, 24, 250–256. [Google Scholar] [CrossRef]
- Beh, L.K.; Zakaria, Z.; Beh, B.K.; Ho, W.Y.; Yeap, S.K.; Banu, N.; Alitheen, M. Comparison of total phenolic content and antioxidant activities of freeze-dried commercial and fresh fruit juices. J. Med. Plants Res. 2012, 6, 5857–5862. [Google Scholar] [CrossRef]
- Nour, V.; Trandafir, I.; Cosmulescu, S. Bioactive Compounds, Antioxidant Activity and Nutritional Quality of Different Culinary Aromatic Herbs. Not. Bot. Horti Agrobot. Cluj-Napoca 2017, 45, 179–184. [Google Scholar] [CrossRef]
- Rumbaoa, R.G.O.; Cornago, D.F.; Geronimo, I.M. Phenolic content and antioxidant capacity of Philippine potato (Solanum tuberosum) tubers. J. Food Compos. Anal. 2009, 22, 546–550. [Google Scholar] [CrossRef]
- Kevers, C.; Falkowski, M.; Tabart, J.; Defraigne, J.O.; Dommes, J.; Pincemail, J. Evolution of antioxidant capacity during storage of selected fruits and vegetables. J. Agric. Food Chem. 2007, 55, 8596–8603. [Google Scholar] [CrossRef] [PubMed]
- Cantos, E.; Tudela, J.A.; Gil, M.I.; Espín, J.C. Phenolic compounds and related enzymes are not rate-limiting in browning development of fresh-cut potatoes. J. Agric. Food Chem. 2002, 50, 3015–3023. [Google Scholar] [CrossRef] [PubMed]
- Leja, M.; Mareczek, A.; Ben, J. Antioxidant properties of two apple cultivars during long-term storage. Food Chem. 2003, 80, 303–307. [Google Scholar] [CrossRef]
- Shetty, K.; Shetty, P.; Randhir, R. Bioprocessing Strategies to Enhance L-DOPA and Phenolic Antioxidants in the Fava Bean (Vicia faba). In Food Biotechnology, 2nd ed.; Pometto, F.A., Shetty, K., Paliyath, G., Levin, R.L., Eds.; Taylor & Francis Group/CRC Press: Boca Raton, FL, USA, 2005; ISBN 978-0-8247-5329-0. [Google Scholar]
- Lattanzio, V.; Kroon, P.A.; Quideau, S.; Treutter, D. Plant phenolics—Secondary metabolites with diverse functions. In Recent Advances in Polyphenol Research; John Wiley & Sons: Hoboken, NJ, USA, 2009; Volume 1, pp. 1–35. ISBN 9781405158374. [Google Scholar]
- Al-Weshahy, A.; El-Nokety, M.; Bakhete, M.; Rao, V. Effect of storage on antioxidant activity of freeze-dried potato peels. Food Res. Int. 2013, 50, 507–512. [Google Scholar] [CrossRef]
- Hasegawa, S.; Johnson, R.M.; Gould, W.A. Changes during Storage, Effect of Cold Storage on Chlorogenic Acid Content of Potatoes. J. Agric. Food Chem. 1966, 14, 165–169. [Google Scholar] [CrossRef]
- Shi, Z.U.; Bassa, I.A.; Gabriel, S.L.; Francis, F.J. Anthocyanin pigments of sweet potatoes—Ipomoea batatas. J. Food Sci. 1992, 55, 755–757. [Google Scholar] [CrossRef]
- Leong, S.Y.; Oey, I. Effects of processing on anthocyanins, carotenoids and vitamin C in summer fruits and vegetables. Food Chem. 2012, 133, 1577–1587. [Google Scholar] [CrossRef]
- Toor, R.K.; Savage, G.P. Changes in major antioxidant components of tomatoes during post-harvest storage. Food Chem. 2006, 99, 724–727. [Google Scholar] [CrossRef]
- Viña, S.Z.; Chaves, A.R. Antioxidant responses in minimally processed celery during refrigerated storage. Food Chem. 2006, 94, 68–74. [Google Scholar] [CrossRef]
- Hossain, M.; Patras, A.; Barry-Ryan, C.; Martin-Diana, A.; Brunton, N. Application of Principal Component and Hierarchical Cluster Analysis to Classify Different Spices Based on In Vitro Antioxidant Activity and Individual Polyphenolic Antioxidant Compounds. J. Funct. Foods 2011, 3, 179–189. [Google Scholar] [CrossRef]
- Thaipong, K.; Boonprakob, U.; Crosby, K.; Cisneros-Zevallos, L.; Hawkins Byrne, D. Comparison of ABTS, DPPH, FRAP, and ORAC assays for estimating antioxidant activity from guava fruit extracts. J. Food Compos. Anal. 2006, 19, 669–675. [Google Scholar] [CrossRef]
- Dudonné, S.; Vitrac, X.; Coutiére, P.; Woillez, M.; Mérillon, J.M. Comparative study of antioxidant properties and total phenolic content of 30 plant extracts of industrial interest using DPPH, ABTS, FRAP, SOD, and ORAC assays. J. Agric. Food Chem. 2009, 57, 1768–1774. [Google Scholar] [CrossRef] [PubMed]
- Faller, A.L.K.; Fialho, E. The antioxidant capacity and polyphenol content of organic and conventional retail vegetables after domestic cooking. Food Res. Int. 2009, 42, 210–215. [Google Scholar] [CrossRef]


| Fruits and Vegetables | Phenolic Acids Content (mg/100 g fw) | |||||||||||
|---|---|---|---|---|---|---|---|---|---|---|---|---|
| Gal | Pro | Chl | Caf | Van | Syr | p-Cou | Fer | Sin | Sal | Ell | Cin | |
| Amaranth leaves | 7960.53 ± 7.95 | 121.44 ± 0.12 | 175.01 ± 0.03 | 3.57 ± 0.19 | 27.15 ± 4.90 | 0.68 ± 0.01 | 0.67 ± 0.00 | 2.15 ± 0.06 | 384.57 ± 0.25 | 5.97 ± 0.03 | 188.74 ± 3.33 | 82.73 ± 0.12 |
| (18,886.11 ± 13.34) * | (335.09 ± 0.55) * | (236.67 ± 0.51) | (3.20 ± 0.04) | (160.82 ± 1.20) | (1.35 ± 0.01) | (1.41 ± 0.00) * | (2.22 ± 0.01) | (361.87 ± 2.27) | (7.80 ± 0.09) | (636.05 ± 9.22) | (52.35 ± 0.31) | |
| Dill leaves | - | - | 236.23 ± 0.00 | 1.16 ± 0.00 | 432.64 ± 0.00 | 17.25 ± 0.00 | - | 1.76 ± 0.02 | 2587.19 ± 0.52 | 7.97 ± 0.08 | 12,231.48 ± 0.68 | 24.01 ± 0.25 |
| (648.90 ± 7.93) | - | (912.15 ± 0.79) * | (57.72 ± 0.25) * | (1714.27 ± 0.66) * | (52.31 ± 0.15) * | (2.28 ± 0.01) * | (5.61 ± 0.07) * | (5001.95 ± 6.4) * | (42.21 ± 0.89) * | (12,429.06 ± 5.50) | (173.46 ± 0.28) * | |
| Onion leaves | - | - | 66.94 ± 0.05 | 1.25 ± 0.01 | 210.41 ± 0.60 | 1.73 ± 0.00 | 0.34 ± 0.00 | 1.01 ± 0.02 | 1392.04 ± 0.13 | 11.49 ± 0.16 | 3655.16 ± 3.75 | - |
| (36.54 ± 1.42) | (23.66 ± 0.21) | (74.58 ± 0.05) | (3.94 ± 0.02) | (856.61 ± 0.06) * | (3.28 ± 0.14) | (0.71 ± 0.02) * | (7.60 ± 0.01) * | (1068.49 ± 1.34) | (9.90 ± 0.15) | (2187.94 ± 1.99) | (19.72 ± 0.02) | |
| Fenugreek leaves | - | 26.45 ± 0.34 | 35.8 ± 0.02 | 3.18 ± 0.03 | 1530.38 ± 0.92 | 36.39 ± 0.01 | 2.68 ± 0.00 | 6.98 ± 0.02 | 870.21 ± 1.21 | 11.37 ± 0.03 | 681.97 ± 2.30 | 18.86 ± 0.25 |
| - | (10.87 ± 0.47) | (56.88 ± 0.01) | (4.96 ± 0.06) | (2708.97 ± 0.38) * | (52.73 ± 0.02) * | (1.06 ± 0.02) * | (10.52 ± 0.19) * | (1374.82 ± 0.00) | (27.22 ± 0.31) * | (989.15 ± 5.85) | (17.54 ± 1.38) | |
| Spinach leaves | - | - | 0.16 ± 0.01 | 0.31 ± 0.03 | 206.69 ± 0.00 | 0.38 ± 0.00 | 0.14 ± 0.00 | 0.35 ± 0.00 | 105.49 ± 0.01 | 1.17 ± 0.02 | 323.05 ± 5.06 | 48.24 ± 0.48 |
| - | - | (1.21 ± 0.01) | - | (413.8 ± 0.31) | (1.40 ± 0.01) | (2.21 ± 0.01) * | (1.77 ± 0.00) | (177.33 ± 0.6) | (5.35 ± 0.05) | (2616.59 ± 9.61) * | (306.8 ± 0.81) * | |
| Cabbage | - | - | 1.45 ± 0.00 | 0.05 ± 0.00 | 244.24 ± 2.35 | 0.5 ± 0.00 | 0.05 ± 0.00 | 0.42 ± 0.01 | 8.18 ± 0.06 | 0.31 ± 0.01 | 630.94 ± 1.8 | 3.23 ± 0.02 |
| (11.44 ± 0.06) | (1.22 ± 0.03) | (3.26 ± 0.08) | (0.22 ± 0.00) | (197.15 ± 0.15) | (0.88 ± 0.02) | (0.19 ± 0.00) | (2.01 ± 0.01) * | (14.12 ± 0.21) | (4.29 ± 0.03) | (1046.28 ± 0.99) | (5.31 ± 0.01) | |
| Green pepper | - | 8.31 ± 0.02 | 3.49 ± 0.03 | 0.09 ± 0.00 | 1.63 ± 0.04 | 0.03 ± 0.00 | 0.02 ± 0.00 | 0.02 ± 0.00 | 4.10 ± 0.20 | 0.31 ± 0.06 | 7.31 ± 0.16 | 3.63 ± 0.00 |
| (3.40 ± 0.61) | (19.36 ± 0.01) | (1.02 ± 0.04) | - | (8.53 ± 0.08) | (0.05 ± 0.00) | (0.02 ± 0.01) | (0.1 ± 0.01) | (17.77 ± 0.02) | (0.35 ± 0.05) | (96.10 ± 0.42) | (2.78 ± 0.00) | |
| Cauliflower | - | 30.83 ± 0.22 | 13.21 ± 0.02 | 3.89 ± 0.02 | 410.92 ± 0.07 | 0.97 ± 0.00 | 0.70 ± 0.00 | 0.56 ± 0.00 | 6.04 ± 0.11 | 3.21 ± 0.05 | 611.03 ± 0.29 | 4.26 ± 0.04 |
| - | (18.69 ± 0.30) | (7.49 ± 0.01) | (0.29 ± 0.00) | (221.11 ± 0.12) | (0.32 ± 0.00) | (0.53 ± 0.04) | (1.55 ± 0.01) | - | (1.38 ± 0.04) | (472.51 ± 1.73) | - | |
| Eggplant | - | - | 638.03 ± 0.03 | 27.91 ± 0.02 | - | 3.09 ± 0.07 | - | - | 436.38 ± 0.07 | - | - | - |
| - | - | (611.38 ± 0.24) | (30.93 ± 0.03) | - | (3.88 ± 0.01) | - | - | (78.97 ± 0.27) | - | - | - | |
| Tomato | - | - | 20.09 ± 3.14 | 1.96 ± 0.00 | 24.18 ± 0.06 | - | - | 0.70 ± 0.03 | 114.05 ± 0.09 | 6.48 ± 0.01 | 51.84 ± 0.15 | 2.84 ± 0.02 |
| (26.18 ± 0.22) | - | (24.15 ± 0.01) | (1.34 ± 0.02) | - | - | - | (0.70 ± 0.01) | (48.84 ± 0.18) | (6.09 ± 0.03) | (308.61 ± 2.36) | - | |
| Carrot | - | - | 36.71 ± 1.14 | 1.65 ± 0.02 | 265.02 ± 9.41 | 1.65 ± 0.26 | 0.32 ± 0.05 | 0.17 ± 0.08 | 48.52 ± 3.66 | 3.80 ± 0.41 | - | 32.31 ± 4.82 |
| - | - | (20.26 ± 0.62) | (1.49 ± 0.02) | (9.95 ± 1.60) | (0.44 ± 0.07) | (0.24 ± 0.04) | (0.15 ± 0.04) | (3.13 ± 7.32) | (2.50 ± 0.56) | (53.32 ± 4.16) | (5.65 ± 0.90) | |
| Potato | - | - | 11.45 ± 0.04 | 1.01 ± 0.02 | 6.40 ± 0.01 | 0.33 ± 0.00 | 0.27 ± 0.01 | 0.12 ± 0.02 | 8.03 ± 0.07 | 1.08 ± 0.04 | 46.28 ± 0.24 | 9.54 ± 0.14 |
| - | - | (18.13 ± 0.04) | (1.18 ± 0.00) | (10.23 ± 0.07) | (0.65 ± 0.02) | (0.03 ± 0.00) | (0.11 ± 0.01) | (5.92 ± 0.01) | (1.37 ± 0.01) | (41.48 ± 0.22) | (6.25 ± 0.02) | |
| Sugar beet | - | - | 7.48 ± 0.12 | - | - | 1.31 ± 0.00 | - | 0.54 ± 0.02 | 46.21 ± 0.09 | - | 274.08 ± 0.79 | - |
| (10.08 ± 2.97) | - | - | (0.34 ± 0.02) | - | (0.56 ± 0.01) | - | - | (72.67 ± 0.22) | (3.57 ± 0.12) | (117.13 ± 0.73) | (3.62 ± 0.01) | |
| Apple | - | - | 1.11 ± 0.01 | 0.35 ± 0.06 | 31 ± 0.07 | 0.21 ± 0.00 | - | - | 34.34 ± 0.09 | 0.57 ± 0.03 | - | - |
| - | - | (33.23 ± 0.03) | (0.95 ± 0.02) | (34.15 ± 0.05) | (0.27 ± 0.01) | - | (0.18 ± 0.00) | (41.62 ± 0.17) | (0.75 ± 0.01) | - | - | |
| Sapota | - | - | 16.29 ± 0.25 | 0.23 ± 0.00 | 21.4 ± 0.02 | 0.07 ± 0.00 | - | - | 6.82 ± 0.05 | 0.22 ± 0.01 | - | - |
| - | (2.17 ± 0.02) | (7.36 ± 0.01) | (0.22 ± 0.05) | (15.05 ± 0.07) | (0.06 ± 0.02) | - | - | (26.45 ± 0.04) | (1.12 ± 0.01) | (35.02 ± 0.97) | - | |
| Pomegranate | - | - | 3.04 ± 0.64 | 0.13 ± 0.00 | 68.47 ± 0.14 | 0.16 ± 0.00 | 0.18 ± 0.01 | - | 38.33 ± 0.06 | 1.04 ± 0.01 | 40.36 ± 5.35 | 2.16 ± 0.04 |
| - | - | (3.38 ± 0.01) | (0.15 ± 0.07) | (14.62 ± 0.01) | (0.13 ± 0.00) | (0.11 ± 0.03) | (0.12 ± 0.02) | (5.23 ± 0.11) | (2.75 ± 0.01) | (33.68 ± 0.22) | - | |
| Banana | - | - | 0.51 ± 0.00 | - | 5.69 ± 0.00 | - | 0.39 ± 0.00 | 0.09 ± 0.00 | - | - | - | - |
| - | - | - | - | - | - | (0.20 ± 0.01) | - | - | - | - | - | |
| Grape | - | - | 8.18 ± 0.02 | - | - | - | 0.18 ± 0.00 | - | 94.74 ± 0.01 | 27.81 ± 0.02 | 79.01 ± 0.87 | 2.97 ± 0.02 |
| (15.95 ± 0.05) | - | (5.41 ± 0.01) | (0.13 ± 0.01) | (8.91 ± 0.16) | (0.09 ± 0.02) | (0.11 ± 0.01) | - | (42.08 ± 0.01) | (13.95 ± 0.01) * | - | - | |
| Orange juice | - | 20.44 ± 0.11 | - | - | 89.97 ± 0.61 | 3.77 ± 0.01 | 0.75 ± 0.01 | - | 70.03 ± 0.16 | 1.06 ± 0.02 | - | 25.03 ± 0.06 |
| - | - | - | - | (42.78 ± 0.04) | (2.65 ± 0.04) | (0.09 ± 0.03) * | (0.21 ± 0.00) | (30.76 ± 0.11) | (7.24 ± 0.01) * | - | (19.22 ± 0.05) | |
| TP | Gal | Pro | Chl | Caf | Van | Syr | p-Cou | Fer | Sin | Sal | Ell | Cin | Vit. C-DNP | Vit. C-AOAC | Vit. C-DCPIP | TA | AA-DPPH | AA-ABTS | |
|---|---|---|---|---|---|---|---|---|---|---|---|---|---|---|---|---|---|---|---|
| Gal | 0.054 | ||||||||||||||||||
| Pro | 0.110 | 0.346 * | |||||||||||||||||
| Chl | 0.423 ** | 0.220 | 0.137 | ||||||||||||||||
| Caf | 0.324 * | 0.259 | 0.202 | 0.836 ** | |||||||||||||||
| Van | 0.087 | 0.029 | 0.356 * | 0.235 | 0.308 | ||||||||||||||
| Syr | 0.403 * | 0.064 | 0.229 | 0.458 ** | 0.497 ** | 0.584 ** | |||||||||||||
| p-Cou | 0.109 | 0.191 | 0.486 ** | 0.114 | 0.154 | 0.588 ** | 0.400 * | ||||||||||||
| Fer | 0.126 | 0.332 * | 0.398 * | 0.446 ** | 0.426 ** | 0.690 ** | 0.489 ** | 0.526 ** | |||||||||||
| Sin | 0.452 ** | 0.311 | 0.092 | 0.549 ** | 0.499 ** | 0.393 * | 0.610 ** | 0.187 | 0.452 ** | ||||||||||
| Sal | 0.068 | 0.413 * | 0.193 * | 0.362 * | 0.342 * | 0.510 ** | 0.335 * | 0.454 ** | 0.589 ** | 0.585 ** | |||||||||
| Ell | 0.171 | 0.342 * | 0.313 | 0.311 | 0.291 | 0.583 ** | 0.412 * | 0.433 ** | 0.803 ** | 0.482 ** | 0.579 ** | ||||||||
| Cin | 0.134 | 0.261 | 0.330 * | 0.146 | 0.233 | 0.577 ** | 0.546 ** | 0.586 ** | 0.533 ** | 0.426 ** | 0.487 ** | 0.468 ** | |||||||
| Vit. C-DNP | 0.412 * | 0.011 | 0.341 * | 0.127 | 0.052 | 0.361 * | 0.078 | 0.150 | 0.304 | 0.056 | 0.093 | 0.453 ** | 0.006 | ||||||
| Vit. C-AOAC | 0.396 * | −0.066 | 0.106 | 0.101 | 0.179 | 0.351 * | 0.029 | 0.049 | 0.304 * | 0.174 | 0.053 | 0.384 * | 0.034 | 0.650 ** | |||||
| Vit. C-DCPIP | 0.525 ** | 0.098 | 0.184 | 0.358 * | 0.319 | 0.383 * | 0.383 * | 0.177 | 0.299 | 0.541 ** | 0.204 | 0.417 * | 0.157 | 0.469 ** | 0.535 ** | ||||
| TA | 0.661 ** | 0.175 | −0.012 | 0.335 * | 0.398 * | 0.173 | 0.548 ** | 0.087 | 0.237 | 0.493 ** | 0.216 | 0.306 | 0.197 | 0.267 | 0.194 | 0.563 ** | |||
| AA-DPPH | 0.808 ** | −0.097 | −0.034 | 0.277 | 0.168 | 0.014 | 0.121 | −0.057 | −0.108 | 0.299 | −0.019 | −0.077 | −0.174 | 0.446 ** | 0.484 ** | 0.440 ** | 0.429 ** | ||
| AA-ABTS | 0.690 ** | −0.237 | 0.076 | 0.208 | 0.081 | 0.028 | 0.117 | 0.093 | −0.105 | 0.234 | −0.020 | −0.014 | −0.138 | 0.434 ** | 0.528 ** | 0.419 ** | 0.482 * | 0.867 ** | |
| AA-FRAP | 0.458 ** | −0.120 | 0.109 | 0.166 | 0.119 | 0.072 | −0.069 | −0.100 | 0.029 | 0.103 | −0.051 | 0.115 | −0.150 | 0.519 ** | 0.650 ** | 0.567 ** | 0.176 | 0.613 ** | 0.660 ** |
© 2017 by the authors. Licensee MDPI, Basel, Switzerland. This article is an open access article distributed under the terms and conditions of the Creative Commons Attribution (CC BY) license (http://creativecommons.org/licenses/by/4.0/).
Share and Cite
Galani, J.H.Y.; Patel, J.S.; Patel, N.J.; Talati, J.G. Storage of Fruits and Vegetables in Refrigerator Increases their Phenolic Acids but Decreases the Total Phenolics, Anthocyanins and Vitamin C with Subsequent Loss of their Antioxidant Capacity. Antioxidants 2017, 6, 59. https://doi.org/10.3390/antiox6030059
Galani JHY, Patel JS, Patel NJ, Talati JG. Storage of Fruits and Vegetables in Refrigerator Increases their Phenolic Acids but Decreases the Total Phenolics, Anthocyanins and Vitamin C with Subsequent Loss of their Antioxidant Capacity. Antioxidants. 2017; 6(3):59. https://doi.org/10.3390/antiox6030059
Chicago/Turabian StyleGalani, Joseph H. Y., Jalpesh S. Patel, Nilesh J. Patel, and Jayant G. Talati. 2017. "Storage of Fruits and Vegetables in Refrigerator Increases their Phenolic Acids but Decreases the Total Phenolics, Anthocyanins and Vitamin C with Subsequent Loss of their Antioxidant Capacity" Antioxidants 6, no. 3: 59. https://doi.org/10.3390/antiox6030059