Interplay between Selenium Levels and Replicative Senescence in WI-38 Human Fibroblasts: A Proteomic Approach


Abstract
:
1. Introduction
2. Materials and Methods
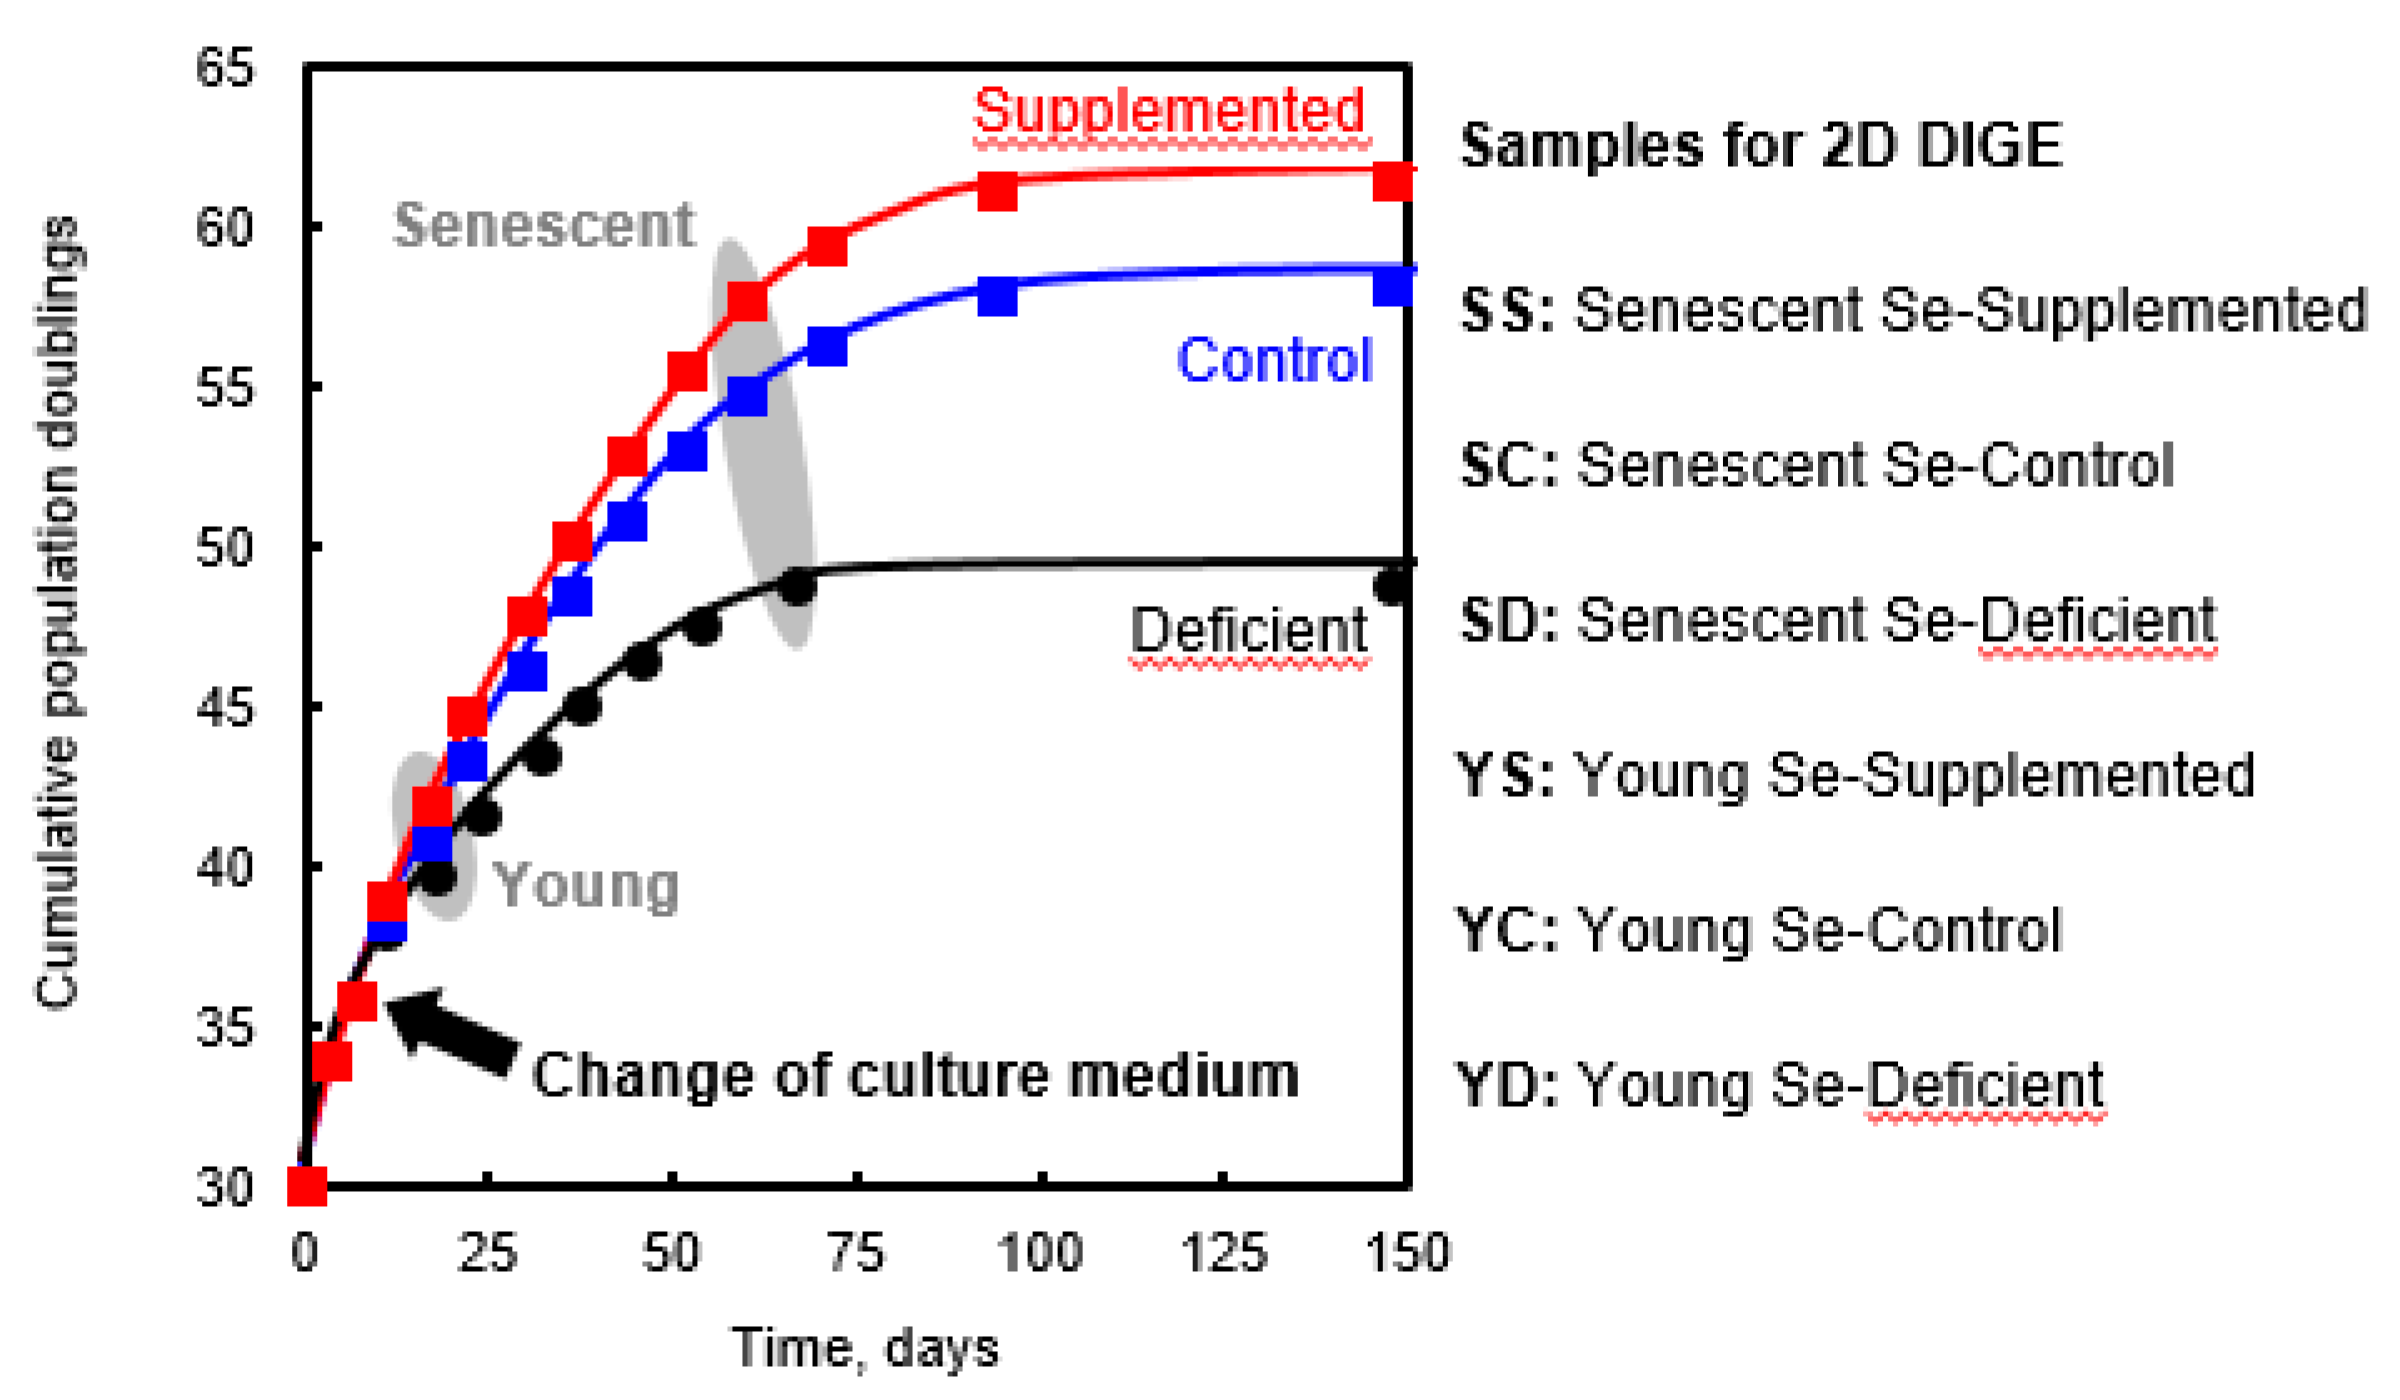
2.1. Cell Growth
2.2. Protein Extraction. 2D Clean-Up Kit. Protein Quantification. Verification of Protein Quality by SDS PAGE
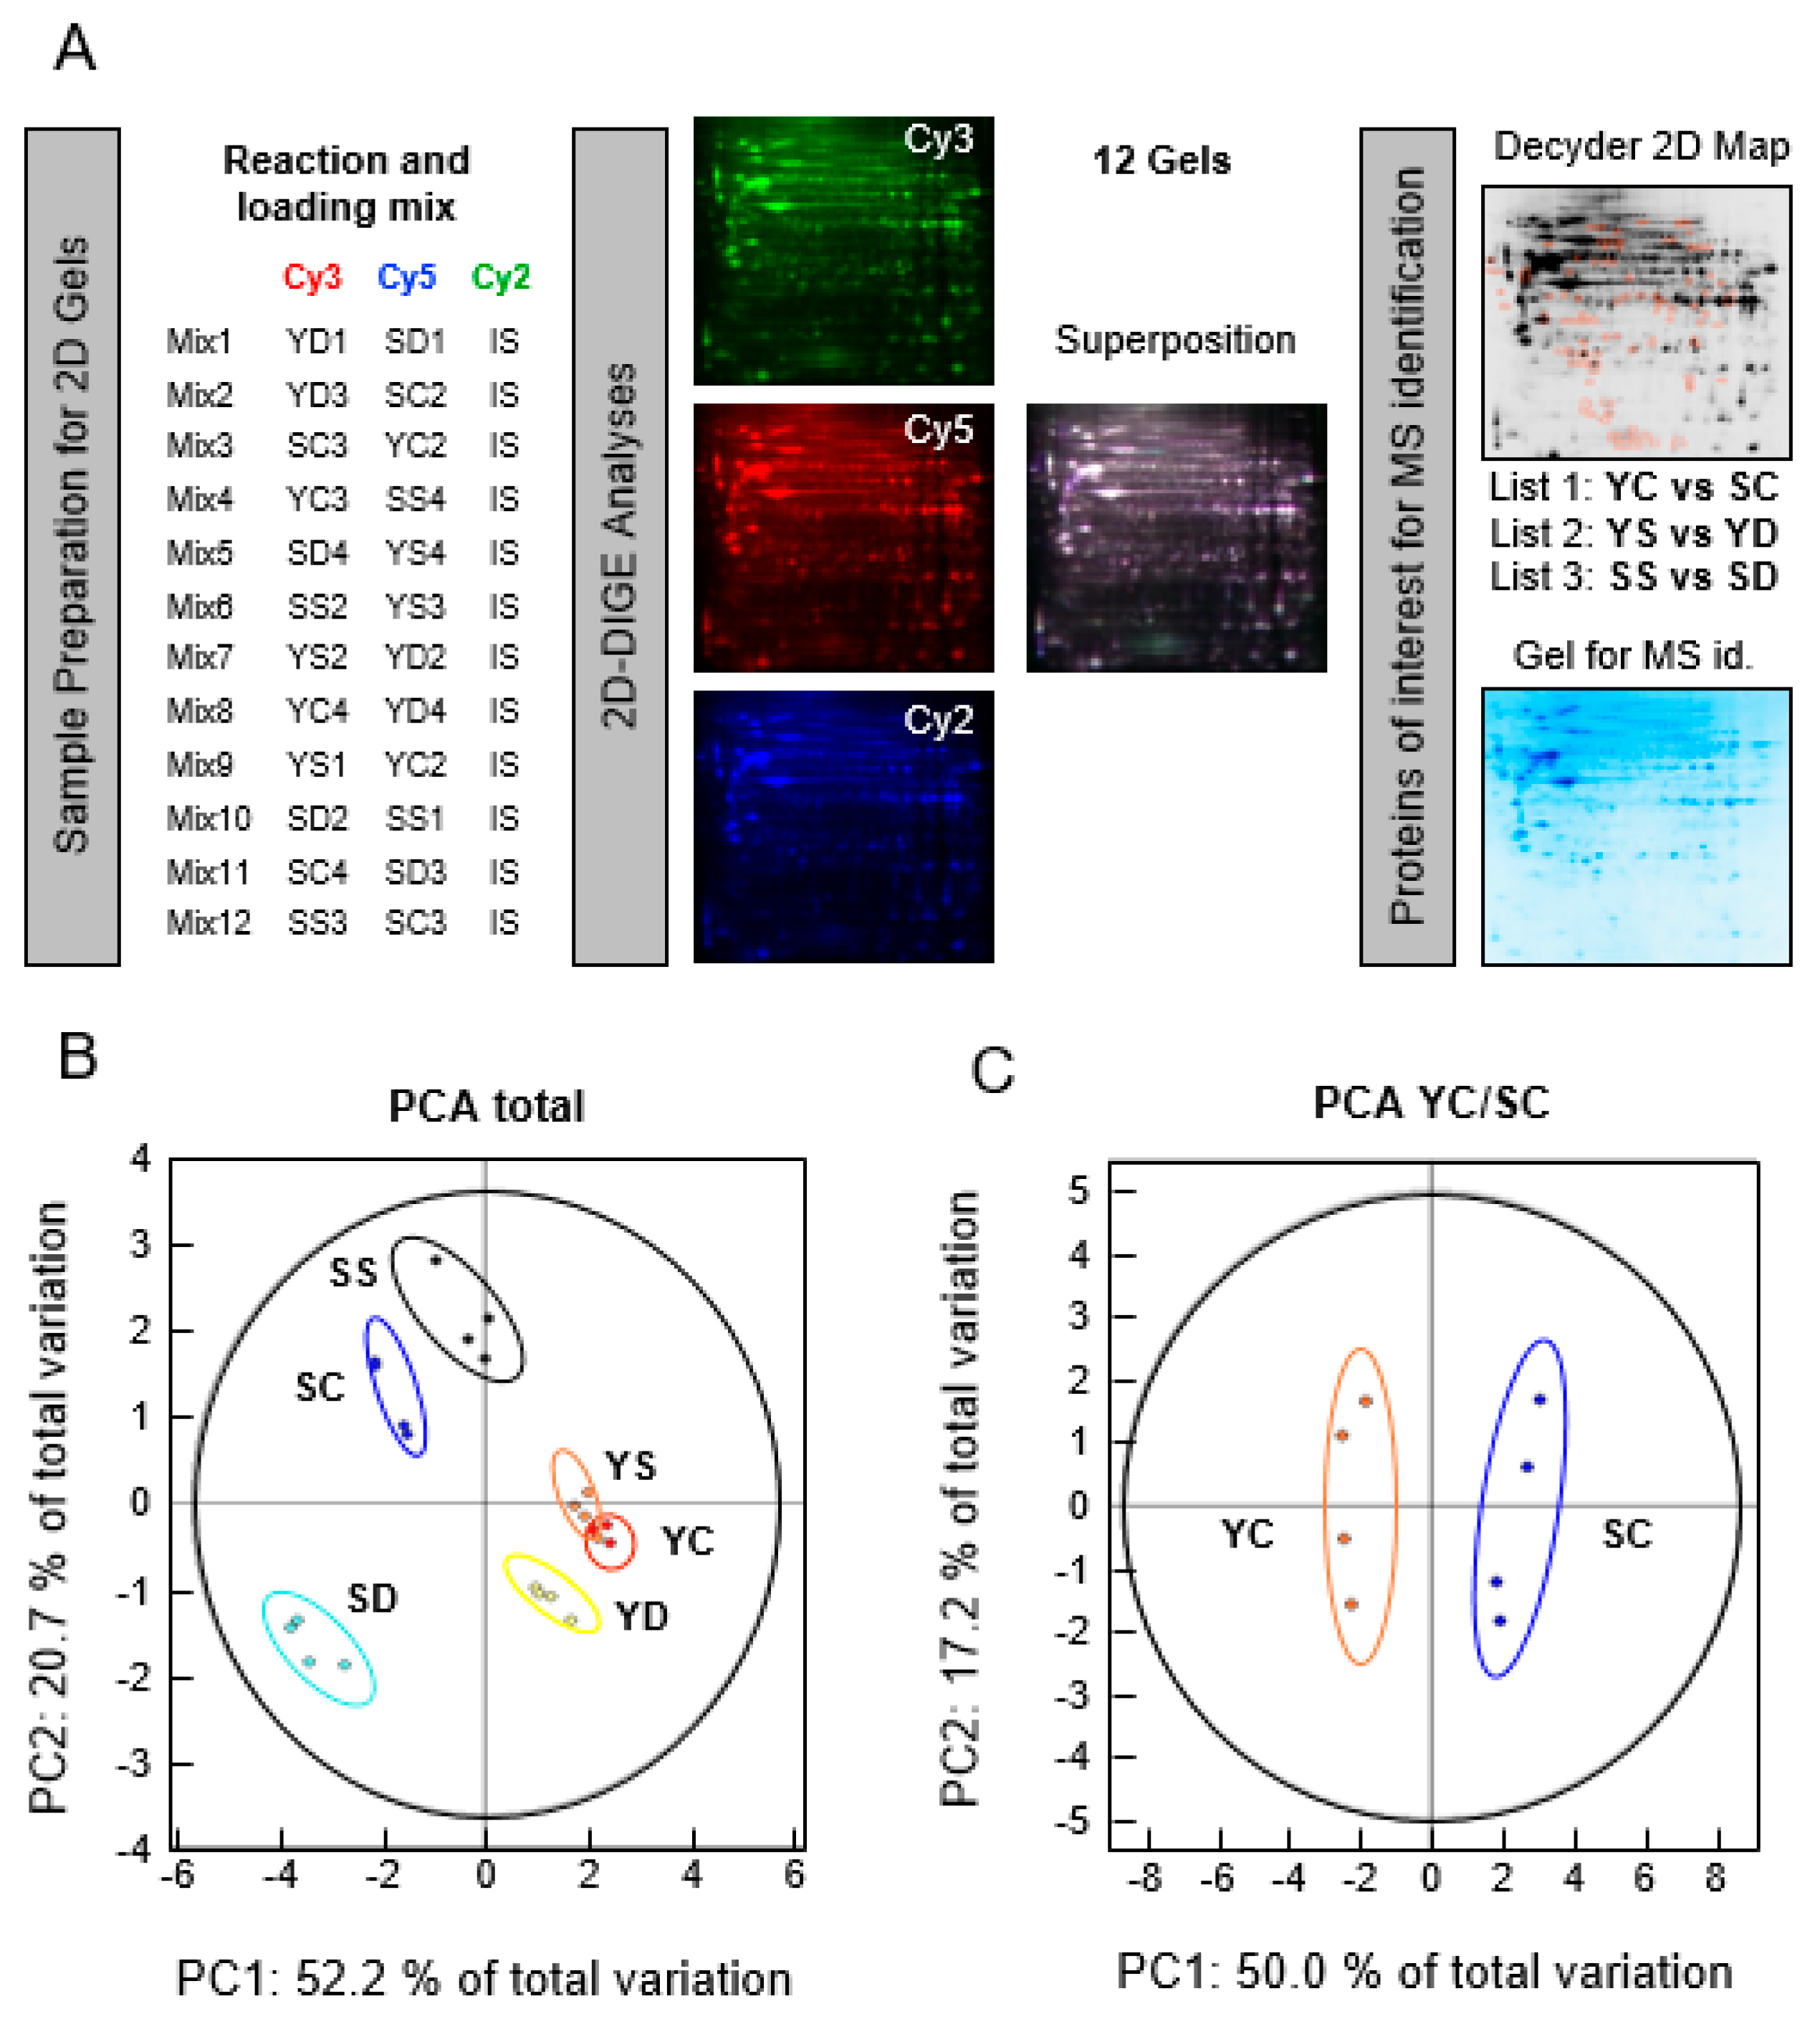
2.3. 2-Dimensional Differential in-Gel Electrophoresis (2D-DIGE) Labeling, Isoelectric Focusing Electrophoresis (IEF), and Sodium Dodecyl Sulfate Polyacrylamide Gel Electrophoresis (SDS-PAGE ) of Protein Samples
2.4. Fluorescence Scanning of the Gel and Decyder Analysis
2.5. Mass Spectrometry Protein Analysis
2.5.1. Sample Preparation
2.5.2. NanoLC-MS/MS Analyses
2.5.3. Protein Identification
3. Results
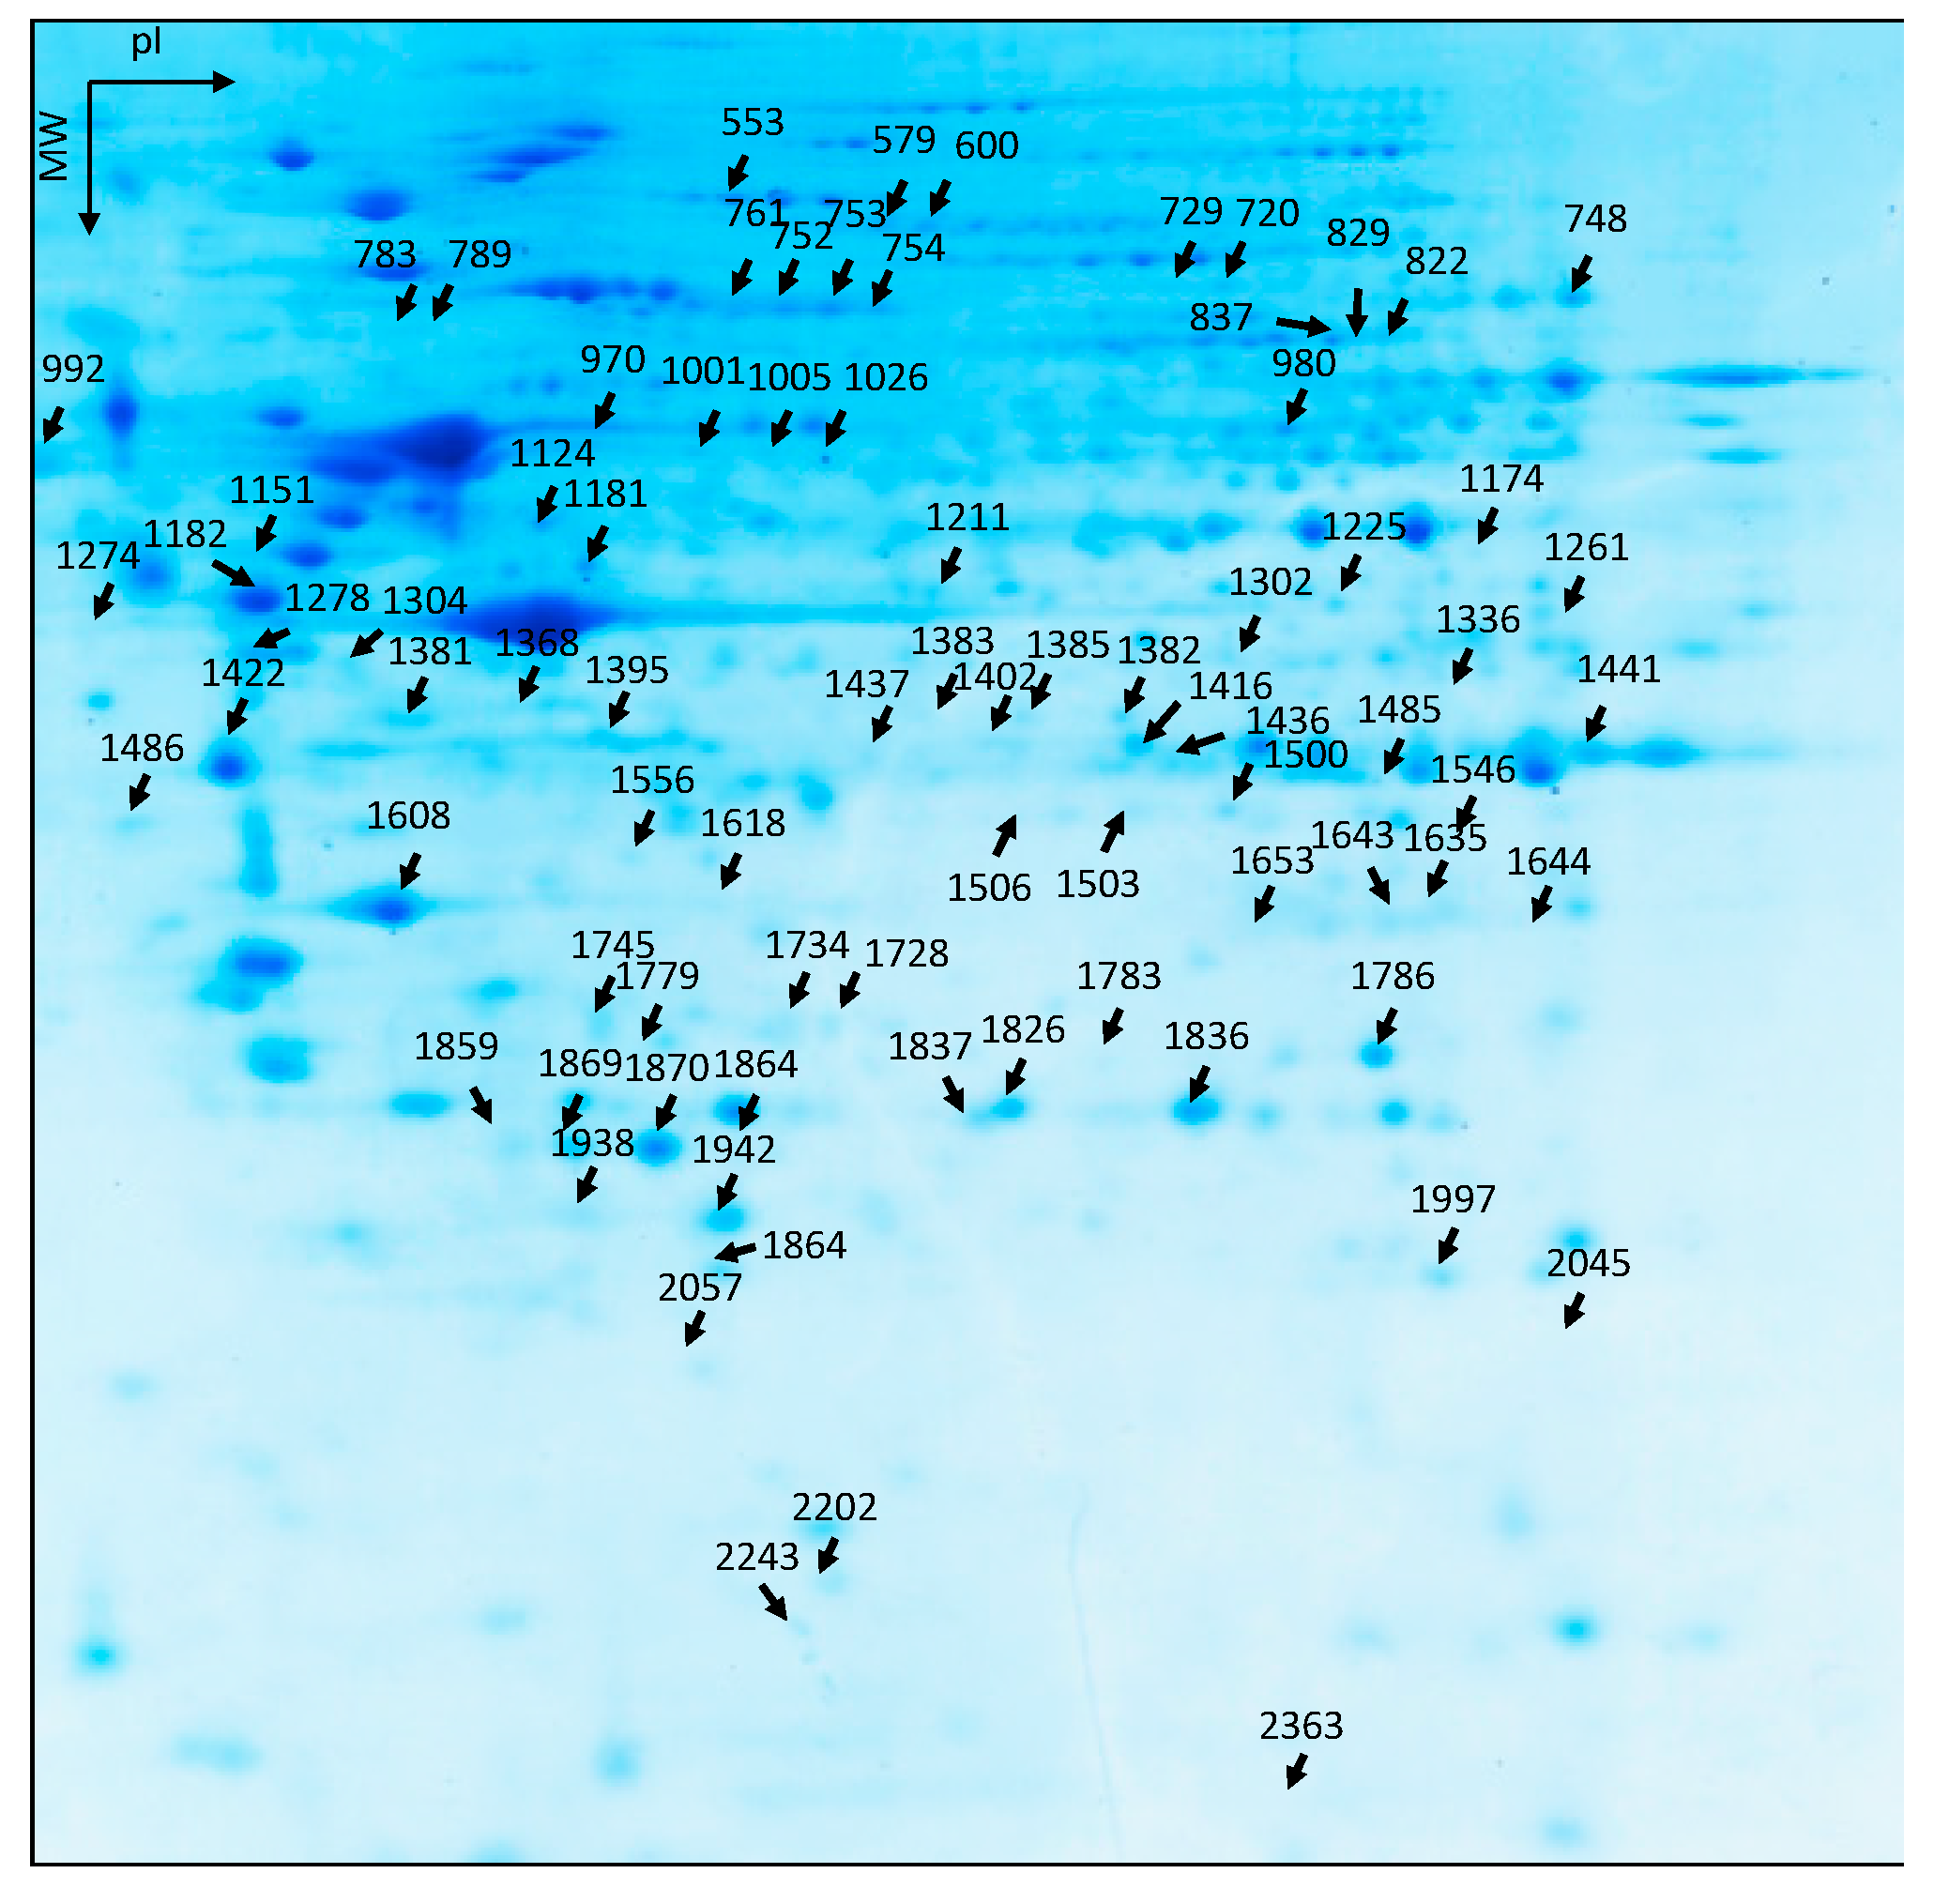
3.1. 2-Dimensional Differential in-Gel Electrophoresis (2D-DIGE) and Mass Spectrometry Identification of Protein Spots
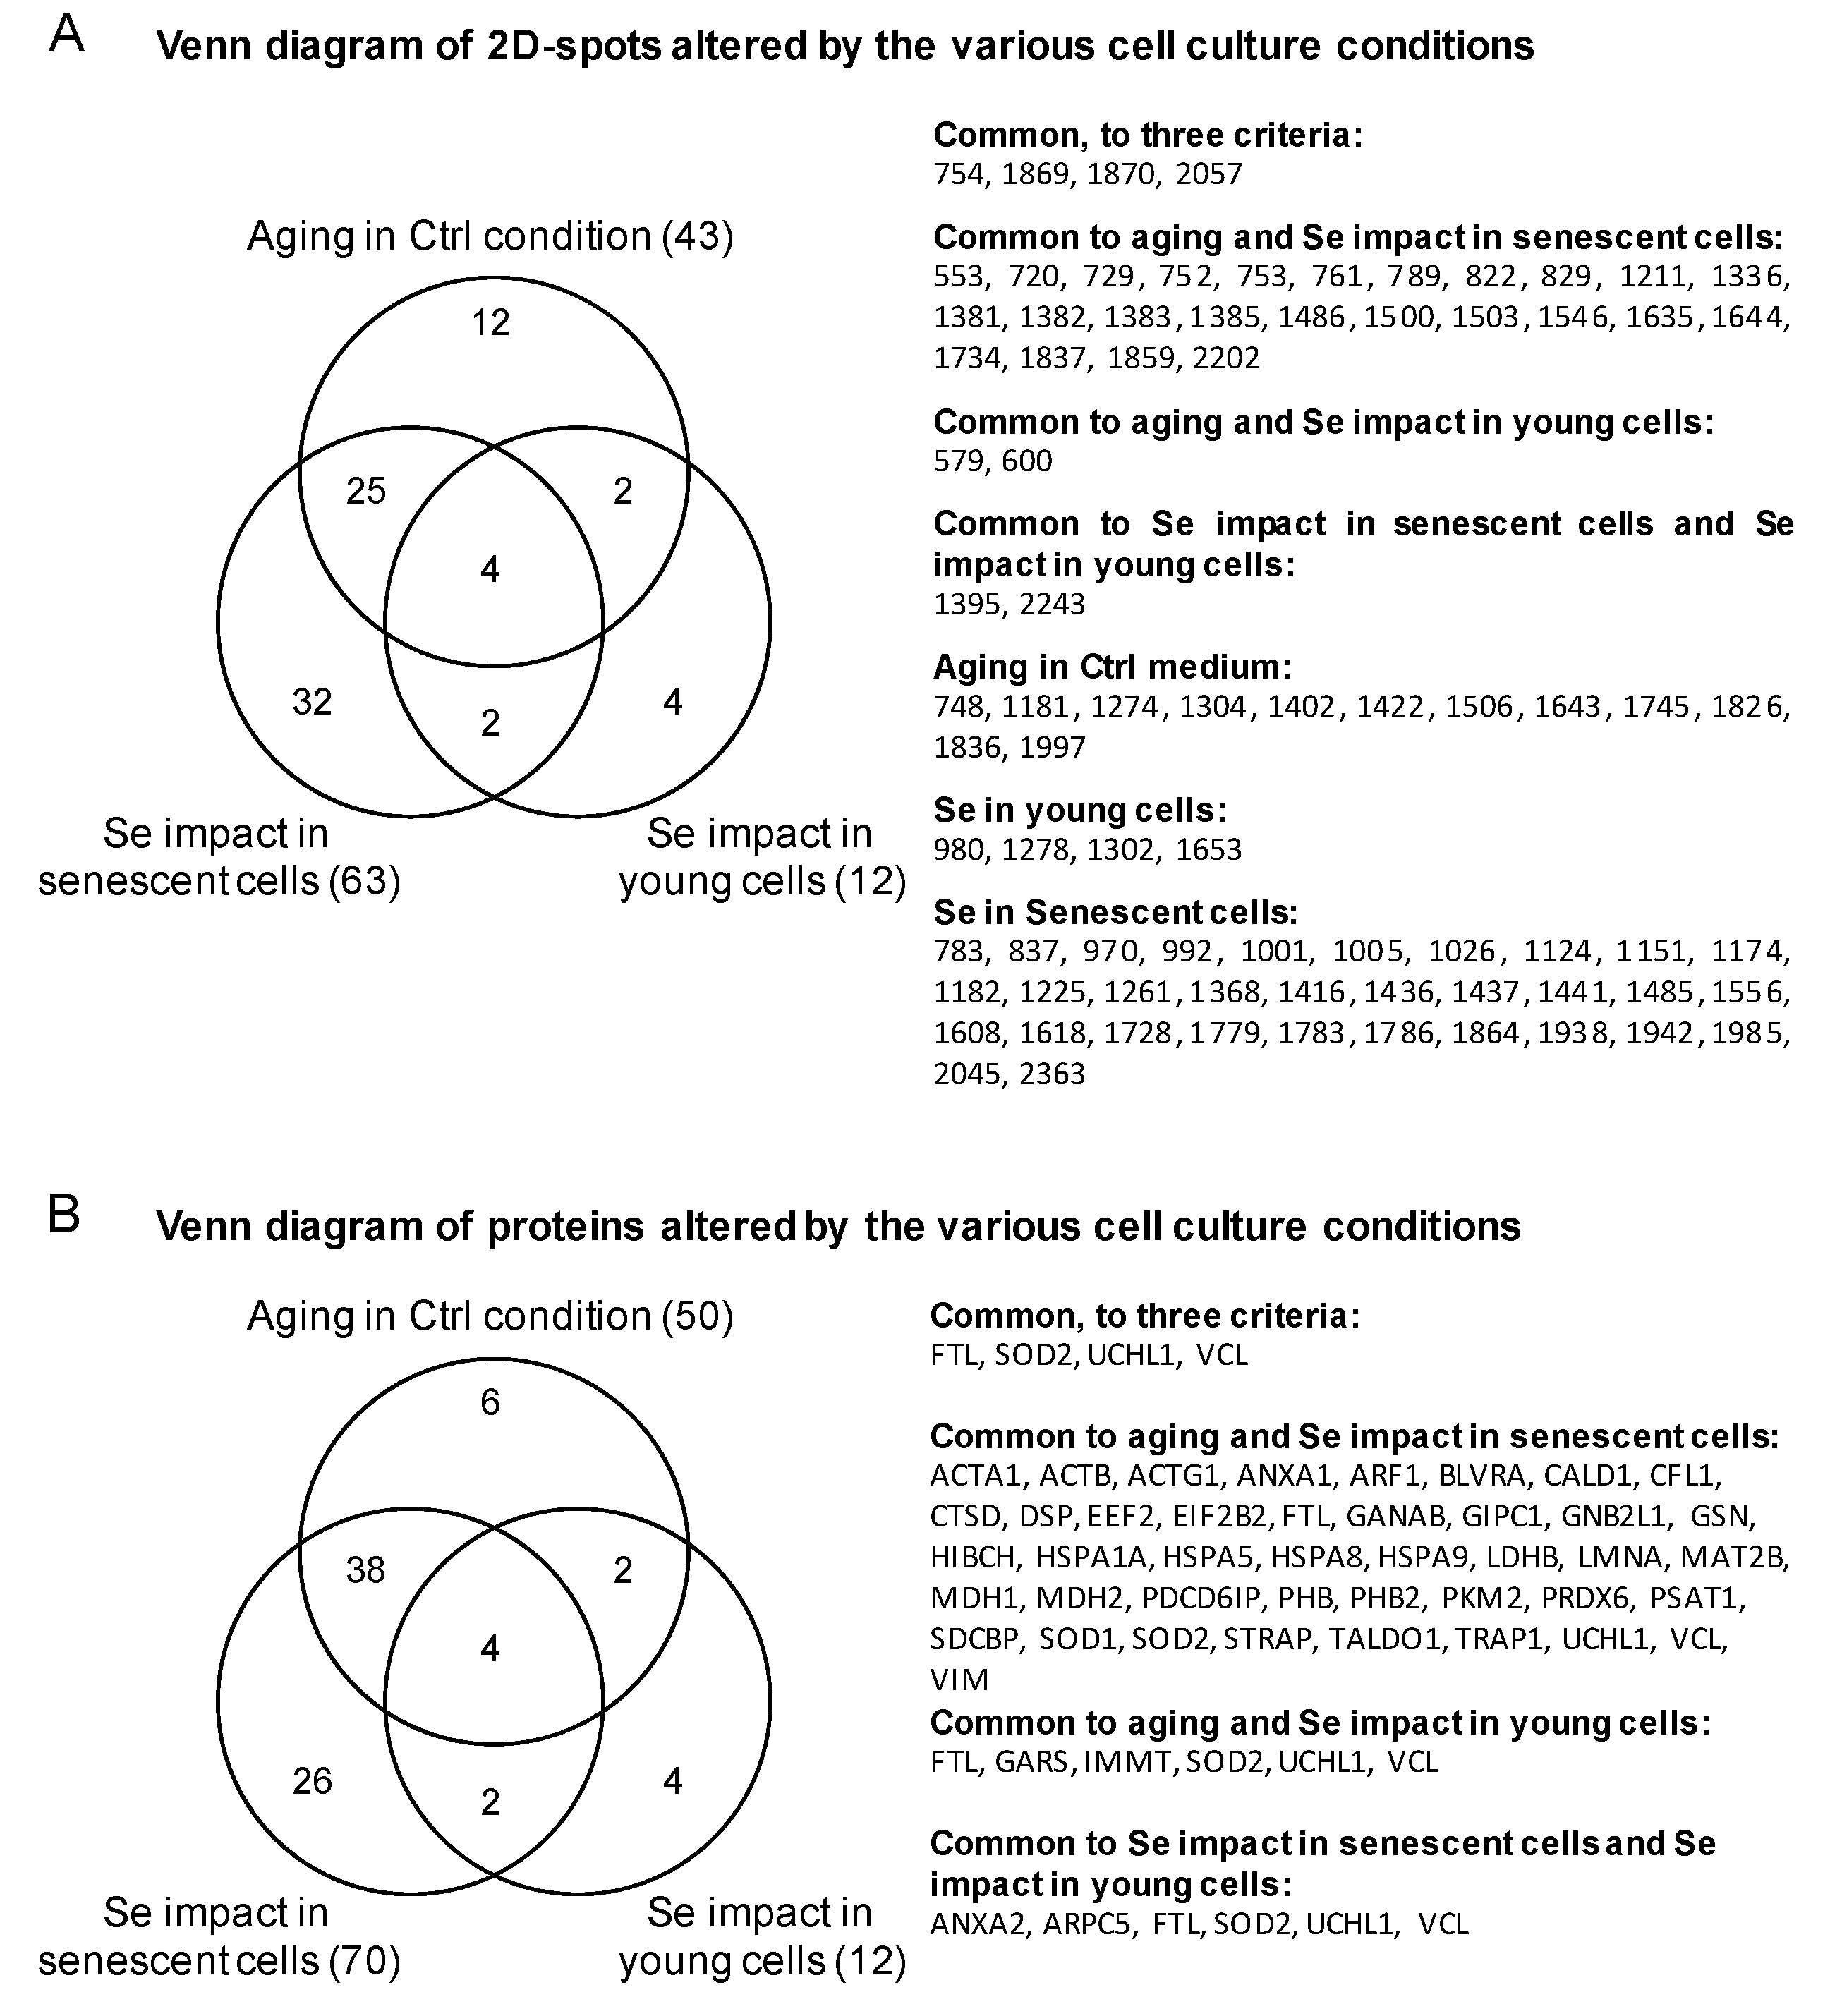
3.2. Effect of Senescence in Ctl Conditions
3.3. Effect of Selenium on Young and Presenescent Cells
3.4. Intersection between Selenium and Senescence
4. Discussion
5. Conclusions
Supplementary Materials
Acknowledgments
Author Contributions
Conflicts of Interest
Abbreviations
References
- Papp, L.V.; Holmgren, A.; Khanna, K.K. Selenium and selenoproteins in health and disease. Antioxid. Redox Signal. 2010, 12, 793–795. [Google Scholar] [CrossRef] [PubMed]
- Latrèche, L.; Chavatte, L. Selenium incorporation into selenoproteins, implications in human health. Metal Ions in Biol. Med. X 2008, 10, 731–737. [Google Scholar]
- Whanger, P.D. Selenium and its relationship to cancer: An update. Br. J. Nutr. 2004, 91, 11–28. [Google Scholar] [CrossRef] [PubMed]
- Bulteau, A.L.; Chavatte, L. Update on selenoprotein biosynthesis. Antioxid. Redox Signal. 2015, 23, 775–794. [Google Scholar] [CrossRef] [PubMed]
- Gladyshev, V.N.; Arner, E.S.; Berry, M.J.; Brigelius-Flohe, R.; Bruford, E.A.; Burk, R.F.; Carlson, B.A.; Castellano, S.; Chavatte, L.; Conrad, M.; et al. Selenoprotein gene nomenclature. J. Biol. Chem. 2016, 291, 24036–24040. [Google Scholar] [CrossRef] [PubMed]
- Labunskyy, V.M.; Hatfield, D.L.; Gladyshev, V.N. Selenoproteins: Molecular pathways and physiological roles. Physiol. Rev. 2014, 94, 739–777. [Google Scholar] [CrossRef] [PubMed]
- Lobanov, A.V.; Hatfield, D.L.; Gladyshev, V.N. Eukaryotic selenoproteins and selenoproteomes. Biochim. Biophys. Acta 2009, 1790, 1424–1428. [Google Scholar] [CrossRef] [PubMed]
- Kryukov, G.V.; Castellano, S.; Novoselov, S.V.; Lobanov, A.V.; Zehtab, O.; Guigo, R.; Gladyshev, V.N. Characterization of mammalian selenoproteomes. Science 2003, 300, 1439–1443. [Google Scholar] [CrossRef] [PubMed]
- Seeher, S.; Atassi, T.; Mahdi, Y.; Carlson, B.A.; Braun, D.; Wirth, E.K.; Klein, M.O.; Reix, N.; Miniard, A.C.; Schomburg, L.; et al. Secisbp2 is essential for embryonic development and enhances selenoprotein expression. Antioxid. Redox Signal. 2014, 21, 835–849. [Google Scholar] [CrossRef] [PubMed]
- Bosl, M.R.; Takaku, K.; Oshima, M.; Nishimura, S.; Taketo, M.M. Early embryonic lethality caused by targeted disruption of the mouse selenocysteine tRNA gene (Trsp). Proc. Natl. Acad. Sci. USA 1997, 94, 5531–5534. [Google Scholar] [CrossRef] [PubMed]
- Touat-Hamici, Z.; Legrain, Y.; Sonet, J.; Bulteau, A.-L.; Chavatte, L. Alteration of selenoprotein expression during stress and in aging. In Selenium: Its Molecular Biology and Role in Human Health, 4th ed.; Hatfield, D.L., Schweizer, S.U., Tsuji, P.A., Gladyshev, V.N., Eds.; Springer Science + Business Media, LLC: New York, NY, USA, 2016; pp. 539–551. [Google Scholar]
- Touat-Hamici, Z.; Legrain, Y.; Bulteau, A.L.; Chavatte, L. Selective up-regulation of human selenoproteins in response to oxidative stress. J. Biol. Chem. 2014, 289, 14750–14761. [Google Scholar] [CrossRef] [PubMed]
- Legrain, Y.; Touat-Hamici, Z.; Chavatte, L. Interplay between selenium levels, selenoprotein expression, and replicative senescence in wi-38 human fibroblasts. J. Biol. Chem. 2014, 289, 6299–6310. [Google Scholar] [CrossRef] [PubMed]
- Papp, L.V.; Lu, J.; Striebel, F.; Kennedy, D.; Holmgren, A.; Khanna, K.K. The redox state of secis binding protein 2 controls its localization and selenocysteine incorporation function. Mol. Cell. Biol. 2006, 26, 4895–4910. [Google Scholar] [CrossRef] [PubMed] [Green Version]
- Childs, B.G.; Durik, M.; Baker, D.J.; van Deursen, J.M. Cellular senescence in aging and age-related disease: From mechanisms to therapy. Nat. Med. 2015, 21, 1424–1435. [Google Scholar] [CrossRef] [PubMed]
- Hayflick, L.; Moorhead, P.S. The serial cultivation of human diploid cell strains. Exp. Cell Res. 1961, 25, 585–621. [Google Scholar] [CrossRef]
- Campisi, J.; d’Adda di Fagagna, F. Cellular senescence: When bad things happen to good cells. Nat. Rev. Mol. Cell Biol. 2007, 8, 729–740. [Google Scholar] [CrossRef] [PubMed]
- Herbig, U.; Jobling, W.A.; Chen, B.P.; Chen, D.J.; Sedivy, J.M. Telomere shortening triggers senescence of human cells through a pathway involving ATM, p53, and p21(CIP1), but not p16(INK4a). Mol. Cell 2004, 14, 501–513. [Google Scholar] [CrossRef]
- D’Adda di Fagagna, F.; Reaper, P.M.; Clay-Farrace, L.; Fiegler, H.; Carr, P.; Von Zglinicki, T.; Saretzki, G.; Carter, N.P.; Jackson, S.P. A DNA damage checkpoint response in telomere-initiated senescence. Nature 2003, 426, 194–198. [Google Scholar] [CrossRef] [PubMed]
- Debacq-Chainiaux, F.; Borlon, C.; Pascal, T.; Royer, V.; Eliaers, F.; Ninane, N.; Carrard, G.; Friguet, B.; de Longueville, F.; Boffe, S.; et al. Repeated exposure of human skin fibroblasts to UVB at subcytotoxic level triggers premature senescence through the TGF-beta1 signaling pathway. J. Cell Sci. 2005, 118, 743–758. [Google Scholar] [CrossRef] [PubMed]
- Toussaint, O.; Royer, V.; Salmon, M.; Remacle, J. Stress-induced premature senescence and tissue ageing. Biochem. Pharmacol. 2002, 64, 1007–1009. [Google Scholar] [CrossRef]
- Dierick, J.F.; Eliaers, F.; Remacle, J.; Raes, M.; Fey, S.J.; Larsen, P.M.; Toussaint, O. Stress-induced premature senescence and replicative senescence are different phenotypes, proteomic evidence. Biochem. Pharmacol. 2002, 64, 1011–1017. [Google Scholar] [CrossRef]
- Flor, A.C.; Wolfgeher, D.; Wu, D.; Kron, S.J. A signature of enhanced lipid metabolism, lipid peroxidation and aldehyde stress in therapy-induced senescence. Cell Death Discov. 2017, 3, 17075. [Google Scholar] [CrossRef] [PubMed]
- Wu, M.; Ye, H.; Shao, C.; Zheng, X.; Li, Q.; Wang, L.; Zhao, M.; Lu, G.; Chen, B.; Zhang, J.; et al. Metabolomics-proteomics combined approach identifies differential metabolism-associated molecular events between senescence and apoptosis. J. Proteome Res. 2017, 16, 2250–2261. [Google Scholar] [CrossRef] [PubMed]
- Olivieri, O.; Stanzial, A.M.; Girelli, D.; Trevisan, M.T.; Guarini, P.; Terzi, M.; Caffi, S.; Fontana, F.; Casaril, M.; Ferrari, S.; et al. Selenium status, fatty acids, vitamins A and E, and aging: The nove study. Am. J. Clin. Nutr. 1994, 60, 510–517. [Google Scholar] [CrossRef] [PubMed]
- Hornsby, P.J.; Harris, S.E. Oxidative damage to DNA and replicative lifespan in cultured adrenocortical cells. Exp. Cell Res. 1987, 168, 203–217. [Google Scholar] [CrossRef]
- Vacchina, V.; Dumont, J. Total selenium quantification in biological samples by inductively coupled plasma mass spectrometry (ICP-MS). Methods Mol. Biol. 2018, 1661, 145–152. [Google Scholar] [PubMed]
- Latreche, L.; Duhieu, S.; Touat-Hamici, Z.; Jean-Jean, O.; Chavatte, L. The differential expression of glutathione peroxidase 1 and 4 depends on the nature of the SECIS element. RNA Biol. 2012, 9, 681–690. [Google Scholar] [CrossRef] [PubMed]
- Redeker, V.; Bonnefoy, J.; Le Caer, J.P.; Pemberton, S.; Laprevote, O.; Melki, R. A region within the C-terminal domain of Ure2p is shown to interact with the molecular chaperone Ssa1p by the use of cross-linkers and mass spectrometry. FEBS J. 2010, 277, 5112–5123. [Google Scholar] [CrossRef] [PubMed]
- Dierick, J.F.; Kalume, D.E.; Wenders, F.; Salmon, M.; Dieu, M.; Raes, M.; Roepstorff, P.; Toussaint, O. Identification of 30 protein species involved in replicative senescence and stress-induced premature senescence. FEBS Lett. 2002, 531, 499–504. [Google Scholar] [CrossRef]
- Toussaint, O.; Medrano, E.E.; von Zglinicki, T. Cellular and molecular mechanisms of stress-induced premature senescence (SIPS) of human diploid fibroblasts and melanocytes. Exp. Gerontol. 2000, 35, 927–945. [Google Scholar] [CrossRef]
- Driscoll, D.M.; Copeland, P.R. Mechanism and regulation of selenoprotein synthesis. Annu. Rev. Nutr. 2003, 23, 17–40. [Google Scholar] [CrossRef] [PubMed]
- Blander, G.; de Oliveira, R.M.; Conboy, C.M.; Haigis, M.; Guarente, L. Superoxide dismutase 1 knock-down induces senescence in human fibroblasts. J. Biol. Chem. 2003, 278, 38966–38969. [Google Scholar] [CrossRef] [PubMed]
- Wu, R.T.; Cao, L.; Chen, B.P.; Cheng, W.H. Selenoprotein H suppresses cellular senescence through genome maintenance and redox regulation. J. Biol. Chem. 2014, 289, 34378–34388. [Google Scholar] [CrossRef] [PubMed]
- Yim, S.H.; Tobe, R.; Turanov, A.A.; Carlson, B.A. Radioactive 75Se Labeling and Detection of Selenoproteins. Methods Mol. Biol. 2018, 1661, 177–192. [Google Scholar] [PubMed]
- Sonet, J.; Mounicou, S.; Chavatte, L. Nonradioactive isotopic labeling and tracing of selenoproteins in cultured cell lines. Methods Mol. Biol. 2018, 1661, 193–203. [Google Scholar] [PubMed]
- Sonet, J.; Mounicou, S.; Chavatte, L. Detection of selenoproteins by laser ablation inductively coupled plasma mass spectrometry (LA-ICP MS) in immobilized pH gradient (IPG) strips. Methods Mol. Biol. 2018, 1661, 205–217. [Google Scholar] [PubMed]


| Master Spot Number | Targets of Senescence | Targets of Selenium in Young Cells | Targets of Selenium in Senescent Cells | |||||||||
|---|---|---|---|---|---|---|---|---|---|---|---|---|
| Protein Name | Gene Name | MS Ident | Score | Nb | Nb acc | Average Ratio (S/Y) | p Value | Average Ratio (Sup/Dpl) | p Value | Average Ratio (Sup/Dpl) | p Value | |
| Mascot | Peptides | |||||||||||
| Proteins Targets Common to Three Conditions | ||||||||||||
| 754 | Vinculin | VCL | Orbitrap | 452 | 15 | P18206 | 2.40 | 0.01800 | 2.68 | 0.01800 | 3.06 | 0.00540 |
| 2057 | Ferritin light chain | FTL | Orbitrap | 422 | 21 | P02792 | 1.91 | 0.00260 | −1.78 | 0.00046 | −3.05 | 0.00000 |
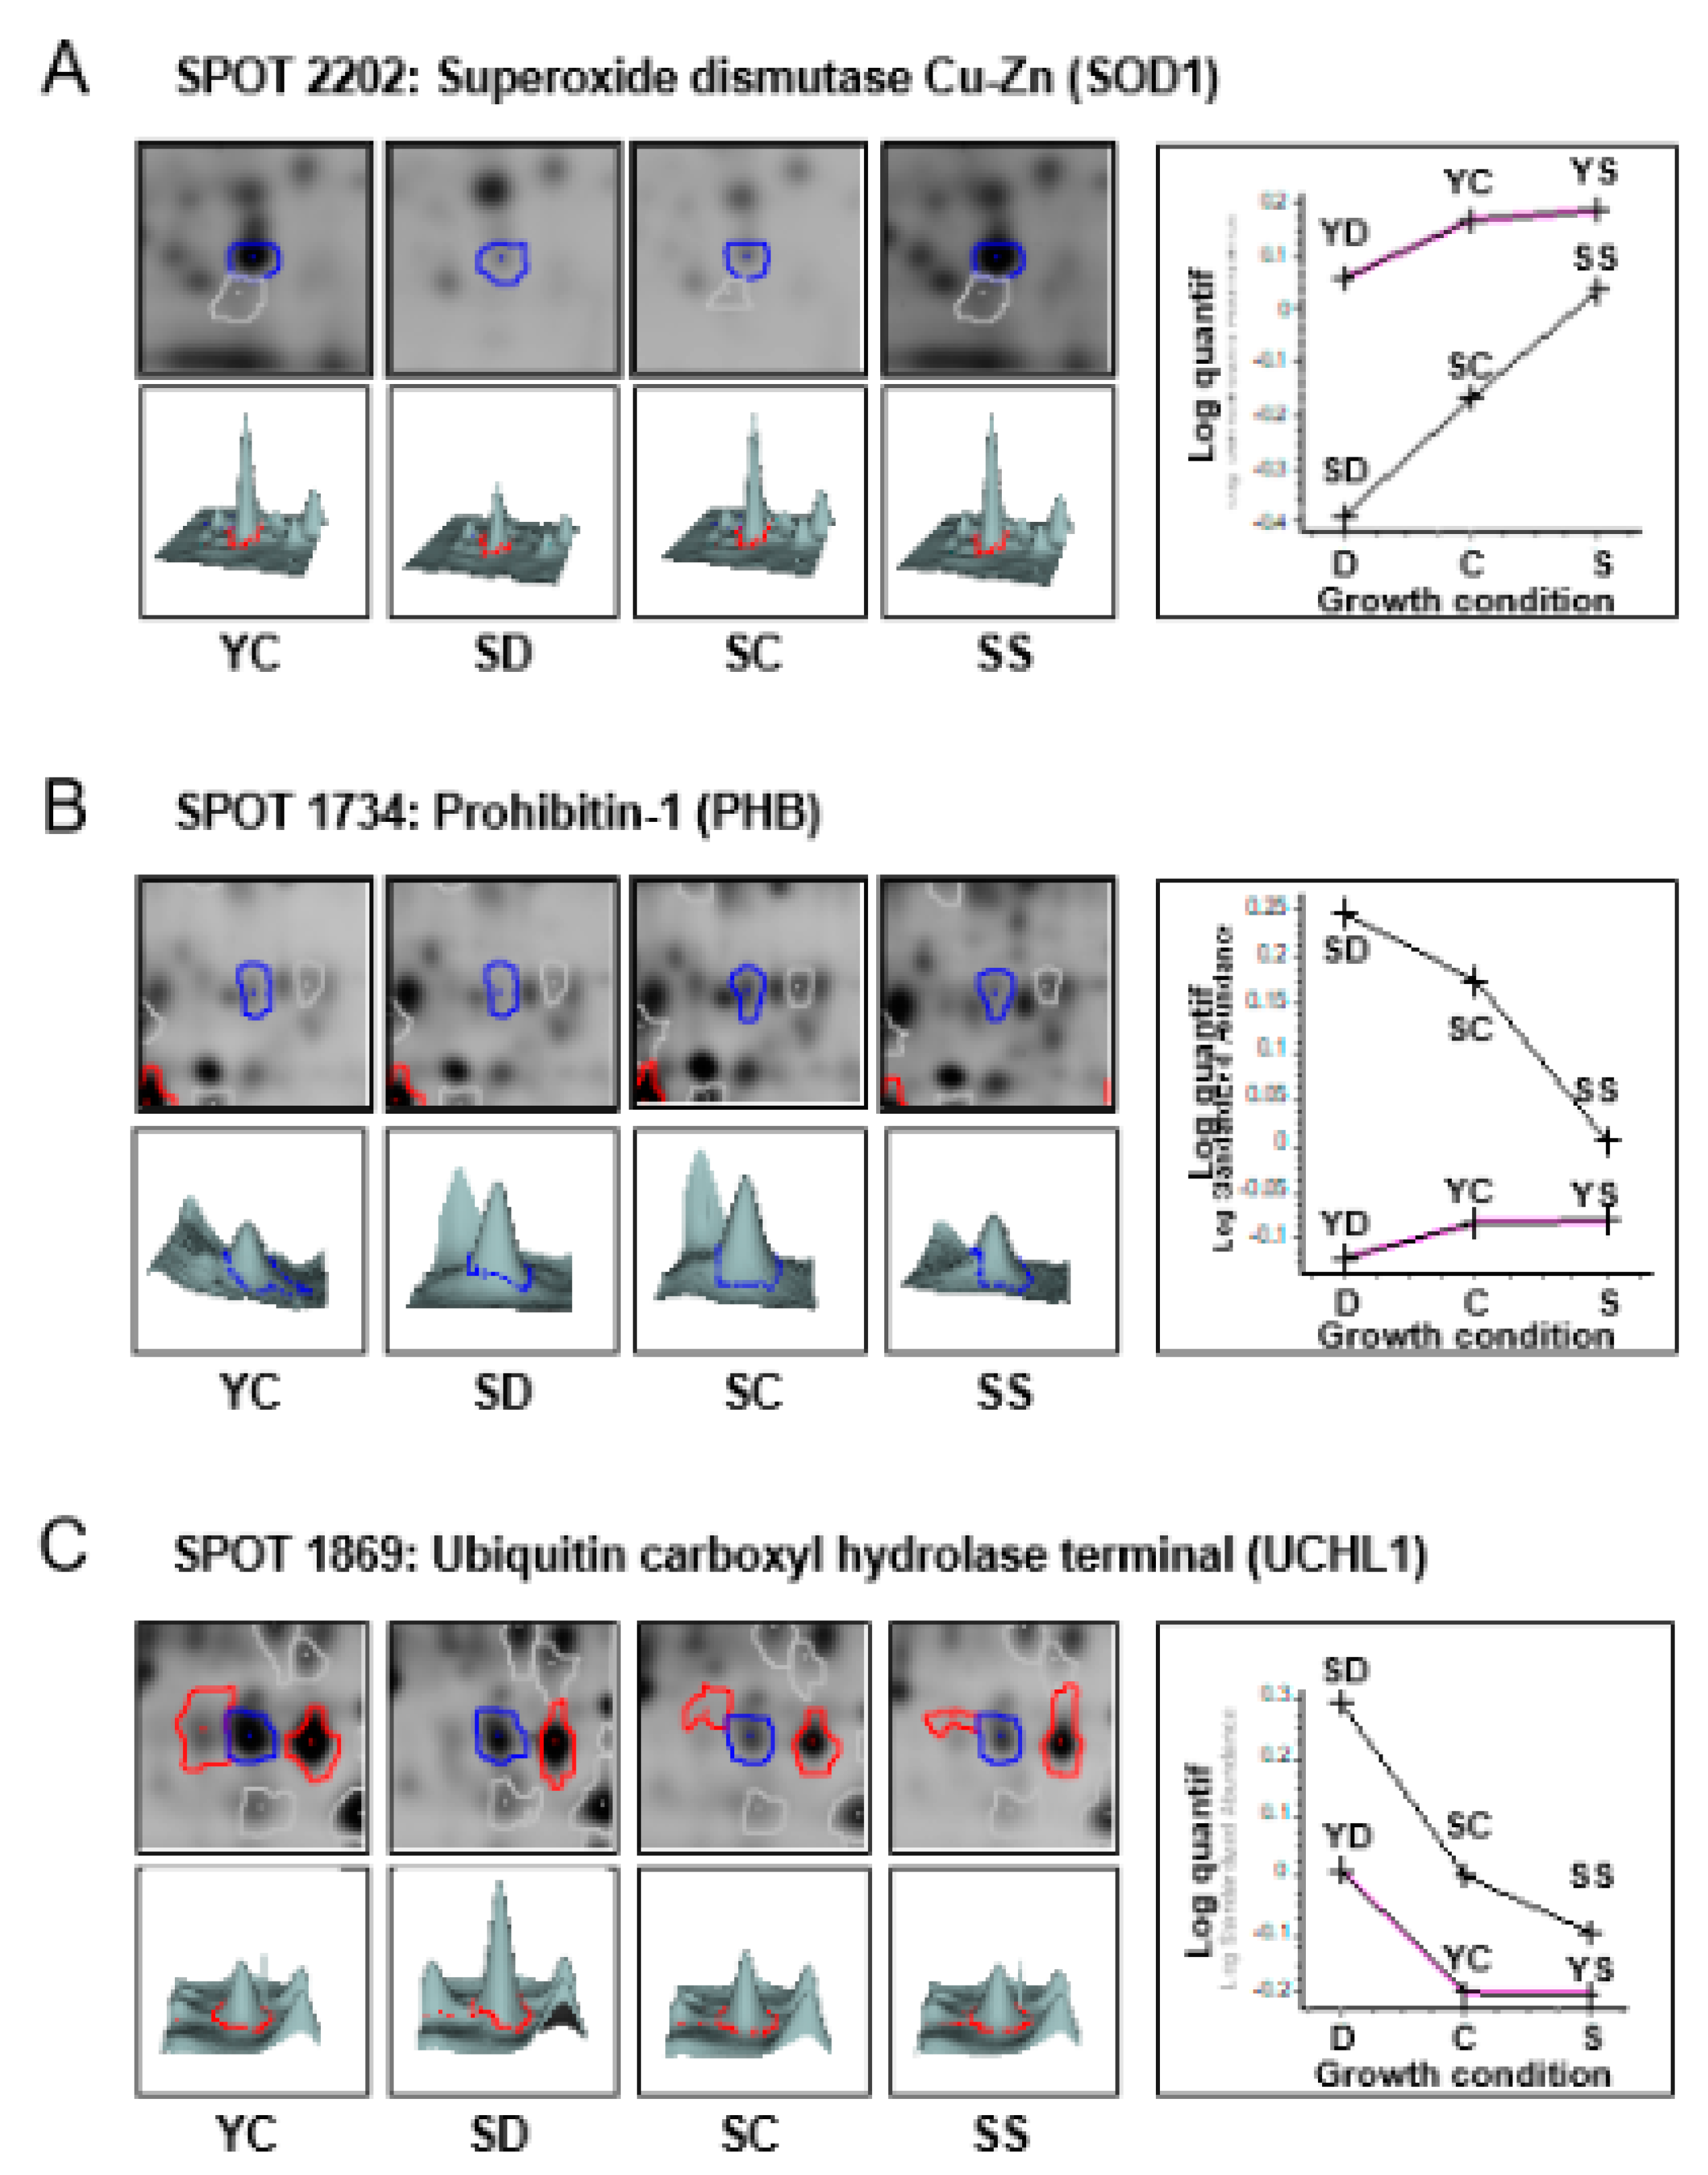
| 1870 | Superoxide dismutase [Mn], mitochondrial | SOD2 | Orbitrap | 165 | 5 | P04179 | 1.58 | 0.00016 | −1.64 | 0.00057 | −2.42 | 0.00086 |
| 1870 | Ubiquitin carboxyl-terminal hydrolase isozyme L1 | UCHL1 | Orbitrap | 197 | 12 | P09936 | 1.58 | 0.00016 | −1.64 | 0.00057 | −2.42 | 0.00086 |
| 1869 | Ubiquitin carboxyl-terminal hydrolase isozyme L1 | UCHL1 | Q-TOF | 251 | 9 | P09936 | 1.54 | 0.00010 | −1.51 | 0.00013 | −2.34 | 0.00003 |
| Proteins Targets Common to Two Conditions | ||||||||||||
| 600 | Glycyl-tRNA synthetase | GARS | Q-TOF | 88 | 4 | P41250 | 1.90 | 0.00059 | −2.09 | 0.00150 | ||
| 600 | Mitochondrial inner membrane protein | IMMT | Q-TOF | 72 | 2 | Q16891 | 1.90 | 0.00059 | −2.09 | 0.00150 | ||
| 579 | Glycyl-tRNA synthetase | GARS | Orbitrap | 1047 | 47 | P41250 | 1.64 | 0.00300 | −1.63 | 0.00130 | ||
| 579 | Mitochondrial inner membrane protein | IMMT | Orbitrap | 1000 | 45 | Q16891 | 1.64 | 0.00300 | −1.63 | 0.00130 | ||
| 579 | Vinculin | VCL | Orbitrap | 940 | 31 | P18206 | 1.64 | 0.00300 | −1.63 | 0.00130 | ||
| 1546 | Prohibitin-2 | PHB2 | Q-TOF | 191 | 6 | Q99623 | 4.48 | 0.00078 | 2.69 | 0.00140 | ||
| 789 | 78 kDa glucose-regulated protein | HSPA5 | Orbitrap | 660 | 22 | P11021 | 2.67 | 0.00280 | 4.47 | 0.00073 | ||
| 1500 | L-lactate dehydrogenase B chain | LDHB | Orbitrap | 235 | 6 | P07195 | 2.61 | 0.00029 | 2.33 | 0.00010 | ||
| 1500 | Malate dehydrogenase, cytoplasmic | MDH1 | Orbitrap | 380 | 15 | P40925 | −2.61 | 0.00029 | 2.33 | 0.00010 | ||
| 761 | Heat shock cognate 71 kDa protein | HSPA8 | Orbitrap | 557 | 20 | P11142 | 2.60 | 0.00540 | 1.79 | 0.01200 | ||
| 761 | Stress-70 protein, mitochondrial | HSPA9 | Orbitrap | 573 | 20 | P38646 | 2.60 | 0.00540 | 1.79 | 0.01200 | ||
| 753 | Gelsolin | GSN | Orbitrap | 252 | 10 | P06396 | 2.40 | 0.01100 | 2.80 | 0.00230 | ||
| 1385 | Actin, cytoplasmic 1 | ACTB | Orbitrap | 184 | 6 | P60709 | 2.33 | 0.00099 | 1.96 | 0.01500 | ||
| 1385 | Translation initiation factor eIF-2B subunit beta | EIF2B2 | Orbitrap | 302 | 9 | P49770 | 2.33 | 0.00099 | 1.96 | 0.01500 | ||
| 1382 | Biliverdin reductase A | BLVRA | Q-TOF | 97 | 5 | P53004 | 2.27 | 0.00130 | 2.14 | 0.00510 | ||
| 753 | Heat shock protein 70 kDa | HSPA1A | Orbitrap | 252 | 7 | P08107 | 2.21 | 0.01100 | 2.80 | 0.00230 | ||
| 752 | Heat shock protein 70 kDa | HSPA1A | Orbitrap | 687 | 24 | P08107 | 2.21 | 0.01500 | 2.50 | 0.00300 | ||
| 1503 | Desmoplakin | DSP | Orbitrap | 198 | 10 | P15924 | 2.21 | 0.00190 | 1.90 | 0.00095 | ||
| 1503 | L-lactate dehydrogenase B chain | LDHB | Orbitrap | 225 | 5 | P07195 | 2.21 | 0.00190 | 1.90 | 0.00095 | ||
| 1503 | Malate dehydrogenase, mitochondrial | MDH2 | Orbitrap | 172 | 6 | P40926 | 2.21 | 0.00190 | 1.90 | 0.00095 | ||
| 1383 | Elongation factor 2 | EEF2 | Orbitrap | 260 | 11 | P13639 | 2.15 | 0.00120 | 2.42 | 0.01200 | ||
| 1383 | PDZ domain-containing protein GIPC1 | GIPC1 | Orbitrap | 244 | 7 | O14908 | 2.15 | 0.00120 | 2.42 | 0.01200 | ||
| 1383 | Transaldolase | TALDO1 | Orbitrap | 164 | 5 | P37837 | 2.15 | 0.00120 | 2.42 | 0.01200 | ||
| 1837 | Peroxiredoxin-6 | PRDX6 | Q-TOF | 214 | 11 | P30041 | 2.04 | 0.00020 | −1.54 | 0.01300 | ||
| 553 | Neutral alpha-glucosidase | GANAB | Orbitrap | 416 | 15 | Q14697 | 1.85 | 0.00007 | −1.64 | 0.00140 | ||
| 553 | Programmed cell death 6-interacting protein | PDCD6IP | Orbitrap | 482 | 18 | Q8WUM4 | 1.85 | 0.00007 | −1.64 | 0.00140 | ||
| 553 | Caldesmon | CALD1 | Q-TOF | 365 | 20 | Q05682 | 1.85 | 0.00007 | −1.64 | 0.00140 | ||
| 553 | Neutral alpha-glucosidase AB | GANAB | Q-TOF | 422 | 20 | Q14697 | 1.85 | 0.00007 | −1.64 | 0.00140 | ||
| 1635 | Annexin A1 | ANXA1 | Orbitrap | 486 | 12 | P04083 | 1.84 | 0.00096 | −2.54 | 0.00460 | ||
| 1635 | Guanine nucleotide-binding protein subunit beta-2-like 1 | GNB2L1 | Orbitrap | 647 | 22 | P63244 | 1.84 | 0.00096 | −2.54 | 0.00460 | ||
| 1635 | Syntenin-1 | SDCBP | Orbitrap | 747 | 22 | O00560 | 1.84 | 0.00096 | −2.54 | 0.00460 | ||
| 1211 | Actin, cytoplasmic 2 | ACTG1 | Q-TOF | 63 | 4 | P63261 | 1.83 | 0.02500 | 1.81 | 0.00014 | ||
| 1734 | Prohibitin | PHB | Q-TOF | 249 | 10 | P35232 | 1.76 | 0.00053 | −1.63 | 0.00160 | ||
| 1859 | Ubiquitin carboxyl-terminal hydrolase isozyme L1 | UCHL1 | Q-TOF | 119 | 5 | P09936 | 1.69 | 0.03500 | −2.18 | 0.00023 | ||
| 1336 | 3-hydroxyisobutyryl-CoA hydrolase, mitochondrial | HIBCH | Orbitrap | 181 | 5 | Q6NVY1 | 1.62 | 0.00014 | −1.69 | 0.01700 | ||
| 1336 | Methionine adenosyltransferase 2 subunit beta | MAT2B | Orbitrap | 186 | 4 | Q9NZL9 | 1.62 | 0.00014 | −1.69 | 0.01700 | ||
| 1336 | Phosphoserine aminotransferase | PSAT1 | Orbitrap | 261 | 11 | Q9Y617 | 1.62 | 0.00014 | −1.69 | 0.01700 | ||
| 1644 | Annexin A1 | ANXA1 | Q-TOF | 198 | 5 | P04083 | 1.52 | 0.00520 | −1.91 | 0.00600 | ||
| 1644 | Guanine nucleotide-binding protein subunit beta-2-like 1 | GNB2L1 | Q-TOF | 110 | 4 | P63244 | 1.52 | 0.00520 | −1.91 | 0.00600 | ||
| 829 | Pyruvate kinase isozymes M1/M2 | PKM2 | Q-TOF | 299 | 14 | P14618 | −1.54 | 0.00200 | 1.70 | 0.00280 | ||
| 1486 | Actin, alpha skeletal muscle | ACTA1 | Q-TOF | 259 | 5 | P68133 | −1.60 | 0.00190 | 1.61 | 0.00044 | ||
| 1486 | Actin, cytoplasmic 2 | ACTG1 | Q-TOF | 259 | 12 | P63261 | −1.60 | 0.00190 | 1.61 | 0.00044 | ||
| 822 | Pyruvate kinase isozymes M1/M2 | PKM2 | Q-TOF | 152 | 9 | P14618 | −1.78 | 0.00130 | 2.59 | 0.00069 | ||
| 1381 | Serine-threonine kinase receptor-associated protein | STRAP | Orbitrap | 667 | 17 | Q9Y3F4 | −1.87 | 0.00004 | 1.65 | 0.02300 | ||
| 1381 | Vimentin | VIM | Orbitrap | 269 | 13 | P08670 | −1.87 | 0.00004 | 1.65 | 0.02300 | ||
| 720 | Heat shock protein 75 kDa, mitochondrial | TRAP1 | Q-TOF | 143 | 6 | Q12931 | −1.89 | 0.00056 | 2.23 | 0.00120 | ||
| 729 | Heat shock protein 71 kDa | HSPA8 | Orbitrap | 702 | 24 | P11142 | −2.01 | 0.00046 | 2.54 | 0.00110 | ||
| 729 | Prelamin-A/C | LMNA | Orbitrap | 577 | 23 | P02545 | −2.01 | 0.00046 | 2.54 | 0.00110 | ||
| 729 | Heat shock protein 75 kDa, mitochondrial | TRAP1 | Orbitrap | 783 | 32 | Q12931 | −2.01 | 0.00046 | 2.54 | 0.00110 | ||
| 2202 | ADP-ribosylation factor 1 | ARF1 | Orbitrap | 298 | 9 | P00441 | −2.18 | 0.00093 | 2.74 | 0.00160 | ||
| 2202 | Cofilin-1 | CFL1 | Orbitrap | 193 | 5 | P23528 | −2.18 | 0.00093 | 2.74 | 0.00160 | ||
| 2202 | Superoxide dismutase [Cu-Zn] | SOD1 | Orbitrap | 399 | 13 | P00441 | −2.18 | 0.00093 | 2.74 | 0.00160 | ||
| Proteins Targets of One Condition | ||||||||||||
| 1836 | Peroxiredoxin-6 | PRDX6 | Q-TOF | 197 | 11 | P30041 | 1.80 | 0.00001 | ||||
| 1826 | Heat shock protein beta-1 | HSPB1 | Q-TOF | 324 | 11 | P04792 | 1.74 | 0.00031 | ||||
| 1506 | 26S proteasome non-ATPase regulatory subunit 14 | PSMD14 | Q-TOF | 139 | 6 | O00487 | 1.73 | 0.02200 | ||||
| 1745 | Cathepsin D | CTSD | Q-TOF | 195 | 8 | P07339 | 1.68 | 0.00002 | ||||
| 1422 | Reticulocalbin-1 | RCN1 | Q-TOF | 432 | 19 | Q15293 | 1.67 | 0.00027 | ||||
| 1422 | Vimentin | VIM | Q-TOF | 68 | 3 | P08670 | 1.67 | 0.00027 | ||||
| 1643 | Electron transfer flavoprotein subunit alpha, mitochondrial | ETFA | Orbitrap | 1130 | 47 | P13804 | 1.62 | 0.00035 | ||||
| 1181 | Eukaryotic initiation factor 4A-I | EIF4A1 | Q-TOF | 138 | 5 | P60842 | −1.53 | 0.00300 | ||||
| 748 | Pyruvate kinase isozymes M1/M2 | PKM2 | Q-TOF | 236 | 7 | P14618 | −1.59 | 0.00074 | ||||
| 1304 | Spermine synthase | SMS | Q-TOF | 116 | 5 | P52788 | −1.62 | 0.00049 | ||||
| 1304 | Vimentin | VIM | Q-TOF | 83 | 5 | P08670 | −1.62 | 0.00049 | ||||
| 1402 | Transaldolase | TALDO1 | Q-TOF | 279 | 7 | P37837 | −1.66 | 0.01100 | ||||
| 1274 | Actin, cytoplasmic 2 | ACTG1 | Q-TOF | 296 | 9 | P63261 | −1.76 | 0.00100 | ||||
| 1395 | Annexin A2 | ANXA2 | Q-TOF | 122 | 4 | P07355 | 2.16 | 0.00300 | 2.13 | 0.00930 | ||
| 2243 | Actin-related protein 2/3 complex subunit 5 | ARPC5 | Q-TOF | 175 | 5 | O15511 | 1.91 | 0.00230 | 1.57 | 0.02100 | ||
| 1653 | Delta(3,5)-Delta(2,4)-dienoyl-CoA isomerase, mitochondrial | ECH1 | Orbitrap | 820 | 21 | O15144 | 1.53 | 0.00001 | ||||
| 1278 | Protein SET | SET | Q-TOF | 116 | 3 | Q01105 | −1.54 | 0.00620 | ||||
| 980 | Glucose-6-phosphate 1-dehydrogenase | G6PD | Q-TOF | 279 | 14 | P11413 | −1.57 | 0.00000 | ||||
| 1302 | Sialic acid synthase | NANS | Q-TOF | 208 | 6 | Q9NR45 | −1.60 | 0.00000 | ||||
| 783 | 78 kDa glucose-regulated protein | HSPA5 | Orbitrap | 887 | 31 | P11021 | 3.00 | 0.00100 | ||||
| 2045 | Desmoplakin | DSP | Q-TOF | 504 | 18 | P15924 | 2.87 | 0.00460 | ||||
| 1124 | Actin, cytoplasmic 2 | ACTG1 | Q-TOF | 383 | 14 | P63261 | 1.75 | 0.00380 | ||||
| 1124 | POTE ankyrin domain family member E | POTEE | Q-TOF | 269 | 7 | Q6S8J3 | 1.75 | 0.00380 | ||||
| 2363 | Actin-related protein 2/3 complex subunit 5-like protein | ARPC5L | Orbitrap | 961 | 36 | Q4R5P2 | 1.73 | 0.00860 | ||||
| 2363 | Heat shock protein beta-6 | HSPB6 | Orbitrap | 554 | 28 | O14558 | 1.73 | 0.00860 | ||||
| 837 | Catalase | CAT | Q-TOF | 176 | 9 | P04040 | 1.68 | 0.00940 | ||||
| 837 | Pyruvate kinase isozymes M1/M2 | PKM2 | Q-TOF | 151 | 6 | P14618 | 1.68 | 0.00940 | ||||
| 1174 | Fumarate hydratase, mitochondrial | FH | Q-TOF | 244 | 5 | P07954 | 1.64 | 0.03400 | ||||
| 1783 | Endoplasmic reticulum resident protein 29 | ERP29 | Q-TOF | 238 | 7 | P30040 | 1.55 | 0.05000 | ||||
| 1864 | Ubiquitin carboxyl-terminal hydrolase isozyme L1 | UCHL1 | Q-TOF | 121 | 6 | P09936 | −1.50 | 0.02900 | ||||
| 1786 | Phosphoglycerate mutase 1 | PGAM1 | Q-TOF | 65 | 3 | P18669 | −1.53 | 0.00009 | ||||
| 1779 | Endoplasmic reticulum resident protein 29 | ERP29 | Orbitrap | 447 | 14 | P30040 | −1.55 | 0.01100 | ||||
| 1779 | Beta-hexosaminidase subunit beta | HEXB | Orbitrap | 533 | 21 | P07686 | −1.55 | 0.01100 | ||||
| 1779 | Nicotinamide N-methyltransferase | NNMT | Orbitrap | 415 | 19 | P40261 | −1.55 | 0.01100 | ||||
| 1005 | Tubulin beta chain | TUBB | Q-TOF | 311 | 10 | P07437 | −1.56 | 0.00035 | ||||
| 1416 | Annexin A1 | ANXA1 | Q-TOF | 343 | 13 | P04083 | −1.56 | 0.00500 | ||||
| 1728 | Cathepsin D | CTSD | Q-TOF | 175 | 8 | P07339 | −1.56 | 0.00900 | ||||
| 1261 | Fructose-bisphosphate aldolase A | ALDOA | Q-TOF | 196 | 8 | P04075 | −1.57 | 0.00380 | ||||
| 1437 | Glyceraldehyde-3-phosphate dehydrogenase | GAPDH | Q-TOF | 222 | 7 | P04406 | −1.61 | 0.01100 | ||||
| 1225 | Isocitrate dehydrogenase [NADP] cytoplasmic | IDH1 | Q-TOF | 375 | 14 | O75874 | −1.63 | 0.02300 | ||||
| 1026 | Aldehyde dehydrogenase, mitochondrial | ALDH2 | Q-TOF | 185 | 5 | P05091 | −1.65 | 0.00004 | ||||
| 1026 | Xaa-Pro dipeptidase | PEPD | Q-TOF | 184 | 5 | P12955 | −1.65 | 0.00004 | ||||
| 1026 | Tubulin beta-4B chain | TUBB4B | Q-TOF | 140 | 6 | P68371 | −1.65 | 0.00004 | ||||
| 1985 | Peroxiredoxin-2 | PRDX2 | Q-TOF | 201 | 10 | P32119 | −1.65 | 0.00380 | ||||
| 970 | Protein disulfide-isomerase A3 | PDIA3 | Q-TOF | 409 | 19 | P30101 | −1.70 | 0.00200 | ||||
| 970 | Vimentin | VIM | Q-TOF | 158 | 4 | P08670 | −1.70 | 0.00200 | ||||
| 1618 | Annexin A5 | ANXA5 | Q-TOF | 175 | 11 | P08758 | −1.71 | 0.00002 | ||||
| 1182 | Desmin | DES | Q-TOF | 415 | 18 | P17661 | −1.77 | 0.01400 | ||||
| 1182 | Vimentin | VIM | Q-TOF | 415 | 18 | P08670 | −1.77 | 0.01400 | ||||
| 1441 | Glyceraldehyde-3-phosphate dehydrogenase | GAPDH | Q-TOF | 246 | 6 | P04406 | −1.77 | 0.00650 | ||||
| 1942 | Glutathione S-transferase P | GSTP1 | Q-TOF | 329 | 10 | P09211 | −1.82 | 0.00094 | ||||
| 1938 | Glutathione S-transferase P | GSTP1 | Orbitrap | 1357 | 40 | P09211 | −1.85 | 0.00000 | ||||
| 992 | Vimentin | VIM | Orbitrap | 2287 | 97 | P08670 | −1.87 | 0.00400 | ||||
| 1368 | Actin, cytoplasmic 1 | ACTB | Q-TOF | 215 | 8 | P60709 | −2.02 | 0.00056 | ||||
| 1001 | Tubulin beta chain | TUBB | Q-TOF | 213 | 6 | P07437 | −2.03 | 0.00010 | ||||
| 1151 | Protein disulfide-isomerase | P4HB | Q-TOF | 121 | 3 | P07237 | −2.04 | 0.00270 | ||||
| 1151 | Ribonuclease inhibitor | RNH1 | Q-TOF | 86 | 3 | P13489 | −2.04 | 0.00270 | ||||
| 1151 | Vimentin | VIM | Q-TOF | 40 | 2 | P08670 | −2.04 | 0.00270 | ||||
| 1556 | l-lactate dehydrogenase B | LDHB | Orbitrap | 234 | 7 | P07195 | −2.05 | 0.00310 | ||||
| 1556 | Inorganic pyrophosphatase | PPA1 | Orbitrap | 376 | 21 | Q15181 | −2.05 | 0.00310 | ||||
| 1556 | Tubulin beta-6 chain | TUBB6 | Orbitrap | 239 | 8 | Q9BUF5 | −2.05 | 0.00310 | ||||
| 1436 | Glyceraldehyde-3-phosphate dehydrogenase | GAPDH | Q-TOF | 206 | 6 | P04406 | −2.07 | 0.00900 | ||||
| 1608 | Annexin A4 | ANXA4 | Q-TOF | 481 | 28 | P09525 | −2.17 | 0.00011 | ||||
| 1485 | Annexin A1 | ANXA1 | Q-TOF | 108 | 4 | P04083 | −2.26 | 0.00032 | ||||
| 1485 | Malate dehydrogenase, cytoplasmic | MDH1 | Q-TOF | 99 | 3 | P40925 | −2.26 | 0.00032 | ||||
| Network | Members | Molecules | Associated Groups or Molecules |
|---|---|---|---|
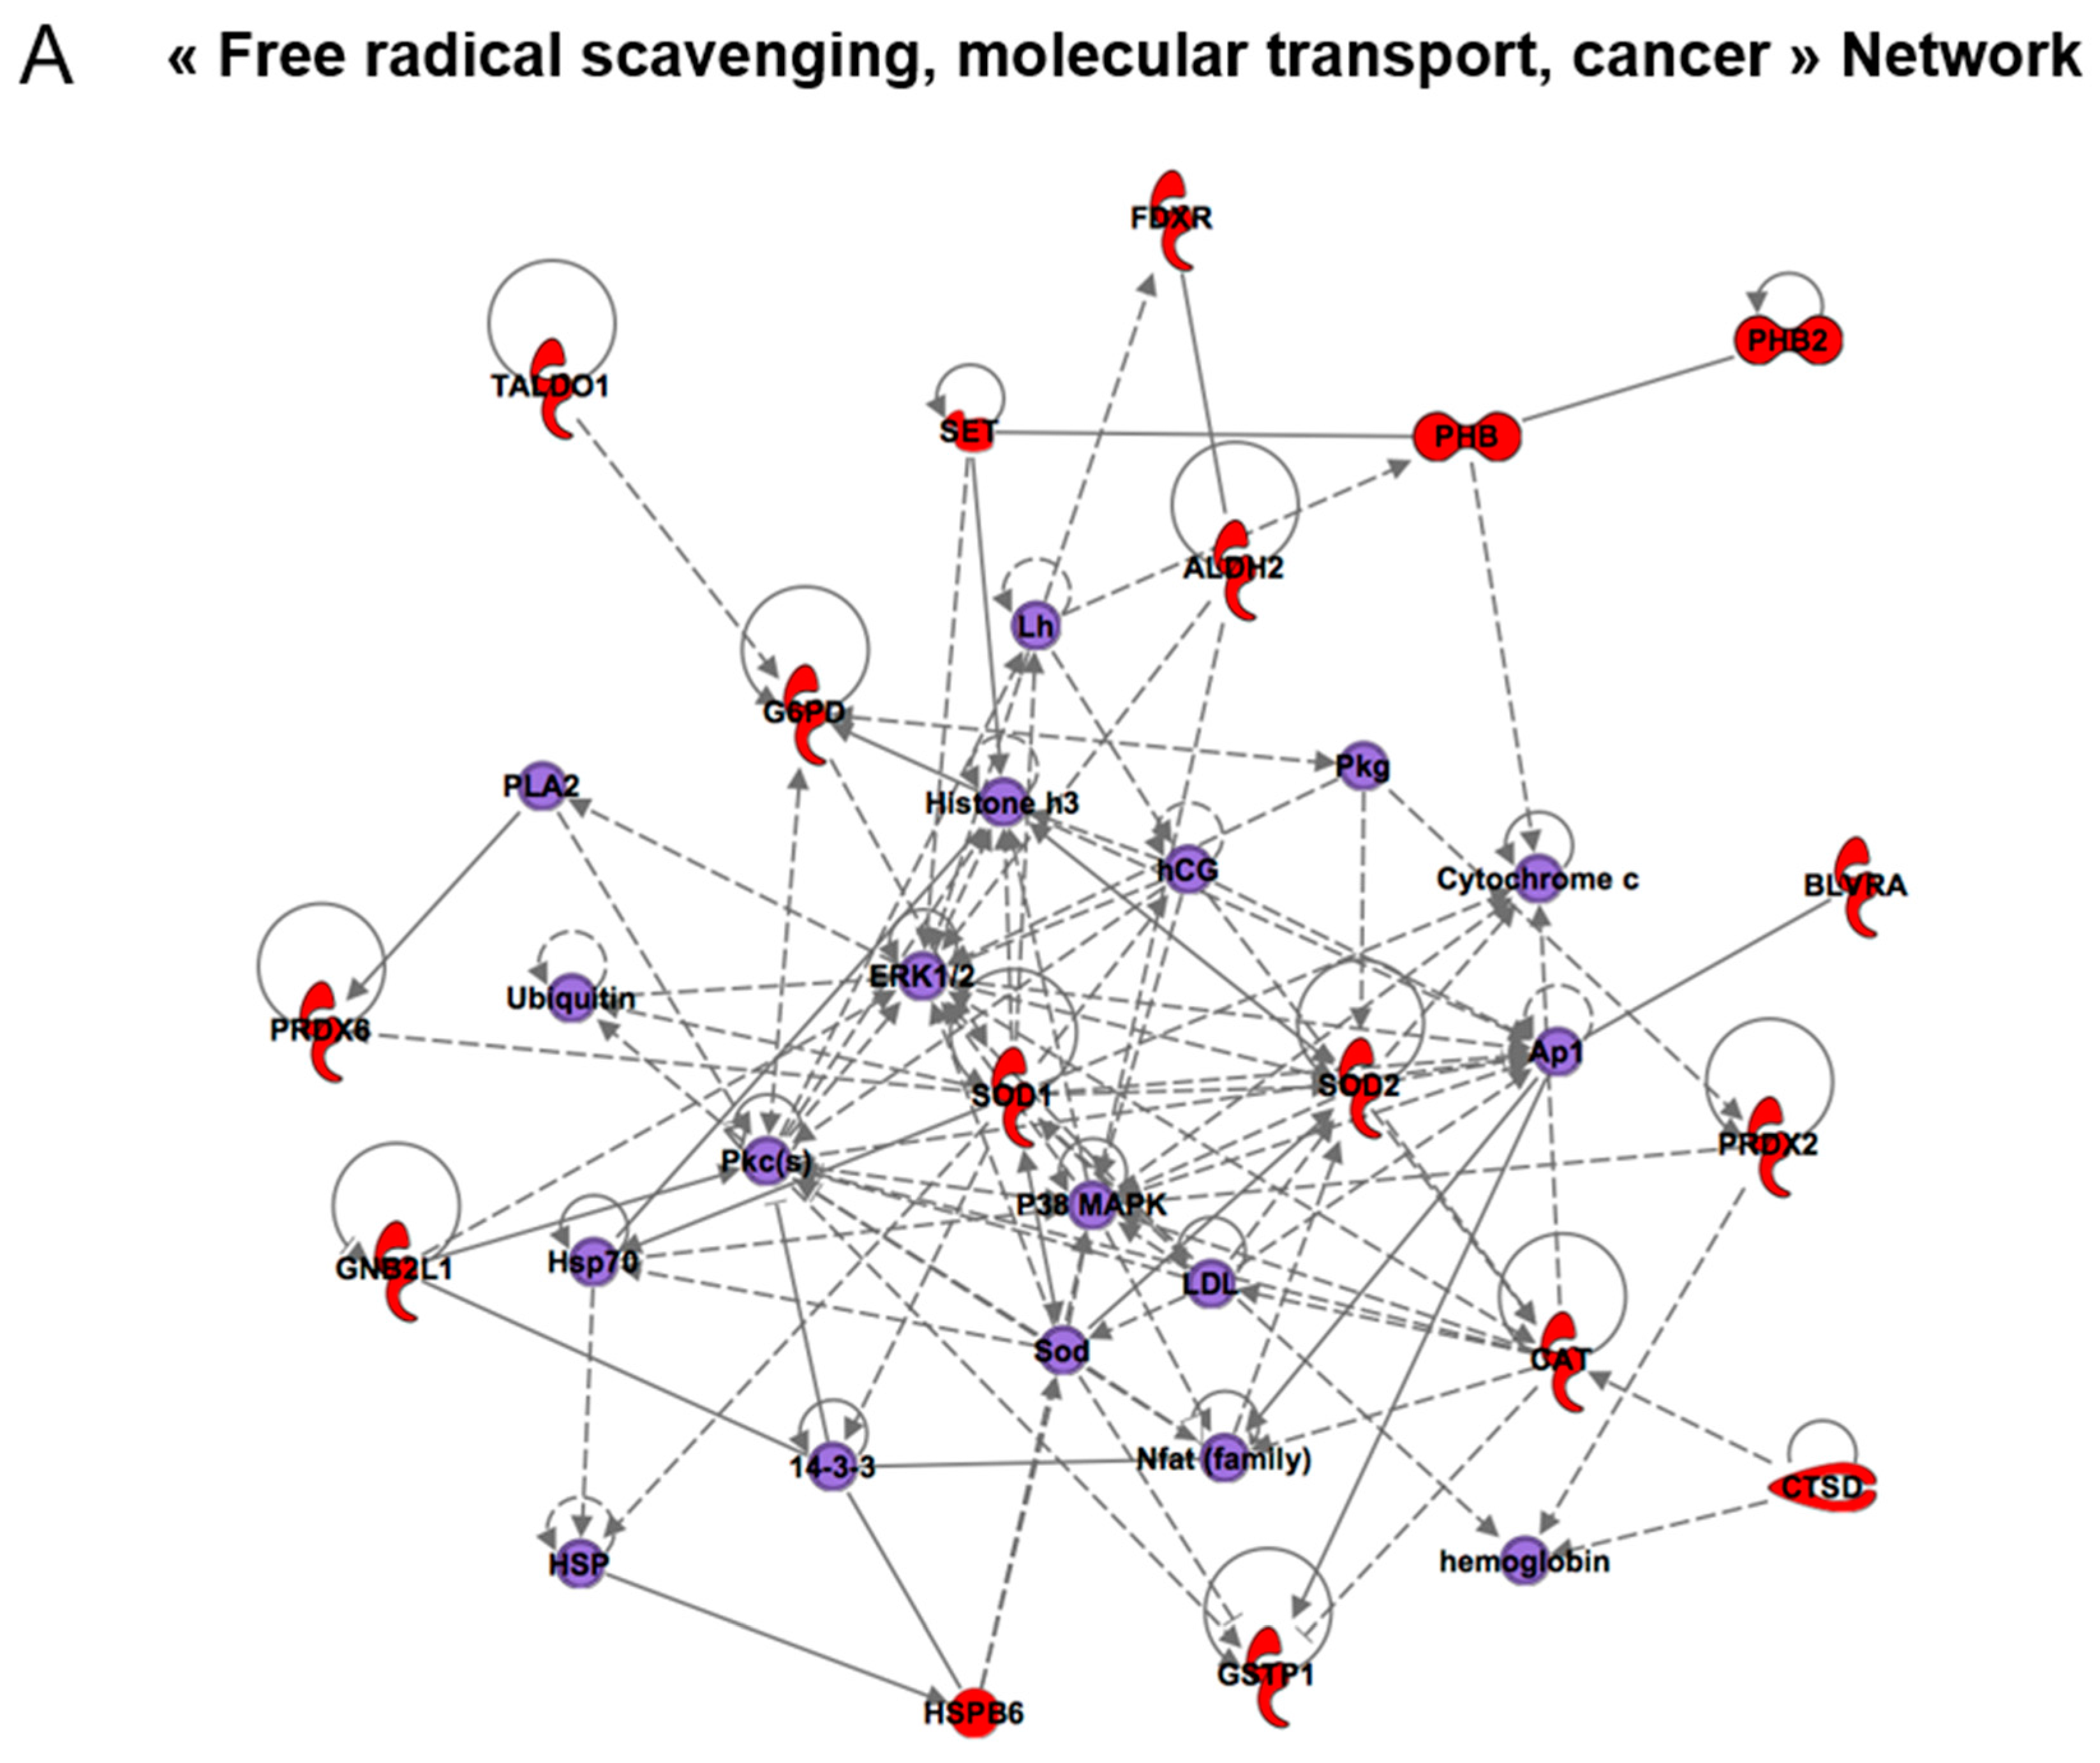
| Free radical scavenging, molecular transport, cancer | 20 | ACTA1, ACTG1, ANXA1, ANXA5, CASP8AP2, CTSD, FDXR, HSPB1, LMNA, PHB2, PHB, PRDX2, PRDX6, PSMD14, SMS, SOD1, SOD2, STRAP, TRAP1, VIM | 14-3-3, 26S Proteasome, caspase, CD3, Cytochrome c, estrogen receptor, F actin, glutathione peroxidase, hemoglobin, Insulin, Lh, NFkB (complex), Rb, Ubiquitin |
| Developmental disorder, neurological and inherited diseases | 13 | BLVRA, EIF4A1, ETFA, GARS, GNB2L1, IMMT, PKM2, RAB11A, RCN1, TALDO1, TMEM132D, UCHL1, VSP13D | AkT, Ap1, CENPI, ERK1/2, FAM189B, FRY, FSH, Histone h3, Jnk, LEMD2, Mapk, NUDT6, P38 MAPK, PDGFB, PI3K (complex), Pkc(s), PTCD2, SLC9A6, SPRED3, UBC, USP35, USP40 |
| Cancer, neurological disease and cell signaling | 1 | CEP104 | NR2F6 |
| Network | Members | Molecules | Associated Groups or Molecules |
|---|---|---|---|
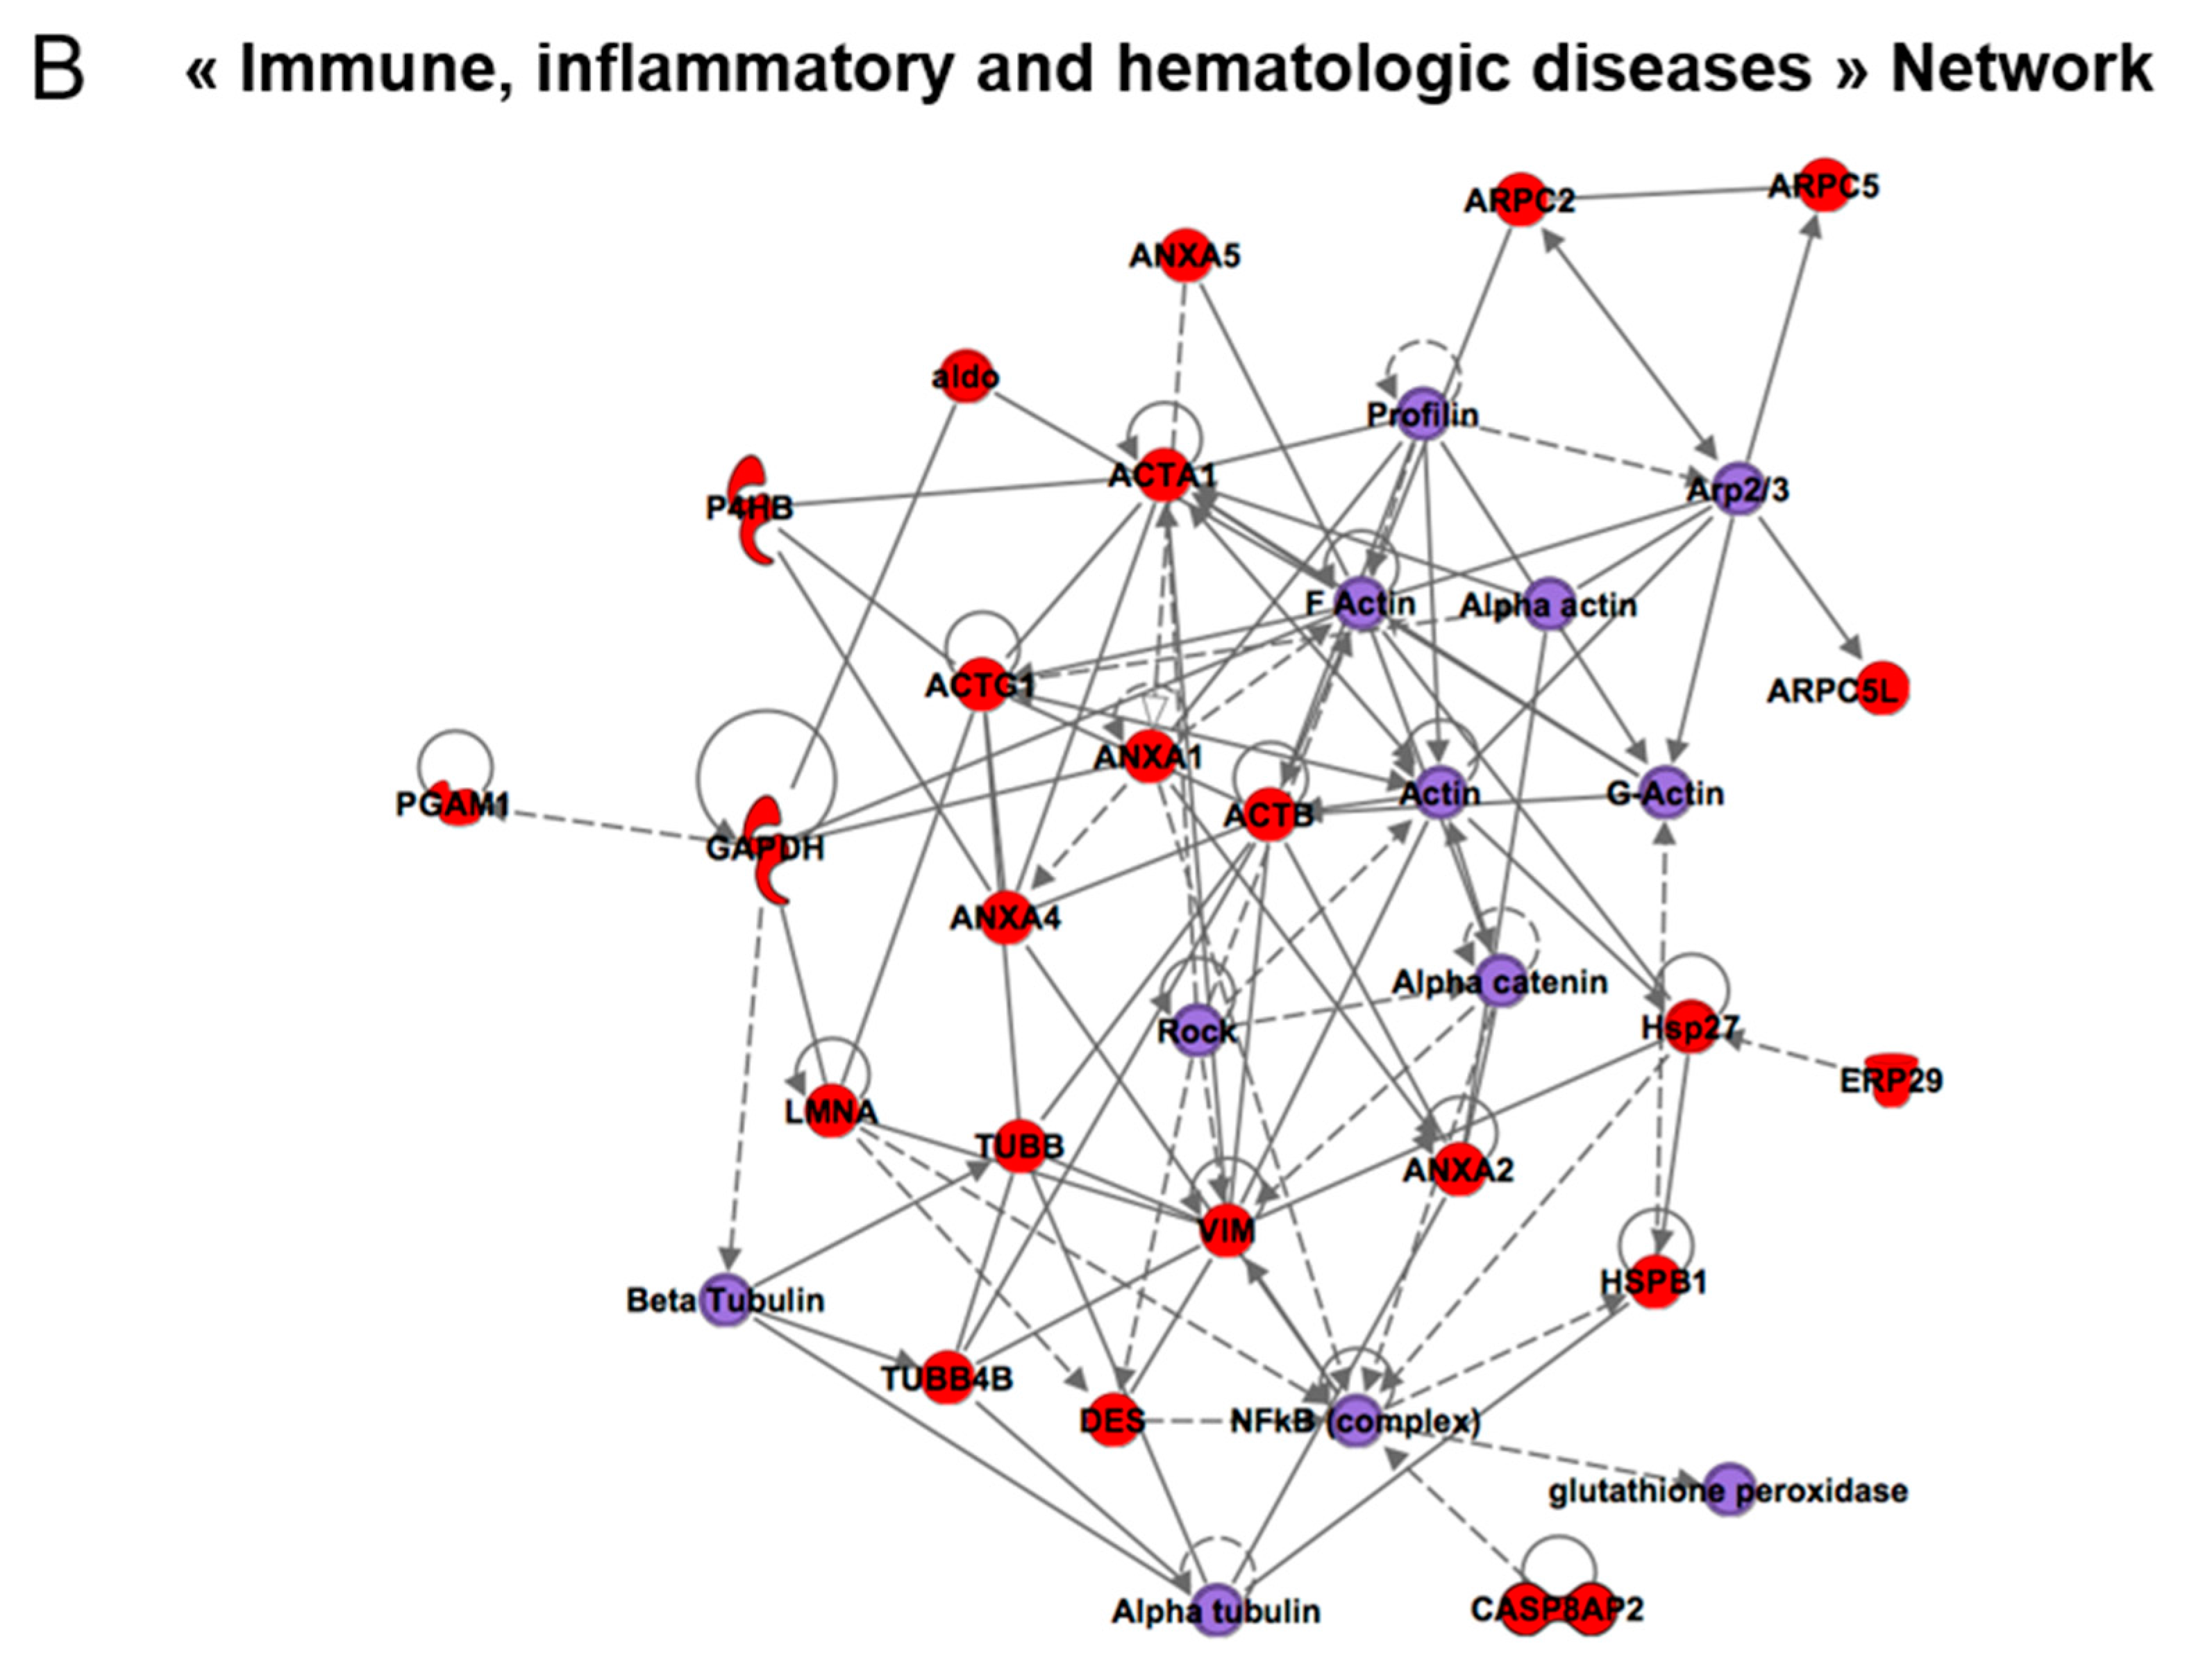
| Immune, inflammatory and hematologic diseases | 21 | ACTA1, ACTB, ACTG1, ALDH2, ANXA1, ANXA2, ANXA4, ANXA5, DES, FDXR, GADPH, LMNA, P4HB, PHB2, PPA1, RNH1, STRAP, TUBB, TUBB4B, VIM | Actin, alpha actin, alpha tubulin, Ap1, Beta tubulin, CD3, estrogen receptor, F actin, FSH, Insulin, Lh, NFkB (complex), Profilin, Rock |
| Cellular Function and Maintenance, energy production, lipid metabolism | 12 | ALDOA, BLVRA, CAT, FH, IDH1, MDH1, PEPD, PKM2, POTEE/POTEF, PSMD14, TRAP1, VPS13D | 26S proteasome, Akt, BLVRB, ERK1/2, Histone H4, IL22R1-IL10R2, INPP4B, Jnk, Jun-GABP, LEMD2, Mapk, N-arachidonylglycine, NUDT6, P38 MAPK, Pkc(s), PSME4, S100A16, SBSN, SLC26A6, SPRED3, TBCE, UBC, Ybx1-ps3 |
| Cancer, neurological disease and cell signaling | 1 | CEP104 | NR2F6 |
© 2018 by the authors. Licensee MDPI, Basel, Switzerland. This article is an open access article distributed under the terms and conditions of the Creative Commons Attribution (CC BY) license (http://creativecommons.org/licenses/by/4.0/).
Share and Cite
Hammad, G.; Legrain, Y.; Touat-Hamici, Z.; Duhieu, S.; Cornu, D.; Bulteau, A.-L.; Chavatte, L. Interplay between Selenium Levels and Replicative Senescence in WI-38 Human Fibroblasts: A Proteomic Approach. Antioxidants 2018, 7, 19. https://doi.org/10.3390/antiox7010019
Hammad G, Legrain Y, Touat-Hamici Z, Duhieu S, Cornu D, Bulteau A-L, Chavatte L. Interplay between Selenium Levels and Replicative Senescence in WI-38 Human Fibroblasts: A Proteomic Approach. Antioxidants. 2018; 7(1):19. https://doi.org/10.3390/antiox7010019
Chicago/Turabian StyleHammad, Ghania, Yona Legrain, Zahia Touat-Hamici, Stéphane Duhieu, David Cornu, Anne-Laure Bulteau, and Laurent Chavatte. 2018. "Interplay between Selenium Levels and Replicative Senescence in WI-38 Human Fibroblasts: A Proteomic Approach" Antioxidants 7, no. 1: 19. https://doi.org/10.3390/antiox7010019