Article

Pure and Modified Co-Poly(amide-12-b-ethylene oxide) Membranes for Gas Separation Studied by Molecular Investigations

1
Institute on Membrane Technology ITM-CNR, University of Calabria, 87030 Rende (CS), Italy
2
Department of Chemical Engineering and Materials, University of Calabria, Rende (CS) 87030, Italy
3
WCU Energy Engineering Department, College of Engineering, Hanyang University, Seoul 133-791, Korea
*
Authors to whom correspondence should be addressed.
Membranes 2012, 2(3), 346-366; https://doi.org/10.3390/membranes2030346
Submission received: 24 May 2012 / Revised: 5 June 2012 / Accepted: 13 June 2012 / Published: 28 June 2012

Abstract

:
This paper deals with a theoretical investigation of gas transport properties in a pure and modified PEBAX block copolymer membrane with N-ethyl-o/p-toluene sulfonamide (KET) as additive molecules. Molecular dynamics simulations using COMPASS force field, Gusev-Suter Transition State Theory (TST) and Monte Carlo methods were used. Bulk models of PEBAX and PEBAX/KET in different copolymer/additive compositions were assembled and analyzed to evaluate gas permeability and morphology to characterize structure-performance relationships.

Graphical Abstract

1. Introduction

Today membrane technology has become much more competitive in separation techniques than traditional methods, such as adsorption, cryogenic separations, distillation, etc., since it achieves improved performance at lower cost together with increased energy efficiency and lower environmental impact [1]. The successful development of highly permeable and selective membranes makes a membrane-based process a viable alternative for carbon dioxide capture and for storage of flue gas. However, there is a key technical challenge to be met: That of achieving higher permeability and higher selectivity [2]. Special attention has been paid to the use of membranes in a solubility-selective mode in recent years, obtaining preferential permeation through the membranes of more soluble gaseous species [3,4]. Polymers containing poly(ethylene oxide) units have an interesting CO2/N2 selectivity. In fact, the copolymer of the PEBAX series, formed by a rigid-semicrystalline block of polyamide (Nylon12, PA-12) covalently linked to amorphous and rubbery co-monomer poly-tetramethylene oxide (PTMO), as indicated in Scheme 1, is very close to the upper bound [2] owing to its high selectivity for polar/non-polar gases. PEBAX-based polymers have been studied extensively in the past decade for membrane-based gas and vapor-separation uses [5,6,7]. A successful strategy for improving CO2 and water vapor permeability is the addition of selective polymeric additives to this matrix polymer. Adding organic molecules with different chemical structures to a polymer matrix generally implies a modification of the system morphology, the chemical composition and even the physico-chemical properties change, influencing the transport through the membranes [8,9,10].
Scheme 1. Molecular Structures of PEBAX chain repeat unit and N-ethyl-o/p-toluene sulfonamide (KET) modifier.
Membranes 02 00346 g009
Previously, the effects of the addition of N-ethyl-o/p-toluene sulfonamide (KET) molecules on the gas permeation properties were investigated [11,12,13,14,15,16,17]. A clear trend of the influence of additives on gas permeability was observed: The gas transport properties of PEBAX improved with increasing additive concentration up to a certain value. On the basis of previous studies, interactions between KET fillers and polymer chains (Scheme 1) were studied resulting in the identification of the effective distribution of molecular compounds at a nanometric level. Also, interactions between the PEBAX matrix and chemical additives KET were investigated at various concentrations in the PEBAX/KET membranes. How modifications in the structure at fully atomistic level affect the resulting transport properties of the membranes is the subject of this paper. Modeling of transport of individual penetrant molecules provided a deeper understanding of the correlations between transport and structural features of the polymeric membrane materials [18,19,20,21,22,23]. Based on a given chemical architecture, a novel synthetic polymer can theoretically be developed and scrutinized for its utility as a separation medium. This concept offers enormous potential for development in the material sciences. This fact, coupled with increasing computational power and efficiency, allows macromolecular design to be brought to a wider range of users. However, there are still some challenges that must be overcome in the use of molecular simulation as a tool for membrane design, e.g., accurate and robust force field development, and the preparation of “correct” packing models, are challenges currently being addressed. As a contribution to this end, grand canonical Monte Carlo (GCMC) and molecular dynamics (MD) simulations are undertaken in this investigation, in conjunction with the COMPASS force field, to provide estimates of the transport properties of five polyatomic gases (H2, N2, CO2, O2 and CH4) and water vapor in PEBAX. The predicted values for solubility and diffusivity are compared with experimental values gathered from previous studies [10,11,12,13] and used to assess the predictive capability of the techniques. Furthermore, several previously proposed solubility and diffusivity correlations are also assessed for their predictive capability.

2. Theoretical Section

Molecular simulations were performed using the Materials Studio (5.0) software of Accelrys, Inc. (San Diego, CA). Amorphous polymer packings were constructed using the Theodorou/Suter method [24,25] as implemented in the Amorphous-Cell module [26]. MD simulations were performed with the Discover software using the COMPASS force field [27,28]. The Materials Studio (5.0) software was run on a supercomputer (CINECA cluster, Bologna, Italy) and on PC hardware.

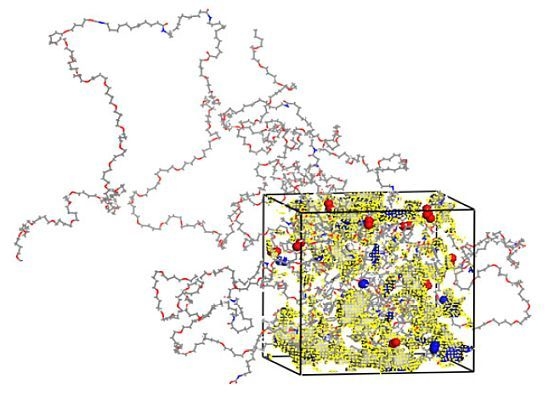
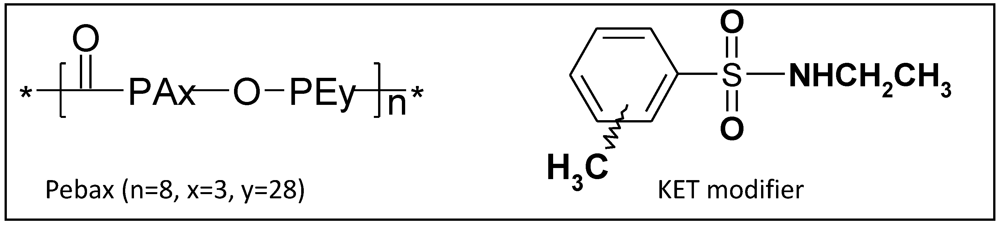
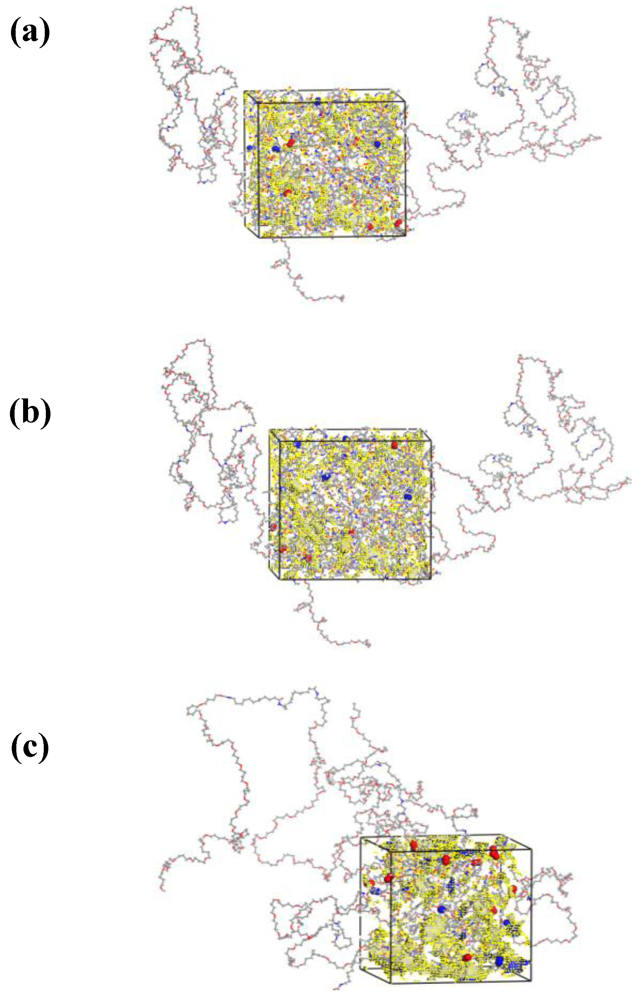
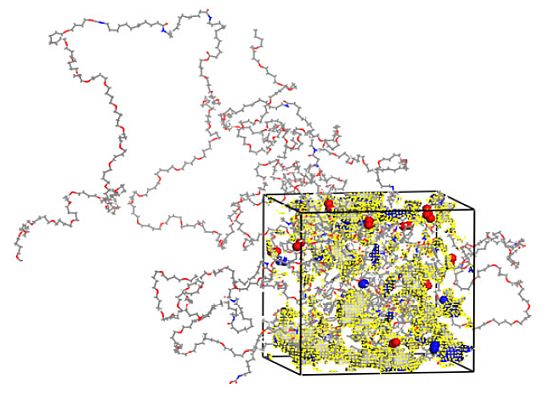
2.1. Preparation of Polymer Models

Three-dimensional boxes of PEBAX® 2533 were constructed with different KET concentrations (Figure 1).
Figure 1. 3D Equilibrated simulation models of (a) PEBAX/30 wt % KET; (b) PEBAX/50 wt % KET; (c) PEBAX/70 wt % KET. The region of free volume inside the systems is colored in yellow.
Membranes 02 00346 g001
The applied basic techniques of packing and equilibration are described in detail elsewhere [15]. Single chains of the copolymer PEBAX® 2533 were constructed by alternating co-monomers of polyamide-12 (PA-12) and poly-tetramethyleneoxide (PTMO) according to the experimentally observed weight percentages of 20 wt % of PA-12 and 80 wt % of PTMO [29,30]. A co-polymer chain of eight co-monomer units, with 24 units of PA-12 (888 atoms) and 224 units of PTMO (2912 atoms) was used as a template chain for the adjacent initial packing with the Amorphous Cell module. In every packing model each polymer chain was grown, one after the other, under periodic boundary conditions at 308 K and at an initial density of about 75% of the experimental value. This procedure is commonly used to represent bulk amorphous systems and has been proven to be quite accurate in replicating the behavior of experimental polymeric systems [15,31,32].
Additionally, every simulation cell contained 600 argon molecules (randomly distributed) as obstacles to avoid ring catenation during the chain growth. KET and water molecules were also introduced in the simulation boxes. The number of molecules of KET, in the racemic ortho/para mixture of 50 wt %, was added to reach the following co-polymer/filler weight compositions: 70/30; 50/50 and 30/70 wt %. The number of water molecules corresponding to the experimentally measured amount of sorbed water in the modified membrane for different PEBAX/KET weight percentages [14] was added in each simulation box. For the chain growing the Theodorou-Suter method was applied, as mentioned above. The Argon molecules were removed in three stages and after each removal, cycles of energy minimization and NVT dynamics (the canonical NVT ensemble is characterized by a constant number of molecules N, volume V and temperature T) were conducted according to the downscaling procedure [20]. After removing the obstacle molecules, the equilibration of the packing models was carried out in the following sequence of simulation steps: (i) 50 ps NVT-MD simulations at 600 K (a simulated annealing); (ii) 20 ps NVT-MD simulations at 308 K (back to target temperature); (iii) 20 ps NPT-MD at 308 K and 10 bar with a time step of 0.1 fs (for the first time volume fluctuations are allowed in the system); followed by (iv) 500 ps NPT-MD at 308 K and 1.0 bar with a time step of 1.0 fs; and (v) a long continuative NPT-MD simulation with the same conditions over 7 ns (all). For the system containing water molecules the duration was 5 ns. The final densities of the three packing models are given in Table 1. The density values of the experimental PEBAX/KET membranes are all at 1.0 g/cm3. As can be seen by comparison with Table 1 they agree with the experimental density. Figure 1 shows the three final packing models where the amorphous structure of the cubic boxes can be clearly seen.
Table 1. Properties of the atomistic packing models for three samples of PEBAX/KET at different compositions. DP is the degree of polymerization.
ModelDP (–)N Atoms (–)N KETDensity, ρsimul.(g/mol)Cell length (Ǻ)
PEBAX/KET 70/30 + 10 CH4 + 10 CO2I BOX85102460.868039.00
II BOX85102460.888838.69
III BOX85102460.888338.70
PEBAX/KET 70/30 + 10 H2 + 10 O2 + 10 N2I BOX85082460.892938.64
II BOX85082460.892538.66
III BOX85082460.892138.65
PEBAX/KET 50/50 + 10 CH4 + 10 CO2I BOX866621060.941242.32
II BOX866621060.941942.31
III BOX866621060.943242.29
PEBAX/KET 50/50 + 10 H2 + 10 O2 + 10 N2I BOX866421060.946942.24
II BOX866421060.946042.26
III BOX866421060.947242.24
PEBAX/KET 30/70 + 10 CH4 + 10 CO2I BOX8103542481.047348.34
II BOX8103542481.046548.36
III BOX8103542481.046948.35
PEBAX/KET 30/70 + 10 H2 + 10 O2 + 10 N2I BOX8103342481.048348.33
II BOX8103342481.049048.32
III BOX8103342481.049448.32

2.2. Calculation of Diffusion Coefficients

In order to enhance the sampling efficiency ten gaseous molecules of the same kind were inserted into each polymer structure and then the polymeric boxes were equilibrated. Diffusion coefficients were calculated from the slope of the plots of the mean square displacements of gases versus time using the Einstein relation:
Membranes 02 00346 i005
where Membranes 02 00346 i006 is the number of diffusing molecules of type α, Membranes 02 00346 i007 and Membranes 02 00346 i008 are the initial and final positions of molecules (mass centres of particle i) over the time interval t, and Membranes 02 00346 i009 is the mean square displacement (MSD) averaged over the possible ensemble. The Einstein relationship assumes a random-walk motion for the diffusing particles [33].

2.3. TST Method

The transition-state theory (TST) is a well-established methodology for the calculation of the kinetics of infrequent events in numerous physical systems [34,35]. These calculations are at the same time a second validation criterion (after the density) for the quality of the developed packing models. With the help of an existing software tool [36] we calculated diffusion coefficients (D) of small molecules in polymer matrices, their solubility coefficient (S) in the matrix, and the respective permeability (P = D × S). According to the TST method the gas transport mechanism across a dense polymer system is described as a series of activated jumps. For each transition a “reaction trajectory”, leading from a local energy minimum to another through a saddle point in the configuration space, is tracked and the transition rate constant is evaluated.
First, the free energy to insert a gas molecule in the polymer packing is calculated for all points on a three-dimensional (3-D) grid spacing laid over the packing cell. These data are then used to identify minimum energy insertion sites (“holes”) and to determine transition probabilities from site to site. The penetrant molecules were represented by united atom spheres with the PCFF parameters given in Table 2.
Table 2. Physical properties of six permanent gases used in the experimental and theoretical characterization.
GasCritical Temperature (K)aLennard-Jones Diameters dLJ (Ǻ)ε (KJ·mol−1)
H233.22.930.307
O2154.63.460.980
N2126.23.6980.790
CO2304.24.001.881
CH4190.63.8171.231
H2O647.13.1660.650
a Critical temperature is a common measure of penetrant condensability. Penetrant solubility in typical polymers increases with increasing penetrant condensability [37].
Gusev and Suter set up the original TST method [34] taking into account the thermal vibrations of the polymer matrix [35,38] with the assumption that the polymer atoms execute uncorrelated harmonic vibrations around their equilibrium positions to accommodate the guest molecules. These assumptions may be considered valid only for the diffusion of small gas molecules such as (He, O2, N2, CH4); it is not appropriate for larger molecules (CO2) that may force the polymer atoms in the vicinity of the penetrant to undergo substantial local relaxations to accommodate the guest molecule. Once the corresponding jump probabilities are determined, the trajectory of the penetrant molecules are calculated by a Monte Carlo (MC) type procedure and the diffusivity is extracted from the slope of the mean square displacement (MSD) versus time at long times, when Fickian diffusion is established.

2.4. Calculation of Solubility Coefficients

The solubility coefficients, S, were obtained from grand canonical Monte Carlo (GCMC) simulations by fitting the sorption isotherm obtained from every simulated box to a straight line through the origin and taking the slope to be the solubility coefficient. In this procedure, a Metropolis [39] algorithm is used to accept or reject an insertion and deletion of a sorbate molecule.
The probabilities of addition and deletion of a sorbate molecule are given as:
Membranes 02 00346 i010
where U is calculated from the sum of non-bonded (i.e., Coulombic and van der Waals interaction) energies, Ns is the number of sorbate molecules. The addition is accepted if the energy change ∆U, is negative or if the Boltzmann factor is greater than a random number generated between 0 and 1.
The solubility coefficient S, is then obtained from the slope of the sorption isotherm as:
Membranes 02 00346 i012
where c is the sorbed gas concentration and p is pressure; S is expressed in units of (cm3 (STP)/cm3 polymer).
Isotherms were determined for five gases at six pressures over a pressure range from 0.05 atm to 0.3 atm using the SORPTION module [26]. At each pressure, 106 steps of GCMC calculations were performed using an initial equilibration period of 5000 steps. The charge interaction was considered and the non-bond cut-off was set to 12 Å. The GCMC solubility coefficient of each gas at infinite dilution was computed by fitting the sorption isotherm obtained from every simulated box to a straight line through the origin and taking the slope to be the solubility coefficient.

2.5. Pair Correlation Functions: (RDF) Analysis

The pair correlations functions gAB(r) [33] were used for evaluating the relative positions of selected atoms, molecules or chemical groups in our systems at microscopic scale. gAB(r) represents the probability of finding a pair of particles AB at a distance r (dr) normalized with respect to the probability expected for a completely random distribution at the same density.
gAB(r) are evaluated as:
Membranes 02 00346 i013
where A and B represent two kinds of particles. The system has a volume V and contains NA particles of kind A and NB particles of kind B with NAB particles belonging simultaneously to both kinds.
Vectors rAi and rBj represent the position of particle i of kind A and particle j of kind B, so that Membranes 02 00346 i014 is the distance between those two particles. The term Membranes 02 00346 i015 in Equation 4 is set to unity when Membranes 02 00346 i016dr (i.e., the difference between the desired and the actual distance among the two particles is smaller than a tolerance factor dr) and to zero otherwise.

2.6. Atom Volumes & Surfaces

The Atom Volumes & Surfaces of the MS software [26] tool creates a field that contains values of some distance functions, such that isosurfaces of that field characterize the geometry and solvent interaction of an atomistic structure in a variety of ways. Thus, atom volume fields and atom volume surfaces are specialized versions of the equivalent general-purpose volumetric objects. Once these objects have been created using the Atom Volumes & Surfaces tool, the resulting atom volume fields and surfaces are displayed on the Analysis tab of the Atom Volumes & Surfaces dialog. The first volumetric object displayed in the tree view is named the Atom Volumes Field. For the Connolly task, this is a field whose value at each point in space corresponds to the depth in the nearest Connolly probe of a given radius, as it rolls over the van der Waals surface of the atomistic structure [40].

3. Results and Discussion

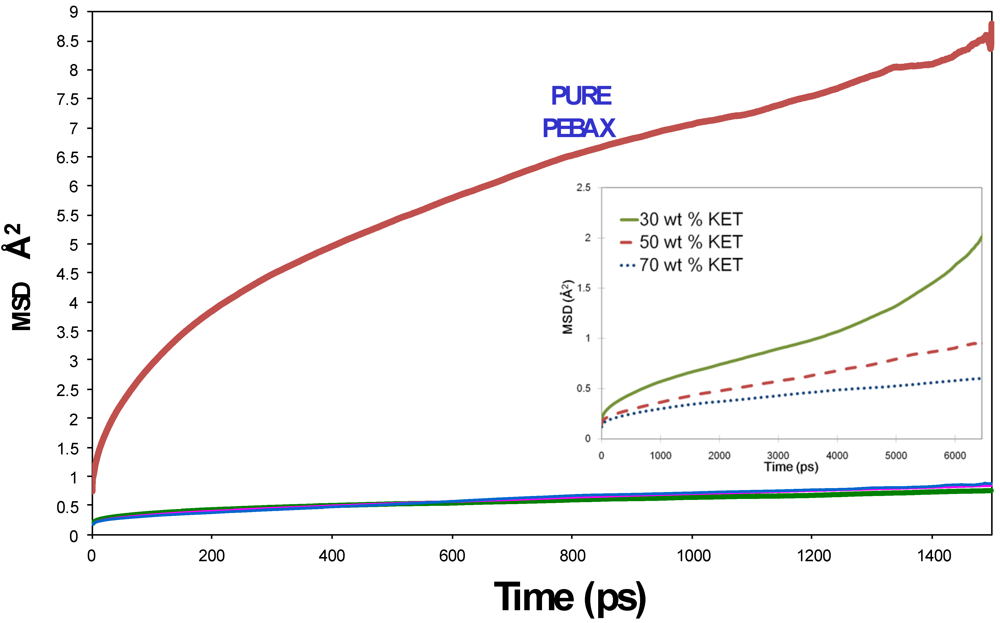
3.1. Morphological Investigations: Chain Mobility

In a previous work fully atomistic and experimental investigations of the microstructure in a poly(ether-b-amide) membrane containing the amphiphilic sulphonamide, KET, were performed [17] giving information on the compatibility between KET and PEBAX, and the presence of nanoclusters of KET inside the matrix. At different KET composition modeling, DSC and IR analyses indicated that PEBAX matrixes show some segregation phenomena with subclusters of KET molecules, also at low compositions. How the presence of nanometric-sized KET clusters modifies the transport properties is the aim of this work. In order to investigate the general effect induced by the presence of KET in the polymer structure, we analyzed the motions of the atoms of the polymer chain in the pure and modified PEBAX membranes. The displacements of the polymer chain were calculated by performing dynamic runs on the NPT ensemble on the equilibrated 3D models of pure PEBAX (time of simulation = 1.5 ns) and at different KET compositions (time of simulation = 7 ns); the polymer mean squared displacements curves (MSD) vs. time of simulation are shown in Figure 2.
Figure 2. Polymer chain mean squared displacements curves (MSD) in pure PEBAX (time = 1.5 ns) and PEBAX/KET models (time = 7 ns).
Membranes 02 00346 g002
The MSD curves indicate that the mobility of the atoms of pure PEBAX is greater than that of PEBAX/KET systems, indicating that the presence of KET reduces the mobility of the PEBAX chain. The global effects lead to more rigid and packed structures compared with the pure PEBAX. In PEBAX/KET systems, mainly owing to the bulky aromatic structure and partial double-bond character of the amide linkage of KET molecules, the overall stiffness of the mixed systems gave rise to a reduced mobility of the chains, confirming the reduced rotational freedom of KET observed experimentally with IR spectra [10]. It is also interesting to note that the decrease of chain mobility of 70 wt % KET was examined by DSC [10,13] and by hydrogen bonding analysis, between the sulphonamide moiety and the pseudo-stacked orientation of the aromatic rings of KET [17].

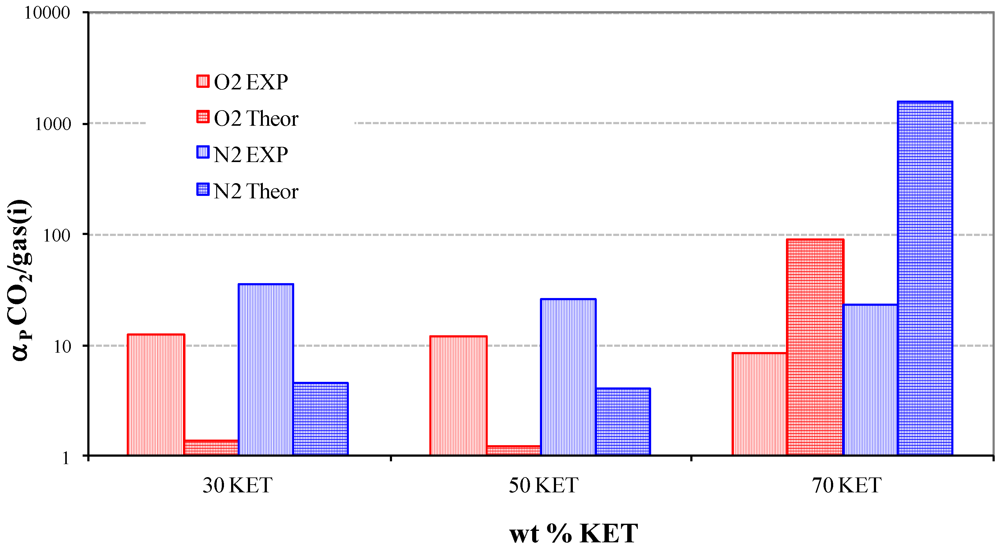
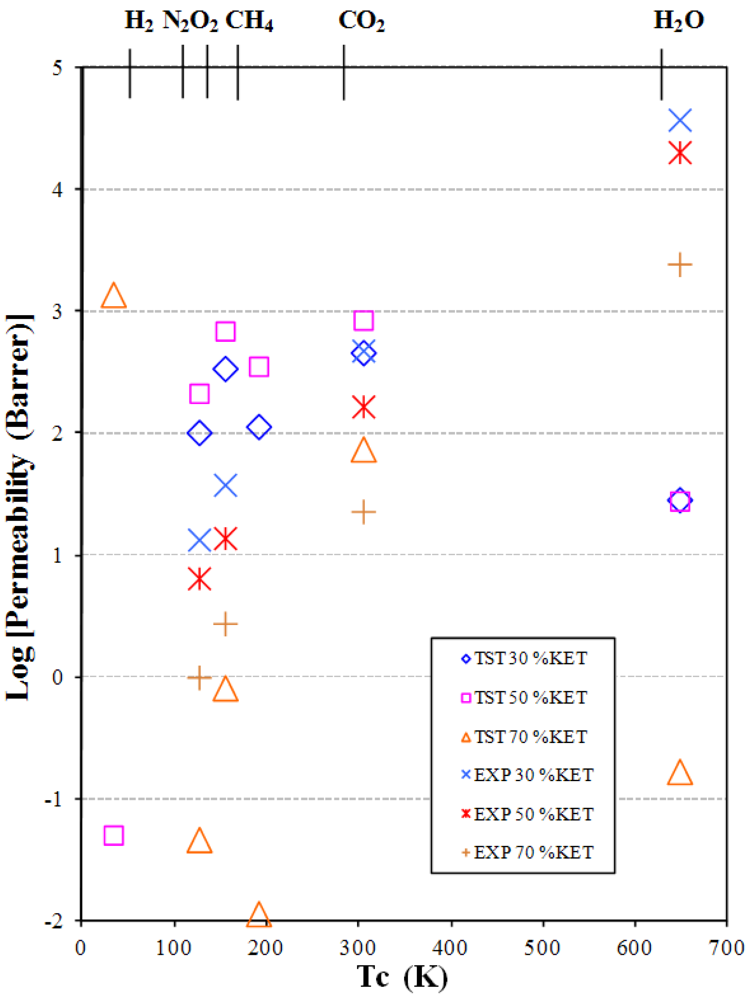
3.2. Gas and Vapor Permeability

The reliability of the equilibrated PEBAX/KET models at different additive compositions (30 wt %, 50 wt %, 70 wt %) was also tested by comparing simulated permeability coefficients of five gas molecules, H2, O2, N2, CH4 and CO2 and water vapor with experimental data already available from Gugliuzza et al., [10,11,12]. Table 3 summarizes the theoretical transport parameters and the available experimental values for PEBAX/KET systems in different compositions. Equilibrated amorphous cells were used in order to estimate the diffusion coefficients using direct molecular dynamics and TST calculations, and the solubility coefficients with Grand Canonical Monte Carlo (GCMC) and TST calculations.
The results of the permeability coefficients [P, [cm3 (STP)/(cm2·s·cm Hg)] × 10−10] vs. critical temperatures (Tc) are shown in Figure 3.
Figure 3. Transition-state theory (TST) calculated and experimental permeability data in modified PEBAX/KET models.
Membranes 02 00346 g003
Table 3. Theoretical and experimental data: permeability, diffusion and solubility coefficients of PEBAX/KET membranes.
GasTST Permeability coefficient, P barrer aEXP Permeability coefficient, P barrer aTST Solubility coefficient, S (cm3STP/cm3·cm Hg)GCMC Solubility coefficient, S (cm3STP/cm3·cm Hg)EXP Solubility coefficient, at 25 °C, S (cm3STP/cm3·cm Hg)TST Diffusion coefficient, D (cm2/s) × 10−6MD Diffusion coefficient, D (cm2/s) × 10−6EXP Diffusion coefficient, D (cm2/s) × 10−6
PEBAX/30KETH22.35 × 10−34.27 × 10−31.5 × 10−35.5 × 10−5444.40
CO2461.71480.000.430.29330.0470.113.33 × 10−41.021
O2342.1138.090.0382.6 × 10−30.880.64
N2102.1613.520.0264.8 × 10−30.380.41
CH4114.330.0970.1280.120.017
H2O28.703.75 × 1040.570.2227.935.090.0070.473
PEBAX/50KETH20.0520.003433.42 × 10−31.5 × 10−4364.3
CO2852.37167.000.51820.61150.0560.161.16 × 10−40.298
O2694.0813.920.04282.6 × 10−31.622.038
N2214.216.520.03006.8 × 10−30.7131.652
CH4356.580.11460.17930.313.33 × 10−3
H2O28.002.033 × 1040.630.2388.904.460.0120.228
PEBAX/70KETH21388.160.002760.002110.55174.30
CO274.9323.000.29780.18780.0390.0253.3 × 10−50.059
O20.8242.770.03060.00342.7 × 10−30.095
N20.0471.0040.01980.00742.3 × 10−44.5 × 10⁻³
CH40.0120.08300.73681.4 × 10−51.67 × 10⁻⁴
H2O0.1724550.570.2942.292.975.00 × 10−40.107
a 1 barrer = 10−10 cm3STP cm/(cm2·s·cm Hg)
Two items of information can be obtained:
(1)
The permeability increases as the additive concentration decreases.
(2)
The permeability increases from small non-polar gases to larger and polar ones.
The first trend, i.e., increasing polymer matrix polarity due to the introduction of KET additives decreases the permeability to all penetrants, could be related to the increased rigidity of the structure, which means a decreased mobility of the chains.
Generally in the separation of CO2 from small gas molecules, if one considers the diffusivity selectivity based on size, the diffusivity of small gases will always be greater because of their smaller kinetic diameter, and therefore higher than that of CO2 (Table 2). This tendency is visible for experimental data with membranes with 30% KET showing a higher value than 50% and 70%. The theoretical trend is a little different: Fifty percent KET has the highest value, greater than 30% and 70% for which there is a drastic reduction. The second consideration is validated by the fact that membranes based on PTMO80/PA-12 have high permeation values, as the penetrant species is a gas with high condensability characteristics, that is, a gas with a high critical temperature and high polar/non-polar gas selectivity. For CO2 and water the permeability errors of ±10.00 and ±7.4 were estimated, respectively. These indicate the limitation of these types of simulation for condensable gases. The sorption capability of a gas is generally a function of the condensability of the component to be separated. Since CO2 is more easily condensed than H2, O2, N2, as evidenced by its much higher critical temperature (Table 2), the solubility of CO2 in the polymer tends to be greater than that of small gas molecules. Experimental values of the permeabilities follow this tendency: CO2 and water exhibit the highest values. Theoretical data of O2, N2, CO2 follow this trend (but are overestimated for the models with 30 wt %, 50 wt %). Greater deviations are found for H2O, H2 and CH4. H2O values are downscaled by some orders of magnitude in comparison with the real ones. H2 and CH4 are exceptions for the first 70% KET exhibiting the highest value and the second the lowest value of permeability, but no comparison with experimental data for H2 and CH4.
For water we can explain this behavior better, finding relations with our previous paper [17] where we analyzed the effect of KET on the morphology of PEBAX. We know that segregation phenomena have been found and that KET seems to prefer a migration toward polar moieties of the polymer chain, suggesting a progressive saturation of hydrophilic sites of the polymer (i.e., hard polyamide, PA, and soft poly-tetramethyleneoxide, PTMO) with a rising loading of filler. Theoretical selectivity permeability α(CO2/N2) and α(CO2/O2) in modified PEBAX/KET membranes were compared with the experimental data (Figure 4). The experimental α(CO2/O2) is almost constant. Interestingly, the experimental data points of α(CO2/N2), with the exception of 50% KET, are near the upper bound limit of Robeson [2]. The theoretical data are lower than the experimental ones for PEBAX/KET with 30% and 50%. An increase in selectivity is shown when the concentration of KET reaches 70%. In those cases the theoretical values are higher than the experimental ones. Theoretically the selectivity is highest when the KET concentration increases.
Figure 4. Selective permeability α(CO2/N2) and α(CO2/O2) in modified PEBAX/KET systems.
Membranes 02 00346 g004

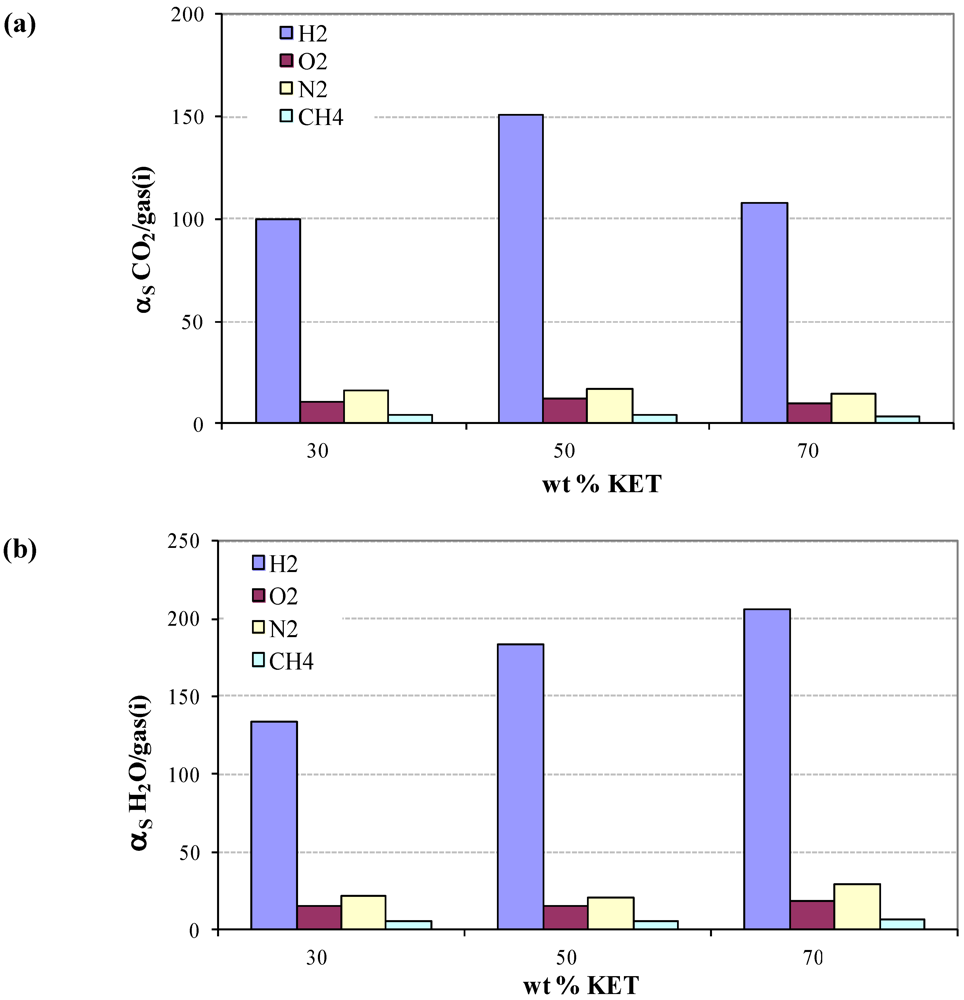
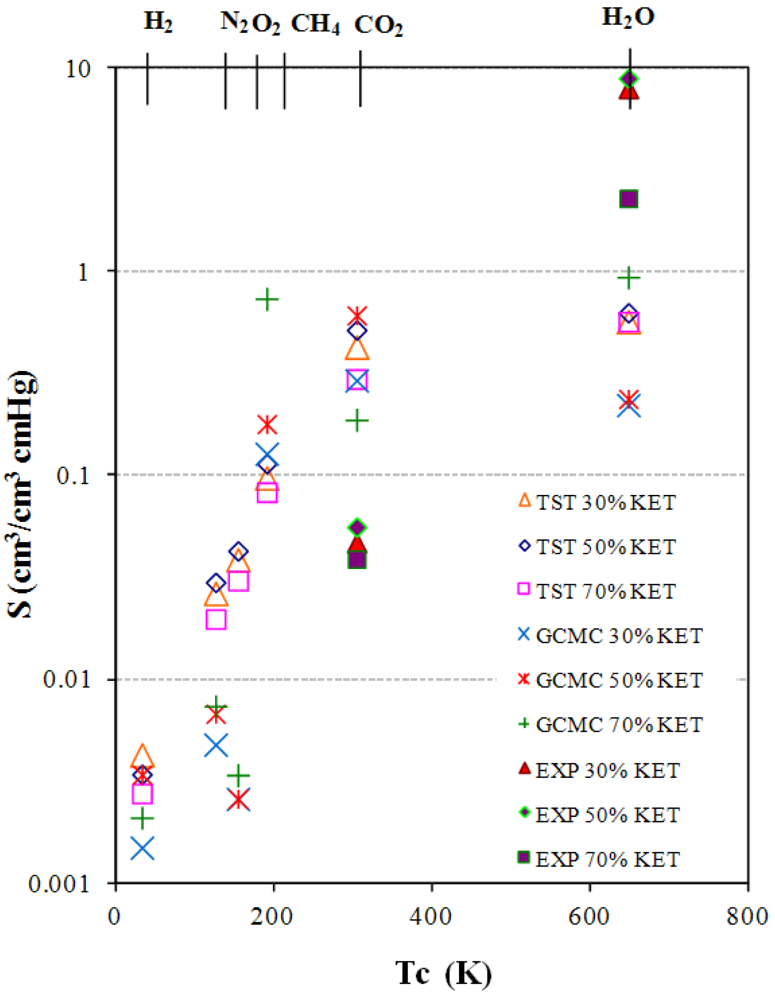
3.3. Solubility coefficients

Experimental solubility (S) is determined by the measured permeability and diffusivity under the assumption that the solution-diffusion mechanism is obeyed (S = P/D) [41].
It is known that the addition of KET allows the performance of the traditional polymer “PEBAX” to change, i.e., the water vapor permeability was influenced by the concentration and hydrophilicity of the additives [10]. It is interesting to see what happens in theory.
Theoretical gas solubility coefficients were obtained by using the TST and the GCMC simulation methods. Errors were found in a range of 0.001 to 0.005. The critical temperature of the probe gas was used as a measure of molecular interaction [37]. From a theoretical standpoint, the critical temperatures of the probe gases studied can be considered to be a measure of van der Waals interaction between molecules. A higher critical temperature corresponds to a greater van der Waals interaction. Solubility increases with increasing condensability of the penetrant species, the penetrants with higher critical temperature being more condensable and, therefore, more soluble, especially in membranes bearing groups with a high degree of polarity (Figure 5).
The opposite behavior was observed with regard to the permeability curves: The higher the amount of KET in the matrix the higher the solubility.
TST data follow this trend: Solubility of PEBAX 50% KET > 30% > 70% for all gases. Instead GCMC values show that solubility of 70% KET > 50% > 30%, i.e., a completely inverted behavior. Exceptions are found for theoretical data on CO2: The highest values for both TST and GCMC is that of 30% KET, followed by 50% KET and ending with 70% KET. For carbon dioxide the comparison with experimental data indicates that TST and GCMC are both bigger. This trend is opposed to that of water vapor or the theoretical solubilities (TST and GCMC), which are lower than found in the experimental data.
Also TST data for the small and non-polar gases such as H2, O2, N2 are higher compared with GCMC values for all the concentrations, but methane TST data are lower than GCMC.
Solubility is basically a thermodynamic property and an overestimation suggests a wrong assumption of an excessively high polymer-penetrant interaction.
Figure 5. TST and GCMC solubility coefficients vs. Critical Temperature (Tc) of H2, N2, O2; CH4, CO2, H2O. Experimental data are available and reported only for CO2 and H2O gases.
Membranes 02 00346 g005
The solubility coefficient of H2O obtained from both theoretical methods employed is significantly lower than the effective solubility coefficients measured. This could be explained considering the fact that for both TST and GCMC simulations it is assumed that the polymer matrix is rigid, therefore the free volume elements of the matrix are exclusively used as a sorption site of the membrane. The relatively small dimension of the boxes also does not permit a correct statistic to be reached. The water insertion necessitates a certain dilation of the polymer matrix. However, it is also possible to attribute the discrepancy to the inaccuracy of the interaction potentials, and incorrect use of the Lennard-Jones parameters in the description of a molecule such as water, which is strongly polar.
These limitations are manifested in the inability to estimate accurately the solute chemical potential when the insertion of large test particles is attempted in free volume elements with a size comparable with the molecular size, a problem referred to as the “insertion problem” by Theodorou [37,42]. From the comparison of experimental and theoretical water solubility coefficients, an acceptable agreement is observed. This occurs in spite of the intrinsic limitations of the TST and GCMC methods in evaluating the water solubility. An increase of water solubility is observed for additive concentrations up to 50 wt %, whereas it decreases for the membranes with 70% on weight of KET.
The theoretical solubility selectivity, calculated via the TST method, of carbon dioxide and water in comparison to non-polar gases show (Figure 6a,b) the same trend in all concentrations: The highest ratio is shown for hydrogen and the lower for methane.
Figure 6. Solubility selectivity of (a) CO2 and (b) H2O to non-polar gases at different concentrations of KET.
Membranes 02 00346 g006

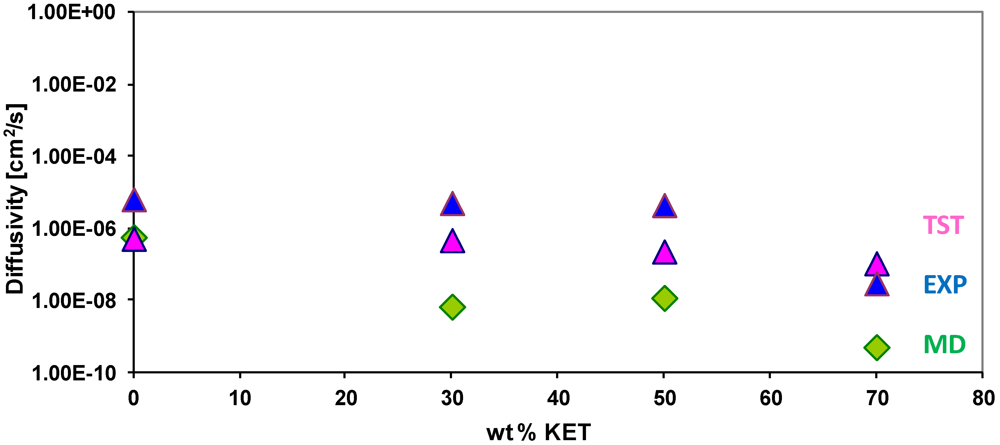
3.4. Diffusivity of Gases and Free Volume in PEBAX/KET Membranes

The self-diffusion coefficients were calculated from the slope of the mean square displacement curves of the MD runs via averaging over all simulated penetrant molecules of a given kind. A simulation time of 5 ns was considered for water and 7 ns for gases. The theoretical values are much lower than the experimental values, also when small dimension gases are simulated (Table 3). This behavior could be ascribed to: (1) Rigidity of the mixed matrix system due to the enlargement of the nano cluster size of KETs; (2) the free volume; (3) the duration of runs. Although it is 5 ns, it is not enough to reach the normal diffusion regime. This could be the major reason for the discrepancy between theoretical and experimental data. Therefore MD runs need more time. Also the TST method gives accurate values for small gas molecules, but for non-spherical polyatomic probes where consideration of penetrant shape is important, results are found to be less comparable. For those reasons the membranes containing 70% KET show worse results.
Figure 7 shows the comparison of the theoretical and experimental water diffusivity for varying PEBAX/KET compositions. From the comparison with the experimental data of Gugliuzza et al., [10,13] an acceptable agreement with the calculated diffusion coefficients is observed, taking into account the limitations of the method for calculating the diffusion coefficients. The TST method overestimates the diffusivity of H2O, and, on the other hand, MD gives a better reproduction of the experimental water diffusivity than TST only for the pure PEBAX system, because the introduction of an additive like KET with rigid aromatic rings leads to a reduction of the chain mobility, as seen in the previous section. The reason for this is the immobilization of polymer chains due to the hydrogen bond formation or steric hindrance by aromatic structures. The observed effect increases at increasing wt % KET in PEBAX membranes so the value of water diffusivity by MD is undervalued especially for the system with 70 wt % KET.
Figure 7. Experimental and theoretical diffusivity of H2O in PEBAX membrane with different wt % of KET.
Membranes 02 00346 g007
The results of MD calculations indicate a similar difficulty with polyatomic gases. The lack of accuracy in estimates for diffusivity was previously attributed to the process of potential parameter fitting [43]. It was proposed that the parameters of PCFF force field, the precursor of COMPASS, should be optimized to describe polymer morphology at the expense of accuracy in transport property prediction [43]. This may explain the lack of predictive accuracy. Despite this, these calculations are still within the “factor of three to five” accuracy typically observed in MD simulations [42].
A Connolly surface was created for the equilibrated models of PEBAX/KET at 30 wt %, 50 wt % and 70 wt %, by the atom, volumes and surface module in Materials Studio [26] using a fine grid resolution and a Connolly radius set to 1.82 Å (the kinetic radius of N2). The occupied volume (OV), the surface area (SA), the free volume (FV) and the fractional free volume (FFV) for the models at different compositions are listed in Table 4.
Table 4. The occupied volume (OV), the surface area (SA), the free volume (FV) and the fractional free volume (FFV), calculated by Atom Volumes & Surface Tool for the models PEBAX/KET at different compositions of modifiers.
wt % KETOV (Ǻ3)SA (Ǻ2)FV (Ǻ3)FFV
30504451147288730,149
506482614003109720,144
7010211517220108750,096
The occupied volume increases with the higher loading of KET and the same trend can be observed for the fractional free volume that decreases. This effect together with the increased rigidity of the polymer chains owing to the presence of KET molecules can explain the low diffusivity coefficients of gases and water vapor evidenced both at experimental and theoretical levels.

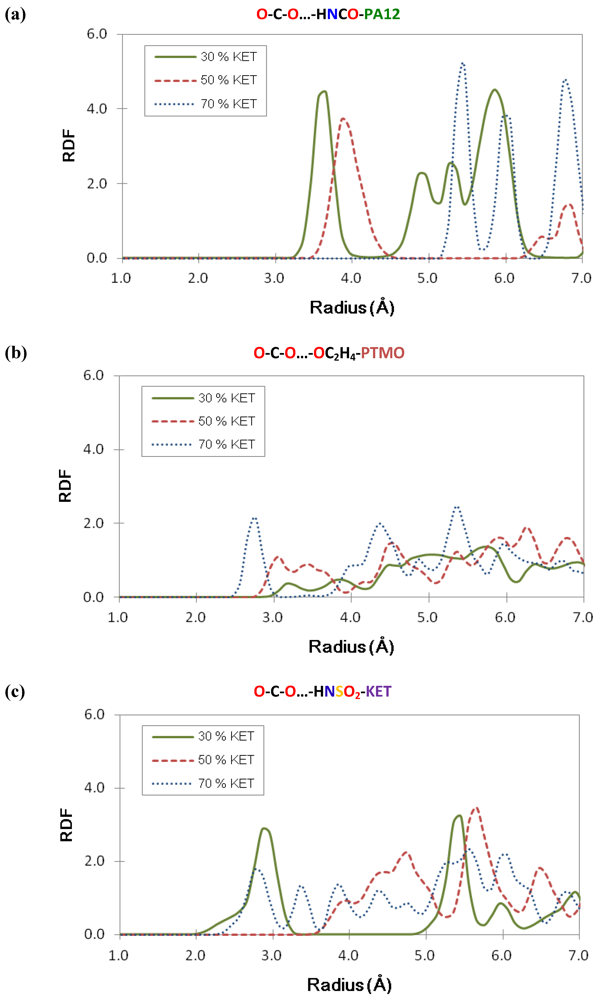
3.5. Structural Analysis: Radial Distribution Functions

The fundamental contribution to the transport of CO2 in PEBAX based membranes is given by the solubility, i.e., the interaction between the gas and the polymer matrix. For the pure PEBAX we have already found [15] that the soft block of the co-polymer (PTMO) plays the main role in the solubility of CO2.
In order to explain the high CO2 solubility, associations were investigated between CO2 and possible sites of interactions of the polymeric chains. Nitrogen atoms of amide groups, in PA-12 and oxygen atoms of PTMO block were explored by the radial distribution functions (RDF).
The calculated radial distribution functions, averaged over all atom pairs, are plotted in Figure 8, where in detail, interactions between the oxygen of CO2 and the N of the PA-12 amidic group in Figure 8a and the O of the PTMO group in Figure 8b are indicated. Also associations between CO2and KET molecules (in detail HN- of sulphonamidic group of KET) were analyzed in PEBAX/KET models.
Generally the peaks observed at distances less than 4 Å are assigned to a specific distance of the closely coupled atoms. At long distances RDF approaches unity, which is quite probable for a purely amorphous system. The peaks in Figure 8a,b indicate that CO2 seems to be associated with both the hard PA-12 and with soft PTMO blocks. Correlations are found between carbon dioxide and the amide group of PA-12 for 30% and 50% compositions of PEBAX/KET with first peaks about 3.5 Å and 4 Å while 70% is at about 5.5 Å. More in detail, from the RDF diagrams in Figure 8a, it was found that the first peaks of all membranes are shifted toward the right side while the KET wt % was increased, which suggested that in the highest KET membrane model, the CO2 tended to stay far from the PA-12. On the other hand, the interactions between PTMO and CO2 are visible, even of slight intensity. The peaks in Figure 8b are shifted to the left side while the KET content is higher, which indicates that in the KET-rich system, there is more CO2 that moves toward PTMO. This last indication is analogous to that obtained from pure the PEBAX system [15] where CO2 interacts mostly with the ether groups of soft PTMO. In a previous paper [17] the behavior of water was also analyzed: H2O prefers to stay near the soft PTMO than to the hard PA-12.
Figure 8. Radial distribution functions (RDF) between the oxygen of CO2 and (a) the N of PA-12 amidic group; (b) the O of the PTMO group; (c) the HN of the sulphonamidic group of KET in PEBAX/KET models.
Membranes 02 00346 g008
Figure 8c describes the associations between CO2 and KET molecules. The first peaks at about 3 Å for 30% and 70% compositions of PEBAX/KET while the peak of 50% is at about 4.8 Å. RDF indicate that the CO2 stays near KET when the loading is 30% and 70%.
A general remark that could be made is that polar gases and vapor through PEBAX and PEBAX/KET cross the soft PTMO moiety of the co-polymers in the surrounding area of KET clusters mainly when the KET content is higher. KET molecules assemble in clusters of nanometric dimension especially at very high concentrations with polar moieties involved in intermolecular interactions and aromatic ring in a pseudo-stacked orientation (owing to the steric hindrance of the sulphonamide moiety) [17].

4. Conclusions

In the present work the MD method is applied to a detailed investigation of gas and vapor molecules transport through the complex system of PEBAX modified with different weight percentages of KET. Different theoretical approaches suggest plausible explanations for the gases sorption and diffusion mechanisms that can be controlled according to the final utilization of modified PEBAX membranes. The theoretical data confirms the increase of permeability of all gases and of selectivity polar/non-polar gases in PEBAX/KET membranes with the exception of 70 wt % KET. An inverse relationship between permeability and concentration of KET is outlined: Permeability increases as the additive concentrations decreases. Also the permeability increases from small non-polar gases to larger and polar ones.
The opposite behavior was noted with regard to the permeability curves observed for solubility: Solubility is directly proportional to the amount of KET in the matrix, with an interesting exception of reduction of solubility when the KET exceeds 50 wt %. This known behavior has also been evidenced by simulations. For diffusion coefficients the theoretical values are much lower than the experimental values, also when small dimension gases are simulated. This is probably due to the rigidity of the mixed matrix system owing to the enlargement of the KET nanocluster size, as shown by the MSD trajectories of the PEBAX chains, but also limitations of the method reduces the readability of results. Interactions between the CO2 and PA-12 and PTMO domain of the block copolymer and between CO2 and KET molecules were analyzed by radial distribution functions, thus providing useful information about the microscopic structure of assembled modified PEBAX models.

Acknowledgments

Part of the work was financed by the EC FP6 Project “Computer aided molecular design of multifunctional materials with controlled permeability properties” (NMP3-CT-2005-013644) and by EU N 218331 “Setting up research—intensive clusters across the EU on characterization of polymer nanostructures” (NaPolyNet-FP7-NMP-2007-CSA-1) coordination and support action.

References

  1. Koros, W.J.; Mahajan, R. Pushing the limits on possibilities for large scale gas separation: Which strategies. J. Membr. Sci. 2000, 175, 181–196. [Google Scholar] [CrossRef]
  2. Robeson, L.M. The upper bound revisited. J. Membr. Sci. 2008, 320, 390–400. [Google Scholar] [CrossRef]
  3. Stern, S.A. Polymers for gas separations: The next decade. J. Membr. Sci. 1994, 94, 1–65. [Google Scholar] [CrossRef]
  4. Maier, G. Gas separation with polymer membrane. Angew. Chem. Int.Ed. 1998, 37, 2960–2974. [Google Scholar] [CrossRef]
  5. Jonquières, A.; Clément, R.; Lochon, P. Permeability of block copolymers to vapors and liquids. Prog. Polym. Sci. 2002, 27, 1803–1877. [Google Scholar] [CrossRef]
  6. Potreck, J.; Nijmeijer, K.; Kosinski, T.; Wessling, M. Mixed water vapour/gas transport through the rubbery polymer PEBAX-1074. J. Membr. Sci. 2009, 338, 11–16. [Google Scholar] [CrossRef]
  7. Liu, L.; Chakma, A.; Feng, X. Propylene separation from nitrogen by poly(ether block amide) composite membranes. J. Membr. Sci. 2006, 279, 645–654. [Google Scholar] [CrossRef]
  8. Cong, H.; Zhang, J.; Radosz, M.; Shen, Y. Carbon nanotube composite membranes of brominated poly(2,6-diphenyl-1,4-phenylene oxide) for gas separation. J. Membr. Sci. 2007, 294, 178–185. [Google Scholar] [CrossRef]
  9. Gugliuzza, A.; Clarizia, G.; Golemme, G.; Drioli, E. New breathable and waterproof coatings for textiles: Effect of an aliphatic polyurethane on the formation of PEEK-WC porous membranes. Eur. Polym. J. 2002, 8, 235–242. [Google Scholar]
  10. Gugliuzza, A.; Drioli, E. New performance of a modified poly(amide-12-b-ethyleneoxide). Polymer 2003, 44, 2149–2157. [Google Scholar] [CrossRef]
  11. Gugliuzza, A.; Drioli, E. Role of modifiers in the water vapor transport through block co-poly(amide/ether) membranes: effects on surface and bulk polymer properties. Eur. Polym. J. 2004, 40, 2381–2389. [Google Scholar] [CrossRef]
  12. Gugliuzza, A.; Drioli, E. Evaluation of the CO2 permeation through functional assembled monolayers: relationships between structure and transport. Polymer 2005, 46, 9994–10003. [Google Scholar] [CrossRef]
  13. Gugliuzza, A.; Fabiano, R.; Garavaglia, M.G.; Spisso, A.; Drioli, E. Study of the surface character as responsible for controlling interfacial forces at membrane-feed interface. J. Colloid Interface Sci. 2006, 303, 388–403. [Google Scholar] [CrossRef]
  14. Gugliuzza, A.; de Luca, G.; Tocci, E.; de Lorenzo, L.; Drioli, E. Intermolecular interactions as controlling factor for water sorption into polymer membranes. J. Phys. Chem. B 2007, 111, 8868–8878. [Google Scholar]
  15. Tocci, E.; Gugliuzza, A.; de Lorenzo, L.; Macchione, M.; de Luca, G.; Drioli, E. Transport properties of a co-poly(amide-12-b-ethylene oxide) membrane: A comparative study between experimental and molecular modelling results. J. Membr. Sci. 2008, 323, 316–327. [Google Scholar] [CrossRef]
  16. De Luca, G.; Gugliuzza, A.; Drioli, E. Competitive hydrogen-bonding interactions in modified polymer membranes: A density functional theory investigation. J. Phys. Chem. B 2009, 113, 5473–5477. [Google Scholar]
  17. De Lorenzo, L.; Tocci, E.; Gugliuzza, A.; Drioli, E. Assembly of nanocomposite PEBAX membranes: A complementary study of affinity and clusterization phenomena. J. Membr. Sci. 2012. submitted for publication. [Google Scholar]
  18. Hofmann, D.; Entrialgo, M.; Reiche, J.; Kratz, K.; Lendlein, A. Molecular modeling and experimental investigation of hydrolytically degradable polymeric biomaterials. Adv. Sci. Technol. 2010, 76, 16–24. [Google Scholar] [CrossRef]
  19. Eslami, H.; Müller-Plathe, F. Molecular dynamics simulation of sorption of gases in polystyrene. Macromol. 2007, 40, 6413–6421. [Google Scholar] [CrossRef]
  20. Heuchel, M.; Hofmann, D.; Pullumbi, P. Molecular modeling of small-molecule permeation in polyimides and its correlation to free-volume. Macromol. 2004, 37, 201–214. [Google Scholar] [CrossRef]
  21. Pavel, D.; Shanks, R. Molecular dynamics simulation of diffusion of O2 and CO2 in amorphous poly(ethylene terephthalate) and related aromatic polyesters. Polymer 2003, 44, 6713–6724. [Google Scholar] [CrossRef]
  22. Kucukpinar, E.; Doruker, P. Molecular simulations of gas transport in nitrile rubber and styrene butadiene rubber. Polymer 2006, 47, 7835–7845. [Google Scholar] [CrossRef]
  23. Meunier, M. Diffusion coefficients of small gas molecules in amorphous cis-1,4-polybutadiene estimated by molecular dynamics simulations. J. Chem. Phys. 2005, 123, 134906:1–13496:7. [Google Scholar]
  24. Theodorou, D.N.; Suter, U.W. Atomistic modeling of mechanical properties of polymeric glasses. Macromol. 1986, 19, 139–154. [Google Scholar] [CrossRef]
  25. Theodorou, D.N.; Suter, U.W. Detailed molecular structure of a vinyl polymer glass. Macromol. 1985, 18, 1467–1478. [Google Scholar] [CrossRef]
  26. Material Studio, version 5.0, Accelrys Inc.: San Diego, CA, USA, 2001.
  27. Sun, H.; Rigby, D. Polysiloxanes: Ab initio force field and structural, conformational and thermophysical properties. Spectrochim. Acta 1997, 53, 1301–1323. [Google Scholar] [CrossRef]
  28. Rigby, D.; Sun, H.; Eichinger, B.E. Computer simulations of poly(ethylene oxide): Force field, PVT diagram and cyclization behaviour. Polym. Int. 1997, 44, 311–330. [Google Scholar] [CrossRef]
  29. Technical Data Pebax® 33 Series; Atofina Chemicals, Inc.: Colombes cedex, France, 2003. Available online: http://www.arkema-inc.com/literature_techpoly.cfm?pag=105 (accessed on 25 June 2012).
  30. Rezac, M.E.; John, T.; Pfromm, P.H. Effect of copolymer composition on the solubility and diffusivity of water and methanol in a series of polyether amides. J. Appl. Polym. Sci. 1997, 65, 1983–1993. [Google Scholar] [CrossRef]
  31. Gee, R.H.; Fried, L.E.; Cook, R.C. Structure of chlorotrifluoroethylene/Vinylidene fluoride random copolymers and homopolymers by molecular dynamics simulations. Macromol. 2001, 34, 3050–3059. [Google Scholar] [CrossRef]
  32. Hofmann, D.; Heuchel, M.; Yampolskii, Yu.; Khotimskii, V.; Shantarovich, V. Free volume distributions in ultrahigh and lower free volume polymers: Comparison between molecular modeling and positron lifetime studies. Macromol. 2002, 35, 2129–2140. [Google Scholar]
  33. Haile, J.M. Molecular Dynamics Simulation; Wiley: New York, NY, USA, 1992. [Google Scholar]
  34. Gusev, A.A.; Arizzi, S.; Suter, U.W. Dynamics of light gases in rigid matrices of dense polymers. J. Chem. Phys. 1993, 99, 2221–2227. [Google Scholar] [CrossRef]
  35. Gusev, A.A.; Arizzi, S.; Suter, U.W. Dynamics of small molecules in dense polymers subject to thermal motion. J. Chem. Phys. 1993, 99, 2228–2234. [Google Scholar] [CrossRef]
  36. Gsnet & Gsdif Macros, Accelrys Inc.: San Diego, CA, USA, 1999.
  37. Yampolskii, Y.; Freeman, B.D.; Pinnau, I.; Matteucci, S. Transport of Gases and Vapors in Glassy and Rubbery Polymers. In Materials Science of Membranes for Gas and Vapor Separation; Yampolskii, Y., Pinnau, I., Freeman, B.D., Eds.; John Wiley & Sons: New York, NY, USA, 2006; pp. 1–445. [Google Scholar]
  38. Gusev, A.A.; Müller-Plathe, F.; Van Gunstern, W.F.; Suter, U.W. Dynamics of small molecules in bulk polymers. Adv. Polym. Sci. 1994, 116, 207–247. [Google Scholar] [CrossRef]
  39. Metropolis, N.; Rosenbluth, A.W.; Rosenbluth, M.N.; Teller, A.H.; Teller, E. Equation of State Calculations by Fast Computing Machines. J. Chem. Phys. 1953, 21, 1087–1092. [Google Scholar] [CrossRef]
  40. Connolly, M.L. Solvent-accessible surfaces of proteins and nucleic acids. Science 1983, 221, 709–713. [Google Scholar]
  41. Crank, J.; Park, G.S. Diffusion in Polymers; Academic Press: London, UK, 1986. [Google Scholar]
  42. Rutherford, S.W.; Limmer, D.T.; Smith, M.G.; Honnell, K.G. Gas transport in ethylene-propylene-diene (EPDM) elastomer: Molecular simulation and experimental study. Polymer 2007, 48, 6719–6727. [Google Scholar] [CrossRef]
  43. Lim, S.Y.; Tsotsis, T.T.; Sahimi, M. Molecular simulation of diffusion and sorption of gases in an amorphous polymer. J. Chem. Phys. 2003, 119, 496–504. [Google Scholar] [CrossRef]

