A Review of RedOx Cycling of Solid Oxide Fuel Cells Anode

Abstract
:Content
- Introduction
- RedOx instability
- 2.1.
- Problematic
- 2.2.
- High Temperature Nickel Oxide Reduction and Nickel Oxidation
- 2.2.1.
- Reduction of NiO
- 2.2.2.
- High Temperature Oxidation of Ni
- 2.3.
- Reduction of NiO-YSZ Cermet
- 2.4.
- Oxidation of Ni-Ceramics Composite
- 2.4.1.
- Kinetics of Oxidation
- 2.4.2.
- Homogeneous Versus Inhomogeneous Oxidation
- 2.4.3.
- Expansion during Reoxidation
- 2.4.4.
- Bending and Stresses in Half-Cell Samples (Anode Support)
- 2.4.5.
- Young’s Modulus and Strength Variation with Reoxidation
- 2.4.6.
- RedOx Expansion Limits: Mathematical Approaches
- 2.4.7.
- Electrical Conductivity versus RedOx Cycles
- 2.4.8.
- Temperature Variation during Oxidation
- 2.4.9.
- Reoxidation by Ionic Current
- 2.4.10.
- Micro and Nano-Structural Changes upon Redox Cycling
- 2.4.11.
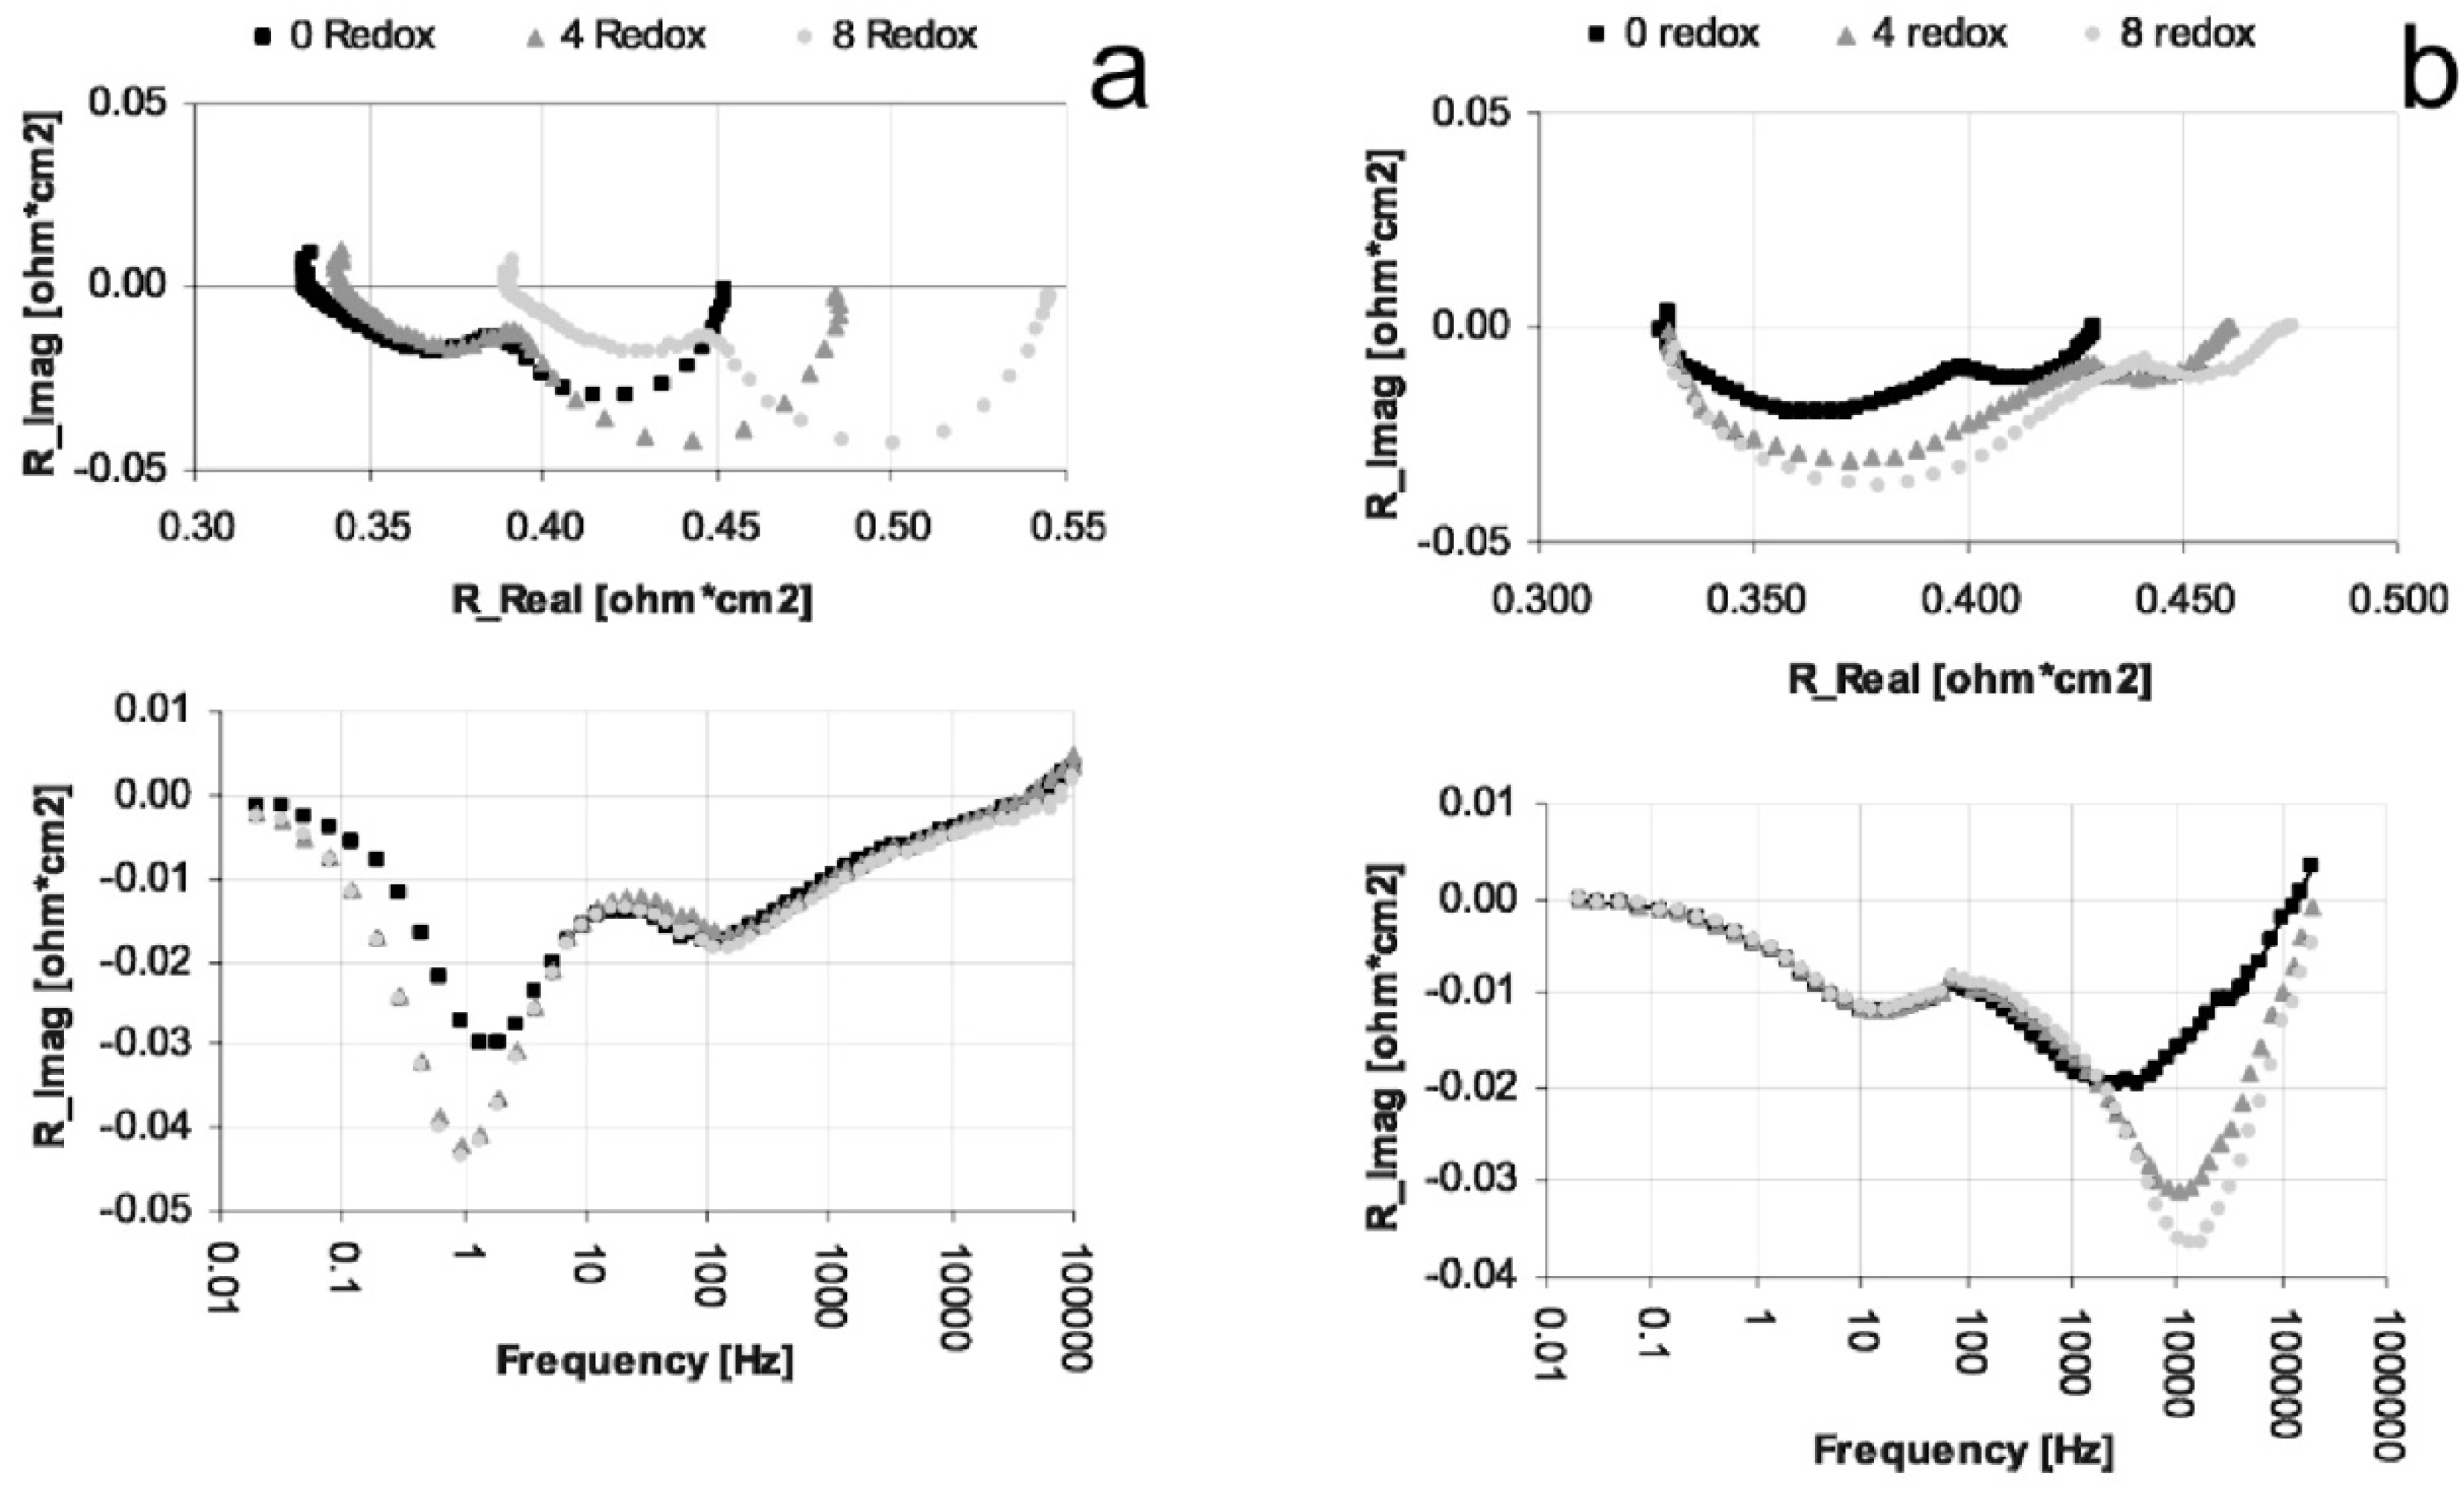
- Electrochemical Performance and Electrochemical Impedance Spectroscopy
- 2.4.12.
- Single Chamber SOFC
- 2.5.
- Summary of the RedOx Instability
- RedOx Solutions
- 3.1.
- System Solutions
- 3.1.1.
- Dependent System Solutions
- 3.1.2.
- Passive System Solutions
- 3.1.3.
- Active System Solutions
- 3.2.
- Stack Design
- 3.2.1.
- Planar Design
- 3.2.2.
- Tubular Design
- 3.3.
- Cell Design
- 3.3.1.
- Cathode Supported Cell (CSC)
- 3.3.2.
- Electrolyte Supported Cell (ESC)
- 3.3.3.
- Metal Supported Cell (MSC)
- 3.3.4.
- Inert Substrate Supported Cells (ISSC)
- 3.3.5.
- Anode Supported Cell (ASC)
- 3.4.
- Modification of the Microstructure
- 3.4.1.
- Anode Functional Layer, Anode Support and Anode Current Collecting Layer
- 3.4.2.
- Particles Size
- 3.4.3.
- Sintering Temperature
- 3.4.4.
- Porosity
- 3.4.5.
- Composition
- 3.4.6.
- Orientation and Particle Shape of Nickel Phase
- 3.4.7.
- Ni coated Pore-Former
- 3.4.8.
- Ni Foam
- 3.4.9.
- Wet Impregnation (WI)
- 3.4.10.
- Ni Coated Ceramic
- 3.4.11.
- Graded Composition and Porosity
- 3.4.12.
- Controlled RedOx Cycle
- 3.5.
- Alternative Anode Materials
- 3.5.1.
- Alloys and Additives for Metal-Ceramic Anode
- 3.5.2.
- Full Ceramic Anode
- 3.5.3.
- Mechanically Stronger Materials
- 3.5.4.
- Use Support with Higher Thermal Expansion Coefficient (TEC)
- 3.6.
- Kinetics
- 3.6.1.
- Oxidation Barrier
- 3.6.2.
- Improved Sealing
- 3.6.3.
- Lower Operating Temperature
- Synthesis for Ni-Based Anode-Supported Cells
- Conclusions
- Acknowledgments
- Appendix
- References
1. Introduction
2. RedOx Instability
2.1. Problematic

| NiO | Ni | |
|---|---|---|
| M [g/mol] | 74.71 | 58.71 |
| ρ [g/cm3] | 6.67 | 8.9 |
| V [cm3/mol] | 10.97 | 6.58 |
- Under high load or high fuel utilization conditions, the oxygen partial pressure can locally increase up to a critical value [33];
- The oxygen partial pressure increases in the vicinity of compressive seals, which causes small air leakage to the anode [34];
- Accidental fuel supply interruption;
- To reduce cost and system complexity, shut down and start up is done without protective gas.
2.2. High Temperature Nickel Oxide Reduction and Nickel Oxidation
2.2.1. Reduction of NiO


| Source reference | Sample and measurement technique | Temperature range (°C) | Ea (kJ mol−1) |
|---|---|---|---|
| Pure nickel oxide | |||
| Szekely and Evans [37] | Large porous single pellet, TGA | 372–753 | 17 |
| Deb Roy and Abraham [37] | Non-porous spherical pellets, TGA | 400–800 | 22 |
| Bandrowski et al. [37] | Large porous NiO pellet in a packed bed, H2O detection | 261–298 | 52 |
| Szekely and Evans [37] | Large porous NiO pellet, TGA | 226–308 | 65 |
| Nakajima et al. [37] | Powdered NiO sample | 277–377 | 69 |
| Rao and Rashed [39] | Thin NiO slab, TGA | 300–400 | 73 |
| Richardson et al. [37] | Porous NiO powder, TGA | 220–355 | 84 |
| Richardson et al. [37] | Porous NiO powder thin slab, XRD | 175–300 | 85 |
| Szekely et al. [37] | Pressed thin discs, TGA | 224–259 | 133 |
| NiO and ceramic composite | |||
| Modena et al. [40] | Tape-cast NiO-YSZ, TGA | 700–800 | 25–29 |
| Modena et al. [40] | Tape-cast NiO-YSZ 2nd reduction, TGA | 700–800 | 51–87 |
| Waldbillig et al. [41] | Tape-cast NiO-YSZ, TGA | 500–950 | 54–78 |
| Tikekar et al. [36] | Pressed NiO-YSZ rectangular bar, thickness of reduced layer | 600–800 | 94 |
| Pihlatie et al. [38] | Tape-cast NiO-YSZ, TGA | 500–750 | 84 |
2.2.2. High Temperature Oxidation of Ni


| Source Reference | Sample | Temperature range (°C) | Ea (kJ mol−1) | Kinetics |
|---|---|---|---|---|
| Pure nickel | ||||
| Suwanwatana et al. [56] | Ni particles, Ø = 79 nm | 250–350 | 150 | Deviation from parabolic |
| Suwanwatana et al. [56] | Ni particles, Ø = 0.7 µm | 250–350 | 127 | Deviation from parabolic |
| Suwanwatana et al. [56] | Ni particles, Ø = 3 µm | 250–350 | 108 | Deviation from parabolic |
| Karmhag et al. [57] | Ni particles, Ø = 15 nm | 135–235 | 129 | Deviation from parabolic |
| Karmhag et al. [58] | Ni particles, Ø = 5 µm | 300–700 | 145 | Deviation from parabolic |
| Karmhag et al. [59] | Ni particles, Ø = 158 µm | 500–700 | 183 | Deviation from parabolic |
| Haugsrud [60] | Polycrystalline Ni-mechanically polished | 500–800 | 150 | Deviation from parabolic |
| Karmhag et al. [59] | Ni particles, Ø = 158 µm | 800–1200 | 116 | Deviation from parabolic |
| Haugsrud [60] | Polycrystalline Ni-mechanically polished | 1100–1300 | 200 | Parabolic |
| Peraldi et al. [61] | Polycrystalline bulk Ni-mechanically polished | 1000–1200 | 200 | Parabolic |
| Nickel–ceramic composite | ||||
| Waldbillig et al. [41] | Tape-cast NiO-YSZ | 500–850 | 87–92 | Deviation from parabolic |
| Tikekar et al. [36] | Pressed NiO-YSZ rectangular bar | 600–800 | – | Parabolic |
| Stathis et al. [62] | Warm pressed NiO-YSZ | 550–650 | Logarithmic | |
| Modena et al. [40] | Tape-cast NiO-YSZ | 700–800 | 37–44 | Logarithmic |
| Pihlatie et al. [38] | Tape-cast NiO-YSZ | 500–1000 | Linear–parabolic–logarithmic part | |
| Roche et al. [41] | Tape-cast NiO-YSZ | 600–1000 | 118 | Deviation from parabolic |
| Czerwinski et al. [63] | Polycristalline Ni with CeO2-mechanically polished | 600–800 | 88 | – |
| Czerwinski et al. [63] | Polycristalline Ni with CeO2-chemically polished | 600–800 | 100 | – |
| Galinski et al. [64] | Thin sprayed NiO-40CGO | 500–575 | 164 | Parabolic–cubic |
| Galinski et al. [65] | Thin sprayed NiO-CGO | 500–575 | 270 | Mott–Cabrera equation for spherical geometries |

2.3. Reduction of NiO-YSZ Cermet
2.4. Oxidation of Ni-Ceramics Composite
2.4.1. Kinetics of Oxidation
2.4.2. Homogeneous Versus Inhomogeneous Oxidation
2.4.3. Expansion during Reoxidation
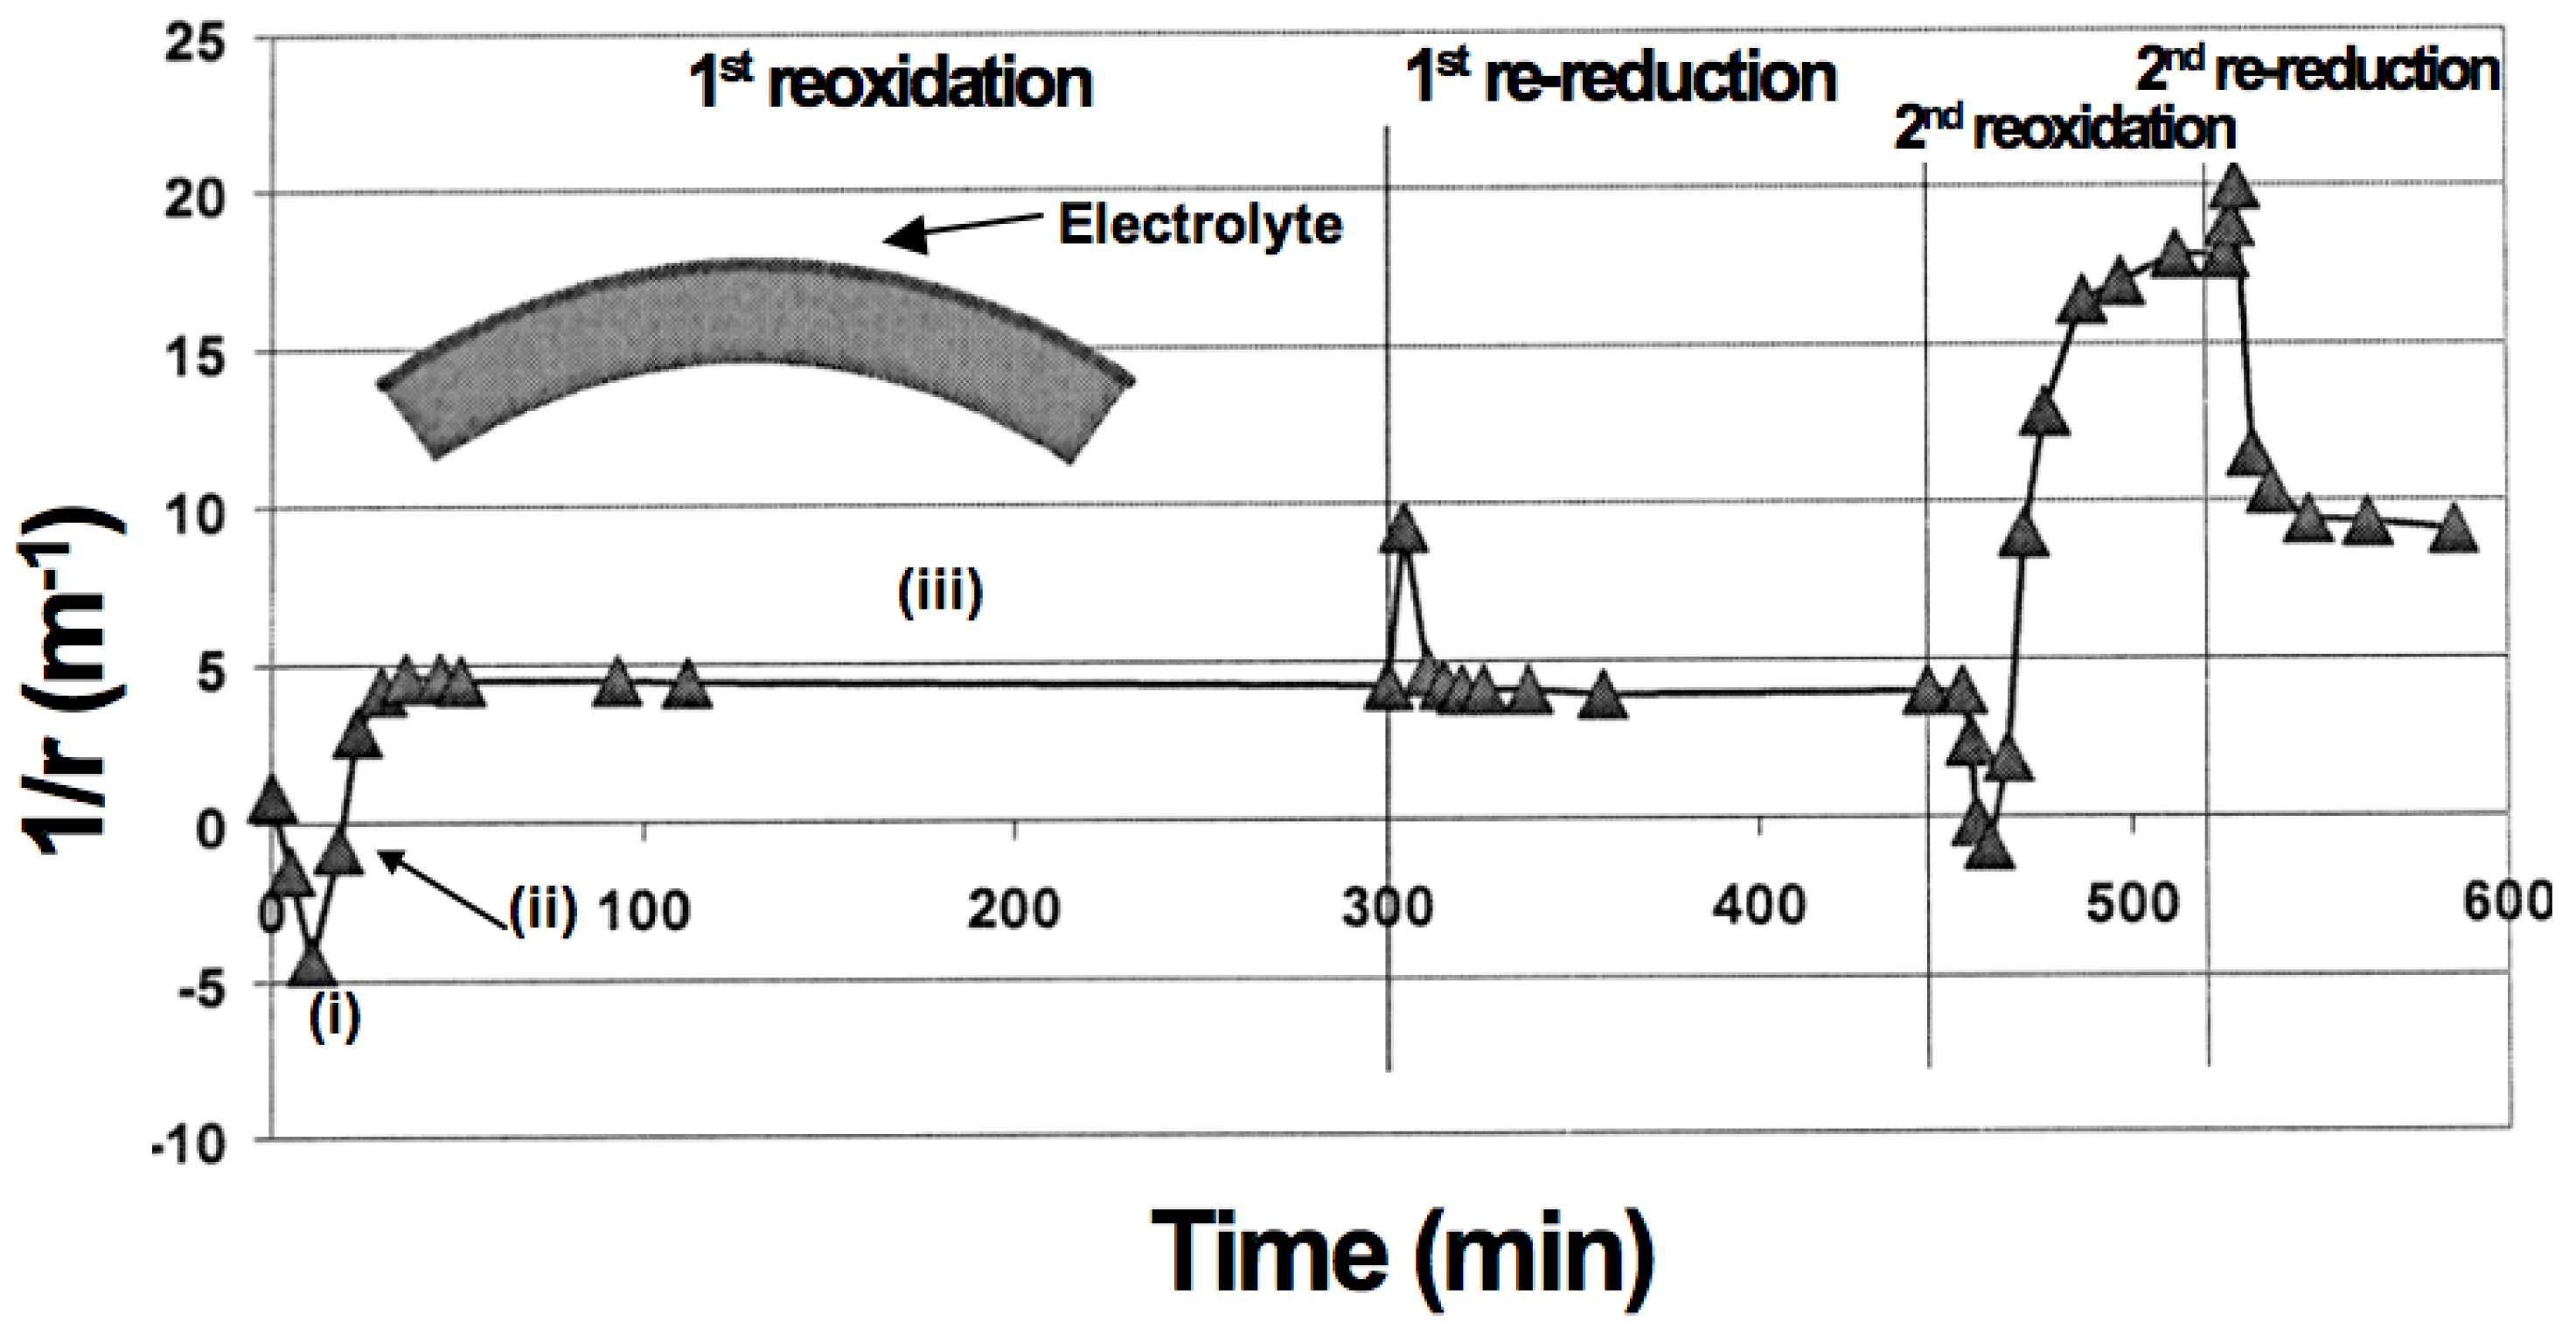
2.4.4. Bending and Stresses in Half-Cell Samples (Anode Support)

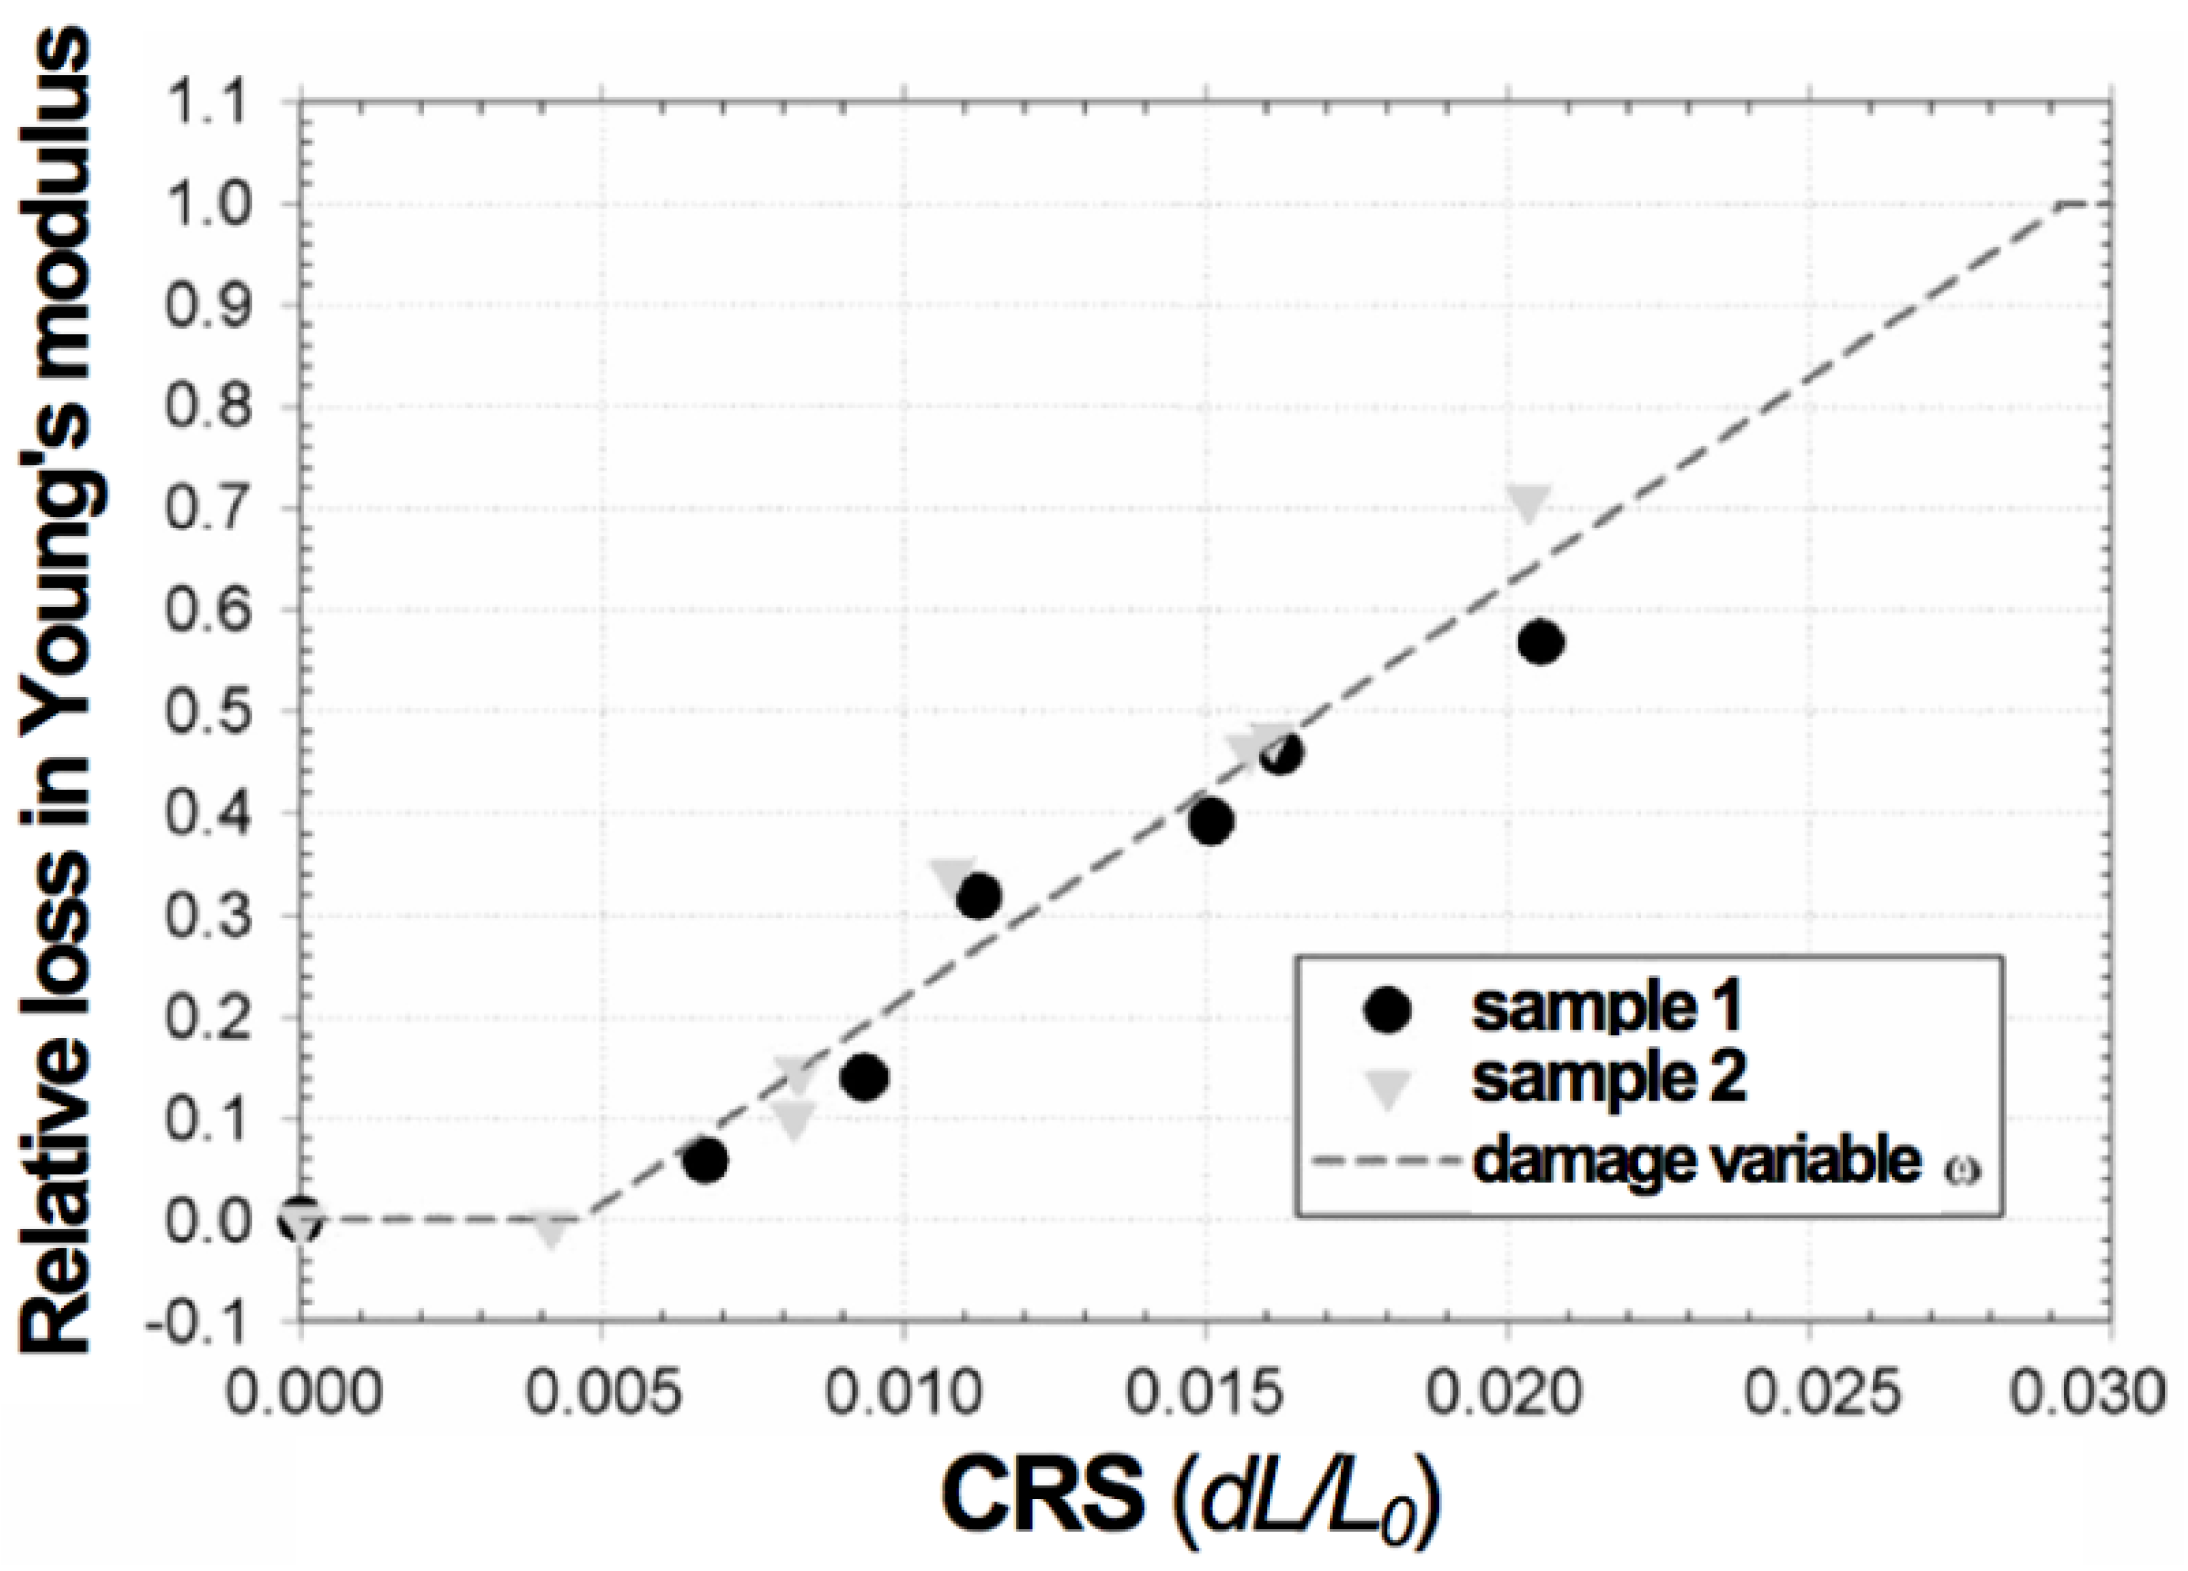
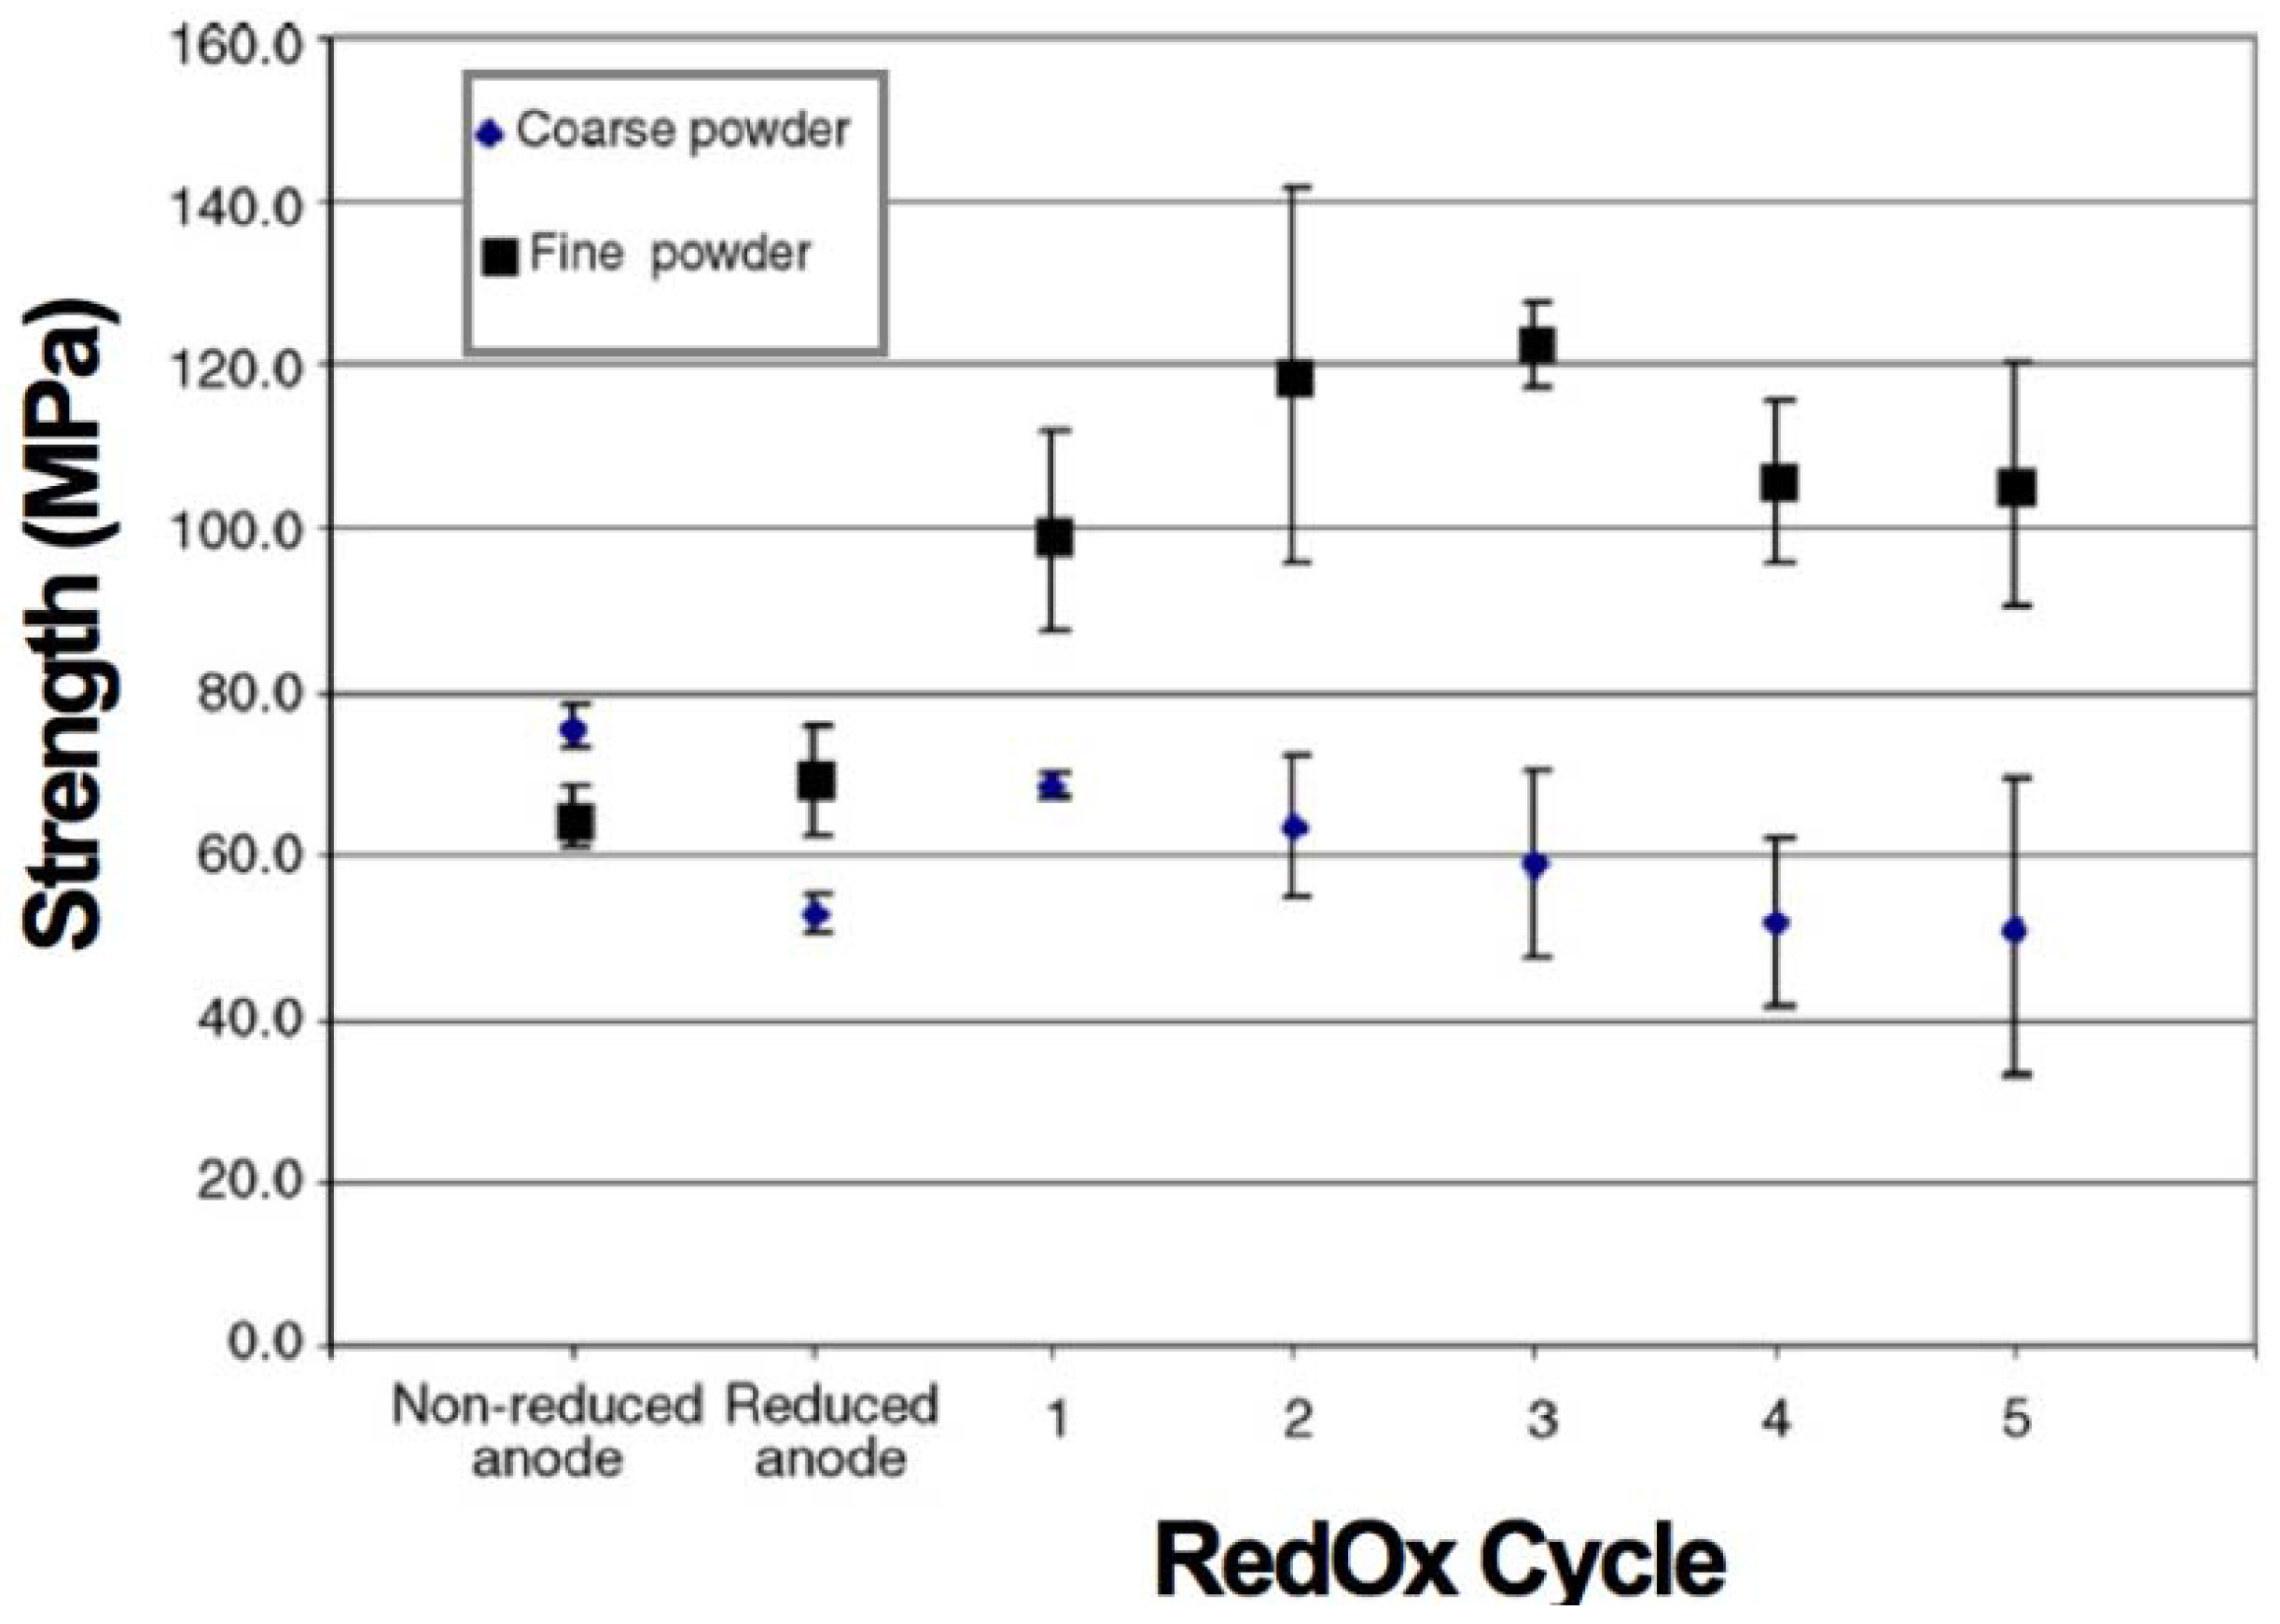
2.4.5. Young’s Modulus and Strength Variation with Reoxidation
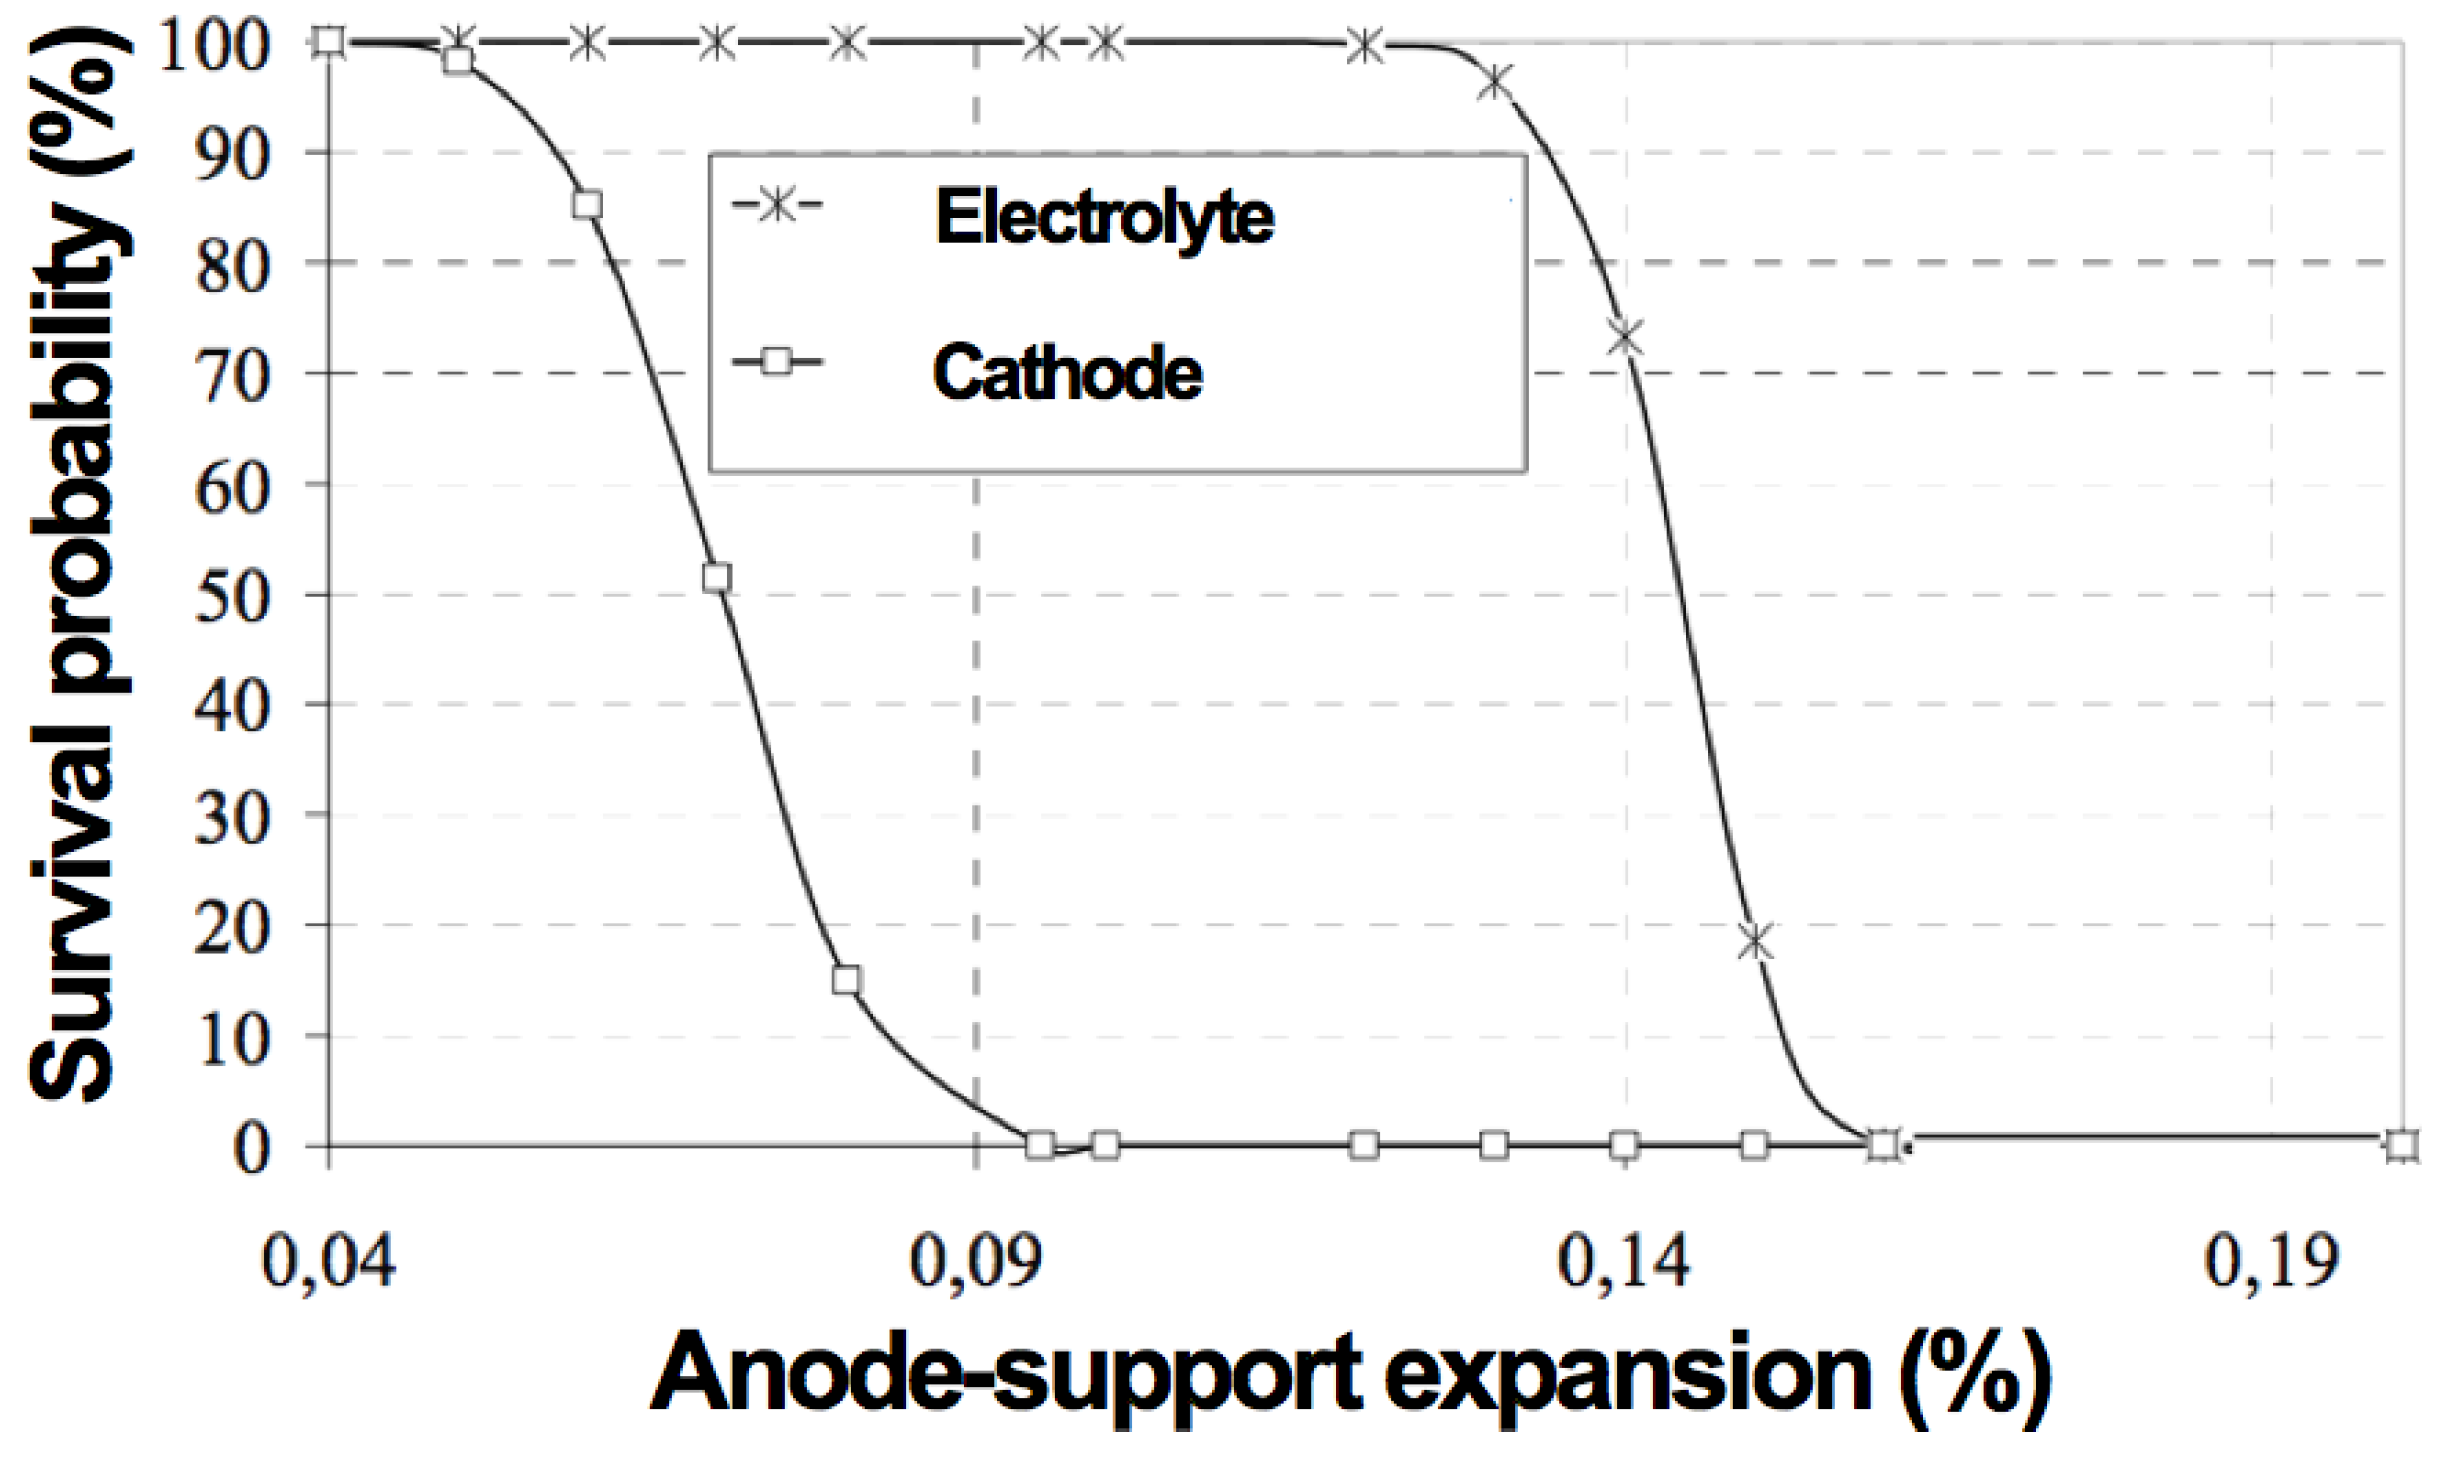
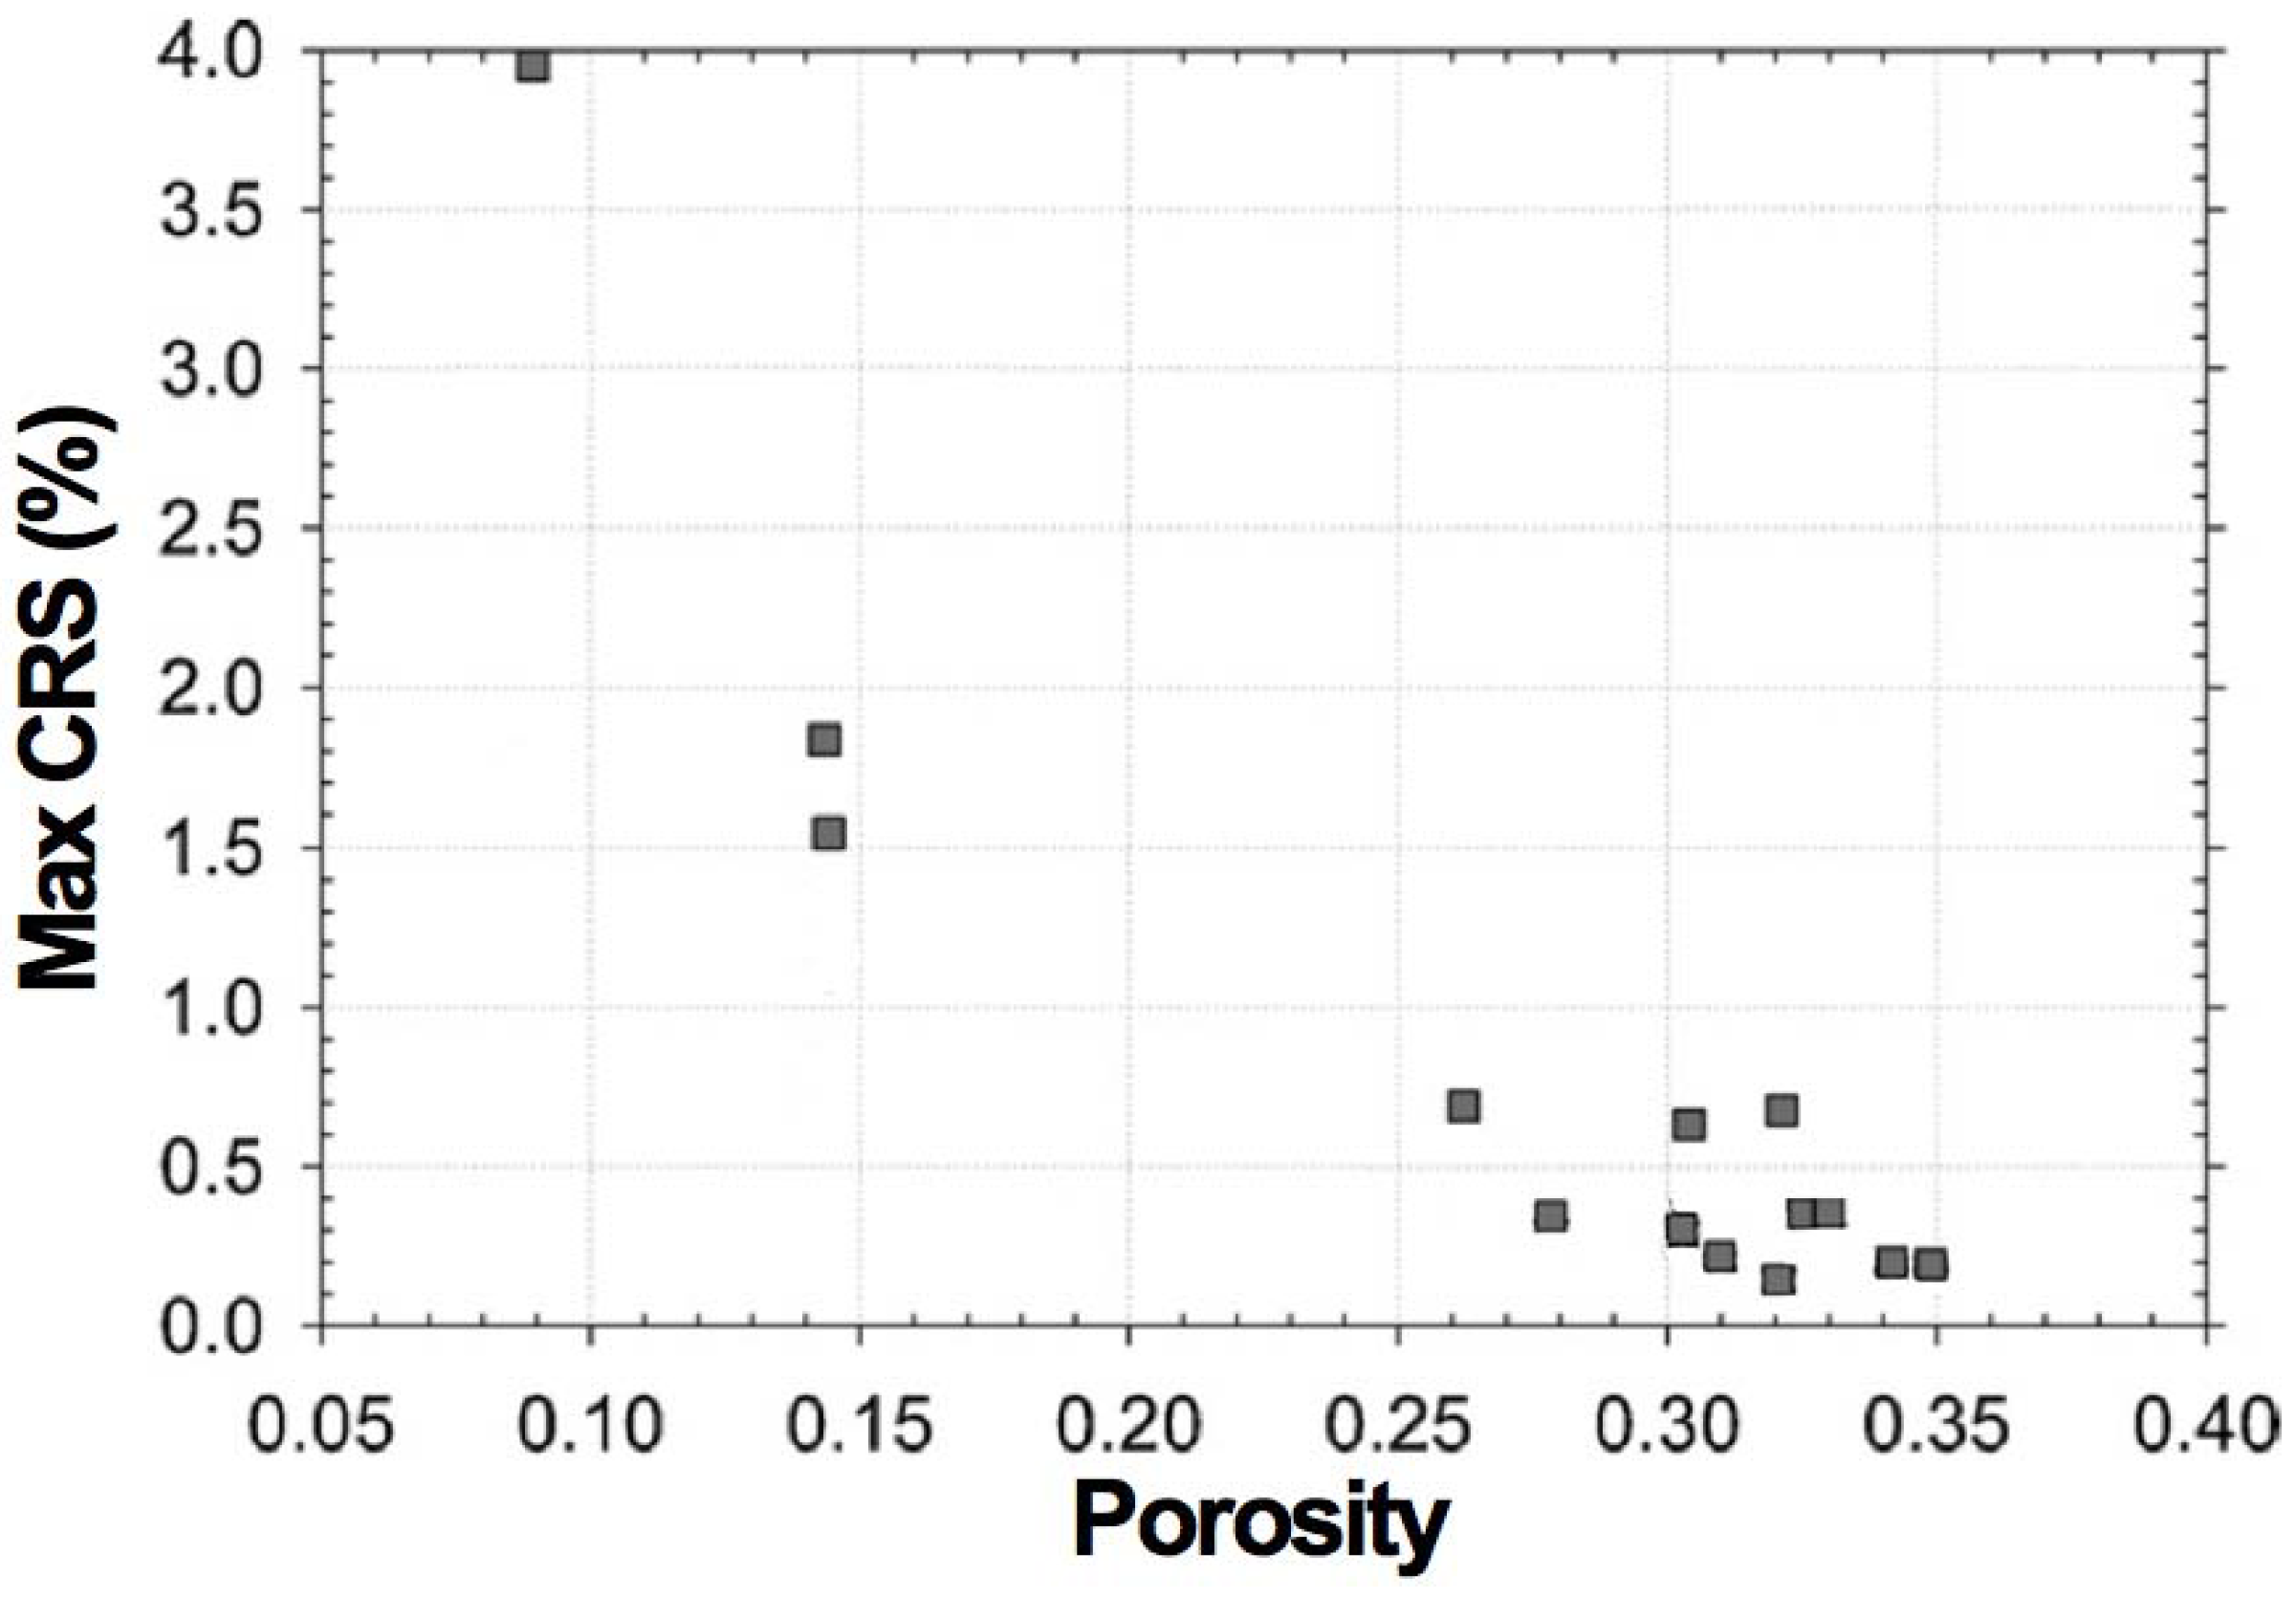
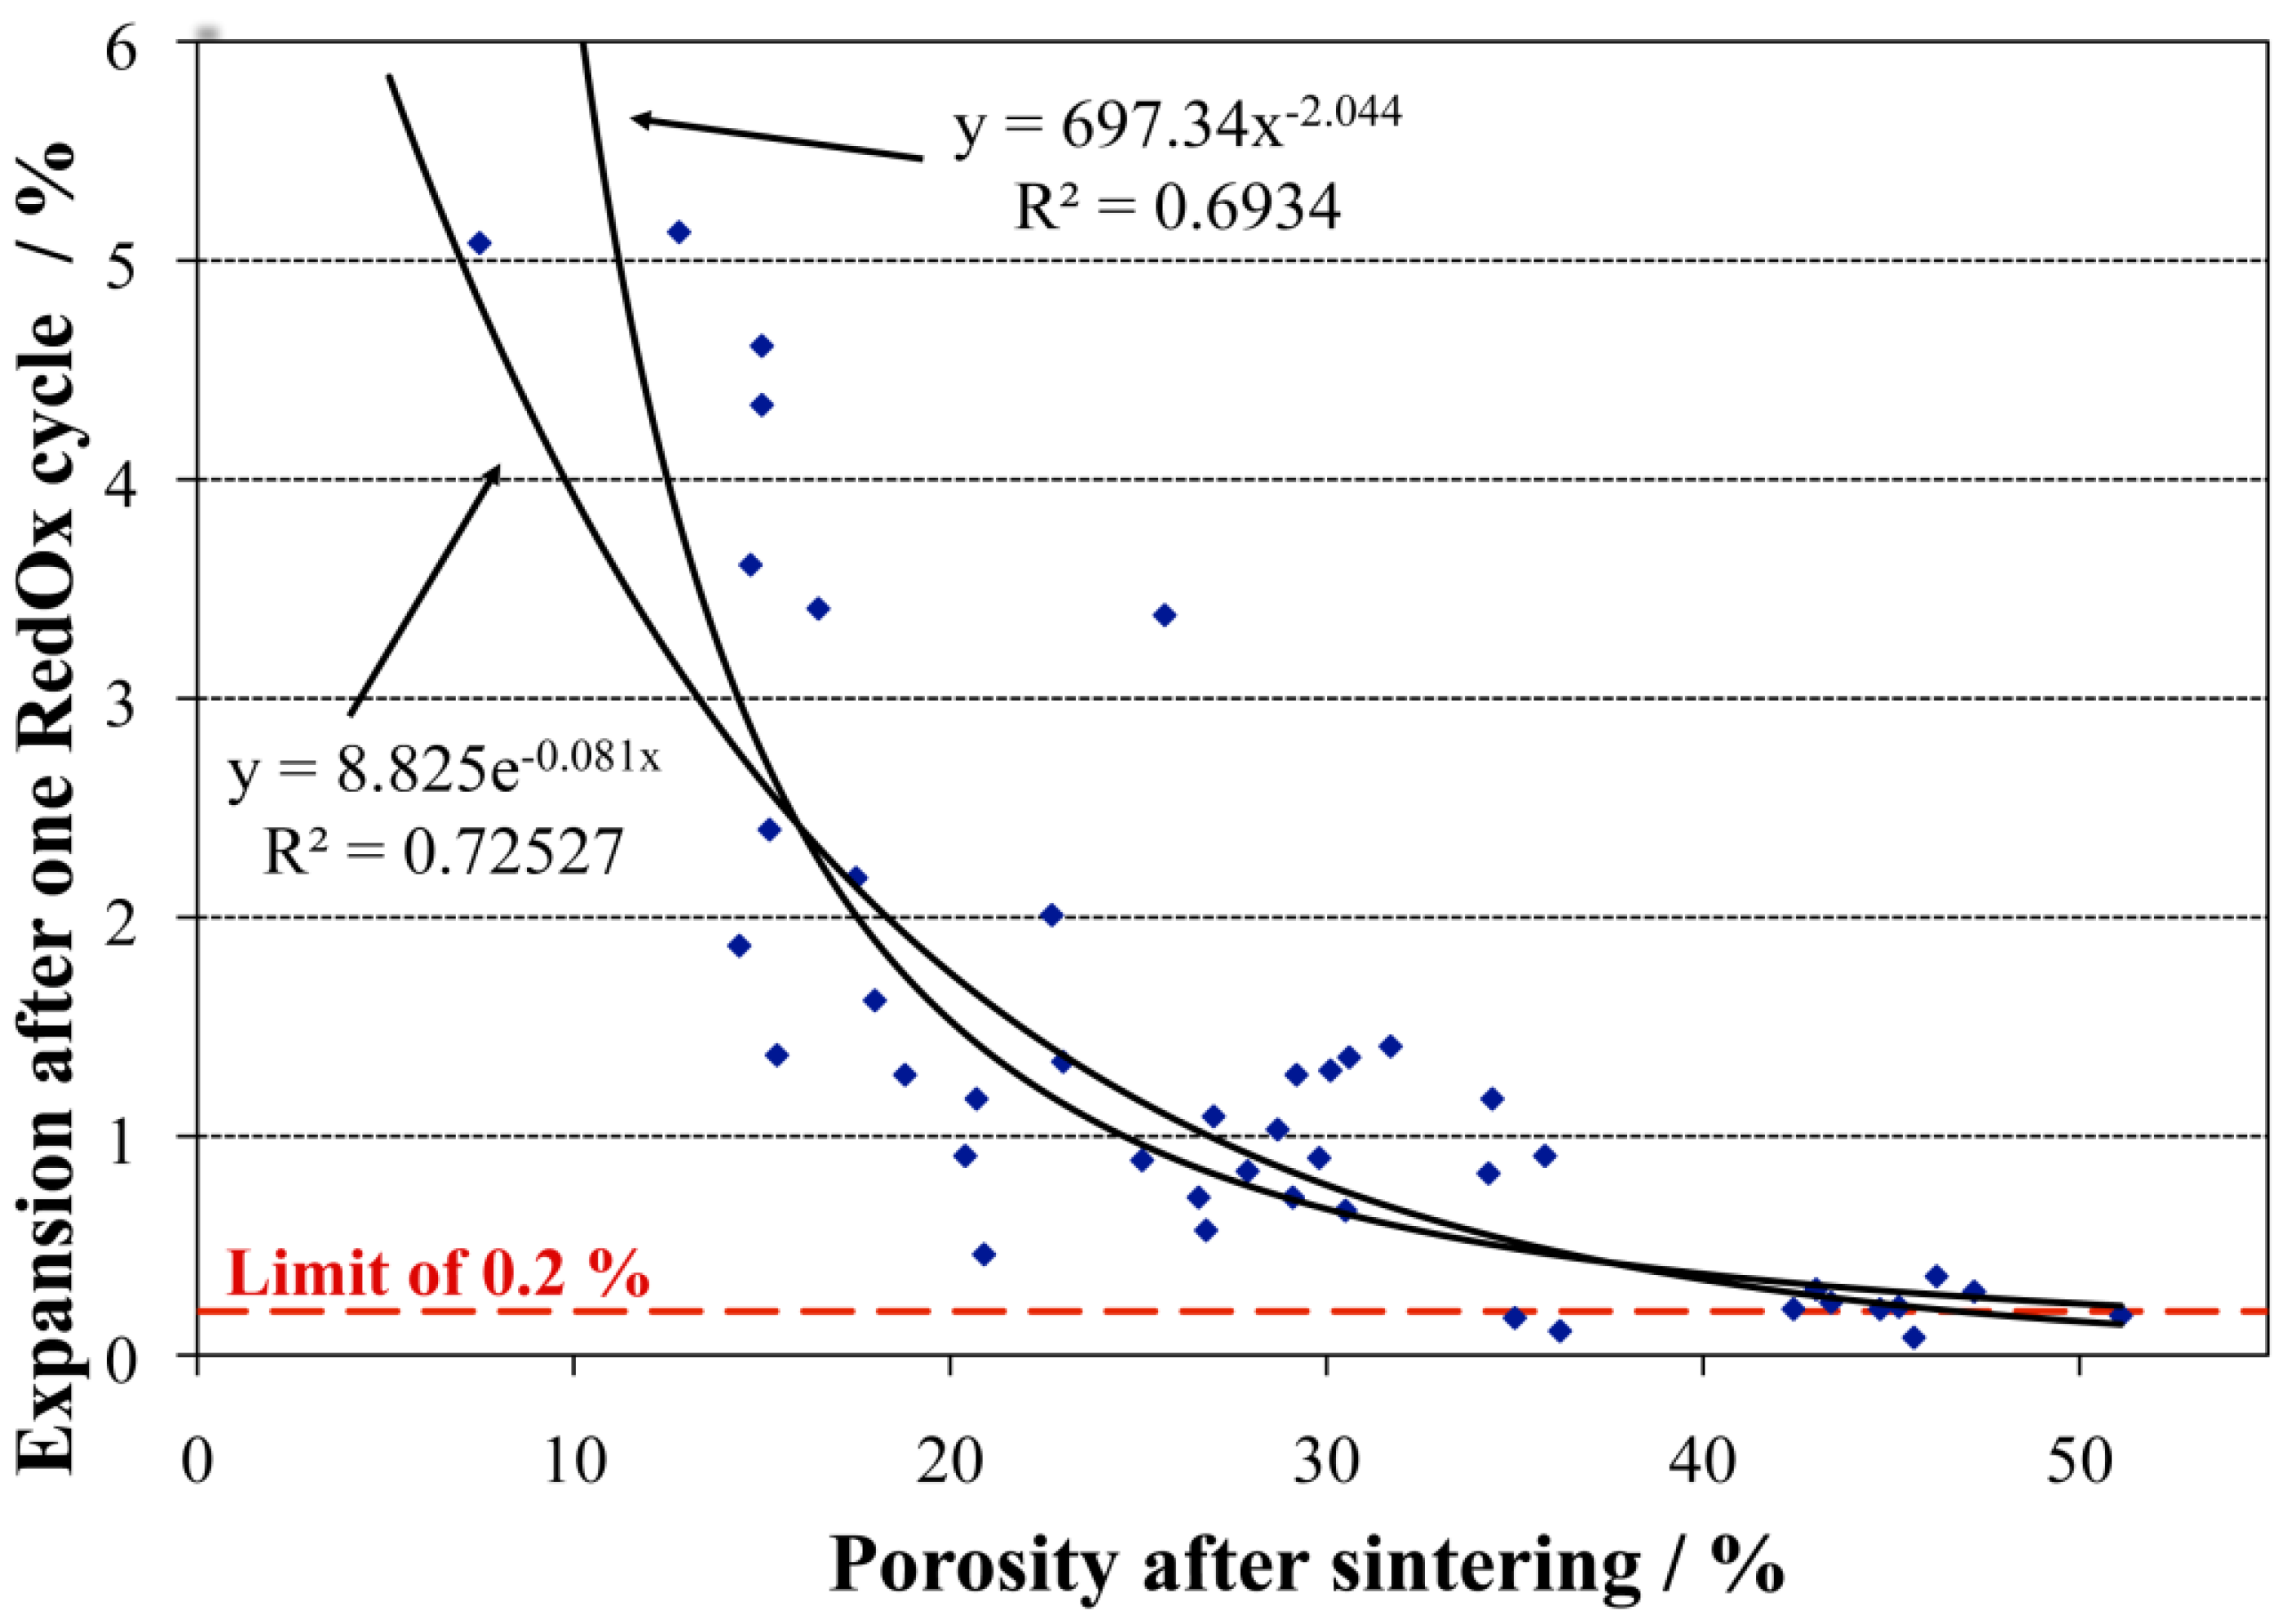
2.4.6. RedOx Expansion Limits: Mathematical Approaches


- at 650 °C, 0.2% for AS and 0.7% for AFL;
- at 800 °C, 0.2% for AS and 0.25% for AFL.
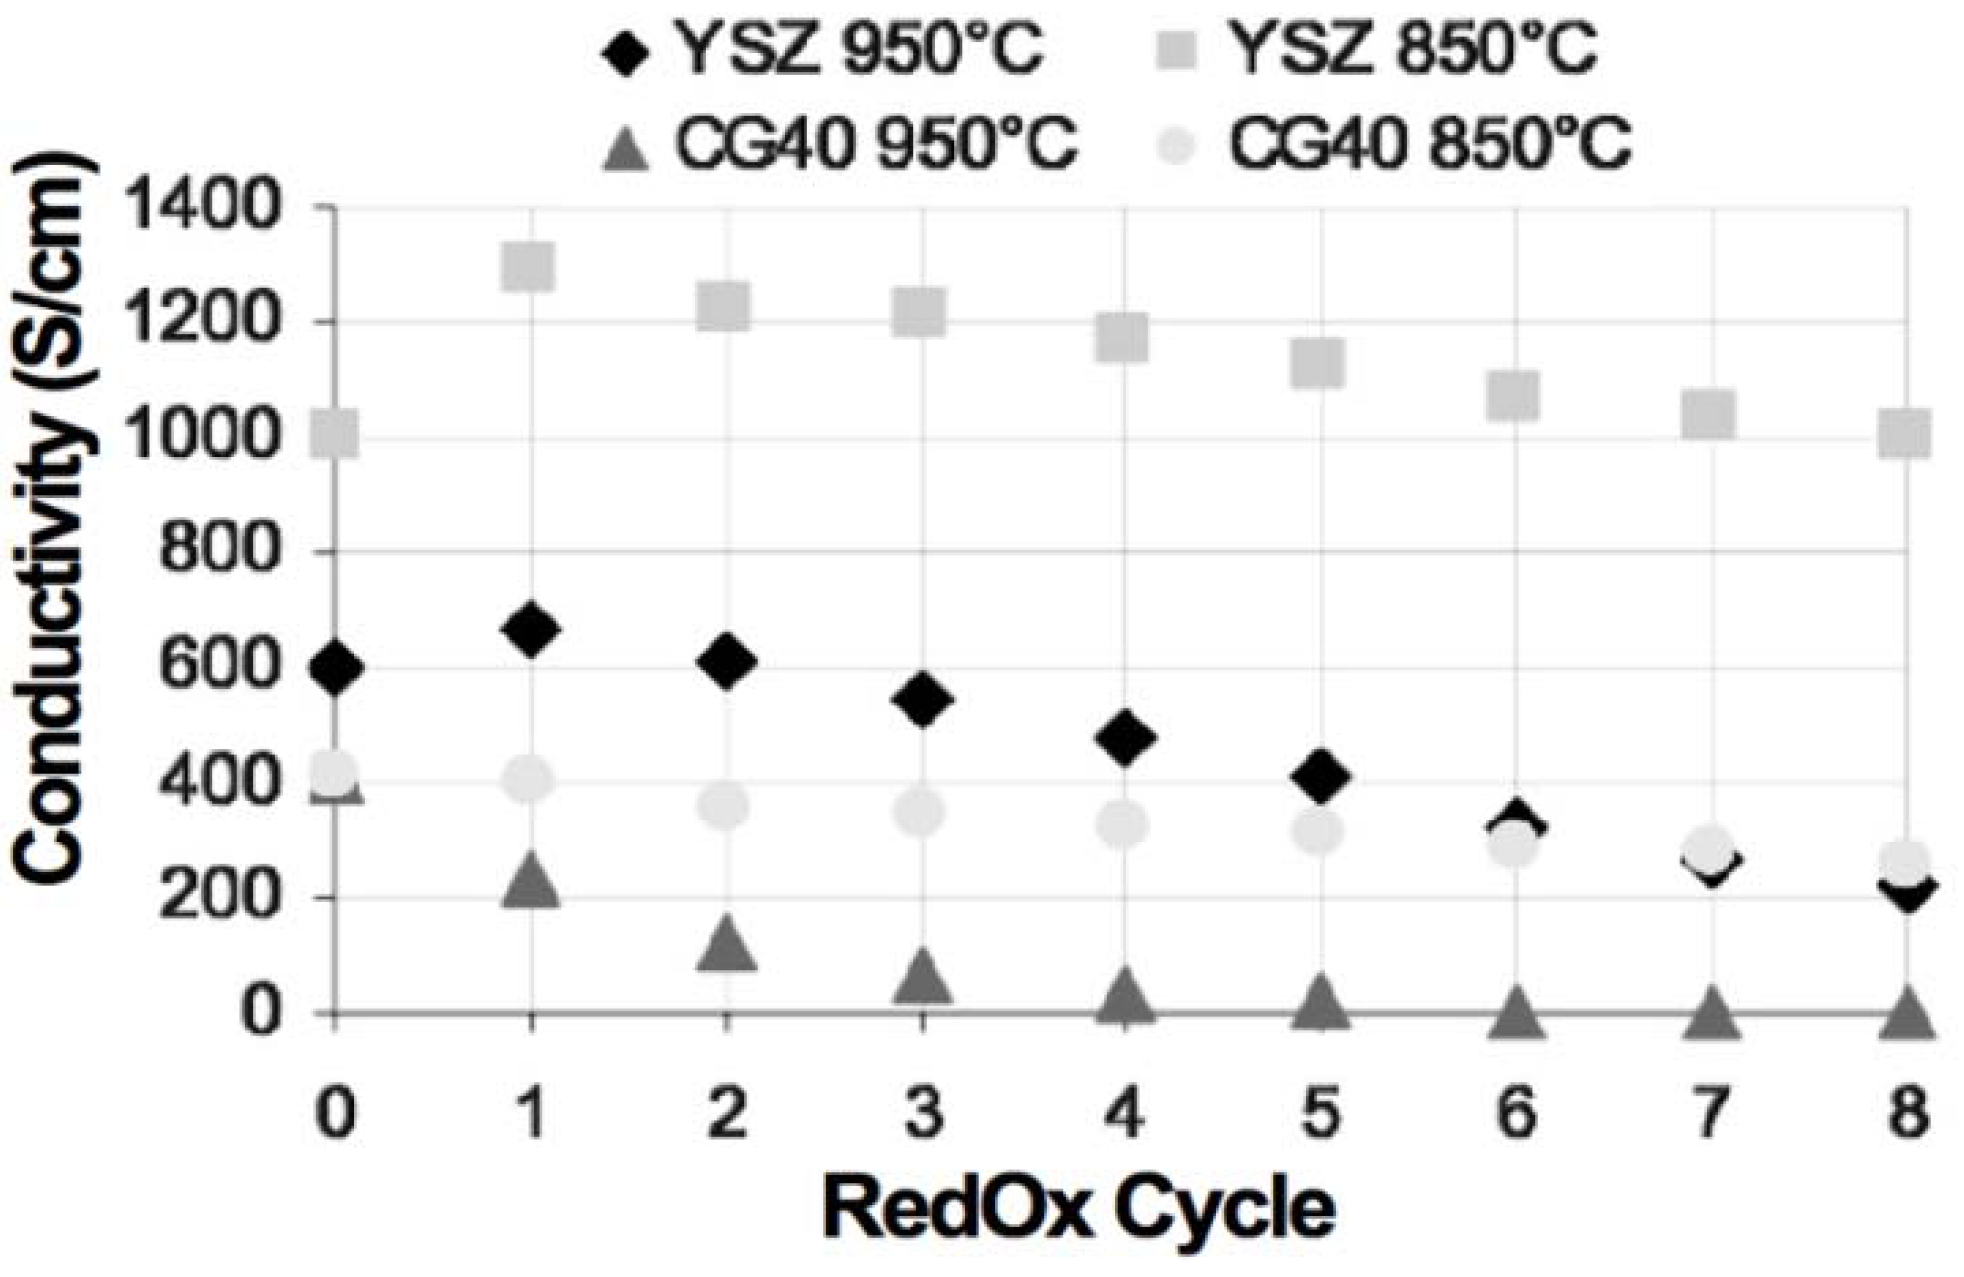
2.4.7. Electrical Conductivity versus RedOx Cycles

2.4.8. Temperature Variation during Oxidation


| a (J mol−1 K−1) | b (J mol−1 K−2) | ∆ Hox,Ni (kJ mol−1) | ∆ Hfusion (kJ mol−1) | ∆Hα→β (kJ mol−1) | |
|---|---|---|---|---|---|
| NiO solid | 46.81 | 8.46 × 10⁻³ | 239.8 [29] | 50.66 [34] | – |
| NiO liquid | 59.87 | – | – | – | – |
| α-ZrO2 | 57.80 | 16.67 × 10⁻³ | – | – | 4.75 [34] |
| β-ZrO2 | 78.63 | – | – | – | – |
2.4.9. Reoxidation by Ionic Current

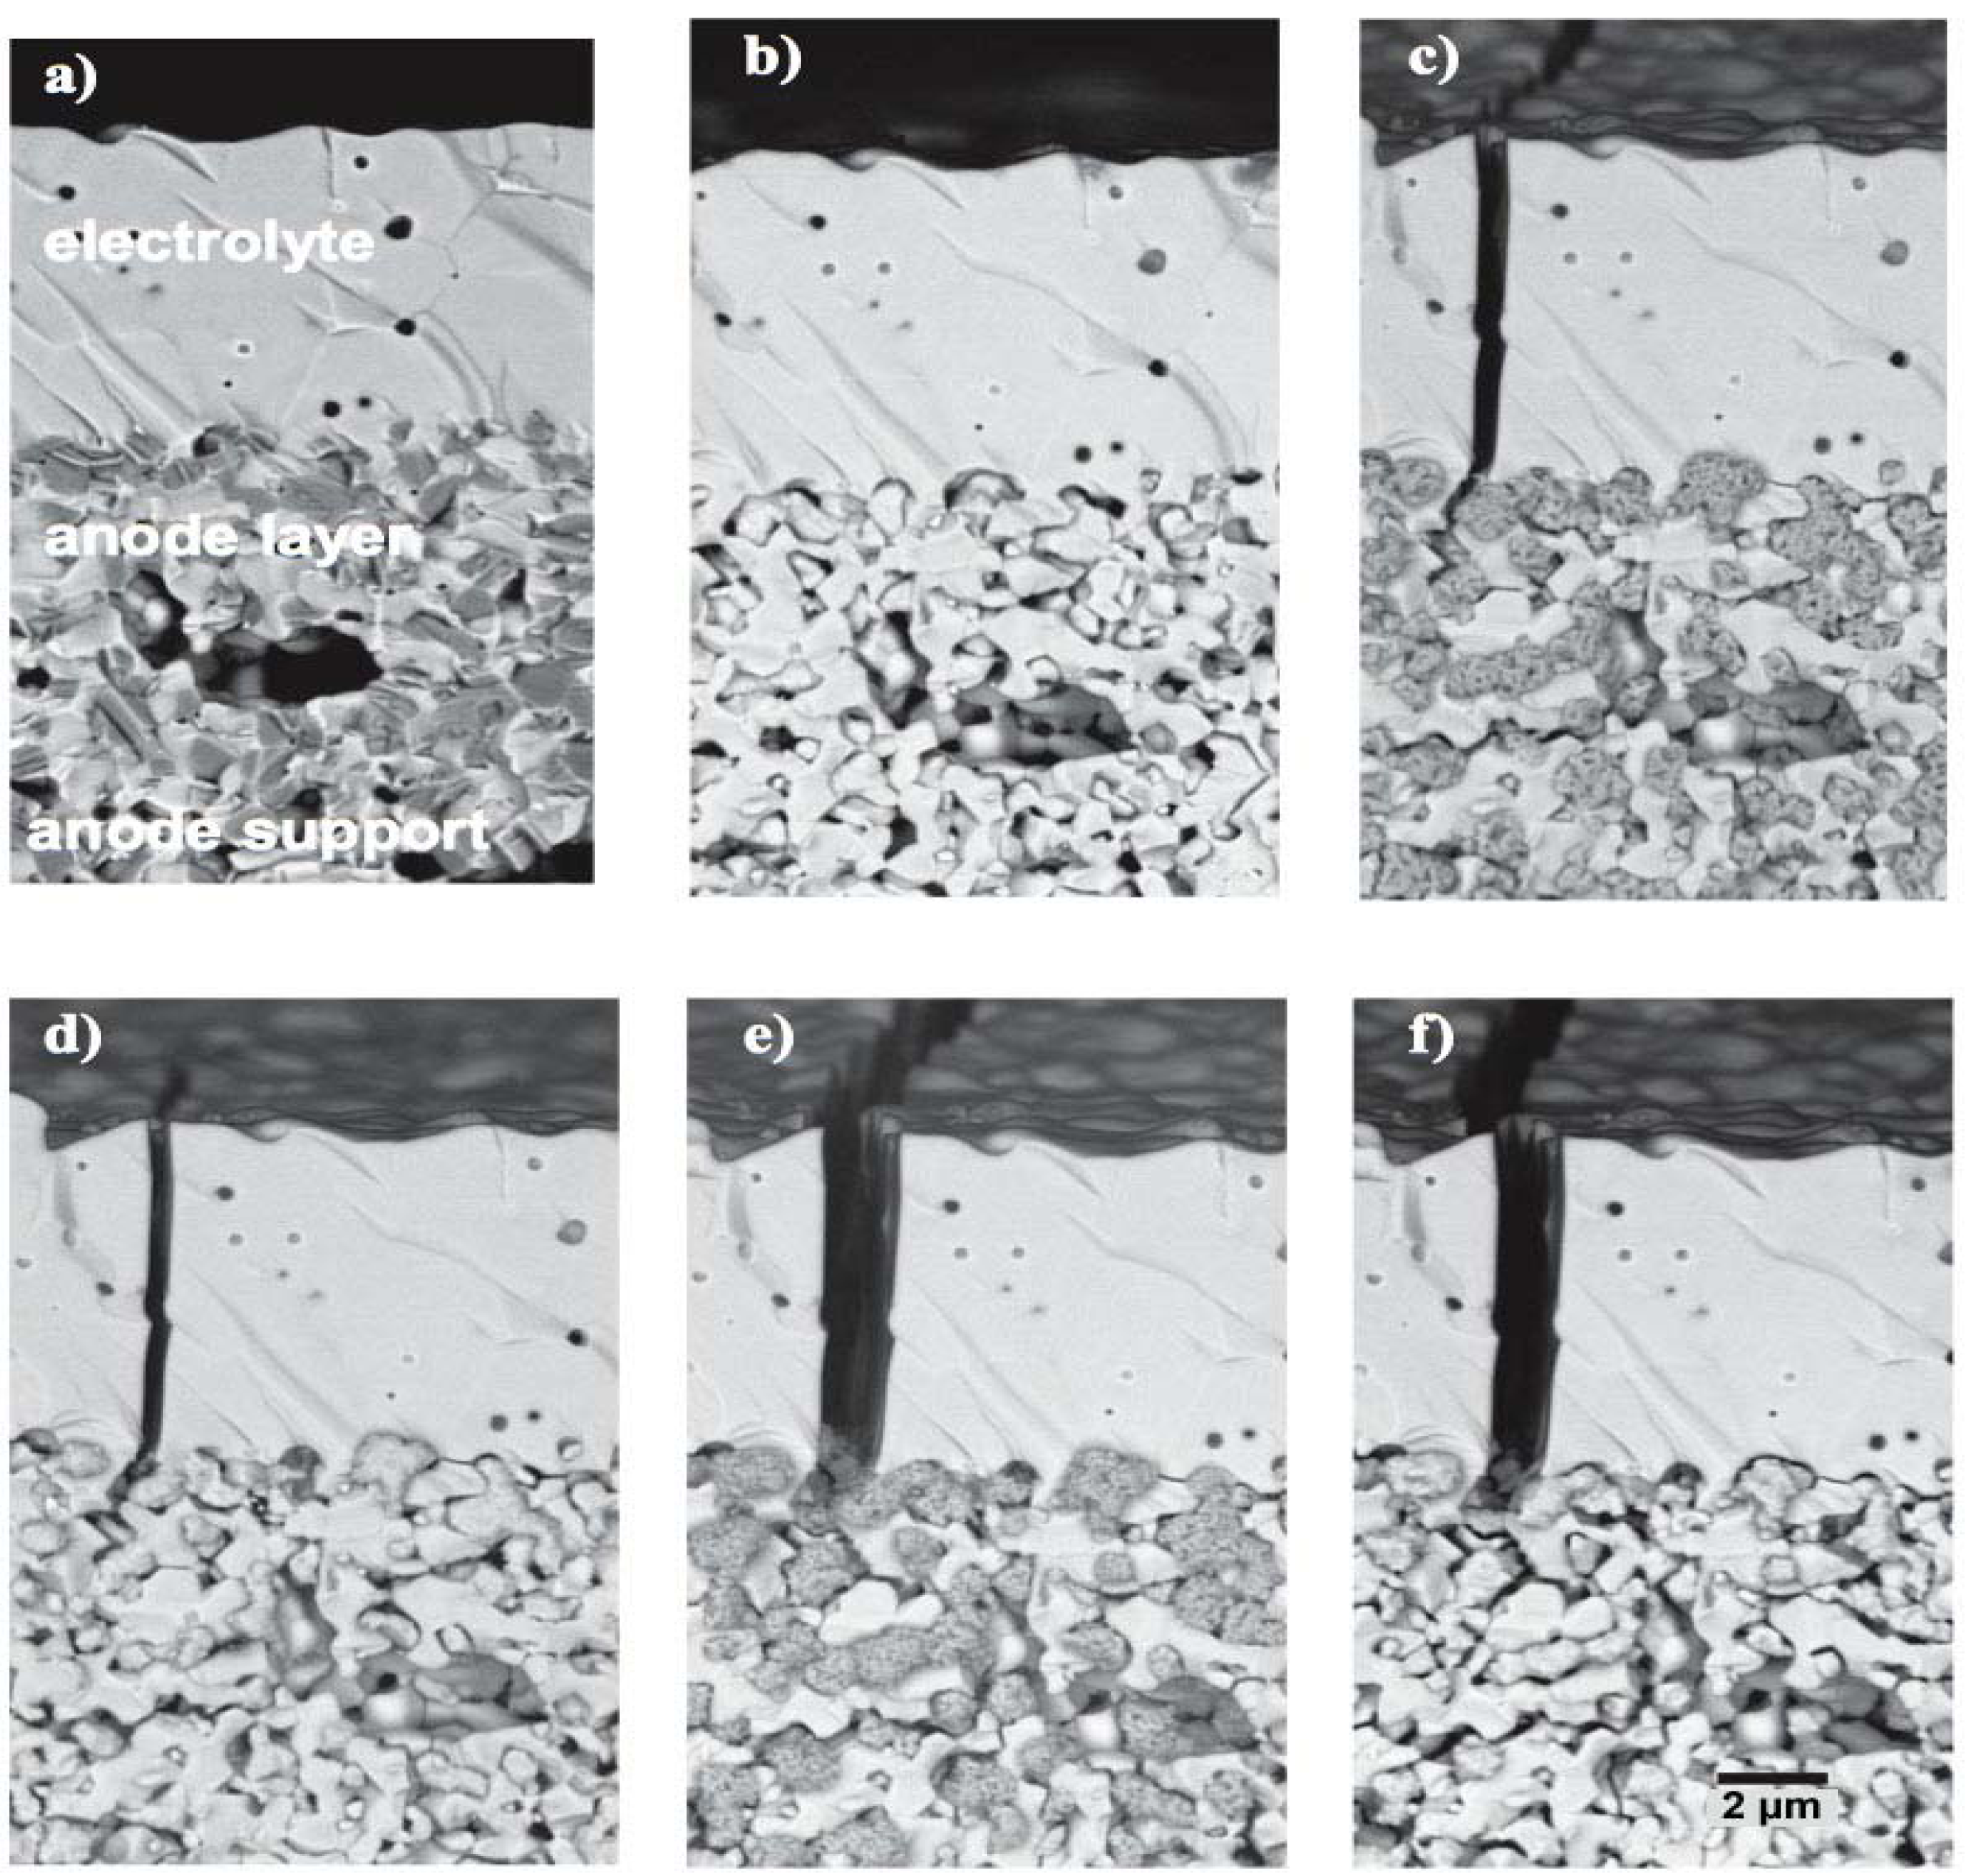
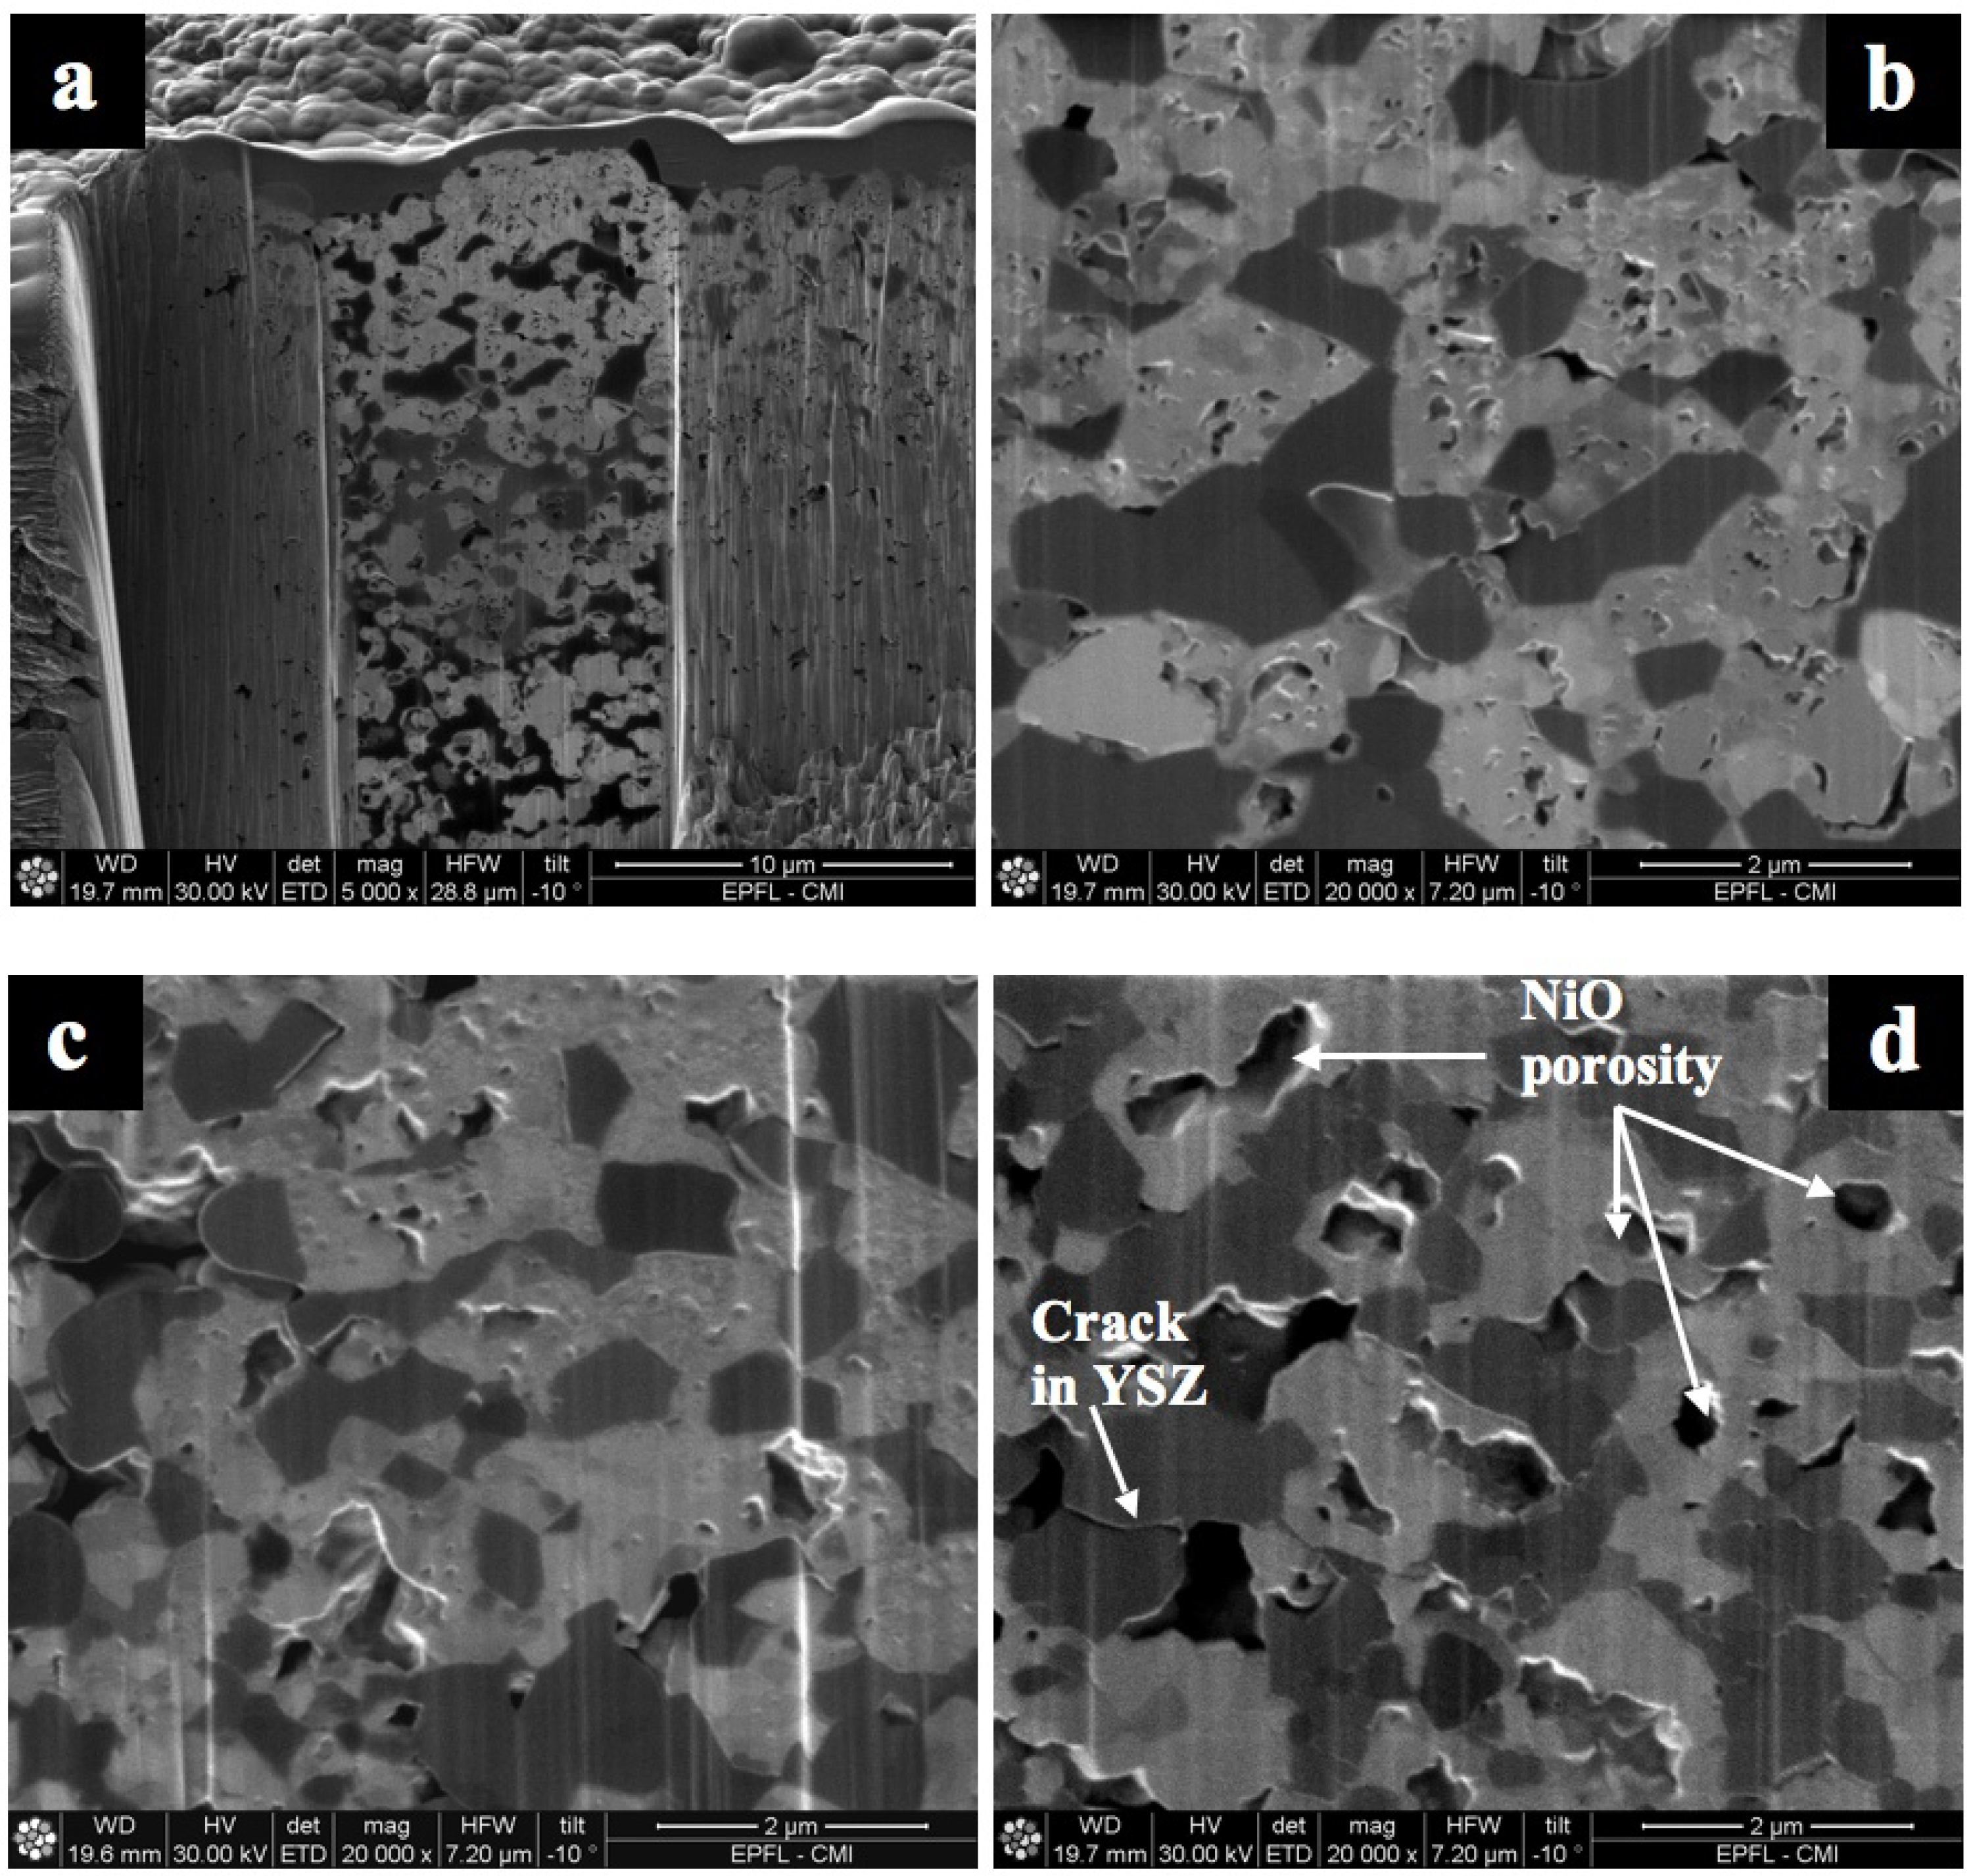
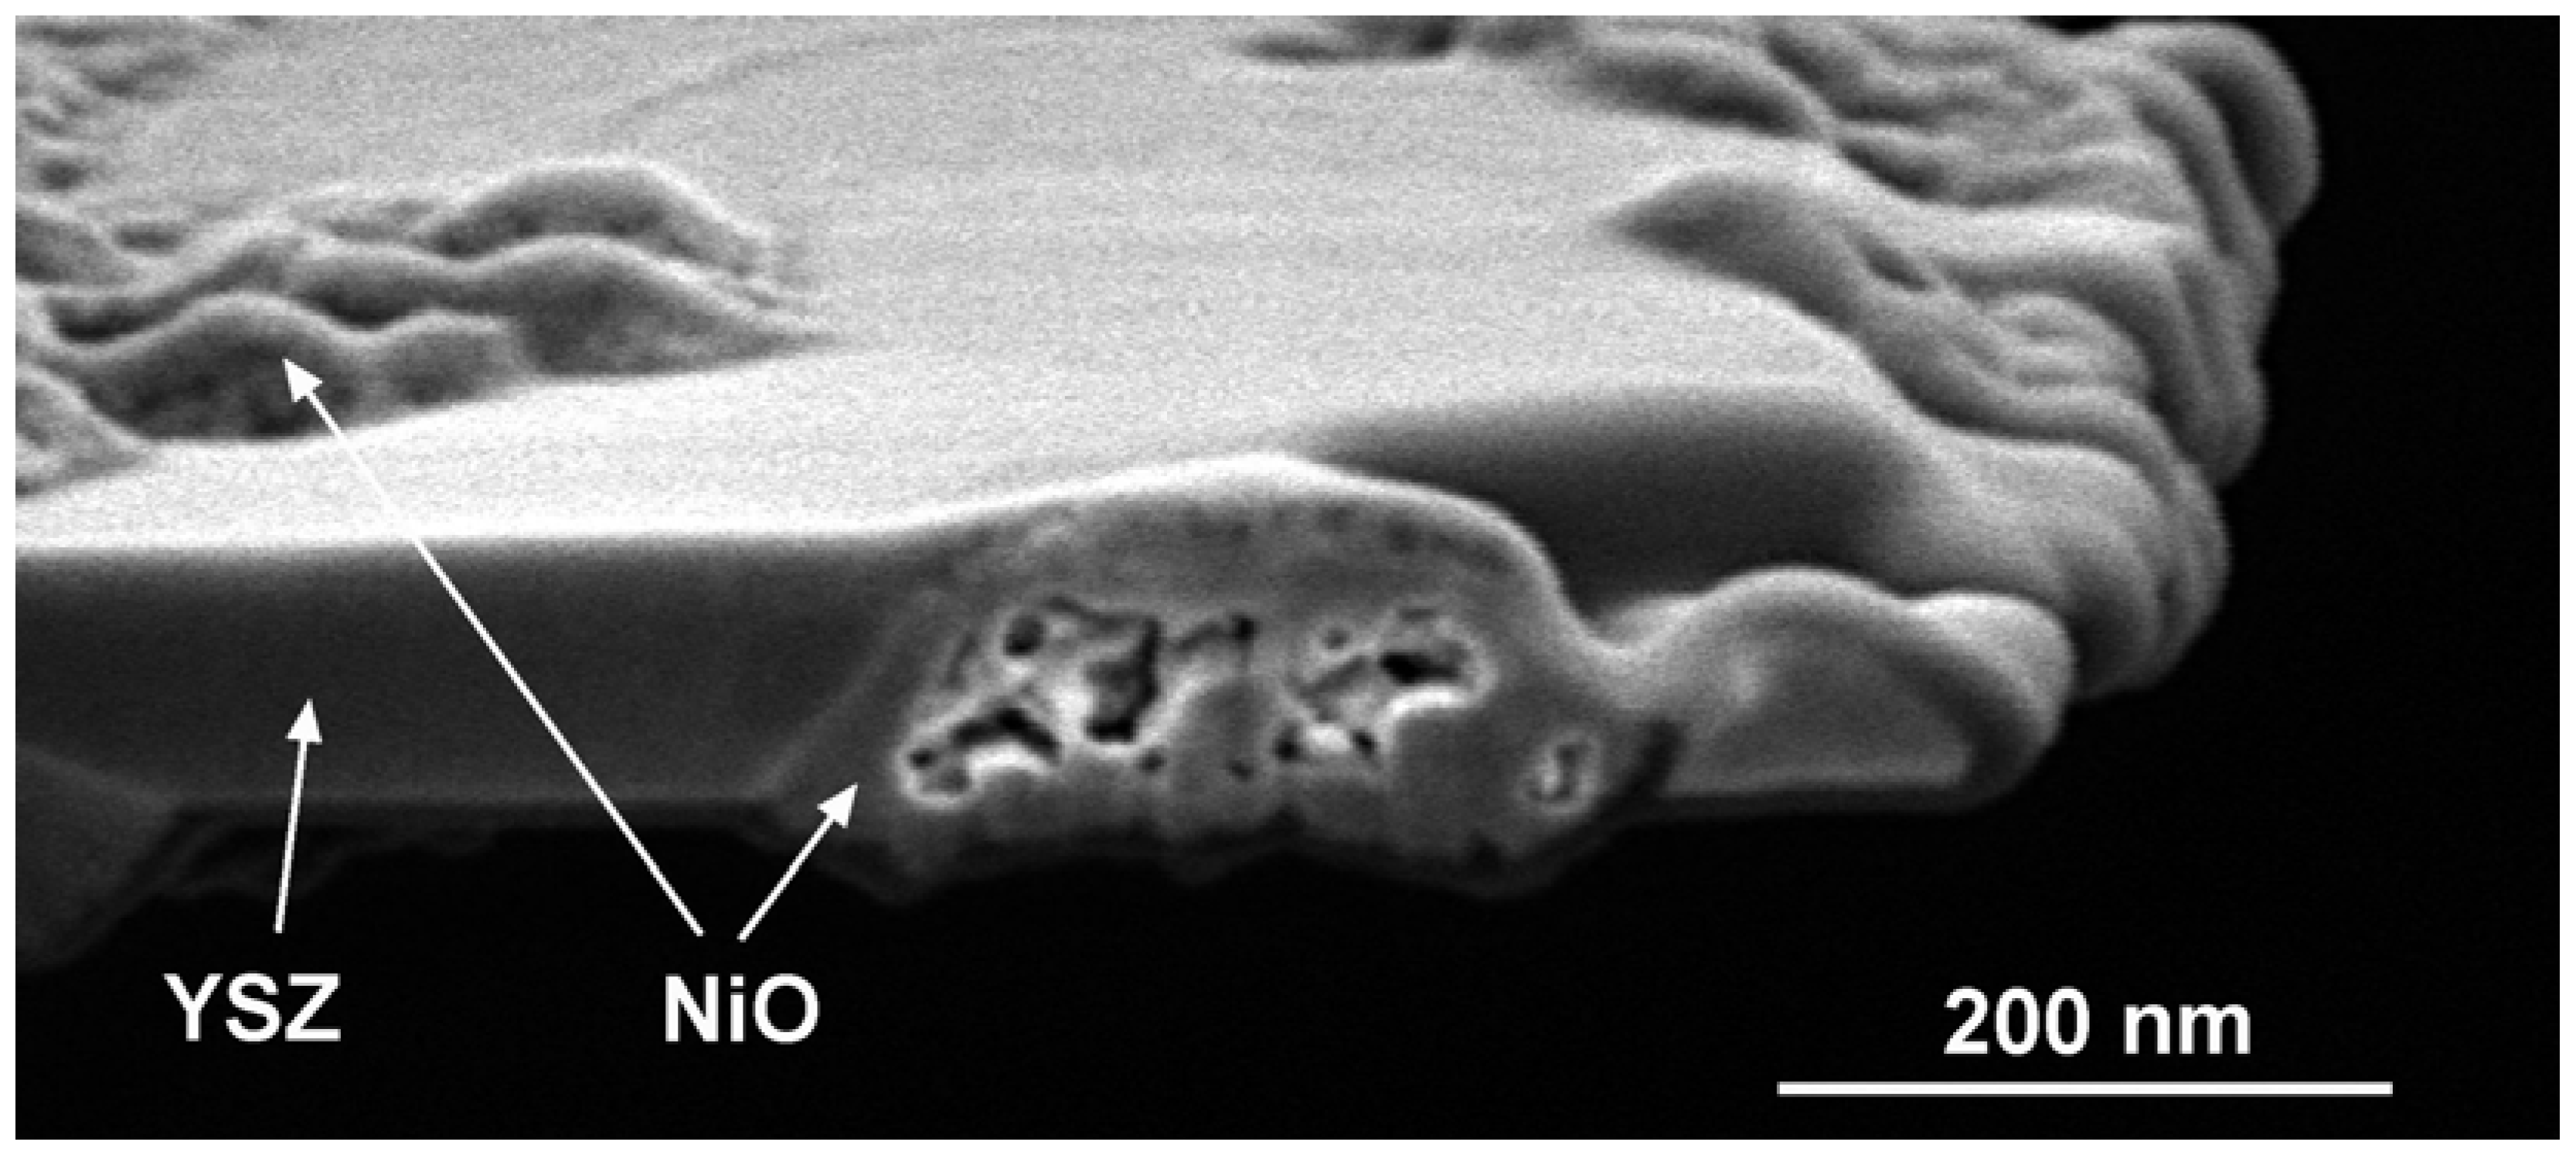
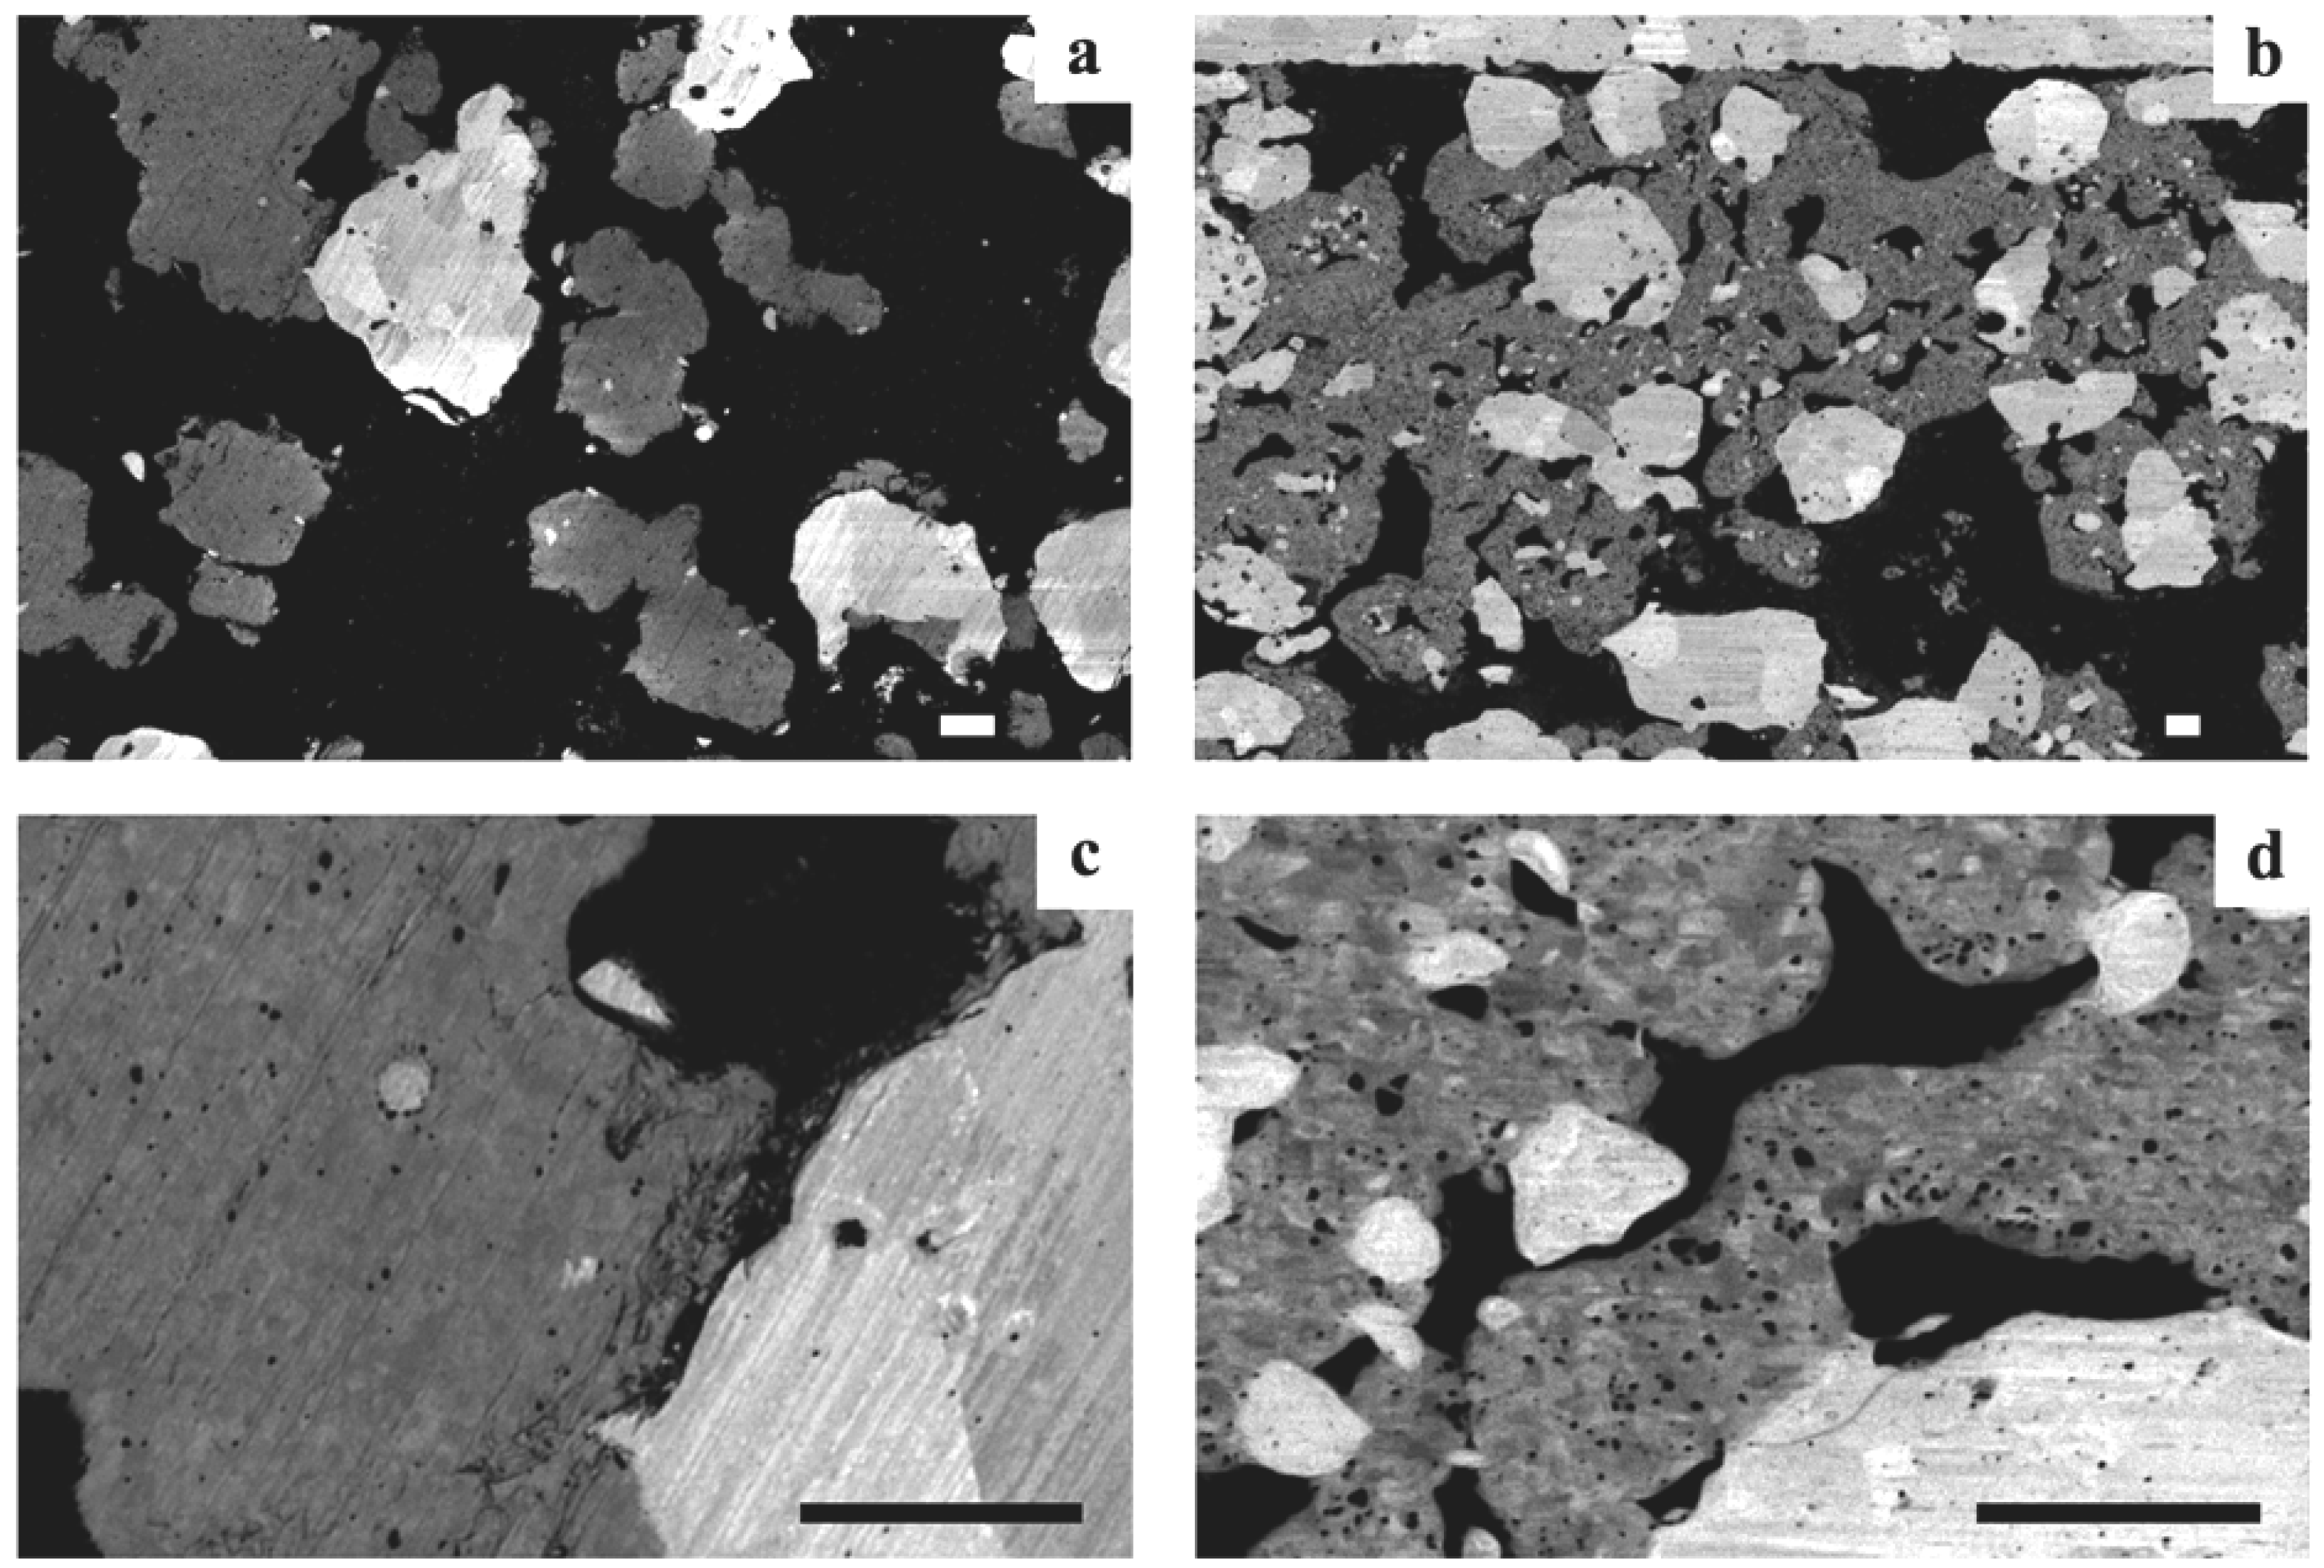
2.4.10. Micro and Nano-Structural Changes upon Redox Cycling

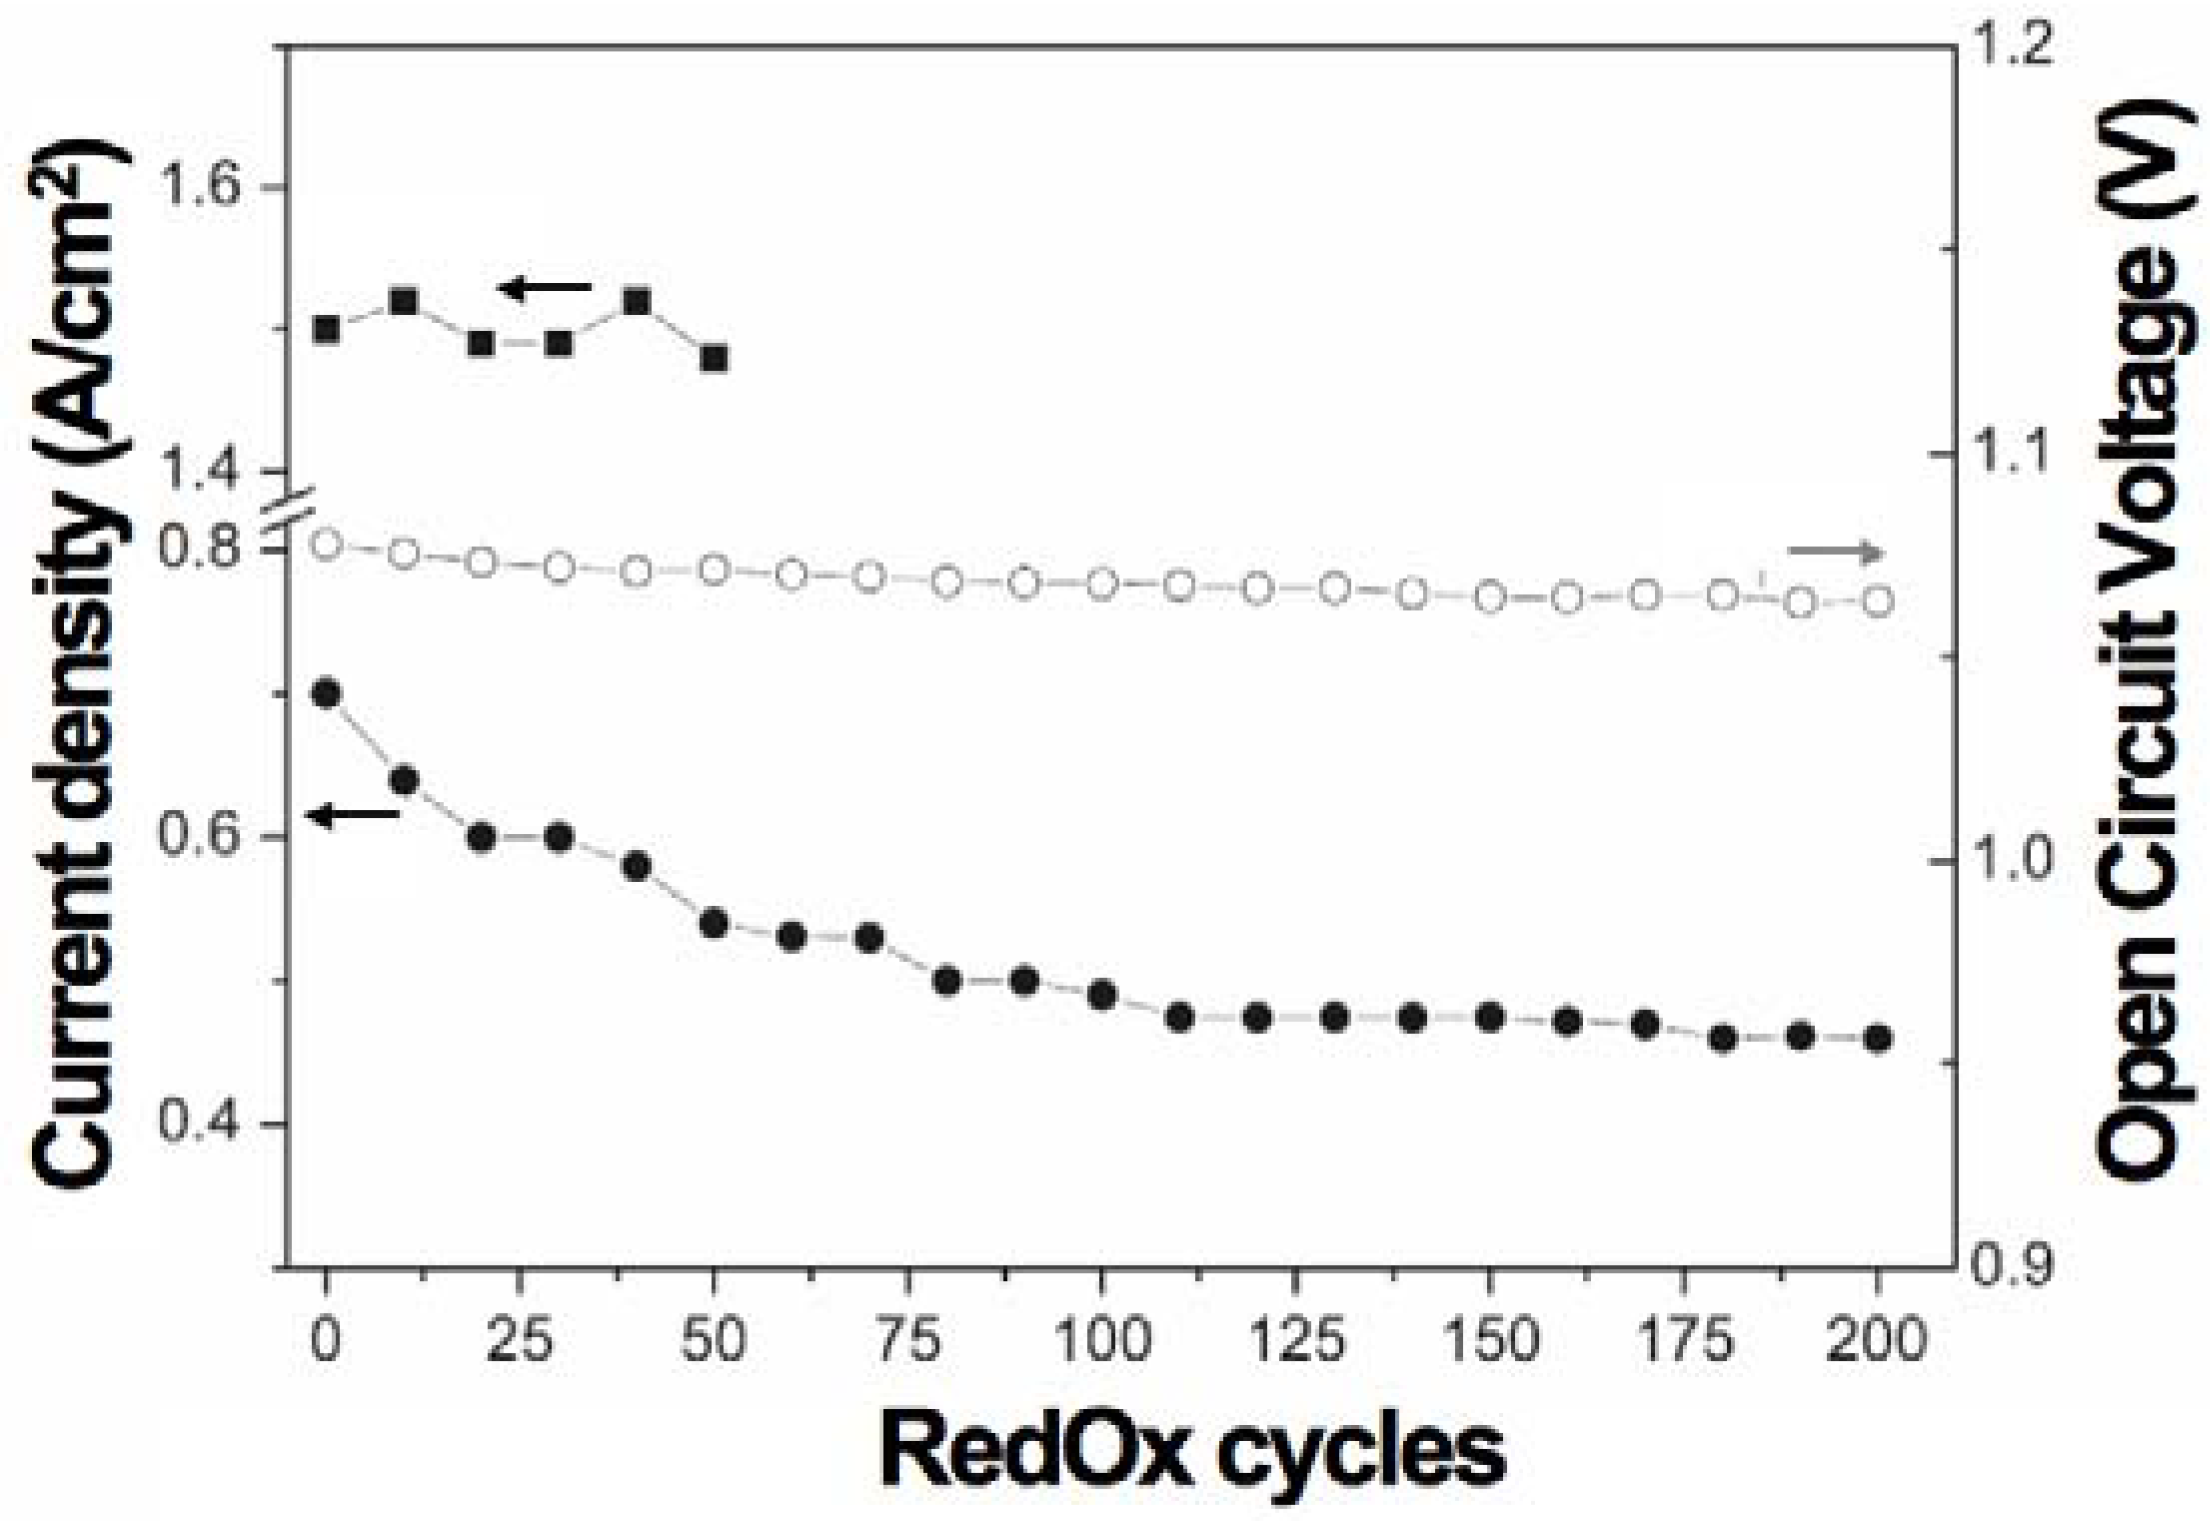
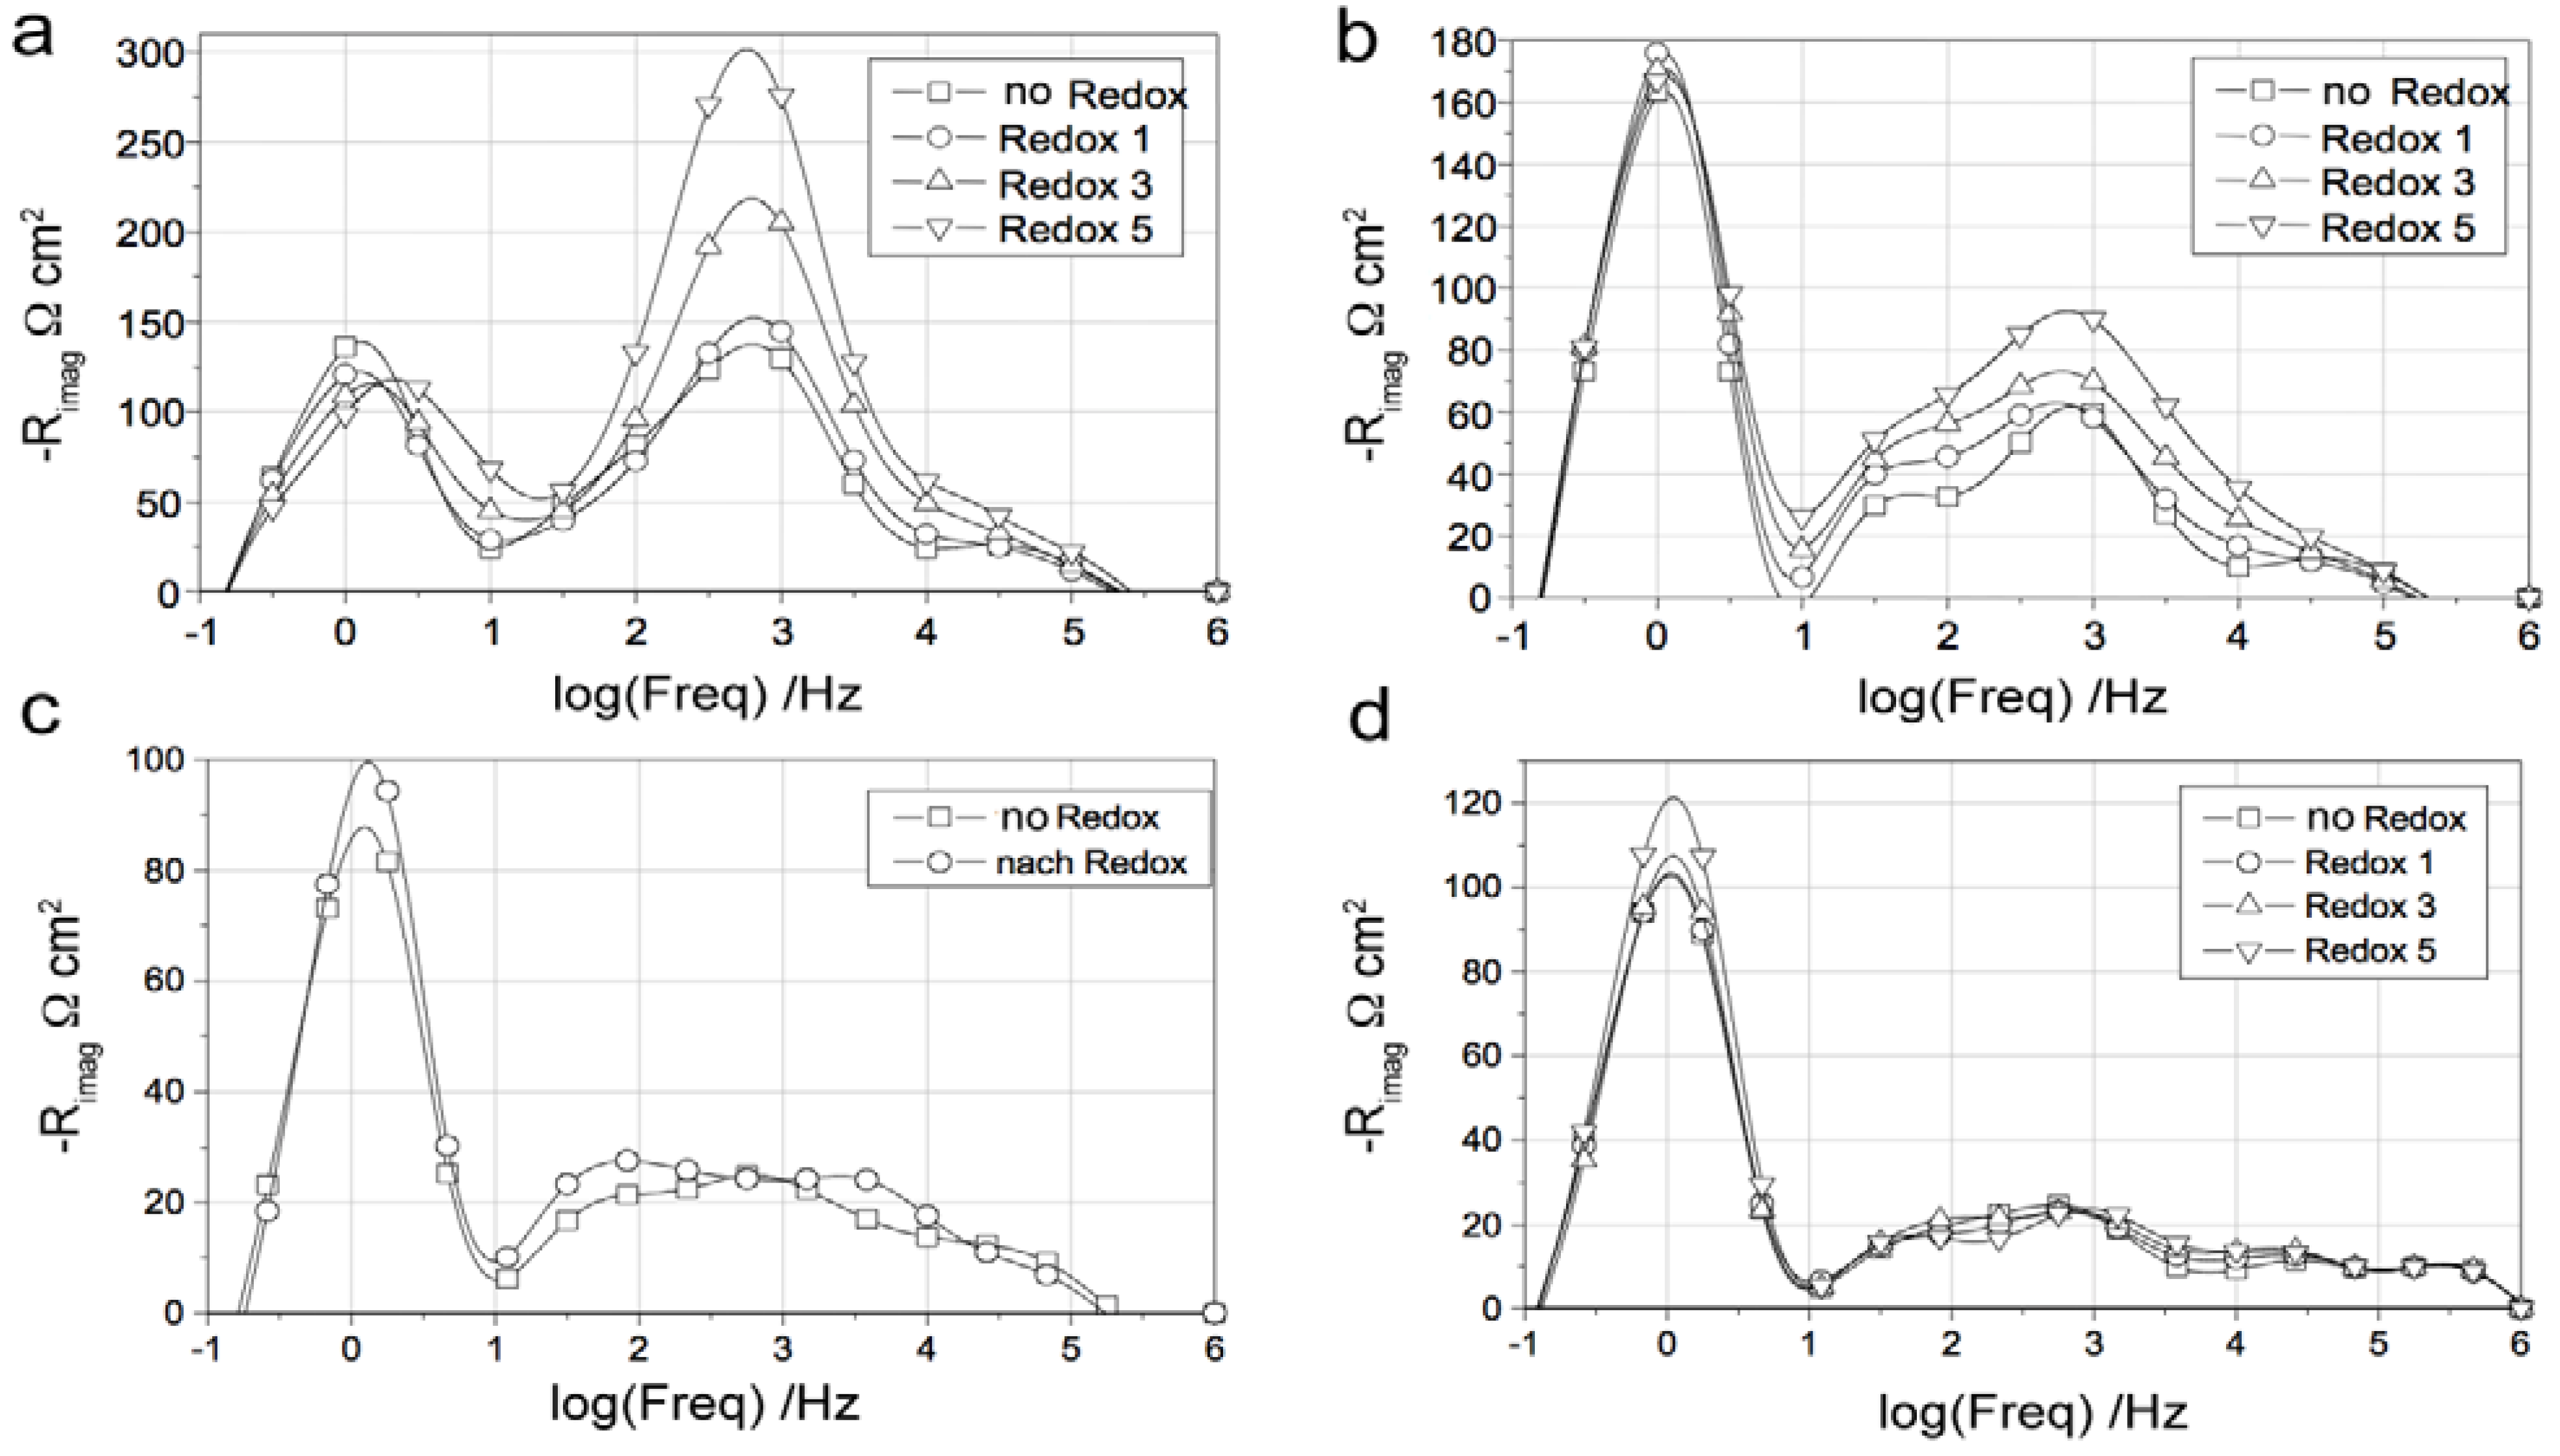
2.4.11. Electrochemical Performance and Electrochemical Impedance Spectroscopy

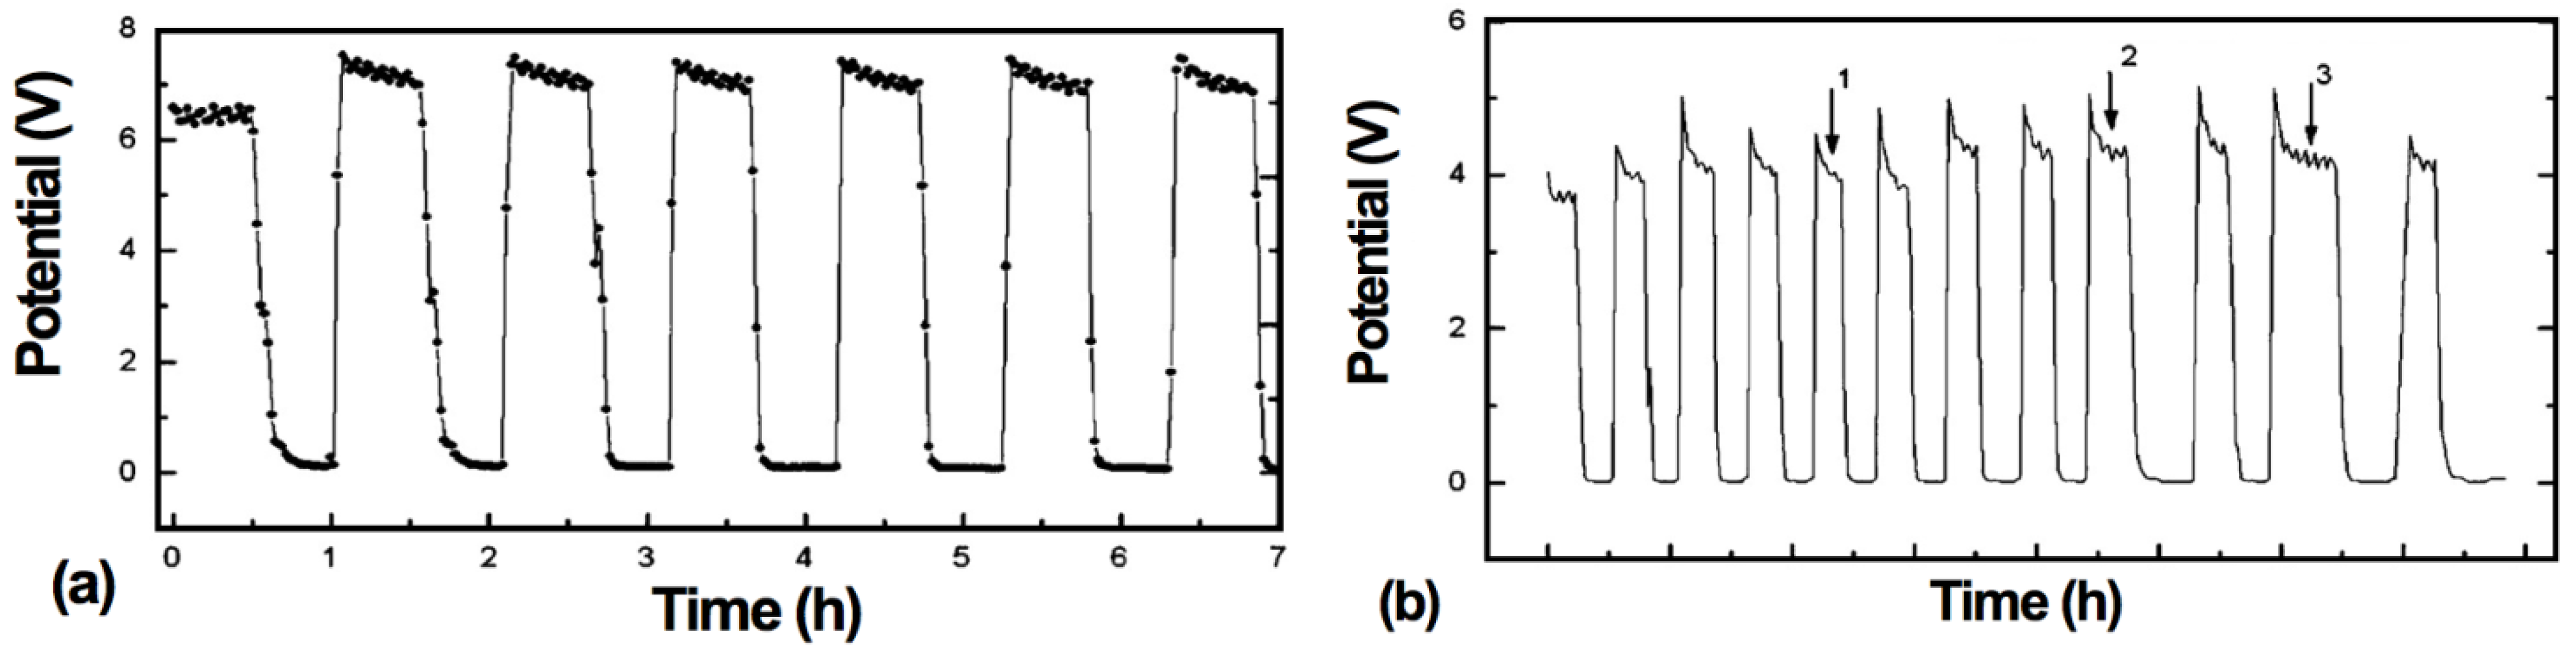
2.4.12. Single Chamber SOFC
2.5. Summary of the RedOx Instability
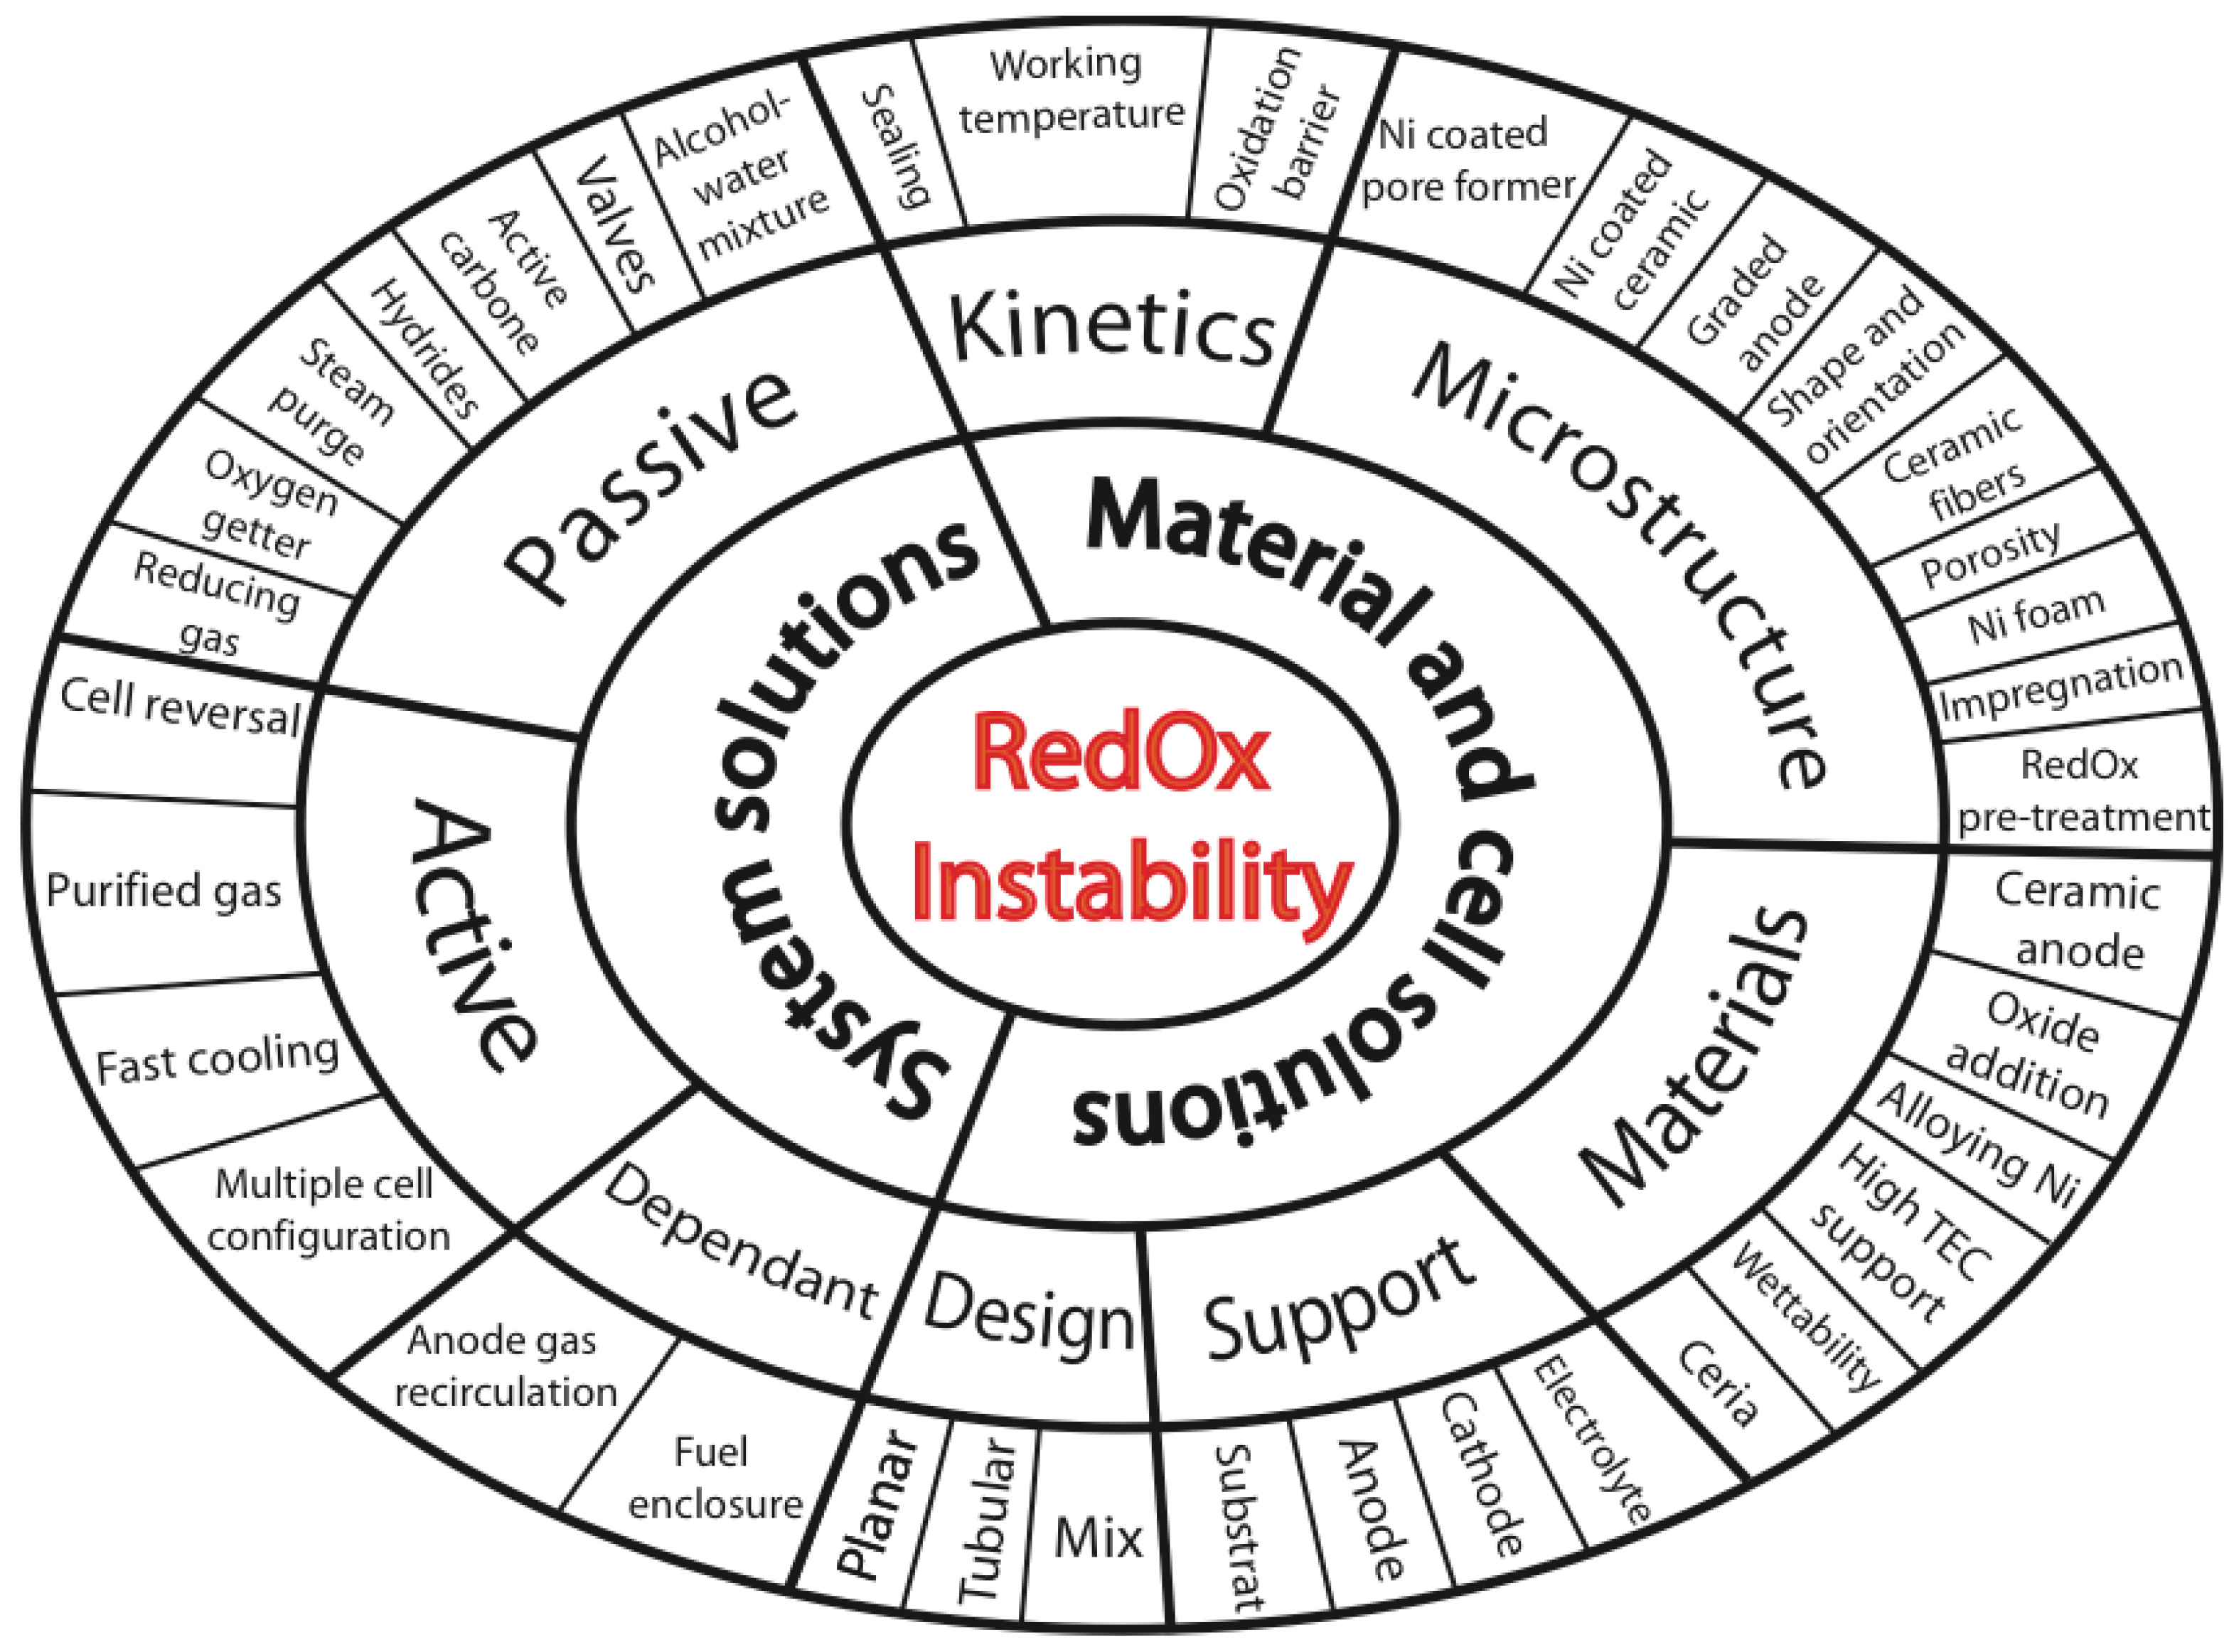
3. RedOx Solutions
- System solutions aim at keeping an oxygen partial pressure low enough to protect the anode from oxidation based on the global balance of plant of the SOFC system. They have two challenges: (1) compensate the RedOx limitation of anode materials; (2) include safety implementation of the anode and fuel processing gas. Hydrogen mixtures can explode below the autoignition temperature and carbon monoxide can be dangerous because of its flammability, toxicity and its propensity to react with nickel at a temperature below 230 °C to form the volatile and toxic nickel carbonyl.System solutions must protect the whole stack under normal events including varying power output, start-up and shutdown. But the unusual events are more dangerous for the stack, such as (1) system shutdown without fuel but with power available, and (2) emergency stop of the system (“blind shutdown”), without fuel and power.System solutions are grouped into dependent (to the system design), passive (no electrical power needed) and active (requiring the use of electrical power) measures.For small stacks (<1 kWe), system solutions are too expensive and good alternative ways must be found in the second approach.
- Materials, cell and stack design solutions, such as alternative anode materials or optimization of the anode composition and microstructure. This approach is clearly passive and its cost is likely to be minimal. Therefore, while giving a brief overview of system solutions, this review will focus more on materials and design solutions.
3.1. System Solutions
3.1.1. Dependent System Solutions

3.1.2. Passive System Solutions


3.1.3. Active System Solutions
3.2. Stack Design
3.2.1. Planar Design
3.2.2. Tubular Design
| T/°C | 52 RedOx cycles of 5 min, ∆i/i at 0.5 V | After first full oxidation cycle, ∆i/i at 0.5 V | Expansion during first full oxidation | Time to full oxidation (h) |
|---|---|---|---|---|
| 600 | −0.38%/cycle | −35% | 0.20% | 4.5 |
| 700 | −0.42%/cycle | −61% | 0.33% | 3.0 |
| 800 | −0.44%/cycle | −72% | 0.46% | 0.5 |
3.3. Cell Design
3.3.1. Cathode Supported Cell (CSC)
3.3.2. Electrolyte Supported Cell (ESC)
3.3.3. Metal Supported Cell (MSC)
3.3.4. Inert Substrate Supported Cells (ISSC)

3.3.5. Anode Supported Cell (ASC)
3.4. Modification of the Microstructure
3.4.1. Anode Functional Layer, Anode Support and Anode Current Collecting Layer

| Sample | Active functional layer | Current collecting layer |
|---|---|---|
| A | NiO (1 µm)-8YSZ (0.8 µm) | None |
| B | NiO (1 µm)-8YSZ (0.8 µm) | Ni-8YSZ (no sintering) |
| C | NiO (0.5 µm)-8YSZ (0.5 µm) | NiO (0.5 µm)-8YSZ (0.5 µm), sintered at 1250 °C |
| D | Ni(OH)2 (0.5 µm)-8YSZ (0.5 µm) | NiO (0.5 µm)-8YSZ (0.5 µm), sintered at 1250 °C |
3.4.2. Particles Size
3.4.3. Sintering Temperature
3.4.4. Porosity

3.4.5. Composition
3.4.6. Orientation and Particle Shape of Nickel Phase

3.4.7. Ni coated Pore-Former
3.4.8. Ni Foam
3.4.9. Wet Impregnation (WI)
3.4.10. Ni Coated Ceramic
3.4.11. Graded Composition and Porosity
(1) Anode functional layer
(2) Anode support

3.4.12. Controlled RedOx Cycle
3.5. Alternative Anode Materials
3.5.1. Alloys and Additives for Metal-Ceramic Anode
3.5.2. Full Ceramic Anode
- Negligible dimensional change during RedOx cycles (less than 0.1 to 0.2% of linear expansion).
- Electrical conductivity higher than 10 S/cm.
- Stability in reducing atmosphere and air and compatibility with the electrolyte.
- Thermal expansion coefficient close to that of the electrolyte. In case of YSZ: between 10 and 11 × 10−6 K−1.
- Good catalytic activity for H2 and CH4 oxidation. In case of mixed conductivity the ionic conductivity should be >0.02 S/cm.
| Materials | CTE (10−6 K−1) | Electronic conductivity (S/cm) | Ionic conductivity (S/cm) | Polarization resistance | RedOx stability |
|---|---|---|---|---|---|
| CeO2 | 12 | 0.5–1 | 0.1–0.2 | ++ | – |
| ZrTiY-oxide | 10 | 0.1 | 0.01 | + | ++ |
| LaSrCrRu-oxide | 10 | 0.6 | small | ++ | + |
| LaSrFeCr-oxide | 12 | 0.5 | ? | ++ | + |
| LaSrCrMn-oxide | 10 | 3 | ? | +++ | ++ |
| LaSrCrV-oxide | 10 | ? | ? | ++ | ++ |
| SrYTi-oxide | 11–12 | 80 | small | + | +++ |
| LaSrTi-oxide | 10 | 40 | small | ++ | +++ |
| Nb2TiO7 | 1–2 | 200 | very small | – | – |
| GdTiMoMn-oxide | ? | 0.1 | reasonable | + | – |
| BaCe0.8Y0.2O3 | ? | 0.02 | ? | – | ++ |

3.5.3. Mechanically Stronger Materials
3.5.4. Use Support with Higher Thermal Expansion Coefficient (TEC)
3.6. Kinetics
3.6.1. Oxidation Barrier
3.6.2. Improved Sealing
3.6.3. Lower Operating Temperature
4. Synthesis for Ni-Based Anode-Supported Cells


5. Conclusions
- (1)
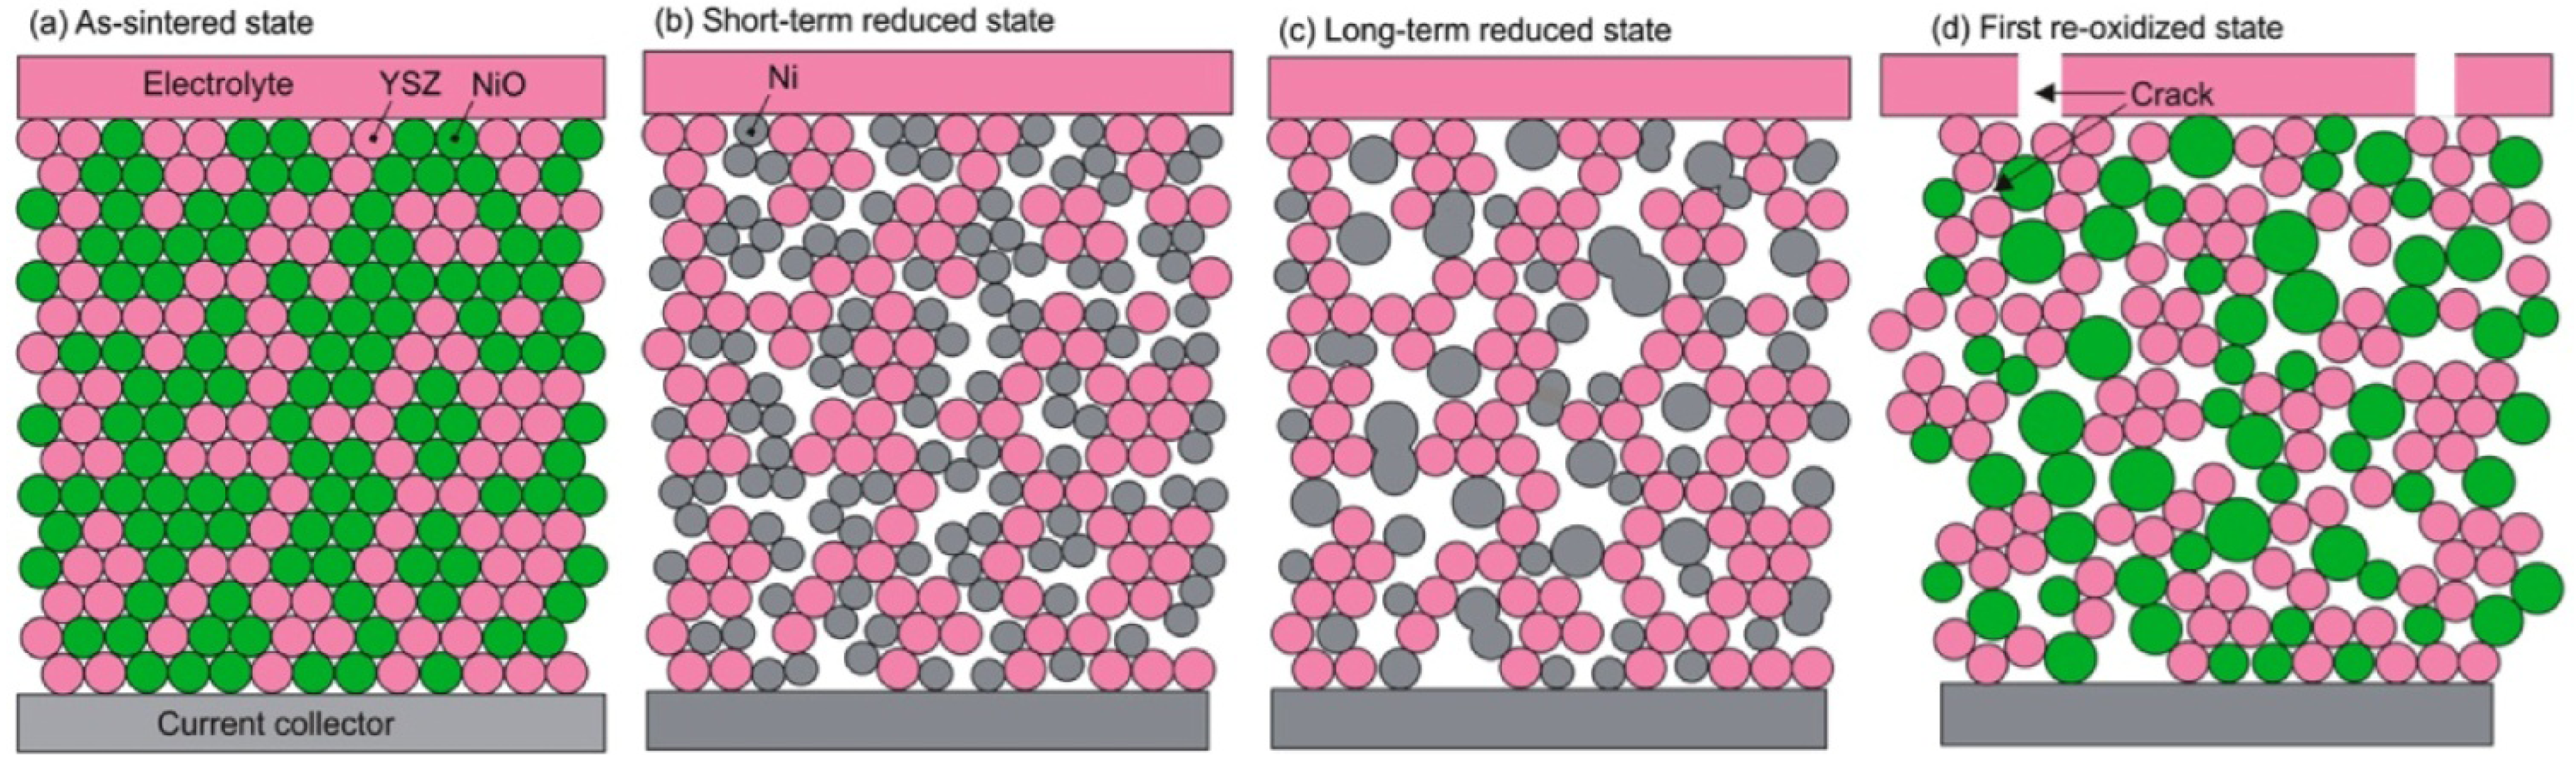
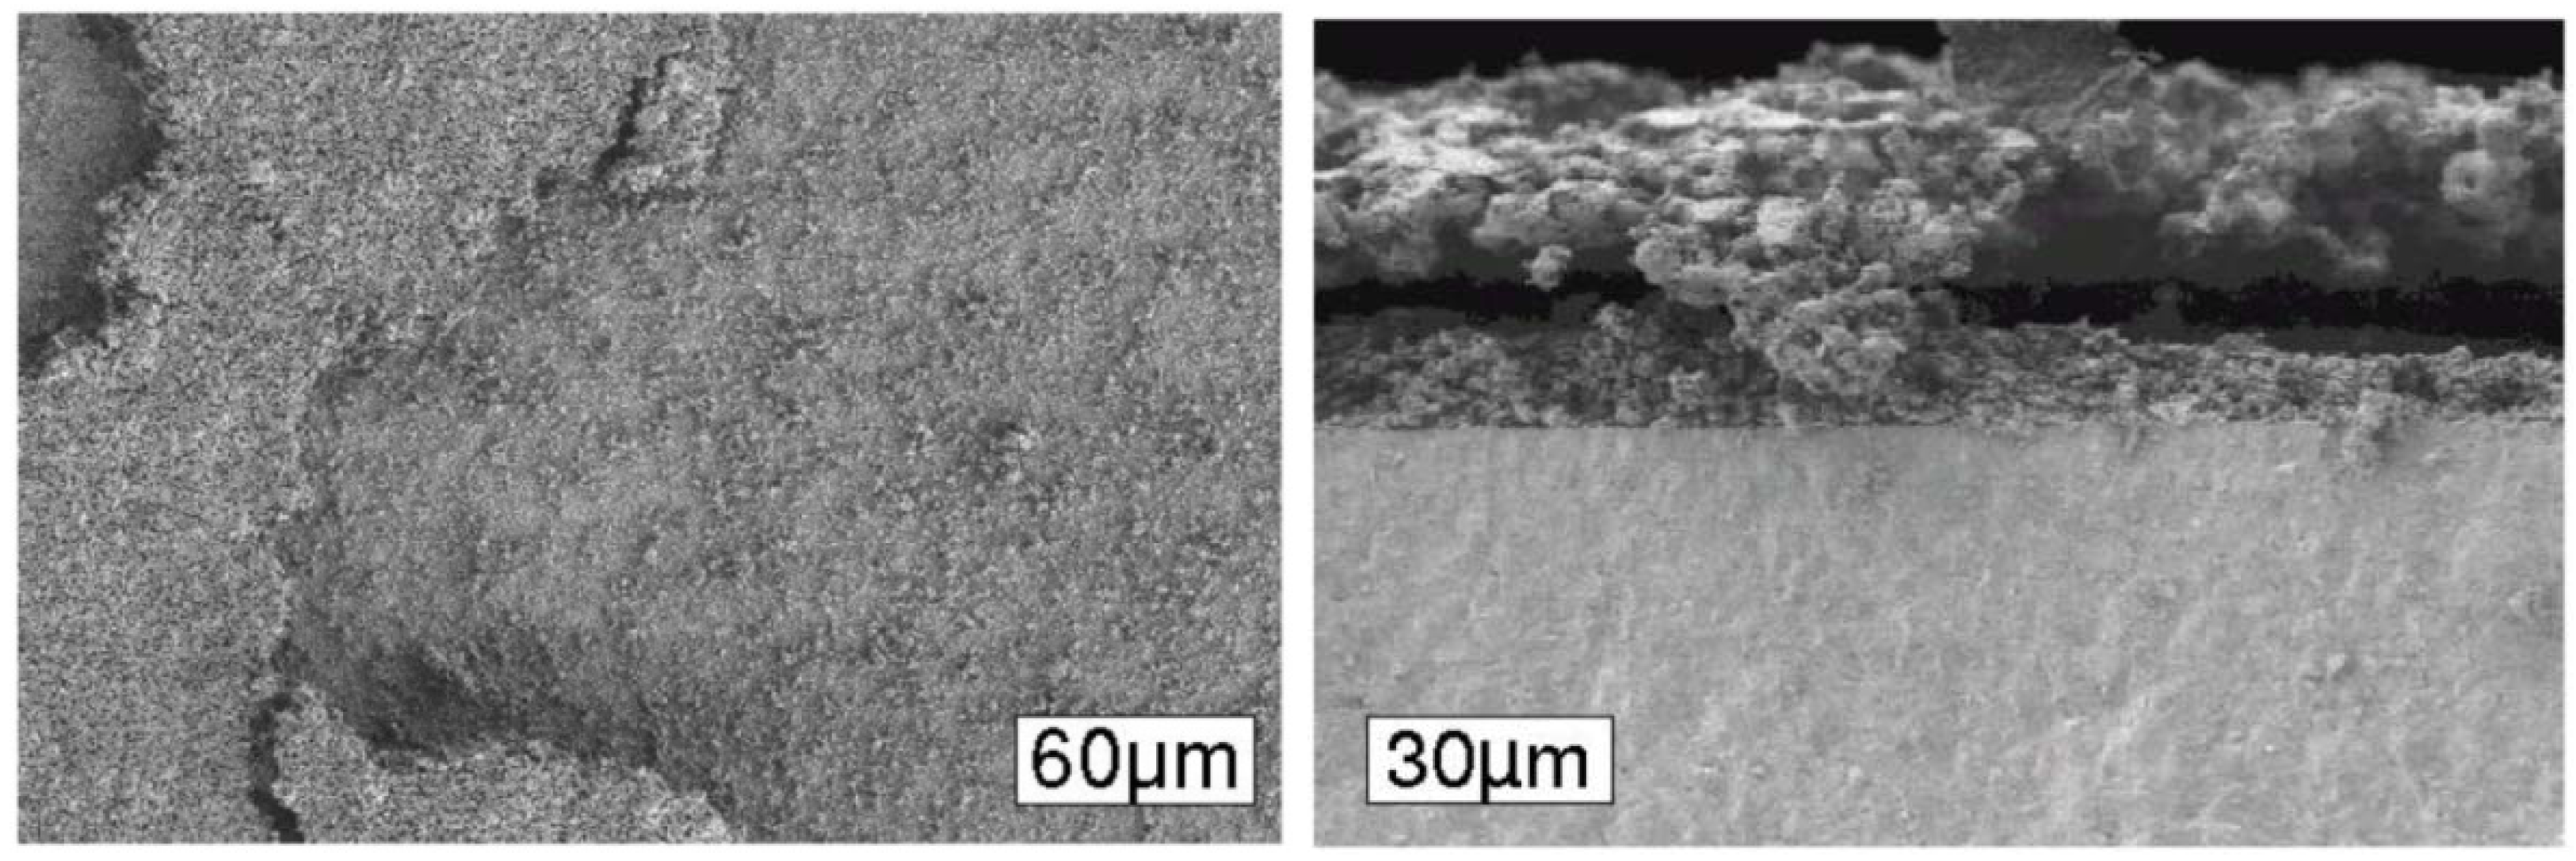
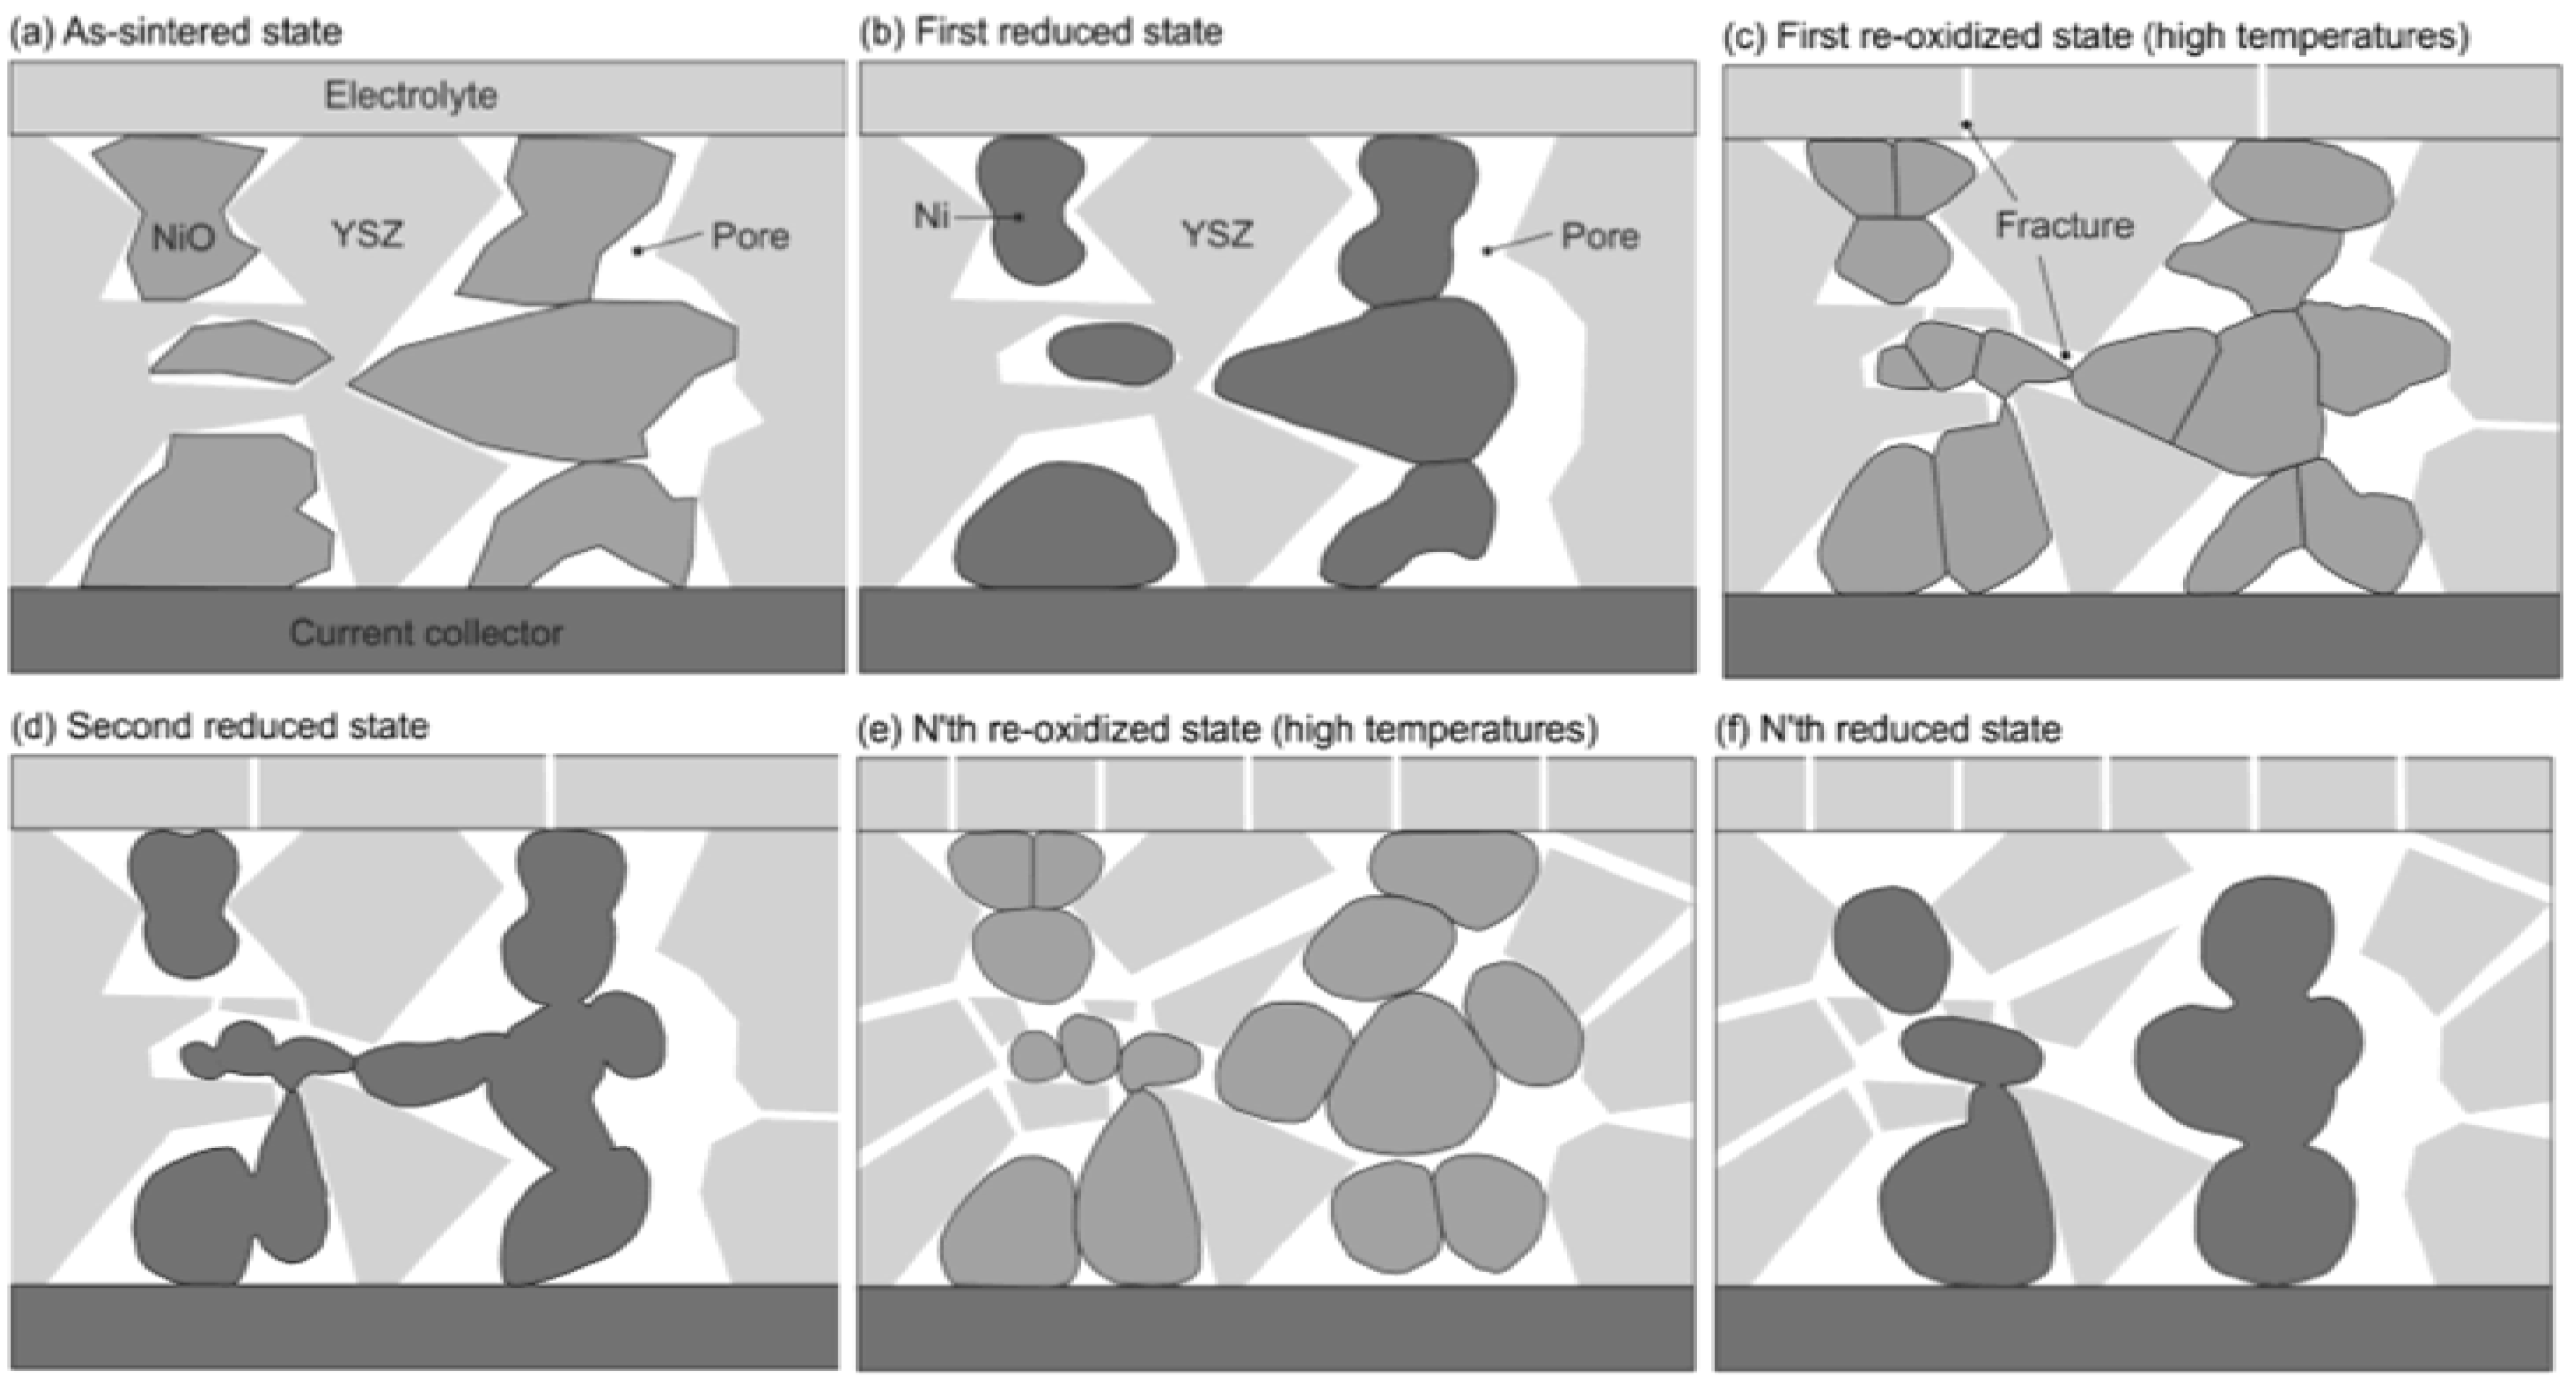
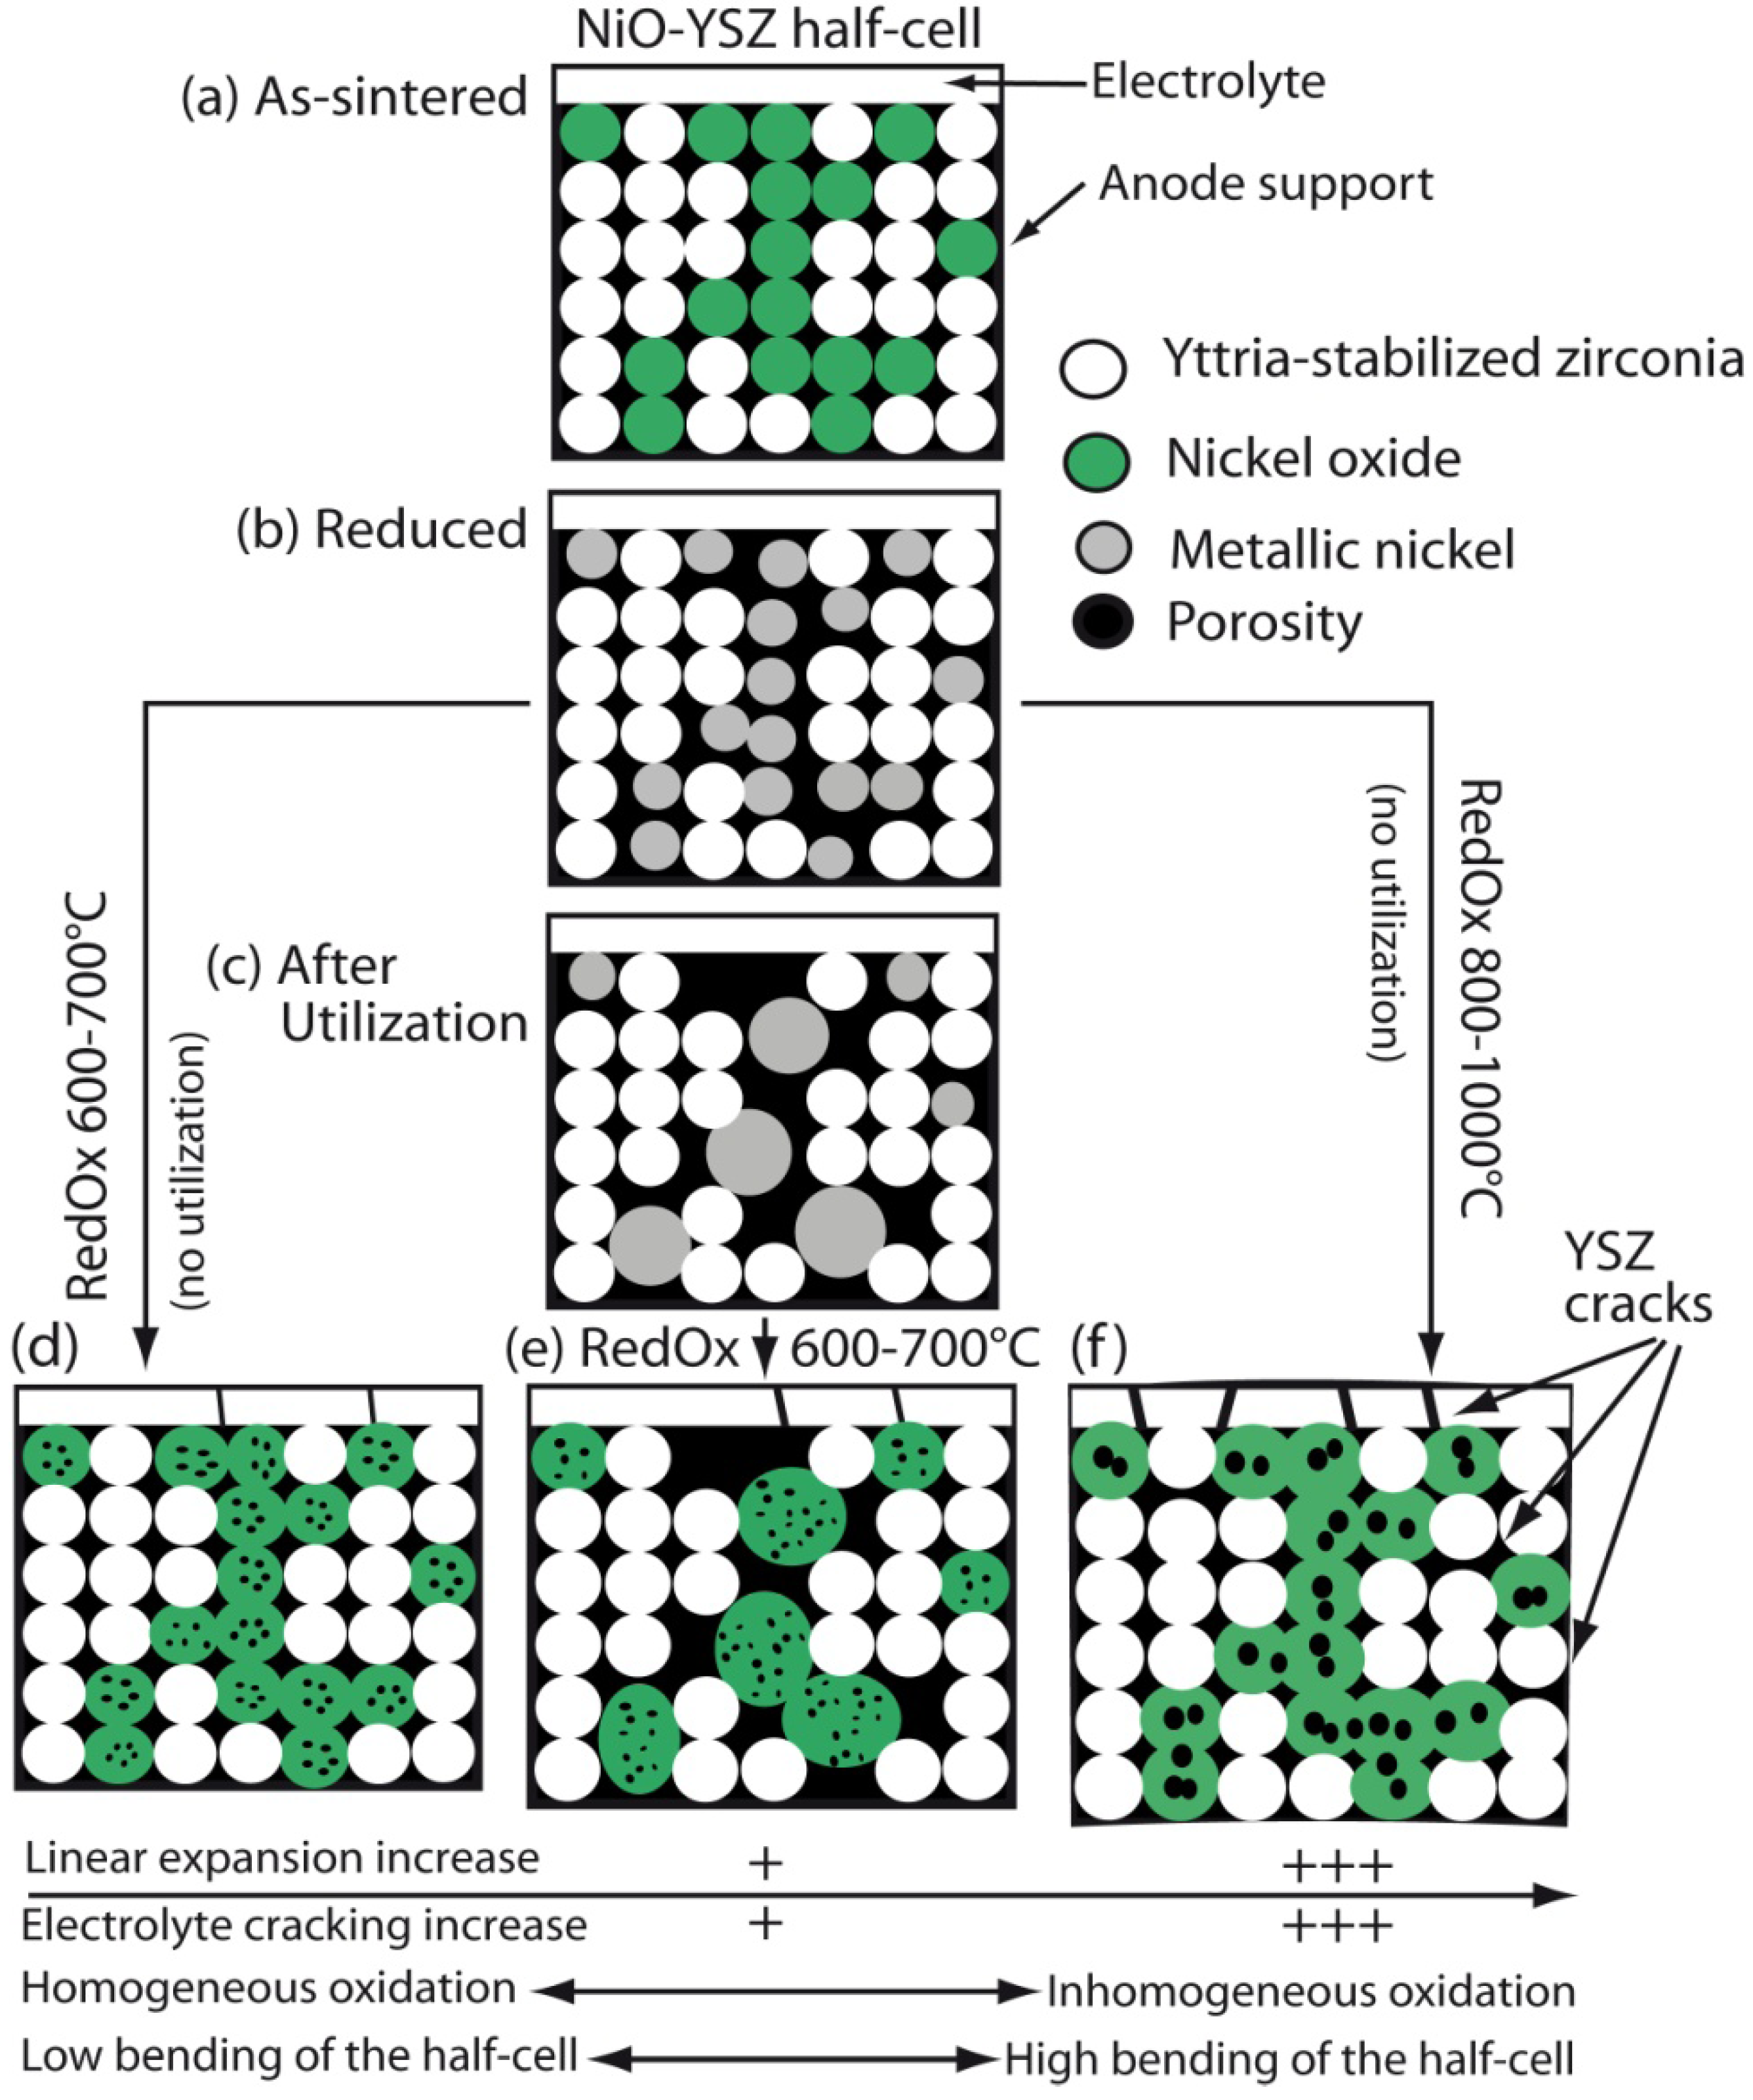
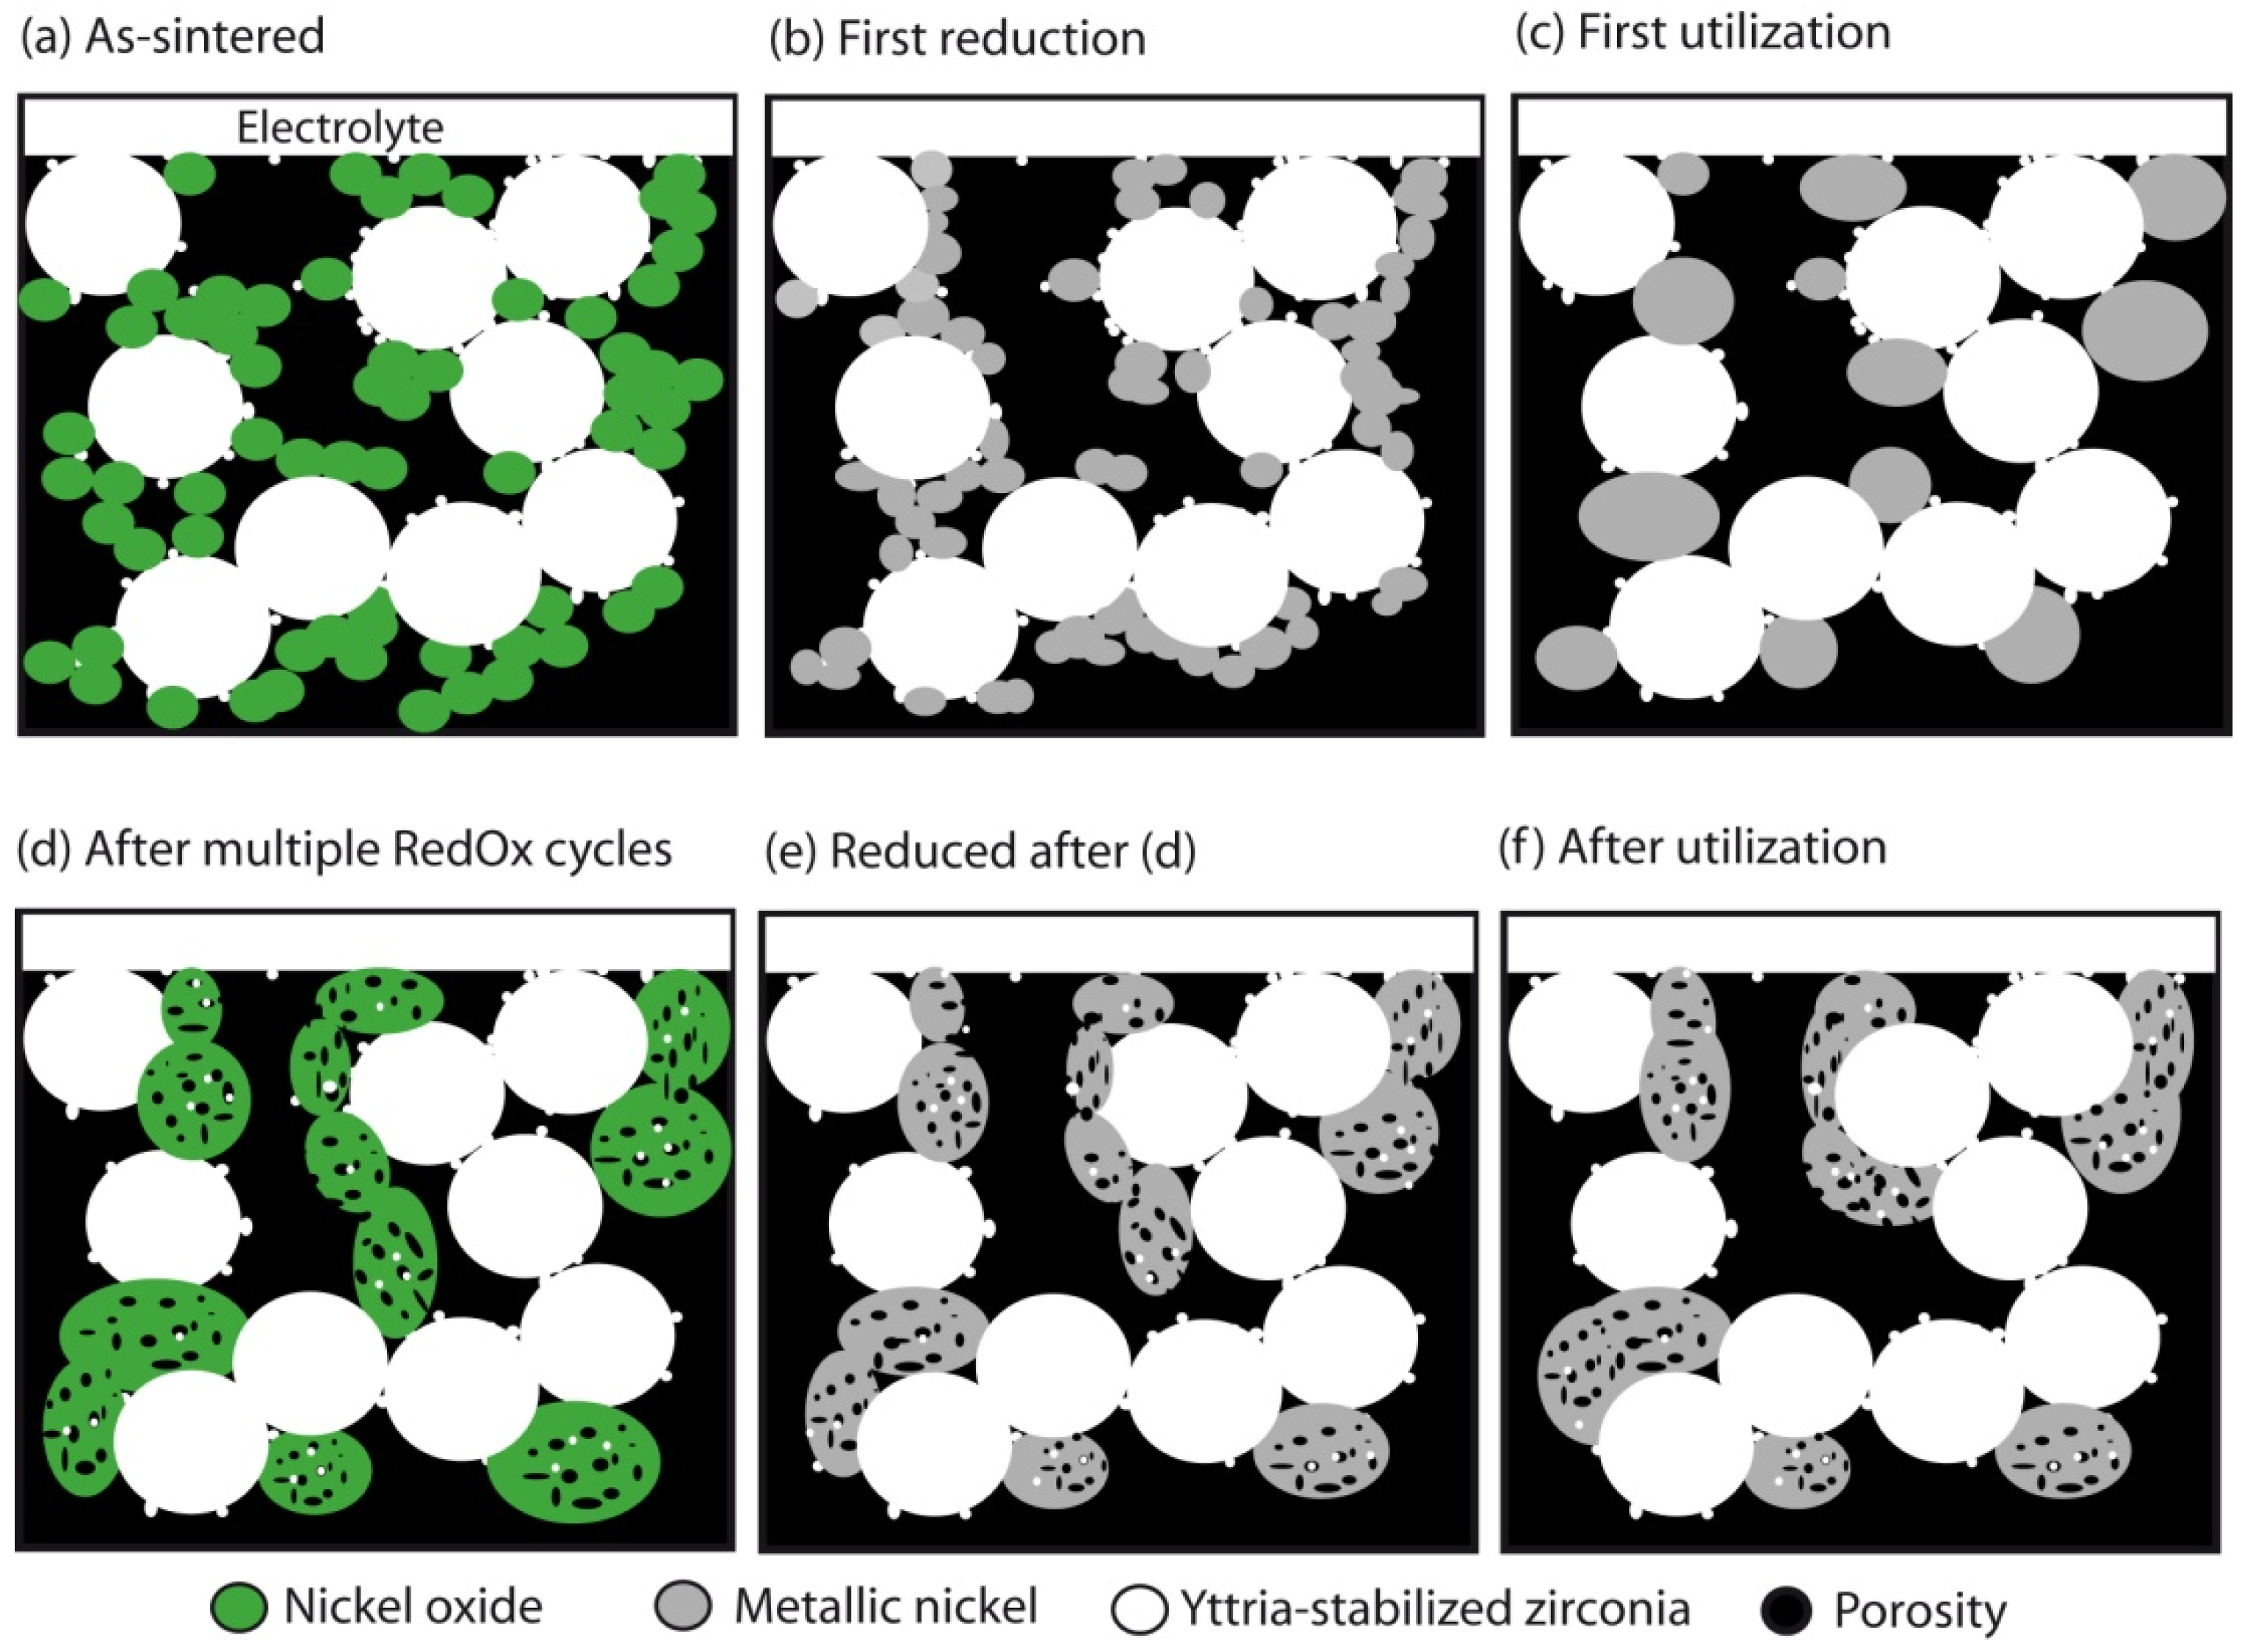
- The internal porosity of NiO increases after reoxidation. The oxidation is governed by cationic diffusion: Outward diffusion of Ni2+ creates pseudo-Kirkendall porosity within the NiO particles.
- (2)
- The nickel coarsening during anode utilization creates a rearrangement of the phase. During reoxidation NiO does not reoccupy its original sites. Water vapor presence increases coarsening of the nickel phase.
- (3)
- Higher temperature (>700 °C) induces inhomogeneous oxidation (only the outer surface layer is oxidized) that produces bending of the cell. This can increase the stress in the thin electrolyte.
- (4)
- Low partial pressure of oxygen and high water vapor pressure induce inhomogeneous oxidation similar to the one described under (3).
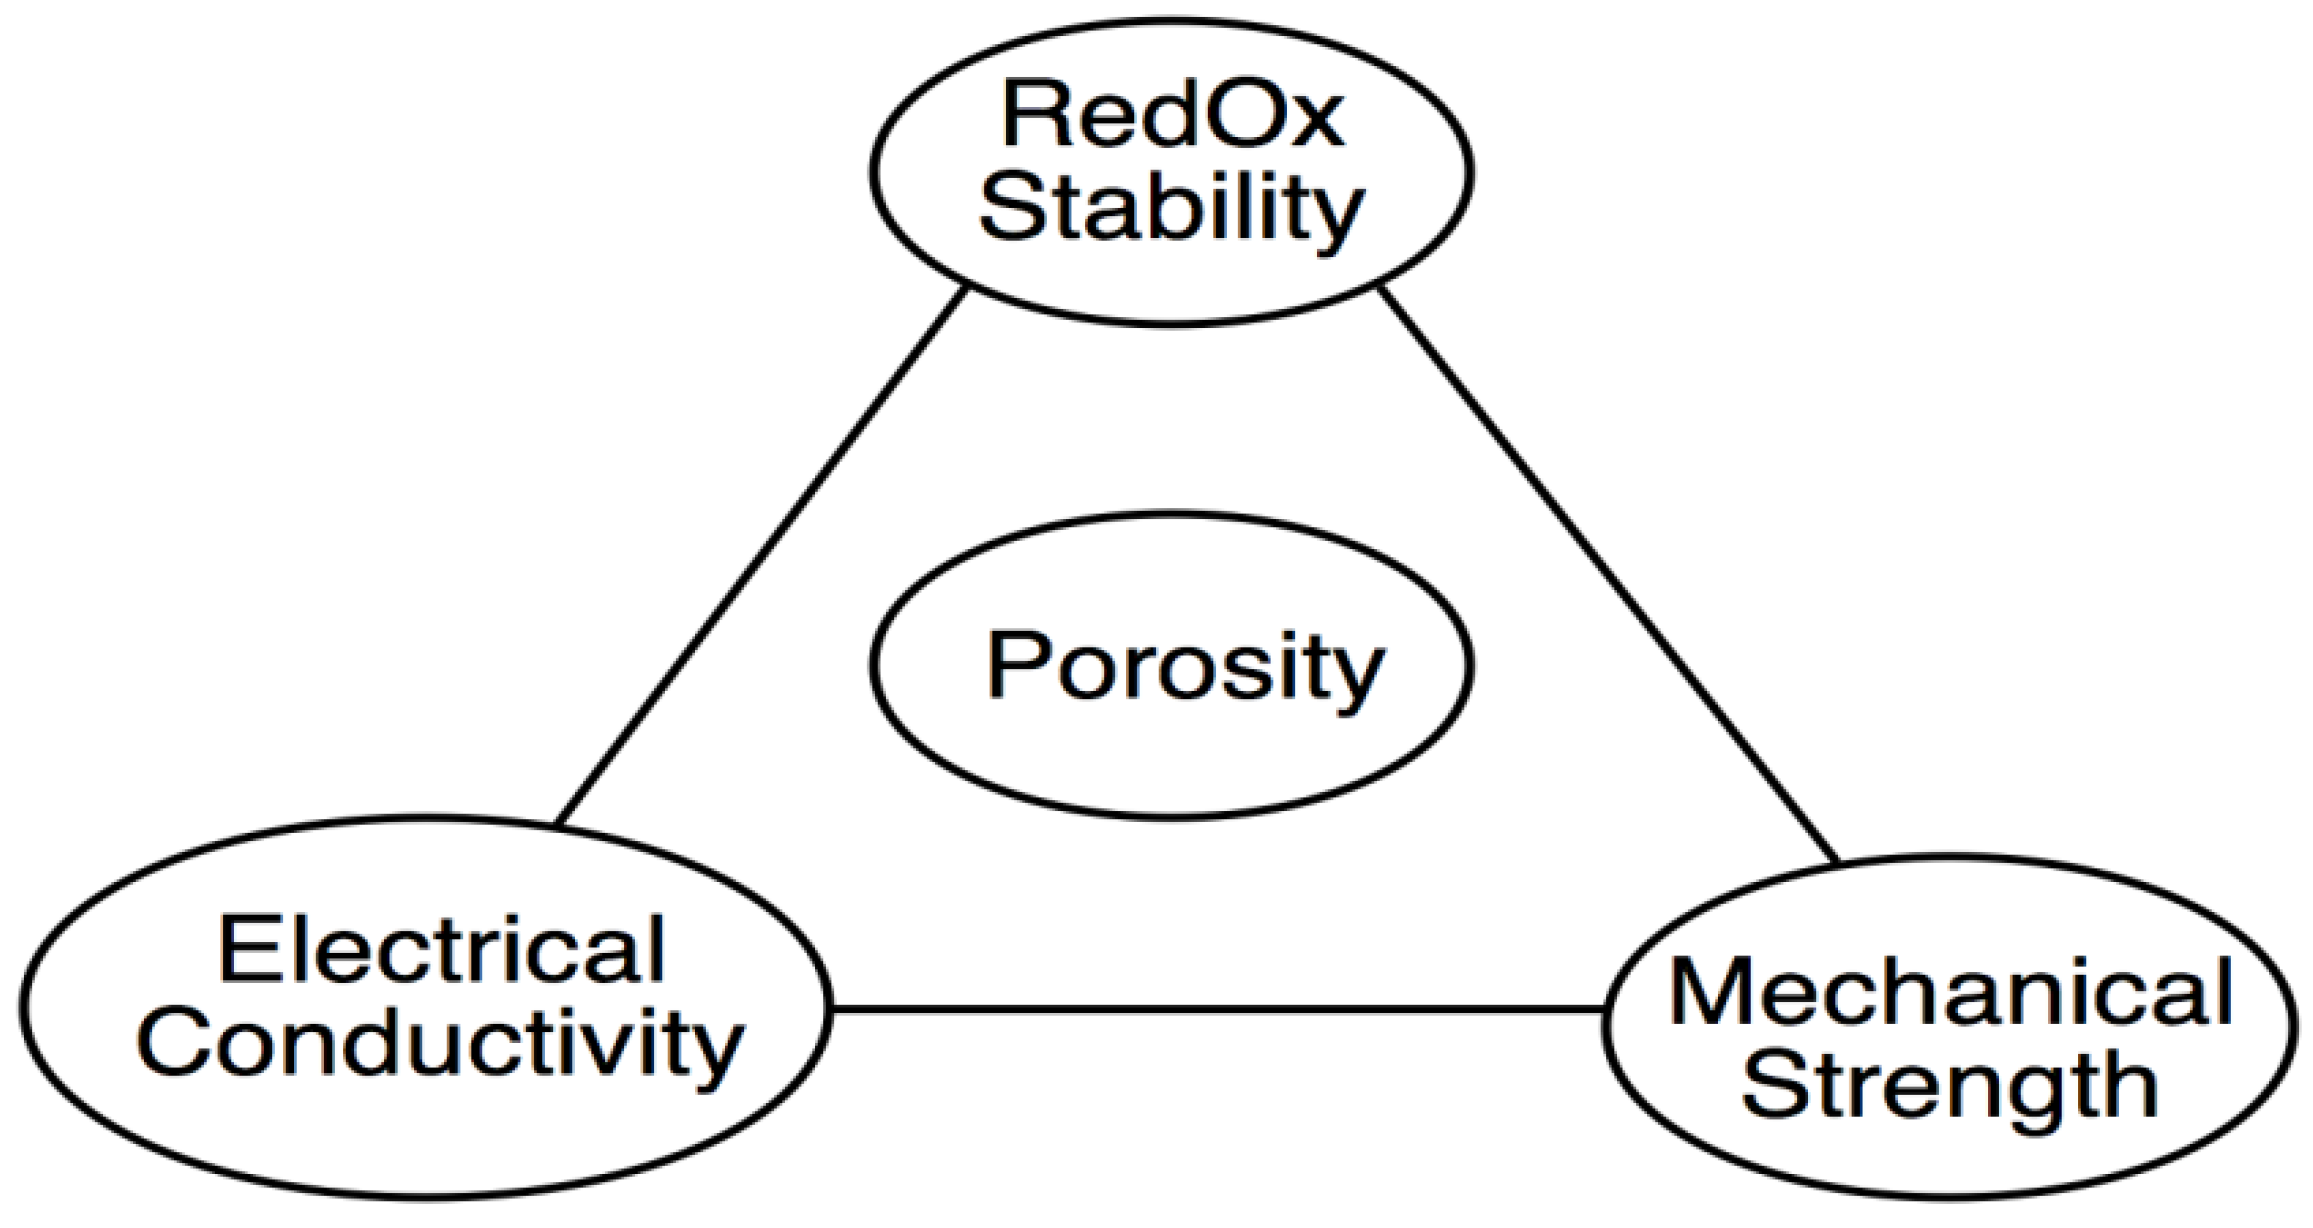
- (1)
- Porosity enhancement.
- (2)
- Graded composition with more YSZ close to the electrolyte and the gas outlet to reach higher fuel utilization.
- (3)
- Particle size and particle size ratio between NiO and YSZ. Coarse microstructures are more RedOx stable.
- (4)
- Lower sintering temperature.
- (5)
- Ni foam and Ni-coated pore-former and ceramic phase.
- (6)
- Ni wet impregnation of the ceramic skeleton. The important drawback of this technique is the multiple impregnation and calcination cycles needed to reach even then only a few wt % of impregnated Ni.
List of Variables
| Cp,m | Molar heat capacity (J/mol K) |
| dV50 | Mean particle size in volume (µm) |
| D | Diffusion coefficient (m2/s) |
| δ | Thickness of the NiO grain boundaries (m) |
| Ea | Activation energy (kJ/mol) |
| E | Young modulus of the electrolyte (GPa) |
| εox | Oxidation strain (–) |
| F | Faraday constant = 96485 (A s/mol) |
| Fu | Fuel utilization (%) |
| GASC | Stored energy release rate (J/m2) |
| Gc | Critical energy release rate (J/m2) |
| ∆G | Gibbs free energy (J/mol) |
| g | the grain size (m) |
| v | Poisson ratio (–) |
| h | Electrolyte thickness (m) |
| ∆H | Enthalpy (J/mol) |
| i | Current density (A/cm2) |
| k | Reaction rate (1/s) |
| k0 | Reaction rate constant(1/s) |
| M | Molar mass (g/mol) |
| pO2 | Partial pressure of O2 (–) |
| R | Gas constant = 8.314 (J/mol K) |
| Rp | Polarization resistance (Ohm cm2) |
| Rs | Ohmic resistance (Ohm cm2) |
| ρ | Density (g/cm3) |
| T | Temperature (°C or K) |
| t | Time (s) |
| U | Cell potential (V) |
| V | Molar volume (cm3/mol) |
| x | Degree of conversion (–) |
| y | Oxide layer thickness (m) |
List of Abbreviations
| AFL | Anode functional layer |
| AS | Anode support |
| ASC | Anode supported cell |
| ASR | Area specific resistance (Ohm cm2) |
| CCL | Current collecting layer |
| CFD | Computational fluid dynamics |
| CGO | Ceria gadolinia oxide |
| CRS | Cumulative RedOx strain |
| CSC | Cathode supported cell |
| CTE | Coefficient of thermal expansion |
| DoE | Design of experiment |
| DoO | Degree of oxidation |
| EIT | Impulse excitation technique |
| EP | Electrochemical performances |
| ESC | Electrolyte supported cell |
| FEM | Finite element modeling |
| FIB | Focused ion beam |
| GDC | Gadolinia doped ceria |
| ISSC | Inert substrate supported cell |
| FZJ | Forschungszentrum Jülich |
| LSCF | LaSrCrFe-oxide |
| LSCM | LaSrCrMg-oxide |
| LSCV | LaSrCrV-oxide |
| LSGM | LaSrGaMg-oxide |
| LSM | LaSrMn-oxide |
| LST | LaSrTi-oxide |
| MSC | Metal supported cell |
| OCV | Open circuit voltage |
| RedOx cycle | reduction-oxidation cycle |
| RT | Room temperature |
| SRU | Single Repeating unit |
| ScSZ | Scandia stabilized zirconia |
| SDC | Samarium doped ceria |
| SEM | Scanning electron microscopy |
| SIS | Segmented-in-series |
| SOFC | Solid oxide fuel cell |
| SOEC | Solid oxide electrolyzer cell |
| SSC | SmSrCo-oxide |
| SYT | SrYTi-oxide |
| TEC | Thermal expansion coefficient |
| TEM | Transmission electron microscopy |
| TGA | Thermogravimetric analysis |
| TPB | Triple phase boundary |
| TPR | Temperature programmed reduction |
| TZP | Partially stabilized zirconia |
| WI | Wet impregnation |
| XRD | X-ray diffraction |
| YSZ | Yttria stalilized zirconia |
Appendix
| Cell type | Anode and support materials | OCV %/Cy a | EP %/Cycle b | RedOx conditions | RedOx c | Cell d | Active Surf e | Source reference |
|---|---|---|---|---|---|---|---|---|
| Planar Design | ||||||||
| Anode Supported Cell | Ni-YSZ | −56 | – | 850 °C, fuel gas off, 4 min | 1 | 1 | – | Cassidy et al. [10] |
| SYT-YSZ AFL impregnated with 3 wt % NiO on SYT | ~0 | −0.2, i at 0.7 V | 750 °C, air, 10 min | 200 | 1 | 1 | Ma et al. [261,262] | |
| SYT-YSZ AFL impregnated with 3 wt % NiO on SYT | −2 | +14.6, i at 0.6 V | 750 °C, air, 5 h | 2 | 1 | 1 | Ma et al. [261,262] | |
| Ni-YSZ AS | 0 | −2.3, i at 0.6 V+4.5, ASR 0.65–0.85 V | 800 °C, full RedOx cycle, flowing air | 11 | 1 | 1 | Faes et al. [186] | |
| Ni-YSZ AS | 0 | −2.5, i at 0.6 V | 800 °C, full RedOx cycle, flowing air | 12 | 1 | 1 | Faes et al. [187] | |
| Ni-YSZ AS | −0.1 | +1.75, i at 0.75 V | 800 °C, full RedOx cycle, fuel gas off | 40 | 1 SRU | 48 | Faes et al. [187] | |
| Ni-YSZ AFL on Ni-YSZ AS | −0.75 | −1.48, U at 0.75 A/cm2 | 750 °C, blowing air at 0.12 l/min for 20, 40, 60, 120, 240 and 360 min. | 6 | 1 SRU | 80 | Waldbilig et al. [124] | |
| Ni-YSZ AFL on Ni-YSZ AS | – | −0.08, U at 0.75 A/cm2 | 750 °C, steam purge on Ni bed. | 32 | 1 SRU | 80 | Wood et al. [144] | |
| Ni-YSZ AFL on Ni-YSZ AS | – | 0, U at 0.5 A/cm2 | 750 °C, fuel gas off valves closed, 15 h. | 1 | 1 SRU | 80 | Wood et al. [144] | |
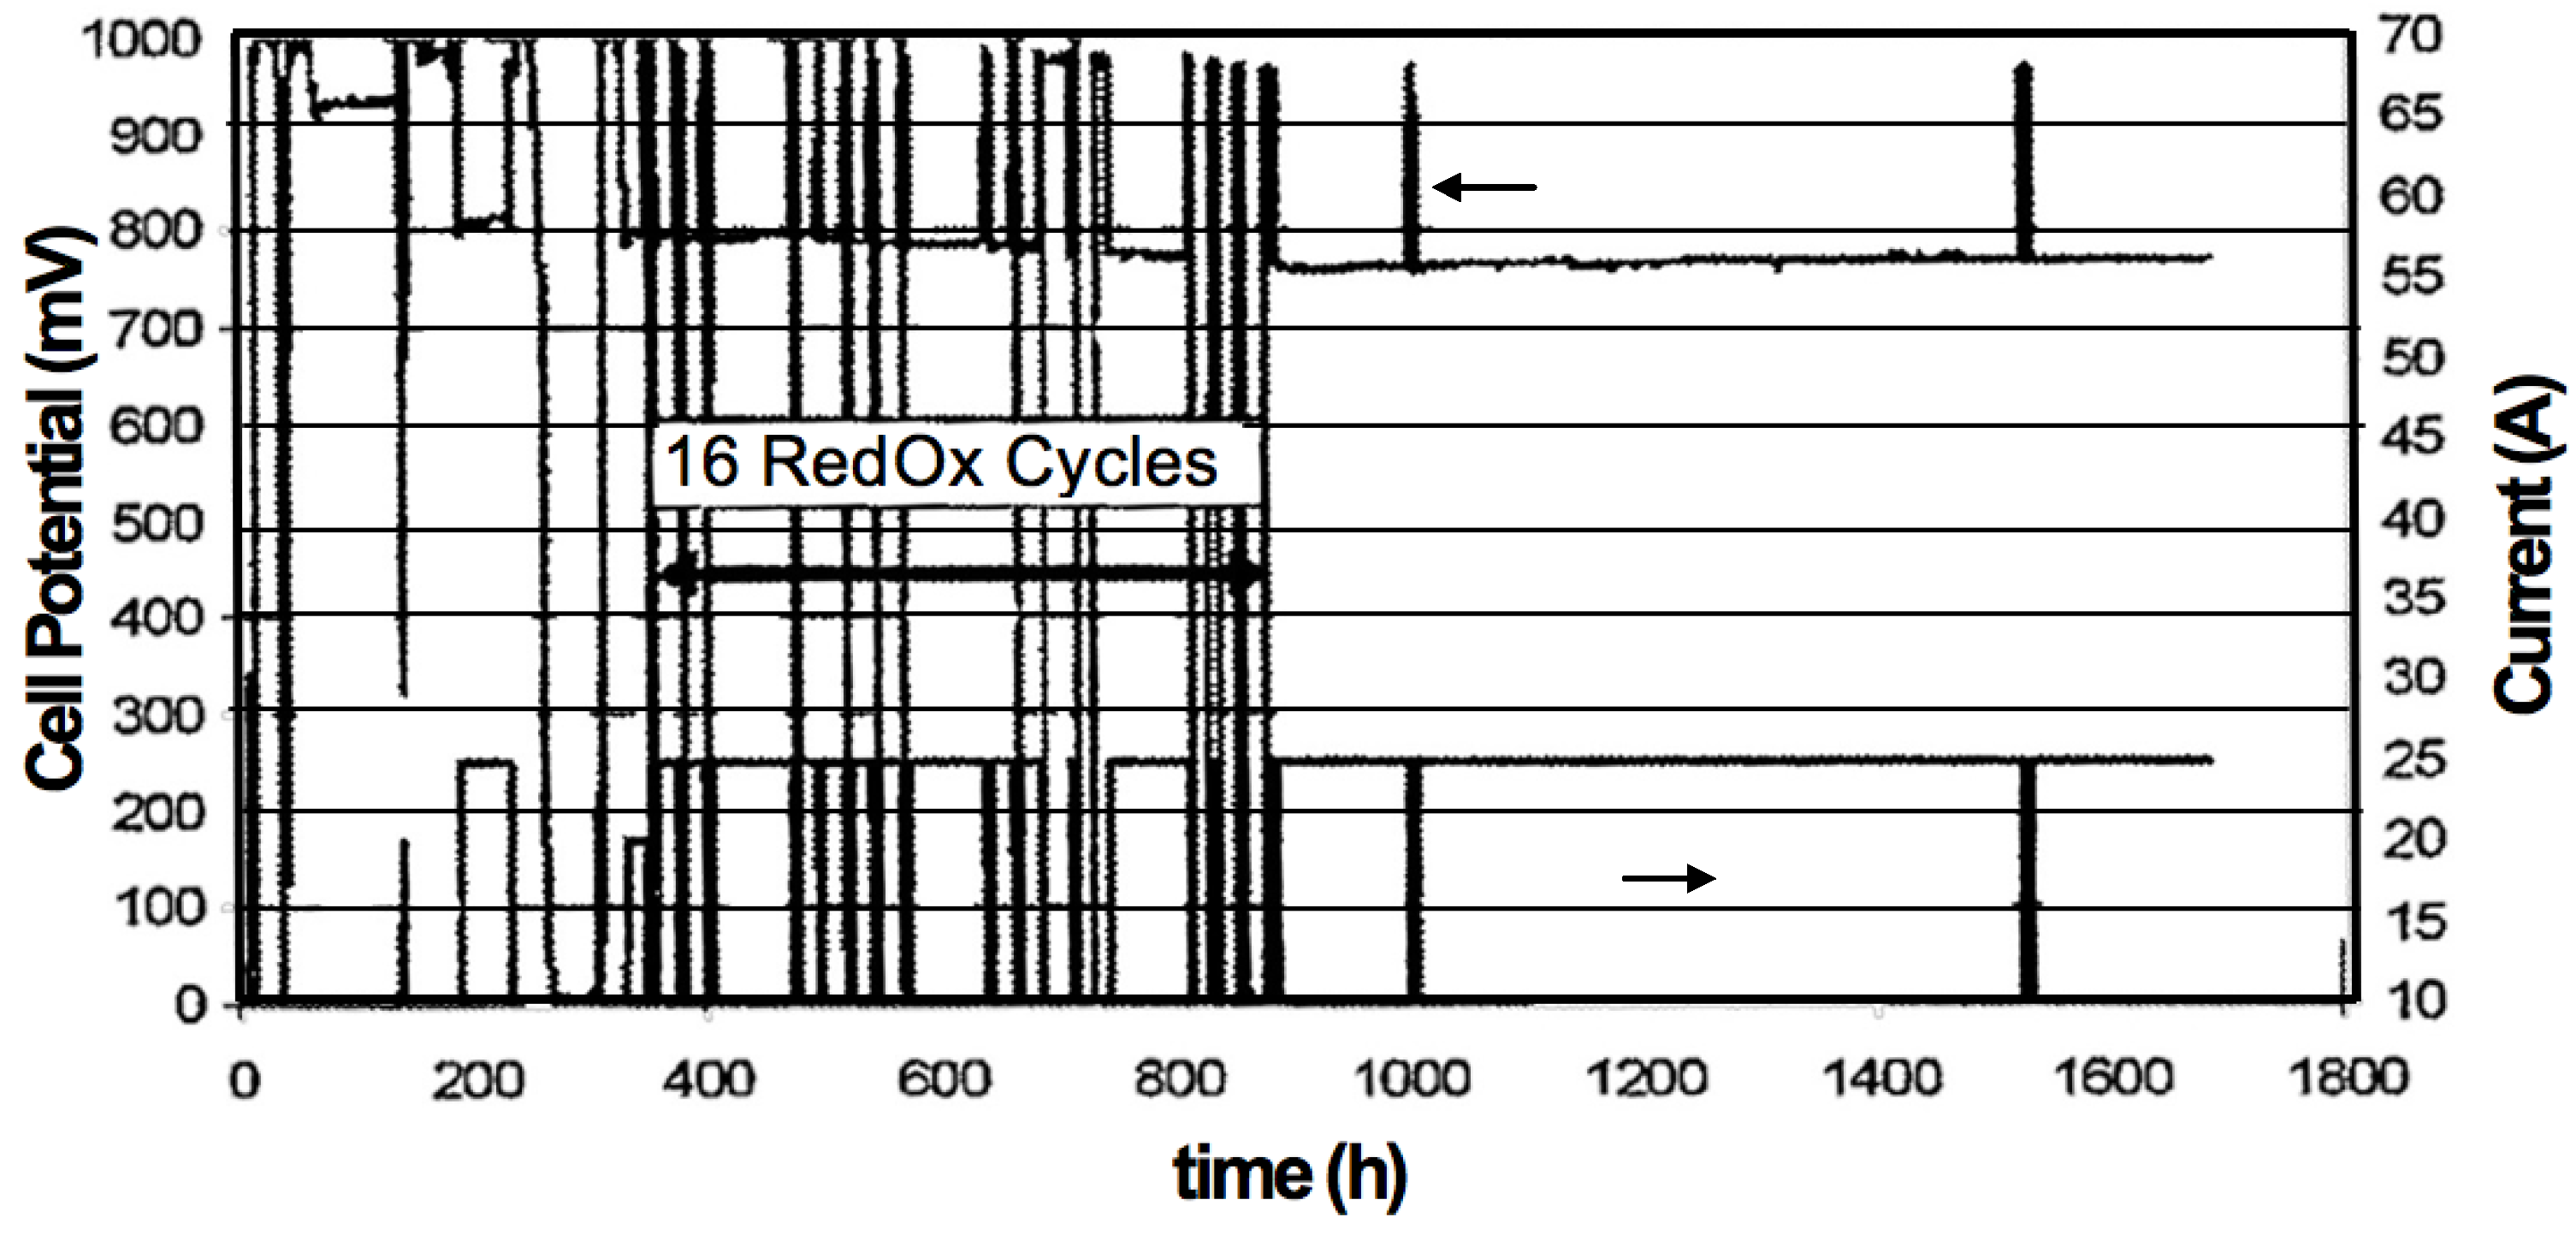
| Ni-YSZ AFL on graded Ni-YSZ AS | −0.18 | −0.38, U at 0.25 A/cm2 | 800 °C, full RedOx cycle | 16 | 1 SRU | 100 | Ihringer [215] | |
| Ni-YSZ AFL on Ni-YSZ AS | +0.12 | +2.1, U at 0.25 A/cm2 | Via ionic current under N2,DoO = 0.6%, i = 0.25 A/cm2 | 17 | 1 | 1 | Hatae et al. [121] | |
| Ni-YSZ AFL on Ni-YSZ AS | −1.0 | +13, U at 0.25 A/cm2 | Via ionic current under N2, DoO = 31%, i = 0.25 A/cm2 | 2 | 1 | 1 | Hatae et al. [121] | |
| Electrolyte Supported Cell | Ni-YSZ on 8YSZ | – | +6, Rp at 950 °C | 950 °C, fuel gas off, 20 min | 3 | 1 | 10 | Fouquet et al. [66] |
| Ni-YSZ on 3Y-TZP | 0 | +12.5, Rp anode−3.9, TPB length | 1000 °C, O2 flowing, 10 min | 4 | 1 | 0.28 | Sumi et al. [138,139] | |
| Ni-CGO | 0 | +0.8, ASR 0.9–0.75 V | 950 °C and 850 °C, air during 1 h | 50 | 1 | 1 | Sfeir et al. [163] | |
| Ni-8YSZ on 10Sc1CeSZ | – | +0.34, ASR at 0.71 A/cm2 | 850 °C, fuel gas off for 3 h | 10 | 1 | 16 | Glauche et al. [165]. | |
| Ni-GDC on 3Y-TZP | – | −0.125, i at 0.7 V | 850 °C, fuel gas off, full oxidation | 100 | 1 | 16 | Ouweltjes et al. [167] | |
| Ni-8YSZ: 30–50 µmNi-GDC: 40 µmNi-GDC: 30 µm | 000 | −0.9, i at 0.7 V−0.55, i at 0.7 V−0.15, i at 0.7 V | 800 °C, flowing air, 1 min first 50 cycles and 10 min last 50 cycles | 100 | 1 | 16 | Ettler et al. [14] | |
| 40GDC on 8YSZ | 0 | 0, no graph shown | 1000 °C, fuel gas off, until OCV = 0 V | several | 1 | 10 | Marina et al. [236] | |
| LSCM-GDC infil. with NiO on GDC | – | +2.2, U at 0.3 A/cm2 | 750 °C, 30 min under air | 4 | 1 | 0.12 | Barnett et al. [248] | |
| LSCV-GDC infil. with NiO on GDC | – | −0.6, i at 0.5 V | 30 min under air, 30 min. 6.7% H2 in Ar | 5 | 1 | 0.12 | Barnett et al. [249] | |
| LSCV-GDC infil. with NiO on GDC | – | 0, U at 0.2 A/cm2 | 30 min under air, 30 min under propane | 5 | 1 | 0.12 | Barnett et al. [249] | |
| Porous YSZ impregnated with Ni on 8YSZ | – | +5.8, i at short circuit (0 V) | 800 °C, air, 15 min | 15 | 1 | – | Buyukaksoy et al. [210] | |
| Ni-CGO | 0 | +2.2, ASR 0.9–0.75 V | 900 °C, air during 10 h | 11 | 5 SRU | 100 | Sfeir et al [163] | |
| Ni-CGO on ScSZ | – | +2.3, ASR 0.9–0.75 V | 900 °C, fuel gas off until full oxidation | 15 | 5 SRU | 100 | Mai et al. [164] | |
| Graded Ni-20SDC on stabilized zirconia | – | +1, Rp anode−3.2, Rs anode | 850 °C, fuel gas decrease to zero, driving current | 1 | 5 SRU | – | Batawi et al. [132] | |
| Ni-CGO on 3Y-TZP | – | −0.14, U at 0.188 A/cm2 | 850 °C, fuel gas off and cool down in 4 h | 83 | 30 SRU | 127.8 | Brabandt et al. [166] | |
| Ni-CGO on 3Y-TZP | – | −1.0, U at 0.172 A/cm2 | 800 °C, air flushing at 10 l/min for 20 min | 3 | 30 SRU | 127.8 | Brabandt et al. [166] | |
| Metal Supported Cell | Ni-YSZ (plasma) on CroFer22APU | 0 | −0.13, U at 0.3 A/cm2 | 800 °C, full RedOx cycle | 20 | 1 | 12.5 | Szabo et al. [174] |
| Ni-YSZ (plasma) on CroFer22APU | 0 | −0.45, U at 0.25 A/cm2 | 800 °C, pure O2, 1 h | 20 | 2 SRU | 82 | Szabo et al. [133] | |
| ScYSZ-infiltrated with 20GDC and 10 wt % NiO on CrFe 350 | −0.1 | −0.01, i at 0.7 V | 800 °C, air, 1 min (first 50 cycles) and 10 min (last 50) | 50 + 50 | – | – | Blennow et al. [175] | |
| CSC | 10 μm 50:50 Pd:YSZ, 10 μm 8YSZ, 1 mm LSM | 0 | +3.3, U at 0.05 A/cm2 | 800 °C, full RedOx cycle | 2 | 1 | 8.1 | Huang et al. [160] |
| ICSS | SIS Ni-YSZ and Ni-SDC on Sr0.8La0.2TiO3 | – | 0, U at 0.9 A/cm2 | 800 °C, flowing air for 30 min | 7 | 1 | 0.5 | Pillai et al. [180] |
| Tubular Design | ||||||||
| Anode Supported Cell | Ni-YSZ, ,Ø = 2 mm, h = 200 µm | – | −35, i at 0.5 V | 600 °C, flowing air 4 h and 30 min | 1 | 1 | 3.8 | Dikwal [20]. |
| Ni-YSZ, ,Ø = 2 mm, h = 200 µm | – | −0.38, i at 0.5 V | 600 °C, flowing air 5 min | 52 | 1 | 3.8 | Dikwal [20]. | |
| Ni-YSZ, ,Ø = 2 mm, h = 200 µm | – | −72, i at 0.5 V | 800 °C, flowing air 30 min | 1 | 1 | 3.8 | Dikwal [20]. | |
| Ni-YSZ, ,Ø = 2 mm, h = 200 µm | – | −0.44, i at 0.5 V | 800 °C, flowing air 5 min | 52 | 1 | 3.8 | Dikwal [20]. | |
| Mixed Design | ||||||||
| ISSC | SIS Ni-YSZ on MgO-NiO | 0 | −0.1, U at 0.24 A/cm2 | 775 °C-RT, start-stop without fuel gas | 20 | 1 SRU | – | Fujita et al. [178] |
| SIS Ni-YSZ on TZP | – | 0, U at 0.9 A/cm2 | 800 °C, flowing air for 40 min | 17 | 1 SRU | 14.4 | Pillai et al. [179] | |
| Single Chamber | ||||||||
| ASC | YSZ impregnated with 35 wt % LSCF and 5 wt % Ni | – | 0, U at 0.5 A/cm2 | 800 °C, flow O2/N2 (60/200 sccm f), 15 min | 11 | 1 | – | Zhu et al. [209] |
6. Acknowledgments
References
- Singhal, S.C.; Kendall, K. High Temperature Solid Oxide Fuel Cell-Fundamentals, Design and Applications; Elsevier: Oxford, UK, 2003. [Google Scholar]
- Spacil, H.S. Electrical Device including Nickel Containing Stabilized Zirconia Electrode. U.S. Patent 3,503,809, 31 March 1970. [Google Scholar]
- Simwonis, D.; Tietz, F.; Stoever, D. Nickel coarsening in annealed Ni/8YSZ anode substrates for solid oxide fuel cells. Solid State Ionics 2000, 132, 241–251. [Google Scholar] [CrossRef]
- Faes, A.; Hessler-Wyser, A.; Presvytes, D.; Vayenas, C.G.; van Herle, J. Nickel-zirconia anode degradation and triple phase boundary quantification from microstructural analysis. Fuel cells 2009, 9, 841–851. [Google Scholar] [CrossRef]
- Tanasini, P.; Costamagna, P.; Cannarozzo, M.; Faes, A.; Hessler-Wyser, A.; Van Herle, J.; Comninellis, C. Experimental and theoretical investigation of SOFC electrodes degradation mechanisms. Fuel Cells 2009, 9, 740–752. [Google Scholar] [CrossRef]
- Holzer, L.; Iwanschitz, B.; Hocker, T.; Muench, B.; Prestat, M.; Wiedenmann, D.; Vogt, U.; Holtappels, P.; Sfeir, J.; Mai, A.; Graule, T. Microstructure degradation of cermet anodes for solid oxide fuel cells: Quantification of nickel grain growth in dry and in humid atmospheres. J. Power Sources 2011, 196, 1279–1294. [Google Scholar]
- Nelson, G.J.; Grew, K.N.; Izzo, J.R., Jr.; Lombardo, J.J.; Harris, W.M.; Faes, A.; Hessler-Wyser, A.; Van herle, J.; Wang, S.; Chu, Y.S.; Virkar, A.V.; Chiu, W.K.S. Three-dimensional microstructural changes in the Ni-YSZ solid oxide fuel cell anode during operation. Acta Mater. 2012, 60, 3491–3500. [Google Scholar] [CrossRef]
- Hui, S.; Petric, A. Evaluation of yttrium-doped SrTiO3 as an anode for solid oxide fuel cells. J. Eur. Ceram. Soc. 2002, 22, 1673–1681. [Google Scholar] [CrossRef]
- Matsuzaki, Y.; Yasuda, I. Poisoning effect of sulfur-containing impurity gas on a SOFC anode: Part I. Dependence on temperature, time, and impurity concentration. Solid State Ionics 2000, 132, 261–269. [Google Scholar] [CrossRef]
- Cassidy, M.; Lindsay, G.; Kendall, K. The reduction of nickel-zirconia cermet anodes and the effects on supported thin electrolytes. J. Power Sources 1996, 61, 189–192. [Google Scholar] [CrossRef]
- Larrain, D.; Van herle, J.; Favrat, D. Simulation of SOFC stack and repeat elements including interconnect degradation and anode reoxidation risk. J. Power Sources 2006, 161, 392–403. [Google Scholar] [CrossRef]
- Sarantaridis, D.; Atkinson, A. Redox cycling of Ni-based solid oxide fuel cell anodes: A review. Fuel Cells 2007, 7, 246–258. [Google Scholar] [CrossRef]
- Comminges, C.; Fu, Q.X.; Zahid, M.; Steiner, N.Y.; Bucheli, O. Monitoring the degradation of a solid oxide fuel cell stack during 10,000 h via electrochemical impedance spectroscopy. Electrochim. Acta 2012, 59, 367–375. [Google Scholar] [CrossRef]
- Ettler, M.; Timmermann, H.; Malzbender, J.; Weber, A.; Menzler, N.H. Durability of Ni anodes during reoxidation cycles. J. Power Sources 2010, 195, 5452–5467. [Google Scholar]
- Fu, Q.X.; Tietz, F. Ceramic-based anode materials for improved redox cycling of solid oxide fuel cells. Fuel Cells 2008, 8, 283–293. [Google Scholar] [CrossRef]
- Mueller, A. Mehrschicht-Anode für die Hochtemperatur-Brennstoffzelle (SOFC). Ph.D. Thesis, Universität Fridericiana zu Karlsruhe genehmigte, Karlsrhue, Germany, 2004. [Google Scholar]
- Klemensoe, T.; Appel, C.C.; Mogensen, M. In situ observations of microstructural changes in SOFC anodes during redox cycling. Electrochem. Solid State Lett. 2006, 9, 403–407. [Google Scholar] [CrossRef]
- Sarantaridis, D. Redox Cycling of Solid Oxide Fuel Cells. Ph.D. Thesis, Imperial College London, London, UK, 2008. [Google Scholar]
- Contino, A.R. Modification of Anode Microstructure to Improve Redox Stability of Solid Oxide Fuel Cells (SOFCs). Ph.D. Thesis, Universita degli Studi di Trento, Trento, Italy, 2010. [Google Scholar]
- Dikwal, C.M. Cycling Studies of Micro-Tubular Solid Oxide Fuel Cells. Ph.D. Thesis, University of Birmingham, Birmingham, UK, 2009. [Google Scholar]
- Pihlatie, M. Stability of Ni-YSZ Composites for Solid Oxide Fuel Cells During Reduction and Re-Oxidation; VTT-Technical Research Center of Finland: Espoo, Finland, 2010. [Google Scholar]
- Ettler, M. Einfluss von Reoxidationszyklen auf die Betriebsfestigkeit von anodengestützten Festoxid-Brennstoffzellen. Ph.D. Thesis, Forschungzentrum Jülich, Jülich, Germany, 2009. [Google Scholar]
- Faes, A. RedOx Cycling of Anode Supported Solid Oxide Fuel Cells. Ph.D. Thesis, Ecole polytechnique Fédérale de Lausanne (EPFL), Lausanne, Switzerland, 2011. [Google Scholar]
- Iwanschitz, B. Degradation von Ni-Cermet-Anoden in keramischen Hochtemperatur-Brennstoffzellen. Ph.D. Thesis, Eidgenössische Technische Hochschule Zürich (ETHZ), Zürich, 2012. [Google Scholar]
- Kofstad, P. High temperature corrosion; Elsevier applied science: London, UK, 1988. [Google Scholar]
- Klemensoe, T.; Chung, C.; Larsen, P.H.; Mogensen, M. The mechanism behind redox instability of anodes in high-temperature SOFCs. J. Electrochem. Soc. 2005, 152, 2186–2192. [Google Scholar]
- Klemensoe, T. Relationships between Structure and Performance of SOFC anodes. Ph.D. Thesis, Technical University of Danemark, Risoe National Laboratory, Topsoe Fuel Cell, Risø, Denmark, 2005. [Google Scholar]
- Klemensoe, T.; Chung, C.; Larsen, P.H.; Mogensen, M. The mechanism behind redox instability of SOFC anodes. In Proceedings of International Symposium on Solid Oxide Fuel Cells, Quebec PQ, Canada, 15–20 May 2005; Electrochemical Society: Pennington, NJ, USA, 2005; p. 1051. [Google Scholar]
- Weast, R.C. CRC Handbook of Chemistry and Physics, 53rd ed; CRC Press: Cleveland, OH, USA, 1973. [Google Scholar]
- Campbell, A.J.; Danielson, L.; Righter, K.; Seagle, C.T.; Wang, Y.; Prakapenka, V.B. High pressure effects on the iron-iron oxide and nickel-nickel oxide oxygen fugacity buffers. Earth. Planet. Sci. Lett. 2009, 286, 556–564. [Google Scholar] [CrossRef]
- Vassen, R.; Simwonis, D.; Stoever, D. Modelling of the agglomeration of Ni-particles in anodes of solid oxide fuel cells. J. Mater. Sci. 2001, 36, 147–151. [Google Scholar] [CrossRef]
- Thydén, K. Microstructural Degradation of Ni-YSZ Anodes for Solid Oxide Fuel Cells. Ph.D. Thesis, Technical University of Danemark, Roskilde, Danemark, 2008. [Google Scholar]
- Van herle, J.; Larrain, D.; Autissier, N.; Wuillemin, Z.; Molinelli, M.; Favrat, D. Modeling and experimental validation of solid oxide fuel cell materials and stacks. J. Eur. Ceram. Soc. 2005, 25, 2627–2632. [Google Scholar]
- Wuillemin, Z.; Autissier, N.; Van Herle, J.; Favrat, D. Modeling and study of the influence of sealing on a solid oxide fuel cell. In Proceedings of the 1st European Fuel Cell Technology and Applications Conference 2005, Rome, Italy, 14-16 December 2005; 5, pp. 130–136.
- Steele, B.C.H.; Heinzel, A. Materials for fuel-cell technologies. Nature 2001, 414, 345–352. [Google Scholar]
- Tikekar, N.M.; Armstrong, T.J.; Virkar, A.V. Reduction and reoxidation kinetics of nickel-based SOFC anodes. J. Electrochem. Soc. 2006, 153, 654–663. [Google Scholar] [CrossRef]
- Richardson, J.T.; Scates, R.; Twigg, M.V. X-ray diffraction study of nickel oxide reduction by hydrogen. Appl. Catal. A General 2003, 246, 137–150. [Google Scholar] [CrossRef]
- Pihlatie, M.; Kaiser, A.; Mogensen, M. Redox stability of SOFC: Thermal analysis of Ni-YSZ composites. Solid State Ionics 2009, 180, 1100–1112. [Google Scholar] [CrossRef]
- Rao, Y.K.; Rashed, A.H. Kinetics of reduction of nickel oxide with helium-hydrogen gas mixtures in the range 300-400 °C. Miner. Process. Extr. Metall. 2001, 110, 1–6. [Google Scholar]
- Modena, S.; Ceschini, S.; Tomasi, A.; Montinaro, D.; Sglavo, V.M. Reduction and reoxidation processes of NiO/YSZ composite for solid oxide fuel cell anodes. J. Fuel Cell Sci. Technol. 2006, 3, 487–491. [Google Scholar] [CrossRef]
- Waldbillig, D.; Wood, A.; Ivey, D.G. Thermal analysis of the cyclic reduction and oxidation behaviour of SOFC anodes. Solid State Ionics 2005, 176, 847–859. [Google Scholar] [CrossRef]
- Dickey, E.C.; Dravid, V.P.; Nellist, P.D.; Wallis, D.J.; Pennycook, S.J.; Revcolevschi, A. Structure and bonding at Ni-ZrO2 (cubic) interfaces formed by the reduction of a NiO-ZrO2 (cubic) composite. Microsc. Microanal. 1997, 3, 443–450. [Google Scholar]
- Furstenau, R.P.; McDougall, G.; Langell, M.A. Initial stages of hydrogen reduction of NiO(100). Surf. Sci. 1985, 150, 55–79. [Google Scholar] [CrossRef]
- Utigard, T.A.; Wu, M.; Plascencia, G.; Marin, T. Reduction kinetics of Goro nickel oxide using hydrogen. Chem. Eng. Sci. 2005, 60, 2061–2062. [Google Scholar] [CrossRef]
- West, J.M. Basic corrosion and oxidation; Ellis Horwood: Chichester, UK, 1980. [Google Scholar]
- Shreir, L.L.; Jarman, R.A.; Busrstein, C.T. Corrosion-Metal/Environment Reactions; Butterworth-Heinemann: Oxford, UK, 1994. [Google Scholar]
- Atkinson, A. Transport processes during the growth of oxide films at elevated temperature. Rev. Mod. Phys. 1985, 57, 437–470. [Google Scholar] [CrossRef]
- Peraldi, R.; Monceau, D.; Pieraggi, B. Correlations between growth kinetics and microstructure for scales formed by high-temperature oxidation of pure nickel. I. Morphologies and microstructures. Oxid. Met. 2002, 58, 249–273. [Google Scholar]
- Peraldi, R.; Monceau, D.; Pieraggi, B. The nickel, model material for the high temperature oxidation studies: First steps towards predictive modelling. Rev. Métall. 2005, 102, 135–146. [Google Scholar]
- Sarantaridis, D.; Chater, R.J.; Atkinson, A. Changes in physical and mechanical properties of SOFC Ni-YSZ composites caused by redox cycling. J. Electrochem. Soc. 2008, 155, B467–B472. [Google Scholar]
- Nakamura, R.; Lee, J.G.; Mori, H.; Nakajima, H. Oxidation behaviour of Ni nanoparticles and formation process of hollow NiO. Philos. Mag. 2008, 88, 257–264. [Google Scholar]
- Yin, Y.; Rioux, R.M.; Erdonmez, C.K.; Hughes, S.; Somorjal, G.A.; Alivisatos, A.P. Formation of hollow nanocrystals through the nanoscale kirkendall effect. Science 2004, 304, 711–714. [Google Scholar]
- Railsback, J.G.; Johnston-Peck, A.C.; Wang, J.; Tracy, J.B. Size-dependent nanoscale kirkendall effect during the oxidation of nickel nanoparticles. ACS Nano 2010, 4, 1913–1920. [Google Scholar]
- Gmelin, L. Gmelin Handbuch der anorganischen Chemie. Ni: Nickel, 8th ed; Springer-Verlag: Berlin, Germany, 1968. [Google Scholar]
- Fact-Web programs. Available online: http://www.crct.polymtl.ca/factweb.php (accessed on 15 August 2012).
- Suwanwatana, W.; Yarlagadda, S.; Gillespie, J.W., Jr. An investigation of oxidation effects on hysteresis heating of nickel particles. J. Mater. Sci. 2003, 38, 565–573. [Google Scholar]
- Karmhag, R.; Niklasson, G.A.; Nygren, M. Oxidation kinetics of nickel nanoparticles. J. Appl. Phys. 2001, 89, 3012–3017. [Google Scholar] [CrossRef]
- Karmhag, R.; Niklasson, G.A.; Nygren, M. Oxidation kinetics of small nickel particles. J. Appl. Phys. 1999, 85, 1186–1191. [Google Scholar] [CrossRef]
- Karmhag, R.; Niklasson, G.A.; Nygren, M. Oxidation kinetics of large nickel particles. J. Mater. Res. 1999, 14, 3051–3058. [Google Scholar]
- Haugsrud, R. On the high-temperature oxidation of nickel. Corros. Sci. 2002, 45, 211–235. [Google Scholar] [CrossRef]
- Peraldi, R.; Monceau, D.; Pieraggi, B. Correlations between growth kinetics and microstructure for scales formed by high-temperature oxidation of pure nickel. II. Growth kinetics. Oxid. Met. 2002, 58, 275–295. [Google Scholar] [CrossRef]
- Stathis, G.; Simwonis, D.; Tietz, F.; Moropoulou, A.; Naoumides, A. Oxidation and resulting mechanical properties of Ni/8Y2O3-stabilized zirconia anode substrate for solid-oxide fuel cells. J. Mater. Res. 2002, 17, 951–958. [Google Scholar] [CrossRef]
- Czerwinski, F.; Smeltzer, W.W. J. Electrochem. Soc. 1993, 140, 2606–2615. [CrossRef]
- Galinski, H.; Reuteler, J.; Rupp, J.L.M.; Bieberle-Hütter, A.; Gauckler, L.J. Ostwald ripening and oxidation kinetics of nickel gadolinia doped ceria anodes. ECS Trans. 2009, 25, 2057–2060. [Google Scholar]
- Galinski, H.; Bieberle-Hütter, A.; Rupp, J.L.M.; Gauckler, L.J. Nonlinear oxidation kinetics of nickel cermets. Acta Mater. 2011, 59, 6239–6245. [Google Scholar] [CrossRef]
- Fouquet, D.; Mueller, A.C.; Weber, A.; Ivers-Tiffee, E. Kinetics of Oxidation and Reduction of Ni/YSZ Cermets. Ionics 2003, 8, 103–108. [Google Scholar]
- Jeangros, Q.; Faes, A.; Wagner, J.B.; Hansen, T.W.; Aschauer, U.; Van herle, J.; Hessler-Wyser, A.; Dunin-Borkowski, R.E. In situ redox cycle of a nickel-YSZ fuel cell anode in an environmental transmission electron microscope. Acta Mater. 2010, 58, 4578–4589. [Google Scholar] [CrossRef]
- Grahl-Madsen, L.; Larsen, P.H.; Bonanos, N.; Engell, J.; Linderoth, S. Mechanical strength and electrical conductivity of Ni-YSZ cermets fabricated by viscous processing. J. Mater. Sci. 2006, 41, 1097–1107. [Google Scholar]
- Li, T.S.; Wang, W.G.; Miao, H.; Chen, T.; Xu, C. Effect of reduction temperature on the electrochemical properties of a Ni/YSZ anode-supported solid oxide fuel cell. J. Alloys Compd. 2010, 495, 138–143. [Google Scholar]
- Jung, G.B.; Lo, K.F.; Chan, S.H. Effect of pretreatments on the anode structure of solid oxide fuel cells. J. Solid State Electrochem. 2007, 11, 1435–1440. [Google Scholar] [CrossRef]
- Pihlatie, M.H.; Frandsen, H.L.; Kaiser, A.; Mogensen, M. Continuum mechanics simulations of NiO/Ni-YSZ composites during reduction and re-oxidation. J. Power Sources 2010, 195, 2677–2690. [Google Scholar] [CrossRef]
- Pihlatie, M.; Kaiser, A.; Larsen, P.H.; Mogensen, M. Dimensional behaviour of Ni-YSZ anode supports for SOFC under RedOx cycling conditions. J. Electrochem. Soc. 2009, 156, B322–B329. [Google Scholar] [CrossRef]
- Pihlatie, M.; Ramos, T.; Kaiser, A. Testing and improving the redox stability of Ni-based solid oxide fuel cells. J. Power Sources 2009, 193, 322–330. [Google Scholar]
- Contino, A.R.; Cologna, M.; Modena, S.; Sglavo, V.M. Effect of doping elements on redox kinetics of NiO-YSZ powders for SOFC applications. ECS Trans. 2009, 25, 2003–2012. [Google Scholar]
- Young, J.L.; Vedahara, V.; Kung, S.; Xia, S.; Birss, V.I. Understanding nickel oxidation and reduction processes in SOFC systems. ECS Trans. 2007, 7, 1511–1519. [Google Scholar] [CrossRef]
- Zhang, Y.; Liu, B.; Tu, B.; Dong, Y.; Cheng, M. Redox cycling of Ni-YSZ anode investigated by TPR technique. Solid State Ionics 2005, 176, 2193–2199. [Google Scholar] [CrossRef]
- Ettler, M.; Blass, G.; Menzler, N.H. Characterisation of Ni-YSZ-cermets with respect to redox stability. Fuel Cells 2007, 7, 349–355. [Google Scholar] [CrossRef]
- Aaberg, R.J.; Tunold, R.; Poulsen, F.W.; Bonanos, N. Short term structural changes in Ni/YSZ electrode upon reduction. In Proceedings of 2nd European Solid Oxide Fuel Cell Forum, Oslo, Norway, 1996; Thorstensen, B., Ed.; Morgenacherstr. 2F: Oberrohrdorf, Switzerland; p. 363.
- Davarzani, H.; Marcoux, M.; Costeseque, P.; Quintard, M. Experimental measurement of the effective diffusion and thermodiffusion coefficients for binary gas mixture in porous media. Chem. Eng. Sci. 2010, 65, 5092–5104. [Google Scholar] [CrossRef]
- Roche, V.; Roux, C.; Steil, M.C. Safe Operating Conditions to Prevent Damage in Ni-YSZ Anode Supported SOFC. ECS Trans. 2011, 35, 1571–1579. [Google Scholar]
- Iwanschitz, B.; Sfeir, J.; Mai, A.; Schotze, M. Degradation of SOFC Anodes upon redox cycling: A comparison between Ni/YSZ and Ni/CGO. J. Electrochem. Soc. 2010, 157, B269–B278. [Google Scholar]
- Zhang, Y.; Liu, B.; Tu, B.; Dong, Y.; Cheng, M. Understanding of redox behavior of Ni-YSZ cermets. Solid State Ionics 2009, 180, 1580–1586. [Google Scholar] [CrossRef]
- Young, J.L.; Briss, V.I. Crack severity in relation to non-isotropic Ni oxidation in anode-supported SOFCs. In Proceedings of 9th European Solid Oxide Fuel Cell Forum; Connor, P., Ed.; EFCF: Lucerne, Swizerland, 2010; pp. 7–30. [Google Scholar]
- Young, J.L.; Birss, V.I. Crack severity in relation to non-homogeneous Ni oxidation in anode-supported solid oxide fuel cells. J. Power Sources 2011, 196, 7126–7135. [Google Scholar]
- Faes, A.; Nakajo, A.; Hessler-Wyser, A.; Dubois, D.; Modena, S.; Brisse, A.; Van Herle, J. RedOx study of anode supported solid oxide fuel cell. J. Power Sources 2009, 193, 55–64. [Google Scholar] [CrossRef]
- Faes, A.; Fuerbringer, J.-M.; Mohamedi, D.; Hessler-Wyser, A.; Caboche, G.; van Herle, J. Design of experiment approach applied to reducing and oxidizing tolerance of anode supported solid oxide fuel cell. Part I: Microstructure optimization. J. Power Sources 2011, 196, 7058–7069. [Google Scholar]
- Mori, M.; Yamamoto, T.; Itoh, H.; Inaba, H.; Tagawa, H. Thermal expansion of nickel-zirconia anodes in solid oxide fuel cells during fabrication and operation. J. Electrochem. Soc. 1998, 145, 1374–1381. [Google Scholar]
- Pihlatie, M.; Kaiser, A.; Larsen, P.H.; Mogensen, M. Dimensional behaviour of Ni-YSZ anode supports for SOFC under RedOx cycling conditions. ECS Trans. 2007, 7, 1501–1510. [Google Scholar] [CrossRef]
- Fouquet, D.; Mueller, A.C.; Weber, A.; Ivers-Tiffee, E. Kinetics of oxidation and reduction of Ni/YSZ cermets. In Proceedings of 5th European Solid Oxide Fuel Cell Forum; EFCF: Lucerne, Swizerland, 2002; pp. 467–474. [Google Scholar]
- Robert, G.; Kaiser, A.; Honegger, K.; Batawi, E. Anode supported solide oxide fuel cells with a thick anode substrate. In Proceedings of5th European Solid Oxide Fuel Cell Forum; EFCF: Lucerne, Swizerland, 2002; p. 116. [Google Scholar]
- Fischer, W.; Malzbender, J.; Blass, G.; Steinbrech, R.W. Residual stresses in planar solid oxide fuel cells. J. Power Sources 2005, 150, 73–77. [Google Scholar] [CrossRef]
- Atkinson, A.; Selçuk, A. Residual stress and fracture of laminated ceramic membranes. Acta Mater. 1999, 47, 867–874. [Google Scholar]
- Radovic, M.; Lara-Curzio, E. Mechanical properties of tape cast nickel-based anode materials for solid oxide fuel cells before and after reduction in hydrogen. Acta Mater. 2004, 52, 5747–5756. [Google Scholar]
- MacDowell, A.A.; Celestre, R.S.; Tamura, N.; Spolenak, R.; Valek, B.; Brown, W.L.; Bravman, J.C.; Padmore, H.A.; Batterman, B.W.; Patel, J.R. Submicron X-ray diffraction. Nucl. Instrum. Methods Phys. Res. A 2001, 467, 936–943. [Google Scholar] [CrossRef]
- Villanova, J.; Sicardy, O.; Fortunier, R.; Micha, J.S.; Bleuet, P. X-ray diffraction determination of macro and micro stresses in SOFC electrolyte and evolution with redox cycling of the anode. Mater. Sci. Forum 2011, 681, 25–30. [Google Scholar]
- Tanaka, K.; Akiniwa, Y.; Kimura, H.; Ukai, K.; Yokoyama, M.; Mizutani, Y. In situ synchrotron measurement of internal stresses in solid-oxide fuel cell during red-ox cycle. Mater. Sci. Forum 2008, 571-572, 339–344. [Google Scholar] [CrossRef]
- Malzbender, J.; Wessel, E.; Steinbrech, R.W.; Singheiser, L. Reduction and re-oxidation of anodes for solid oxide fuel cells (SOFC). In Proceedings of Ceramic Engineering and Science—28th International Conference on Advanced Ceramics and Composites, Cocoa Beach, FL, USA, 2004; Lara-Curzio, E., Readey, M.J., Eds.; The American Ceramic Society: Westerville, OH, USA; pp. 387–392.
- Faes, A.; Frandsen, H.L.; Pihlatie, M.; Kaiser, A.; Goldstein, D.R. Curvature and strength of Ni-YSZ solid oxide half-cells after redox treatments. J. Fuel Cell Sci. Technol. 2010, 7, 051011:1–051011:7. [Google Scholar]
- Li, W.; Hasinska, K.; Seabaugh, M.; Swartz, S.; Lannutti, J. Curvature in solid oxide fuel cells. J. Power Sources 2004, 138, 145–155. [Google Scholar] [CrossRef]
- Contino, A.R.; Cologna, M.; Modena, S.; Bertoldi, M.; Sglavo, V.M. SOFC Characterization upon RedOx Cycles. In Proceedings of European Fuel Cell Technology and Applications-Pietro Lunghi Conference, Rome, Italy, 15-18 December 2009; pp. 65–66.
- Laurencin, J.; Delette, G.; Usseglio-Viretta, F.; Di Iorio, S.; Lefebvre-Joud, F. Characterization of the Ni-8YSZ cermet creep and its impact on the cell “redox” tolerance. ECS Trans. 2011, 35, 1463–1471. [Google Scholar]
- Atkinson, A.; Selcuk, A. Mechanical behaviour of ceramic oxygen ion-conducting membranes. Solid State Ionics 2000, 134, 59–66. [Google Scholar] [CrossRef]
- Pihlatie, M.; Kaiser, A.; Mogensen, M. Mechanical properties of NiO/Ni-YSZ composites depending on temperature, porosity and redox cycling. J. Eur. Ceram. Soc. 2009, 29, 1657–1664. [Google Scholar] [CrossRef]
- Pusz, J.; Smirnova, A.; Mohammadi, A.; Sammes, N.M. Fracture strength of micro-tubular solid oxide fuel cell anode in redox cycling experiments. J. Power Sources 2007, 163, 900–906. [Google Scholar] [CrossRef]
- Ihringer, R. 2R-cell: Reliability of anode supported thin electrolyte upon multi thermo and redox cycles. ECS Trans. 2009, 25, 473–483. [Google Scholar] [CrossRef]
- Sarantaridis, D.; Atkinson, A. Mechanical modeling of redox cycling damage in solid oxide fuel cells. In Proceedings ofthe 7th European Solid Oxide Fuel Cell Forum; EFCF: Lucerne, Swizerland, 2006; p. P0728. [Google Scholar]
- Malzbender, J.; Steinbrech, R.W. Advanced measurement techniques to characterize thermo-mechanical aspects of solid oxide fuel cells. J. Power Sources 2007, 173, 60–67. [Google Scholar] [CrossRef]
- Malzbender, J.; Steinbrech, R.W.; Singheiser, L. A review of advanced techniques for characterising SOFC behaviour. Fuel Cells 2009, 9, 785–793. [Google Scholar]
- Klemensoe, T.; Sorensen, B.F. Evaluating redox stability of Ni-YSZ supported SOFCs based on simple layer models. In Advances in Solid Oxide Fuel Cells IV; Singh, P., Bansal, N.P., Eds.; The American Ceramic Society: Westerville, OH, USA, 2009; pp. 81–92. [Google Scholar]
- Laurencin, J.; Delette, G.; Dupeux, M.; Lefebvre-Joud, F. A numerical approach to predict the SOFC fracture: The case of an anode supported cell. ECS Trans. 2007, 7, 677–686. [Google Scholar]
- Laurencin, J.; Delette, G.; Lefebvre-Joud, F.; Dupeux, M. A numerical tool to estimate SOFC mechanical degradation: Case of the planar cell configuration. J. Eur. Ceram. Soc. 2008, 28, 1857–1869. [Google Scholar]
- Sarantaridis, D.; Rudkin, R.A.; Atkinson, A. Oxidation failure modes of anode-supported solid oxide fuel cells. J. Power Sources 2008, 180, 704–710. [Google Scholar]
- Laurencin, J.; Delette, G.; Morel, B.; Lefebvre-Joud, F.; Dupeux, M. Solid oxide fuel cells damage mechanisms due to Ni-YSZ re-oxidation: Case of the anode supported cell. J. Power Sources 2009, 192, 344–352. [Google Scholar] [CrossRef]
- Klemensoe, T.; Mogensen, M. Ni-YSZ solid oxide fuel cell anode behavior upon redox cycling based on electrical characterization. J. Am. Ceram. Soc. 2007, 90, 3582–3588. [Google Scholar] [CrossRef]
- Liu, B.; Zhang, Y.; Tu, B.; Dong, Y.; Cheng, M. Electrochemical impedance investigation of the redox behaviour of a Ni-YSZ anode. J. Power Sources 2007, 165, 114–119. [Google Scholar]
- Pomfret, M.B.; Steinhurst, D.A.; Kidwell, D.A.; Owrutsky, J.C. Thermal imaging of solid oxide fuel cell anode processes. J. Power Sources 2010, 195, 257–262. [Google Scholar]
- Busawon, A.N.; Sarantaridis, D.; Atkinson, A. Ni infiltration as a possible solution to the redox problem of SOFC anodes. Electrochem. Solid State Lett. 2008, 11, B186–B189. [Google Scholar]
- Hatae, T.; Matsuzaki, Y.; Yamazaki, Y. Study on electrochemical re-oxidation of anode-supported solid oxide fuel cells using oxide ion current. Solid State Ionics 2008, 179, 274–281. [Google Scholar]
- Hatae, T.; Matsuzaki, Y.; Yamashita, S.; Yamazaki, Y. Current density dependence of changes in the microstructure of SOFC anodes during electrochemical oxidation. Solid State Ionics 2009, 180, 1305–1310. [Google Scholar]
- Hatae, T.; Matsuzaki, Y.; Yamashita, S.; Yamazaki, Y. Initial damage to anode microstructure caused by partial redox cycles during electrochemical oxidation. J. Electrochem. Soc. 2009, 156, B609–B613. [Google Scholar]
- Hatae, T.; Matsuzaki, Y.; Yamashita, S.; Yamazaki, Y. Destruction modes of anode-supported SOFC caused by degrees of electrochemical oxidation in redox cycle. J. Electrochem. Soc. 2010, 157, B650–B654. [Google Scholar] [CrossRef]
- Laurencin, J.; Girona, K.; Delette, G.; Lefebvre-Joud, F. In-situ electrochemical characterization of SOFC cell degradation: The cases of mechanical damage and carbon deposition. ECS Trans. 2009, 25, 429–438. [Google Scholar]
- Takagi, N.; Nakamura, Y.; Shikazono, N.; Kasagi, N. Microstructure change of SOFC anode caused by electrochemical redox cycles. In Proceedings of the 9th European Solid Oxide Fuel Cell Forum; EFCF: Lucerne, Swizerland, 2010; pp. 7–135. [Google Scholar]
- Waldbillig, D.; Wood, A.; Ivey, D.G. Electrochemical and microstructural characterization of the redox tolerance of solid oxide fuel cell anodes. J. Power Sources 2005, 145, 206–215. [Google Scholar] [CrossRef]
- Faes, A.; Jeangros, Q.; Wagner, J.B.; Hansen, T.W.; Van herle, J.; Brisse, A.; Dunin-Borkowski, R.; Hessler-Wyser, A. In situ reduction and oxidation of nickel from solid oxide fuel cells in a transmission electron microscope. ECS Trans. 2009, 25, 1985–1992. [Google Scholar]
- Iwanschitz, B.; Mai, A.; Holzer, L.; Hocker, T.; Schütze, M. Degradation of Ni-cermet anodes in solid oxide fuel cells. In Proceedings of the 9th European Solid Oxide Fuel Cell Forum; EFCF: Lucerne, Swizerland, 2010; pp. 7–61. [Google Scholar]
- Laurencin, J.; Delette, G.; Sicardy, O.; Rosini, S.; Lefebvre-Joud, F. Impact of “redox” cycles on performances of solid oxide fuel cells: Case of the electrolyte supported cells. J. Power Sources 2010, 195, 2747–2753. [Google Scholar] [CrossRef]
- Hagen, A.; Poulsen, H.F.; Klemensoe, T.; Martins, R.V.; Honkimki, V.; Buslaps, T.; Feidenshans, R. A depth-resolved in situ study of the reduction and oxidation of Ni-based anodes in solid oxide fuel cells. Fuel Cells 2006, 6, 361–366. [Google Scholar] [CrossRef]
- Faes, A. A Process to Increase Solid Oxide Fuel Cells durability: RedOx Stability of Anode-supported Solid Oxide Fuel Cells, 1st ed; VDM Verlag Dr. Müller: Saarbrücken, Germany, 2011. [Google Scholar]
- Shearing, P.R.; Bradley, R.S.; Gelb, J.; Tariq, F.; Withers, P.J.; Brandon, N.P. Exploring microstructural changes associated with oxidation in Ni-YSZ SOFC electrodes using high resolution X-ray computed tomography. Solid State Ionics 2012, 216, 69–72. [Google Scholar] [CrossRef]
- Glauche, A.; Betz, T.; Mosch, S.; Trofimenko, N.; Kusnezoff, M. Long-term, redox and thermal cycling stability of electrolyte supported cells. ECS Trans. 2009, 25, 411–419. [Google Scholar]
- Batawi, E.E.; Hickey, D.; McElroy, J. Anode with Remarkable Stability under Conditions of Extreme Fuel Starvation. WO Patent 08048445, 24 April 2008. [Google Scholar]
- Szabo, P.; Ansar, A.; Franco, T.; Gindrat, M.; Zagst, A. Dynamic electrochemical behaviour of metal-supported plasma-sprayed SOFC. In Proceedings of the 9th European Solid Oxide Fuel Cell Forum; EFCF: Lucerne, Swizerland, 2010; pp. 16–44. [Google Scholar]
- Primdahl, S.; Mogensen, M. Gas conversion impedance: A test geometry effect in characterization of solid oxide fuel cell anodes. J. Electrochem. Soc. 1998, 145, 2431–2438. [Google Scholar] [CrossRef]
- Primdahl, S.; Mogensen, M. Gas diffusion impedance in characterization of solid oxide fuel cell anodes. J. Electrochem. Soc. 1999, 146, 2827–2833. [Google Scholar] [CrossRef]
- Primdahl, S. Nickel/Yttria-Stabilised Zirconia cermet anodes for Solid Oxide Fuel Cells; DTU: Roskilde, Denmark, 1999. [Google Scholar]
- Primdahl, S.; Mogensen, M. Oxidation of hydrogen on Ni/yttria-stabilized zirconia cermet anodes. J. Electrochem. Soc. 1997, 144, 3409–3419. [Google Scholar] [CrossRef]
- Sumi, H.; Kishida, R.; Kim, J.-Y.; Muroyama, H.; Matsui, T.; Eguchi, K. Correlation between microstructural and electrochemical characteristics during redox cycles for Ni-YSZ anode of SOFCs. J. Electrochem. Soc. 2010, 157, B1747–B1752. [Google Scholar]
- Muroyama, H.; Sumi, H.; Kishida, R.; Kim, J.Y.; Matsui, T.; Eguchi, K. Correlation between microstructure and electrochemical characteristics of ni-ysz anode subjected to redox cycles. ECS Trans. 2011, 35, 1379–1387. [Google Scholar]
- Jacques-Bedard, X.; Napporn, T.W.; Roberge, R.; Meunier, M. Performance and ageing of an anode-supported SOFC operated in single-chamber conditions. J. Power Sources 2006, 153, 108–113. [Google Scholar] [CrossRef]
- Wang, Z.; Lue, Z.; Wei, B.; Chen, K.; Huang, X.; Pan, W.; Su, W. Redox of Ni/YSZ anodes and oscillatory behavior in single-chamber SOFC under methane oxidation conditions. Electrochim. Acta 2011, 56, 6688–6695. [Google Scholar]
- Kellogg, I.D.; Koylu, U.O.; Petrovsky, V.; Dogan, F. Effectiveness of anode in a solid oxide fuel cell with hydrogen/oxygen mixed gases. Int. J. Hydrog. Energy 2009, 34, 5138–5143. [Google Scholar] [CrossRef]
- Wood, A.; Pastula, M.; Waldbillig, D.; Ivey, D. Initial testing of solutions to redox problems with anode-supported solid oxide fuel cells (SOFC). In Proceedings of the SOFC-IX—Electrochemical Society Proceedings, Quebec, Canada, 2005; Singhal, S.C., Mizusaki, J., Eds.; The Electrochemical Society: Pennington,NJ,USA, 2005; pp. 571–583. [Google Scholar]
- Wood, A.; Pastula, M.; Waldbilig, D.; Ivey, D.G. Initial testing of solutions to redox problems with anode-supported SOFC. J. Electrochem. Soc. 2006, 153, A1929–A1935. [Google Scholar]
- Mukerjee, S.; Grieve, M.J.; Keegan, K.R. Methods for Preventing Anode Oxidation in a Fuel Cell. Eur. Patent 1263071, 15 April 2002. [Google Scholar]
- England, D.M.; Haltiner, K.J., Jr.; Kelly, S.M.; Faville, M.T. Oxygen Getters for Anode Protection in a Solid-Oxide Fuel Cell Stack. WO Patent 2004001885, 31 December 2003. [Google Scholar]
- Haltiner, K.J., Jr.; Mukerjee, S.; Tachtler, J.; Edlinger, B.; England, D.M.; Faville, M.T.; Kelly, S.M. Oxygen Isolation and Collection For Anode Protection in a Solid-Oxide Fuel Cell Stack. WO Patent 2004001875, 31 December 2003. [Google Scholar]
- Halliop, W.; McAlary, G.M.; George, R.A. Fuel Cell System with Degradation Protected Anode. WO Patent 2004012288A2, 5 February 2004. [Google Scholar]
- Singh, S.P.; Malhotra, A. Process and Apparatus for Autothermal Reforming with Recycle of a Portion of the Produced Syngas. Eur. Patent 1400489A1, 11 September 2003. [Google Scholar]
- Young, J.L.; Vedharathinam, V.; Birss, V.I. Reverse Cell Bias for the Prevention of Ni Oxidation During Air Exposure. ECS Trans. 2011, 35, 1697–1706. [Google Scholar]
- Backhaus-Ricoult, M.; Badding, M.E.; Harris, J.M.; Marx, P. Segmented Solid Oxide Fuel Cell Stack and Methods for Operation and Use Thereof. U.S. Patent 20090110993, 30 April 2009. [Google Scholar]
- Vedasri, V.; Young, J.L.; Birss, V.I. A possible solution to the mechanical degradation of Ni-yttria stabilized zirconia anode-supported solid oxide fuel cells due to redox cycling. J. Power Sources 2010, 195, 5534–5542. [Google Scholar] [CrossRef]
- Weissman, J.G.; England, D.M. Method for Cooling Oxygen Sensitive Components. U.S. Patent 20060035122, 16 February 2006. [Google Scholar]
- Wuillemin, Z.; Autissier, N.; Nakajo, M.; Luong, M.; van Herle, J.; Favrat, D. Modeling and study of the influence of sealing on a solid oxide fuel cell. J. Fuel Cell Sci. Technol. 2008, 5, 011016:1–011016:9. [Google Scholar]
- Wuillemin, Z. Experimental and Modeling Investigations on Local Performance and Local Degradation in Solid Oxide Fuel Cells. Ph.D. Thesis, Ecole Polytechnique Federale de Lausanne (EPFL) Lausanne, Switzerland, 2009. [Google Scholar]
- Dikwal, C.M.; Bujalski, W.; Kendall, K. Characterization of the electrochemical performance of micro-tubular SOFC in partial reduction and oxidation conditions. J. Power Sources 2008, 181, 267–273. [Google Scholar]
- Heo, Y.-H.; Lee, J.-W.; Lee, S.-B.; Lim, T.-H.; Park, S.-J.; Song, R.-H.; Park, C.-O.; Shin, D.-R. Redox-induced performance degradation of anode-supported tubular solid oxide fuel cells. Int. J. Hydrog. Energy 2011, 36, 797–804. [Google Scholar]
- Kendall, K. Progress in microtubular solid oxide fuel cells. Int. J. Appl. Ceram. Technol. 2010, 7, 1–9. [Google Scholar] [CrossRef]
- Williams, M.C.; Strakey, J.; Sudoval, W. U.S. DOE fossil energy fuel cells program. J. Power Sources 2006, 159, 1241–1247. [Google Scholar]
- Huang, P.; Tang, E.; Ghosh, D. Redox Solid Oxide Fuel Cell. U.S. Patent 20020098406, 18 July 2002. [Google Scholar]
- Batawi, E.; Voisard, C.; Weissen, U.; Hoffmann, J.; Sikora, Y.; Frei, J. Materials developement at Sulzer Hexis for the provision of a combined heat and power SOFC system. In Proceedings of the 6th European Solid Oxide Fuel Cell Forum; Morgensen, M., Ed.; EFCF: Lucerne, Switzerland, 2004; pp. 767–773. [Google Scholar]
- Mosch, S.; Trofimenko, N.; Kusnezoff, M.; Betz, T.; Kellner, M. Long-term and redox stability of electrolyte supported solid oxide fuel cells under various operating conditions. ECS Trans. 2007, 7, 381–388. [Google Scholar] [CrossRef]
- Sfeir, J.; Mai, A.; Weissen, U.; Iwanschitz, B.; Denzler, R.; Haberstock, D.; Kruschwitz, R.; Hocker, T.; Roos, M. Status of SOFC stack and material development at Hexis. In Proceedings of the 8th European Solid Oxide Fuel Cell Forum; Bossel, U., Ed.; EFCF: Lucerne, Switzerland, 2008; p. B0307. [Google Scholar]
- Mai, A.; Iwanschitz, B.; Weissen, U.; Denzler, R.; Haberstock, D.; Nerlich, V.; Sfeir, J.; Schuler, A. Status of Hexis SOFC stack development and the Galileo 1000 N micro-CHP system. ECS Trans. 2009, 25, 149–158. [Google Scholar]
- Glauche, A.; Betz, T. Commercialization and enhancement of SOFC products. In Proceedings of the 9th European Solid Oxide Fuel Cell Forum; Connor, P., Ed.; EFCF: Lucerne, Switzerland, 2010; pp. 2–106. [Google Scholar]
- Brabandt, J.; Fang, Q.; Schimanke, D.; Heinrich, M.; Mai, B.E.; Wunderlich, C. System Relevant Redox Cycling in SOFC Stacks. ECS Trans. 2011, 35, 243–249. [Google Scholar]
- Ouweltjes, J.P.; Van Tuel, M.; Sillessen, M.; Rietveld, G. Redox tolerant SOFC anodes with high electrochemical performance. Fuel Cells 2009, 9, 873–882. [Google Scholar] [CrossRef]
- Ukai, K.; Hisada, K. Single cell for a solid oxide fuel cell. US Patent 20040072060, 15 April 2004. [Google Scholar]
- Weber, A. Fuel cells-Solid oxide fuel cells/life-limiting considerations. In Encyclopedia of Electrochemical Power Sources; Jürgen, G., Ed.; Elsevier: Amsterdam, The Netherlands, 2009; pp. 120–134. [Google Scholar]
- Larsen, P.H.; Mogensen, M.B.; Linderoth, S.; Hansen, K.K.; Wang, W. Solid Oxide Fuel Cell. WO Patent 2005122300A2–1, 22 December 2005. [Google Scholar]
- Larsen, P.H. A Method for Producing a Reversible Solid Oxid Fuel Cell. WO Patent 2006082057A2, 10 August 2006. [Google Scholar]
- Lang, M.; Franco, T.; Johnson, M.; Schiller, G.; Szabo, P. Charaterization of vacuum plasma sprayed planar solid oxide fuel cells during reduction-oxidation cycling. In Proceedings of the 6th European Fuel Cell Forum; EFCF: Lucerne, Switzerland, 2004; pp. 877–886. [Google Scholar]
- Lang, M.; Szabo, P.; Ilhan, Z.; Cinque, S.; Franco, T.; Schiller, G. Development of solid oxide fuel cells and short stacks for mobile application. J. Fuel Cell Sci. Technol. 2007, 4, 384–391. [Google Scholar]
- Szabo, P.; Arnold, J.; Franco, T.; Gindrat, M.; Refke, A.; Zagst, A.; Ansar, A. Progress in the metal supported solid oxide fuel cells and stacks for APU. ECS Trans. 2009, 25, 175–185. [Google Scholar]
- Blennow, P.; Hjelm, J.; Klemensoe, T.; Ramousse, S.; Kromp, A.; Leonide, A.; Weber, A. Manufacturing and characterization of metal supported SOFCs. In Proceedings of the 9th European Solid Oxide Fuel Cell Forum; Connor, P., Ed.; EFCF: Lucerne, Switzerland, 2010; pp. 16–11. [Google Scholar]
- Blennow, P.; Hjelm, J.; Klemenso, T.; Ramousse, S.; Kromp, A.; Leonide, A.; Weber, A. Manufacturing and characterization of metal-supported solid oxide fuel cells. J. Power Sources 2011, 196, 7117–7125. [Google Scholar]
- Tucker, M.C.; Lau, G.Y.; Jacobson, C.P.; DeJonghe, L.C.; Visco, S.J. Stability and robustness of metal-supported SOFCs. J. Power Sources 2008, 175, 447–451. [Google Scholar] [CrossRef]
- Fujita, K.; Somekawa, T.; Horiuchi, K.; Matsuzaki, Y. Evaluation of the redox stability of segmented-in-series solid oxide fuel cell stacks. J. Power Sources 2009, 193, 130–135. [Google Scholar] [CrossRef]
- Pillai, M.R.; Gostovic, D.; Kim, I.; Barnett, S.A. Short-period segmented-in-series solid oxide fuel cells on flattened tube supports. J. Power Sources 2007, 163, 960–965. [Google Scholar] [CrossRef]
- Pillai, M.R.; Kim, I.; Bierschenk, D.M.; Barnett, S.A. Fuel-flexible operation of a solid oxide fuel cell with Sr0.8La0.2TiO3 support. J. Power Sources 2008, 185, 1086–1093. [Google Scholar] [CrossRef]
- Ihringer, R. 2R-cell: Reliability of anode supported thin electrolyte upon multi thermo and redox cycles in SOFC. In Proceedings of the 9th European Solid Oxide Fuel Cell Forum; Connor, P., Ed.; EFCF: Lucerne, Switzerland, 2010; pp. 2–50. [Google Scholar]
- Malzbender, J.; Wessel, E.; Steinbrech, R.W. Reduction and re-oxidation of anodes for solid oxide fuel cells. Solid State Ionics 2005, 176, 2201–2203. [Google Scholar] [CrossRef]
- Mueller, A.C.; Kruegel, A.; Weber, A.; Ivers-Tiffee, E. Characterization of multilayer anodes for SOFC. In Proceedings of the Materials Research Society Symposium, Symposium EE: Solid State Ionics Conf, Boston MA, December 2002; MRS: Pittsburgh, PA, USA, 2003; pp. 533–538. [Google Scholar]
- Itoh, H.; Yamamoto, T.; Mori, M.; Horita, T.; Sakai, N.; Yokokawa, H.; Dokiya, M. Configurational and electrical behavior of Ni-YSZ cermet with novel microstructure for solid oxide fuel cell anodes. J. Electrochem. Soc. 1997, 144, 641–646. [Google Scholar]
- Robert, G.; Kaiser, A.; Batawi, E. Anode substrate design for redox-stable ASE cells. In Proceedings of the 6th European Solid Oxide Fuel Cell Forum; Mogensen, M., Ed.; EFCF: Lucerne, Switzerland, 2004; p. 193. [Google Scholar]
- Faes, A.; Wuillemin, Z.; Tanasini, P.; Accardo, N.; Modena, S.; Schindler, H.J.; Cantoni, M.; Lübbe, H.; Diethelm, S.; Hessler-Wyser, A.; van Herle, J. Design of experiment approach applied to reducing and oxidizing tolerance of anode supported solid oxide fuel cell. Part II: Electrical, electrochemical and microstructural characterization of tape-cast cells. J. Power Sources 2011, 196, 8909–8917. [Google Scholar]
- Faes, A.; Wuillemin, Z.; Tanasini, P.; Accardo, N.; Van Herle, J. Redox stable Ni-YSZ anode support in solid oxide fuel cell stack configuration. J. Power Sources 2011, 196, 3553–3558. [Google Scholar]
- Ukai, K.; Hisada, K.; Hata, K.; Aikawa, N.; Shimomura, M. Fuel electrode material, a fuel electrode, and a solid oxide fuel cell. U.S. Patent 20060110633 A1, 25 May 2006. [Google Scholar]
- Robert, G.; Kaiser, A.F.-J.; Batawi, E. Structured Body for an Anode Used in Fuel Cells. U.S. Patent 20060110633 A1, 25 May 2003. [Google Scholar]
- Wang, Z.; Mori, M.; Itoh, T. Evaluation of Porous Ni-YSZ Cermets with Ni content of 0-30 vol % As Insulating Substrates for Solid Oxide Fuel Cells. ECS Trans. 2011, 35, 1631–1640. [Google Scholar]
- Costamagna, P.; Costa, P.; Antonucci, V. Micro-modelling of solid oxide fuel cell electrodes. Electrochim. Acta 1998, 43, 375–394. [Google Scholar] [CrossRef]
- Xue, Q. The influence of particle shape and size on electric conductivity of metal-polymer composites. Eur. Polym. J. 2004, 40, 323–327. [Google Scholar] [CrossRef]
- Mahoney, F.M. Reduction-oxidation tolerant electrodes for solid oxide fuel cells. U.S. Patent 20100159356, 24 June 2010. [Google Scholar]
- Wuillemin, Z. Personal communication, Swiss Federal Institute of Technology: Lausanne, Switzerland, 2007.
- Richardson, J.T. Magnetism and catalysis. J. Appl. Phys. 1978, 49, 1781–1786. [Google Scholar] [CrossRef]
- Faes, A. Etude D'un Nanocomposite D'oxyde De Fer Et De Silice Pour Des Applications En Hyperthermie; Master Thesis, EPFL: Lausanne, Swizerland, 2005. [Google Scholar]
- Ichiyanagi, Y.; Wakabayashi, N.; Yamazaki, J.; Yamada, S.; Kimishima, Y.; Komatsu, E.; Tajima, H. Magnetic properties of NiO nanoparticles. Phys. B 2003, 329-333, 862–863. [Google Scholar]
- Clemmer, R.M.C.; Corbin, S.F. Influence of porous composite microstructure on the processing and properties of solid oxide fuel cell anodes. Solid State Ionics 2004, 166, 251–259. [Google Scholar]
- Clemmer, R.M.C.; Corbin, S.F. Co-sintering behaviour of porous NI-YSZ composite sofc anodes. In Proceedings of the Ceramic Engineering and Science; The American Ceramic Society: Westerville, OH, USA, 2005; pp. 331–340. [Google Scholar]
- Clemmer, R.M.C.; Corbin, S.F. The influence of pore and Ni morphology on the electrical conductivity of porous Ni/YSZ composite anodes for use in solid oxide fuel cell applications. Solid State Ionics 2009, 180, 721–730. [Google Scholar] [CrossRef]
- Corbin, S.F.; Qiao, X. Development of solid oxide fuel cell anodes using metal-coated pore-forming agents. J. Am. Ceram. Soc. 2003, 86, 401–406. [Google Scholar] [CrossRef]
- Yang, Q.; Corbin, S.; Paserin, V.; Clemmer, R.M.C.; Huang, H.H.; Charles, D. Nickel Foam and Felt-Based Anode for Solid Oxide Fuel Cells. WO Patent 05099000, 20 October 2005. [Google Scholar]
- Corbin, S.F.; Clemmer, R.M.; Yang, Q. Development and characterization of sofc Ni-YSZ anodes using highly porous Ni foam. In Proceedings of the Ceramic Engineering and Science; Proceedings of the Ceramic Engineering and Science: Westerville, OH, USA, 2005; pp. 151–158. [Google Scholar]
- Corbin, S.F.; Clemmer, R.M.C.; Yang, Q. Development and characterization of porous composites for solid oxide fuel cell anode conduction layers using ceramic-filled highly porous Ni foam. J. Am. Ceram. Soc. 2009, 92, 331–337. [Google Scholar]
- Hwang, C.S. Anode On A Pretreated Substrate for Improving Redox-Stability of Solid Oxide Fuel Cell and the Fabrication Method Therof. U.S. Patent 20120021332 A1, 26 January 2012. [Google Scholar]
- Hwang, C.S. Porous Metal Substrate Structure Fora Solid Oxide Fuel Cell. U.S. Patent 20120021333 A1, 26 January 2012. [Google Scholar]
- Jiang, S.P. A review of wet impregnation-An alternative method for the fabrication of high performance and nano-structured electrodes of solid oxide fuel cells. Mater. Sci. Eng. A 2006, 418, 199–210. [Google Scholar] [CrossRef]
- Jasinski, P.; Suzuki, T.; Petrovsky, V.; Anderson, H.U. Nanocomposite nickel ceria cermet with low nickel content for anode-supported SOFCs. Electrochem. Solid State Lett. 2005, 8, A219–A221. [Google Scholar] [CrossRef]
- Zhu, X.; Lue, Z.; Wei, B.; Zhang, Y.; Huang, X.; Su, W. Fabrication and evaluation of a Ni/La0.75Sr0.25Cr0.5Fe0.5O3−delta co-impregnated yttria-stabilized zirconia anode for single-chamber solid oxide fuel cells. Int. J. Hydrog. Energy 2010, 35, 6897–6904. [Google Scholar]
- Buyukaksoy, A.; Petrovsky, V.; Dogan, F. Redox Stable Solid Oxide Fuel Cells with Ni-YSZ Cermet Anodes Prepared by Polymeric Precursor Infiltration. J. Electrochem. Soc. 2012, 159, B232–B234. [Google Scholar] [CrossRef]
- Kim, S.D.; Moon, H.; Hyun, S.H.; Moon, J.; Kim, J.; Lee, H.W. Performance and durability of Ni-coated YSZ anodes for intermediate temperature solid oxide fuel cells. Solid State Ionics 2006, 177, 931–938. [Google Scholar]
- Lee, H.W.; Lee, J.H.; Kim, J.S.; Song, H.S.; Ko, H.J.; Lee, K.C. Anode of Solid Oxide Fuel Cell with Networking Structure and a Method of its Preparation. U.S. Patent 7,597,978, 6 October 2009. [Google Scholar]
- Waldbillig, D.; Wood, A.; Ivey, D.G. Enhancing the redox tolerance of anode-supported SOFC by microstructural modification. J. Electrochem. Soc. 2007, 154, B133–B138. [Google Scholar] [CrossRef]
- Ihringer, R. 2R-Cell: Reliability of anode supported thin electrolyte upon multi thermo and redox cycles in solid oxide fuel cell. In Proceedings of the European Fuel Cell Technology and Applications—Pietro Lunghi Conference, Rome, Italy, 15-18 December 2009; pp. 187–188.
- Ihringer, R. 2R-Cell: A Universal Cell for an Easy and Safe SOFC Operation. ECS Trans. 2011, 35, 393–402. [Google Scholar] [CrossRef]
- Wood, A.; Waldbillig, D. Preconditioning Treatment to Enhance Redox Tolerance of Solid Oxide Fuel Cells. WO Patent 2006077469, 29 June 2006. [Google Scholar]
- Larsen, P.H.; Chung, C.; Mogensen, M. Redox-Stable Anode. WO Patent Patent 2006079558A1, 3 August 2006. [Google Scholar]
- Kim, H.; Lu, C.; Worrell, W.L.; Vohs, J.M.; Gorte, R.J. Cu-Ni cermet anodes for direct oxidation of methane in solid-oxide fuel cells. J. Electrochem. Soc. 2002, 149, A247–A250. [Google Scholar]
- Arico, A.S.; Gullo, L.R.; La Rosa, D.; Siracusano, S.; Lopes Correira Tavares, A.B.; Sin Xicola, A. Ceramic Anode Solid Oxide Fuel Cell. WO Patent 04038844, 6 May 2004. [Google Scholar]
- La Rosa, D.; Lo Faro, M.; Monforte, G.; Antonucci, V.; Arico, A.S.; Sin, A. Recent advances in the development of NiCu alloy catalysts for IT-SOFCs. ECS Trans. 2007, 7, 1685–1693. [Google Scholar] [CrossRef]
- Sin, A.; Kopnin, E.; Dubitsky, Y.; Zaopo, A.; Arico, A.S.; La Rosa, D.; Gullo, L.R.; Antonucci, V. Performance and life-time behaviour of NiCu-CGO anodes for the direct electro-oxidation of methane in IT-SOFCs. J. Power Sources 2007, 164, 300–305. [Google Scholar]
- Sin Xicola, A.; Albizzati, E.; Arico, A.S.; Gullo, L.R.; La Rosa, D.; Antonucci, V. Solid Oxide Fuel Cell. WO Patent 05041329, 6 May 2005. [Google Scholar]
- Yokokawa, H.; Sakai, N.; Horita, T.; Yamaji, K. Recent developments in solid oxide fuel cell materials. Fuel Cells 2001, 1, 117–131. [Google Scholar] [CrossRef]
- Schäfer, W.; Koch, A.; Herold-Schmidt, U.; Stolten, D. Materials, interfaces and production techniques for planar solid oxide fuel cells. Solid State Ionics 1996, 86-88, 1235–1239. [Google Scholar]
- Jain, K.C.; Parsian, M.; Gillispie, B.; Keller, J.M.; Kerr, R.D. High strength support for solid oxide fuel cell. U.S. Patent 20090047569, 9 February 2009. [Google Scholar]
- Ukai, K.; Mizutani, Y.; Hisada, K.; Yokoyama, M.; Futaki, S.; Toya, H. Fuel electrode material, a fuel electrode, and a solid oxide fuel cell. U.S. Patent 20060110633 A1, 25 May 2006. [Google Scholar]
- Kiratzis, N.E.; Connor, P.; Irvine, J.T.S. Preparation and characterization of copper based cermet anodes for use in solid oxide fuel cells at intermediate temperatures. J. Electroceram. 2010, 24, 270–287. [Google Scholar] [CrossRef]
- Nakamura, K.; Somekawa, T.; Baba, Y.; Horiuchi, K.; Matsuzaki, Y.; Yoshimoto, M. Expansion and shrinkage in the redox process of (Mg,Ni)O solid solutions for preparation of steam reforming catalysts in SOFCs. J. Ceram. Soc. Jpn. 2009, 117, 166–170. [Google Scholar] [CrossRef]
- Fujita, K.; Somekawa, T.; Hatae, T.; Matsuzaki, Y. Residual stress and redox cycling of segmented-in-series solid oxide fuel cells. J. Power Sources 2011, 196, 9022–9026. [Google Scholar]
- Somekawa, T.; Horiuchi, K.; Matsuzaki, Y. A study of electrically insulated oxide substrates for flat-tube segmented-in-series solid oxide fuel cells. J. Power Sources 2012, 202, 114–119. [Google Scholar] [CrossRef]
- Ishida, M.; Yamamoto, M.; Ohba, T. Experimental results of chemical-looping combustion with NiO/NiAl2O4 particle circulation at 1200 °C. Energy Convers. Manage. 2002, 43, 1469–1478. [Google Scholar] [CrossRef]
- Villa, R.; Cristiani, C.; Groppi, G.; Lietti, L.; Forzatti, P.; Cornaro, U.; Rossini, S. Ni based mixed oxide materials for CH4 oxidation under redox cycle conditions. J. Mol. Catal. A Chem. 2003, 204-205, 637–646. [Google Scholar] [CrossRef]
- Tao, S.; Irvine, J.T.S. Discovery and characterization of novel oxide anodes for solid oxide fuel cells. Chem. Rec. 2004, 4, 83–95. [Google Scholar] [CrossRef]
- Tietz, F.; Fu, Q.; Haanappel, V.A.C.; Mai, A.; Menzler, N.H.; Uhlenbruck, S. Materials development for advanced planar solid oxide fuel cells. Int. J. Appl. Ceram. Technol. 2007, 4, 436–445. [Google Scholar] [CrossRef]
- Atkinson, A.; Barnett, S.; Gorte, R.J.; Irvine, J.T.S.; McEvoy, A.J.; Mogensen, M.; Singhal, S.C.; Vohs, J. Advanced anodes for high-temperature fuel cells. Nat. Mater. 2004, 3, 17–27. [Google Scholar] [CrossRef]
- Marina, O.A.; Bagger, C.; Primdahl, S.; Mogensen, M. A solid oxide fuel cell with a gadolinia-doped ceria anode: Preparation and performance. Solid State Ionics 1999, 123, 199–208. [Google Scholar] [CrossRef]
- Marina, O.A.; Canfield, N.L.; Stevenson, J.W. Thermal, electrical, and electrocatalytical properties of lanthanum-doped strontium titanate. Solid State Ionics 2002, 149, 21–28. [Google Scholar] [CrossRef]
- Marina, O.A.; Stevenson, J.W. Integral Solid Oxide Fuel Cell for Reacting Fuel Gas With Oxidant Gas at Elevated Temperature to Produce Direct Current Output Voltage, Includes Conductive Anode Layer Comprising Cerium-Modified Doped Strontium Titanate Material. U.S. Patent 20040001994, 1 January 2004. [Google Scholar]
- Marina, O.A.; Pederson, L.R. Composite solid oxide fuel cell anode based on ceria and strontium titanate. U.S. Patent 20087468218, 23 December 2008. [Google Scholar]
- Marina, O.A.; Pederson, L.R. Anode for making solid oxide fuel cell for use in fuel cell stack assembly comprises two phase mixture including a second phase of donor-doped cerium oxide. U.S. Patent 2005250000-A1, 10 November 2005. [Google Scholar]
- Fu, Q.; Tietz, F.; Buchkremer, H.-P.; Stoever, D. Ceramic Material Combination for an Anode of a High-Temperature Fuel Cell. WO Patent 08003288, 10 January 2008. [Google Scholar]
- Miller, D.N.; Irvine, J. B-site doping of lanthanum strontium titanate for SOFC anodes. In Proceedings of the 9th European Solid Oxide Fuel Cell Forum; Connor, P., Ed.; EFCF: Lucerne, Switzerland, 2010; pp. 9–104. [Google Scholar]
- Gross, M.D.; Vohs, J.M.; Gorte, R.J. A strategy for achieving high performance with SOFC ceramic anodes. Electrochem. Solid State Lett. 2007, 10, B65–B69. [Google Scholar]
- Bierschenk, D.M.; Potter-Nelson, E.; Hoel, C.; Liao, Y.; Marks, L.; Poeppelmeier, K.R.; Barnett, S.A. Pd-substituted (La,Sr)CrO3−delta-Ce0.9Gd0.1O2−delta solid oxide fuel cell anodes exhibiting regenerative behavior. J. Power Sources 2011, 196, 3089–3094. [Google Scholar]
- Bastidas, D.M.; Tao, S.; Irvine, J.T.S. A symmetrical solid oxide fuel cell demonstrating redox stable perovskite electrodes. J. Mater. Chem. 2006, 16, 1603–1605. [Google Scholar]
- Ruiz-Morales, J.C.; Canales-Vazquez, J.; Pena-Martinez, J.; Lopez, D.M.; Nunez, P. On the simultaneous use of La0.75Sr0.25Cr0.5Mn0.5O3−d as both anode and cathode material with improved microstructure in solid oxide fuel cells. Electrochim. Acta 2006, 52, 278–284. [Google Scholar]
- Sin, Y.W.; Petrovsky, V.; Anderson, H.U. Redox stable electrodes for hydrogen producing solid oxide electrolyzer. ECS Trans. 2007, 2, 1–7. [Google Scholar]
- Barnett, S.A.; Liu, J.; Madsen, B.; Ji, Z. Fuel-Flexible Anodes for Solid Oxide Fuel Cells. WO Patent 03041196, 15 May 2003. [Google Scholar]
- Barnett, S.; Liu, J.; Lin, Y. Operation of Solid Oxide Fuel Cell Anodes with Practical Hydrocarbon Fuels; Northwestern University: Evanston, IL, USA, 2004. [Google Scholar]
- Cassidy, M.; Boulfrad, S.; Irvine, J.; Chung, C.; Jorger, M.; Munnings, C.; Pyke, S. Integration of oxide anodes into the Rolls-Royce IP-SOFC concept. Fuel Cells 2009, 9, 891–898. [Google Scholar] [CrossRef]
- Martinez-Arias, A.; Hungria, A.B.; Fernandez-Garcia, M.; Iglesias-Juez, A.; Conesa, J.C.; Mather, G.C.; Munuera, G. Cerium-terbium mixed oxides as potential materials for anodes in solid oxide fuel cells. J. Power Sources 2005, 151, 43–51. [Google Scholar]
- Tomita, A.; Tsunekawa, K.; Hibino, T.; Teranishi, S.; Tachi, Y.; Sano, M. Chemical and redox stabilities of a solid oxide fuel cell with BaCe0.8Y0.2O3−d functioning as an electrolyte and as an anode. Solid State Ionics 2006, 177. [Google Scholar]
- Yoon, K.J.; Coyle, C.A.; Marina, O.A. Doped yttrium chromite-ceria composite as a redox-stable and sulfur-tolerant anode for solid oxide fuel cells. Electrochem. Commun. 2011, 13, 1400–1403. [Google Scholar]
- Smith, B.H.; Gross, M.D. A highly conductive oxide anode for solid oxide fuel cells. Electrochem. Solid State Lett. 2011, 14, B1–B5. [Google Scholar]
- Fu, Q.; Tietz, F.; Sebold, D.; Tao, S.; Irvine, J.T.S. An efficient ceramic-based anode for solid oxide fuel cells. J. Power Sources 2007, 171, 663–669. [Google Scholar]
- Fu, Q.; Tietz, F.; Stoever, D. Electrical conductivity and redox behaviour of yttrium-substituted SrTiO3: Dependence on preparation and processing procedures. In Proceedings of Electrochemical Society, Quebec, Canada, 2005; pp. 1417–1428.
- Fu, Q.X.; Tietz, F.; Lersch, P.; Stover, D. Evaluation of Sr- and Mn-substituted LaAlO3 as potential SOFC anode materials. Solid State Ionics 2006, 177, 1059–1069. [Google Scholar] [CrossRef]
- Fu, Q.X.; Tietz, F.; Stoever, D. La0.4Sr0.6Ti1−xMnxO3−d perovskites as anode materials for solid oxide fuel cells. J. Electrochem. Soc. 2006, 153. [Google Scholar]
- Ma, Q.; Tietz, F.; Stover, D. Nonstoichiometric Y-substituted SrTiO3 materials as anodes for solid oxide fuel cells. Solid State Ionics 2011, 192, 535–539. [Google Scholar] [CrossRef]
- Ma, Q.; Tietz, F.; Leonide, A.; Ivers-Tiffée, E. SOFCs based on Y-substituted SrTiO3 ceramic anode materials. In Proceedings of the 9th European Solid Oxide Fuel Cell Forum; Connor, P., Ed.; EFCF: Lucerne, Switzerland, 2010; pp. 71–80. [Google Scholar]
- Ma, Q.; Tietz, F.; Leonide, A.; Ivers-Tiffée, E. Anode-supported planar SOFC with high performance and redox stability. Electrochem. Commun. 2010, 12, 1326–1328. [Google Scholar]
- Ma, Q.; Tietz, F.; Leonide, A.; Ivers-Tiffee, E. Electrochemical performances of solid oxide fuel cells based on Y-substituted SrTiO3 ceramic anode materials. J. Power Sources 2011, 196, 7308–7312. [Google Scholar] [CrossRef]
- Waldbillig, D.; Wood, A.; Joia, T.; Tang, E. Anode Supported Solid Oxide Fuel Cell with a Porous Multifunctional Layer. WO Patent 2006010260A1, 2 February 2006. [Google Scholar]
- Lee, D.; Lee, I.; Jeon, Y.; Song, R. Characterization of scandia stabilized zirconia prepared by glycine nitrate process and its performance as the electrolyte for IT-SOFC. Solid State Ionics 2005, 176, 1021–1025. [Google Scholar] [CrossRef]
- Mizutani, Y.; Hisada, K.; Ukai, K.; Sumi, H.; Yokoyama, M.; Nakamura, Y.; Yamamoto, O. From rare earth doped zirconia to 1 kW solid oxide fuel cell system. J. Alloys Compd. 2006, 408-412, 518–524. [Google Scholar] [CrossRef]
- Ju, Y.W.; Ida, S.; Inagaki, T.; Ishihara, T. Reoxidation behavior of Ni-Fe bimetallic anode substrate in solid oxide fuel cells using a thin LaGaO3 based film electrolyte. J. Power Sources 2011, 196, 6062–6069. [Google Scholar] [CrossRef]
- Frandsen, H.L.; Ramos, T.; Faes, A.; Pihlatie, M.; Brodersen, K. Optimization of the strength of SOFC anode supports. J. Eur. Ceram. Soc. 2012, 32, 1041–1052. [Google Scholar] [CrossRef]
© 2012 by the authors; licensee MDPI, Basel, Switzerland. This article is an open access article distributed under the terms and conditions of the Creative Commons Attribution license (http://creativecommons.org/licenses/by/3.0/).
Share and Cite
Faes, A.; Hessler-Wyser, A.; Zryd, A.; Van herle, J. A Review of RedOx Cycling of Solid Oxide Fuel Cells Anode. Membranes 2012, 2, 585-664. https://doi.org/10.3390/membranes2030585
Faes A, Hessler-Wyser A, Zryd A, Van herle J. A Review of RedOx Cycling of Solid Oxide Fuel Cells Anode. Membranes. 2012; 2(3):585-664. https://doi.org/10.3390/membranes2030585
Chicago/Turabian StyleFaes, Antonin, Aïcha Hessler-Wyser, Amédée Zryd, and Jan Van herle. 2012. "A Review of RedOx Cycling of Solid Oxide Fuel Cells Anode" Membranes 2, no. 3: 585-664. https://doi.org/10.3390/membranes2030585