Article

Preparation and Characterization of Hydrophilically Modified PVDF Membranes by a Novel Nonsolvent Thermally Induced Phase Separation Method

1
Faculty of Materials Science and Chemical Engineering, Ningbo University, Ningbo 315211, China
2
Tri-Tech Chemical Co. Pty Ltd, 5-11 Normanby Ave, Sunshine VIC 3020, Australia
3
Institute for Sustainability and Innovation, College of Engineering and Science, Victoria University, P.O. Box 14428, Melbourne 8001, Australia
*
Authors to whom correspondence should be addressed.
Membranes 2016, 6(4), 47; https://doi.org/10.3390/membranes6040047
Submission received: 14 October 2016 / Revised: 11 November 2016 / Accepted: 14 November 2016 / Published: 18 November 2016
(This article belongs to the Special Issue Feature Papers)

Abstract

:
In this study, a nonsolvent thermally-induced phase separation (NTIPS) method was first proposed to fabricate hydrophilically-modified poly(vinylidene fluoride) (PVDF) membranes to overcome the drawbacks of conventional thermally-induced phase separation (TIPS) and nonsolvent-induced phase separation (NIPS) methods. Hydrophilically-modified PVDF membranes were successfully prepared by blending in hydrophilic polymer polyvinyl alcohol (PVA) at 140 °C. A series of PVDF/PVA blend membranes was prepared at different total polymer concentrations and blend ratios. The morphological analysis via SEM indicated that the formation mechanism of these hydrophilically-modified membranes was a combined NIPS and TIPS process. As the total polymer concentration increased, the tensile strength of the membranes increased; meanwhile, the membrane pore size, porosity and water flux decreased. With the PVDF/PVA blend ratio increased from 10:0 to 8:2, the membrane pore size and water flux increased. The dynamic water contact angle of these membranes showed that the hydrophilic properties of PVDF/PVA blend membranes were prominently improved. The higher hydrophilicity of the membranes resulted in reduced membrane resistance and, hence, higher permeability. The total resistance Rt of the modified PVDF membranes decreased significantly as the hydrophilicity increased. The irreversible fouling related to pore blocking and adsorption fouling onto the membrane surface was minimal, indicating good antifouling properties.

1. Introduction

The worldwide problems associated with the shortage of clean water have driven the rapid development of waste water treatment technologies. Membrane-based processes received much attention. In particular, microfiltration (MF) and ultrafiltration (UF) are the most popular methods for portable water purification due to the high efficiency, low costs, ease of implementation and low environmental impact [1,2]. MF (pore size range of 0.1 μm–10 μm) and UF (pore size range of 0.01 μm–0.1 μm) membranes are effectively used in wastewater pretreatment for filtering organic micropollutants. Amongst the commonly-used materials for MF/UF applications, poly(vinylidene fluoride) (PVDF) is one of the most widely-used membrane materials in water treatment due to its excellent chemical and thermal stability, as well as high mechanical strength [3,4].
Unfortunately, its lower surface energy and relatively high hydrophobicity lead to the increase of the transmembrane pressure of the PVDF membrane, irreversible fouling and rapid flux decline compared to hydrophilic membranes when treating waste water containing organic pollutants [4]. Subsequently, deteriorating membrane performance over time and frequent interruption of operation for membrane cleaning are the major drawbacks for MF/UF applications, leading to significant energy consumption and high cost. Attention has been paid to improving membrane performance to mitigate membrane fouling and reduce operation cost [5]. Usually, fouling is caused by the deposition of organic and inorganic compounds on the membrane surface and into its pores. These compounds commonly result in the formation of a cake and gel layer, adsorption and pore blockage [5,6,7,8,9,10]. It is known that a hydrophilic surface offers a better antifouling property for the membrane [11,12]. A pure water layer could easily form on a highly hydrophilic membrane surface for preventing the adsorption and deposition of hydrophobic pollutants and, hence, can reduce fouling [4]. Therefore, hydrophilic modification of MF/UF membranes becomes the main method to improve anti-fouling properties [4,11]. Among different methods, blending modification by hydrophilic polymers is the most reported approach due to its simplicity and effectiveness.
In the literature, nonsolvent-induced phase separation (NIPS) [13,14,15,16] and thermally-induced phase separation (TIPS) [17,18] are mostly commonly adopted to prepare PVDF membranes. In general, the NIPS method requires complicated control of the solvent exchange rate by simultaneously varying several process parameters, such as the dope composition, additives, coagulation medium, quenching bath temperature and evaporation time, to obtain PVDF membranes with the desired morphology and good performance [19,20]. In comparison, the TIPS process is relatively simple for obtaining a membrane with higher overall porosity, better mechanical strength and a narrower pore size distribution [4,21]. However, since it is difficult to form an asymmetric PVDF membrane structure with a skin layer using TIPS [4], NIPS is more commonly used to fabricate the PVDF membrane. Thus far, the PVDF/hydrophilic polymer blend membrane prepared by the TIPS method has not been reported in the literature. In TIPS, the polymer is dissolved in the diluent at high temperature, and phase separation is induced by cooling the dope solution [22]. Hence, the selection of diluent is crucial for membrane formation, as it serves as both a nonsolvent for the polymer at the quenching temperature (e.g., room temperature) and a strong solvent at high temperature (i.e., membrane fabrication temperature) to induce the TIPS mechanism [22]. Moreover, the dissolution temperature of PVDF and membrane preparation temperature are normally higher than the melting point of PVDF. For example, 240 °C was used as the membrane fabrication temperature by Ji et al. [23]. However, at such a high fabrication temperature, the hydrophilic polymers, such as polyvinyl alcohol (PVA) and polyvinylpyrrolidone (PVP), could be partly oxidized, cross-linked, thermally decomposed or depolymerized [24], which will strongly influence the stability and repeatability of the dope solution. In other words, the high temperature of the TIPS process is not suitable for the fabrication of hydrophilically-modified PVDF membranes. In our previous work [25], a novel water-soluble diluent ε-caprolactam (CPL) was first used to dissolve PVDF and obtained homogeneous PVDF casting solutions at a much lower fabrication temperature of 130 °C by a nonsolvent thermally-induced phase separation (NTIPS) method, which has combined the advantages of NIPS and TIPS. With the appropriately-selected diluent for the PVDF polymer, the low solution temperature can substantially eliminate the effects of high temperature on the stability of the hydrophilic polymer used for fabricating hydrophilically-modified PVDF membranes with the desired pore structure and performance.
In this study, to obtain the desired membrane characteristics under simpler fabrication conditions, a nonsolvent thermally-induced phase separation approach (NTIPS) [25] is first used to prepare hydrophilically-modified PVDF/PVA blend membranes. ε-caprolactam is used as the diluent of PVDF at a fabrication temperature of 140 °C. The PVDF/PVA blending ratio and total polymer concentration of the casting solution are optimized. The pore structure and filtration performance of the PVDF/PVA blend membranes are studied. Bovine serum albumin (BSA) is used as a modelled foulant to study the fouling propensity of the membranes. The membrane fouling resistance analysis is conducted to confirm the advantages of hydrophilically-modified PVDF membranes via the NTIPS method.

2. Materials and Methods

2.1. Materials

The PVDF (Model: 1015) polymer was supplied by Solvay Co. Bovine (Shanghai, China) serum albumin (BSA, MW = 67,000, Biochemical reagents) was purchased from Aladdin Industrial (Shanghai, China). Polyvinyl alcohol (PVA, Model: 1788) and ε-caprolactam (CPL, 99.5%), both supplied by Aladdin Industrial, were used as the hydrophilic modification polymer and diluent, respectively.

2.2. Preparation of Hydrophilically-Modified PVDF Membranes

The PVDF, PVA and CPL were mixed in a container proportionately to prepare a casting solution. The composition of the solutions for various PVDF/PVA blend membranes is shown in Table 1. The solution was heated up in an oil bath under the protection of nitrogen at 140 °C and stirred at a constant speed of 120 rpm to form a homogeneous dope solution. The solutions were degassed at the preparation temperatures and then were rapidly casted on the glass plate by an automated high-temperature casting machine described elsewhere [25], which was preheated to 140 °C. The nascent membrane was quickly and smoothly immersed into a water coagulant bath (25 °C). After the nascent membrane was completely solidified, the membrane was transferred into a flowing water bath to remove residual diluent and subsequently stored in DI water before use.

2.3. Membrane Characterization

The membrane surface and cross-sectional morphologies were observed using a scanning electron microscope (Model: TM3000, Hitachi, Tokyo, Japan). The membrane samples were fractured in liquid nitrogen. All samples were coated with a thin layer of gold in standard high vacuum conditions before scanning.
The mechanical properties of the membranes were measured via tensile strength using a tensiometer (Model: 5542, Instron Corp., Boston, MA, USA). Five pieces of membrane samples under each fabrication condition were tested to ensure reproducibility.
Dynamic water contact angles of the membranes were measured with an angle meter (Model: JC2000D2, Shanghai Zhongchen Company, Shanghai, China) to evaluate the membrane hydrophilicity. DI water was dropped on the sample surface at five different sites. Repetition of water contact angle measurements was done with three membrane samples under the same fabrication conditions.
The membrane porosity was tested according to the method described in the literature [26]. The membranes were weighed when wet and were later dried in an oven. The porosity (Pr) was calculated with the following equation:
P r = ( W w W d ) / d w A m L m × 100 %
where Ww is the weight of the wet membrane (g), Wd is the weight of the dry membrane (g), dw is the water density (g/cm3) and Am and Lm are the membrane area (cm2) and thickness (cm), respectively.
The pore size distribution of the membranes was determined by the liquid-liquid displacement method based on an isobutanol-DI water system. The detailed experimental procedure can be found elsewhere [27,28,29,30].

2.4. Antifouling Performance and Membrane Fouling Resistance Analysis

For membrane performance evaluation, a flat-sheet membrane testing cell (MSC 300, Shanghai Mosu Science Company, Shanghai, China) was used to measure water flux under a pressure of 0.1 MPa. The effective membrane area was 35 cm2. The water flux, J, was calculated by the following equation:
J = V / ( A t )
where J is the water flux (L·m−2·h−1), V is the volume of permeated water (L), A is the effective membrane area (m2) and t is the filtration time (h).
The membranes were pre-pressurized by filtering DI water for 0.5 h until the flux reached a plateau, and then, three steps of filtration were performed. Firstly, a 30-min period of recording the initial water flux (Ji) was measured with DI water at 0.1 MPa. Secondly, the BSA filtration test was carried out for 1 h, and the membrane fouling step water flux (Jf) was measured by filtering the BSA (1 g/L) solution at 0.1 MPa. Thirdly, at the end of the BSA fouling run, membrane “physical” cleaning was carried out, and then the post-cleaning water flux recovered (Jr) was measured with DI water at 0.1 MPa. For membrane cleaning, the membrane surface was flushed with DI water under stirring (200 rpm) condition for 5 h. Normalized fluxes in Steps 2 and 3, i.e., Jf/Ji and Jr/Ji, were used to evaluate the antifouling performances of the currently-developed membranes [31,32,33,34].
According to Darcy–Poiseuille’s law [35], in the filtration process, the membrane total resistance Rt (m−1) can be divided into the intrinsic membrane resistance Rm (m−1) and the fouling resistance Rf (m−1). Rm is the initial hydraulic resistance, calculated from Darcy’s law Equation (3) [35] using the initial water flux (Ji) measured:
J i = Δ P / μ R m
where ΔP (Pa) is the transmembrane pressure and μ (Pa∙s) is the viscosity of the feed solution.
For further interpretations, fouling resistance Rf can be divided into a reversible resistance Rrevf (m−1) and an irreversible resistance Rirrf (m−1) [36]. Rirrf can be calculated applying Equation (4) to the recovered water flux (Jr), whereas Rrevf is calculated according to Equation (5):
J r = Δ P / μ ( R m + R i r r f )
J f = Δ P / μ R t = Δ P / μ ( R m + R f ) = Δ P / μ ( R m + R r e v f + R i r r f )
where Rt is the total resistance (m−1). Rrevf is due to concentration polarization and the formation of a cake layer on the membrane surface, removable by physical cleaning; Rirrf is due to pore blocking, and adsorption and can only be suppressed by chemical cleaning [37], which however was not investigated in this study.

3. Results and Discussion

3.1. Investigation on Total Polymer Concentration

Newly-prepared membranes S1S6 (Table 1) with different total polymer concentrations at a PVDF/PVA blend ratio of 8:2 were used to investigate the influence on membrane structure and filtration performance.

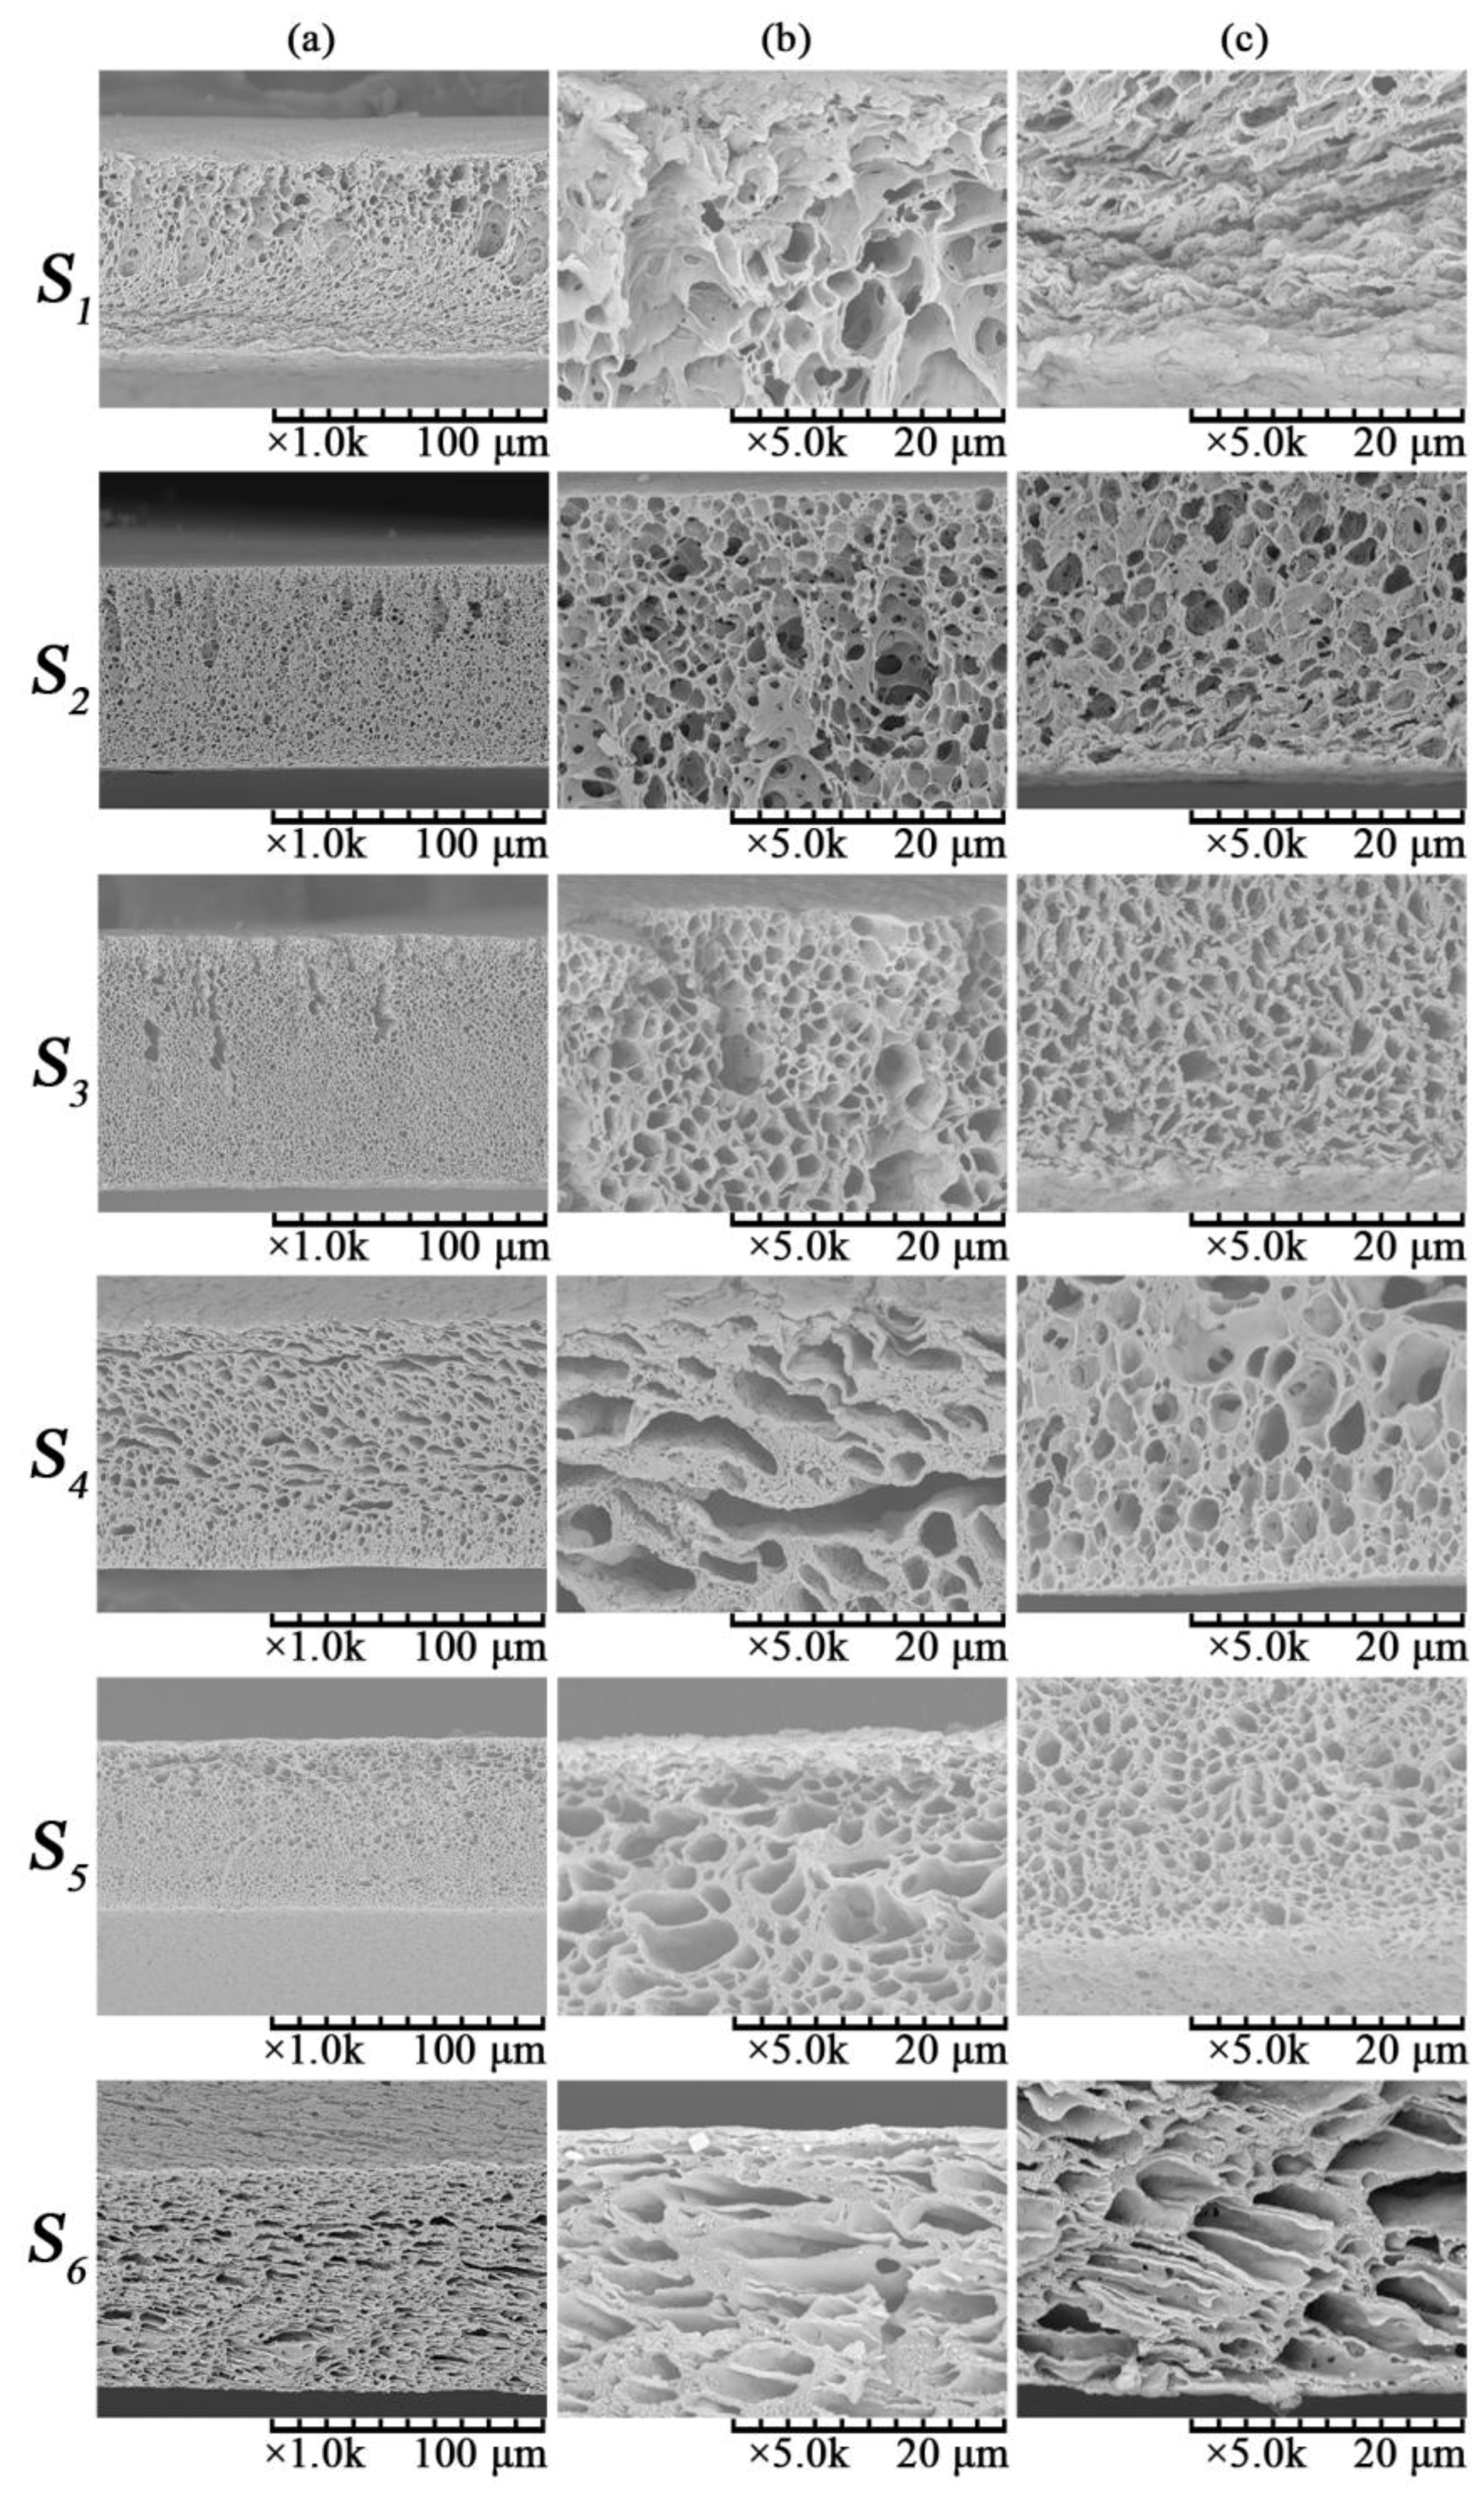
3.1.1. Effect of Total Polymer Concentration on Membrane Morphology

Figure 1 shows the cross-section morphologies of membranes S1S6; Columns (a), (b) and (c) are the full cross-section, the cross-section adjacent to the top surface and the cross-section adjacent to the bottom surface, respectively.
It is observed in Figure 1b that the cross-section structure adjacent to the top surface gradually changes from long finger-like pores to cellular pores with increasing total polymer concentration from S1S6. The finger-like pores eventually disappeared with the further increase in the total polymer concentration over 22 wt % (S4). This is because at a low total polymer content, the casting solution has low viscosity, and molecules move more freely [38], which is beneficial to the double-diffusion between water and solvent resulting in the formation of large finger-like pores. As the total polymer concentration increased to 22 wt % (S4) and above, both the viscosity of the casting solution and the mass transfer resistance of the solvent exchange increased. This has impeded the interactions between solvent and non-solvent (water) when the nascent membrane was immersed into the coagulation bath. The crystallization rate of PVDF would be reduced, hence resulting in the formation of a cellular pore structure adjacent to the top surface of the membrane. The NIPS mechanism plays an important role in forming the cellular morphology of the top surface, which was also observed in the literature [39].
Different from the cross-section structure adjacent to the top surface, Figure 1c shows that the cross-sectional structure in the sublayer adjacent to the bottom surface of the membrane gradually changes from a bicontinuous network pore to a cellular pore structure as the total polymer concentration increases from S1S6. The pore structure of the bottom surface is mainly formed via the TIPS mechanism, as observed in a previous study [25]. Detailed explanations on the membrane formation mechanism will be provided in Section 3.2.
Figure 2 illustrates the effect of total polymer concentration on membrane porosity. It is observed that as the total polymer concentration increased from 16 wt %–26 wt % at the same blend ratio, the porosity of membrane decreased from about 86% down to 50%. The results are consistent with the variation in membrane structure indicated in Figure 1.

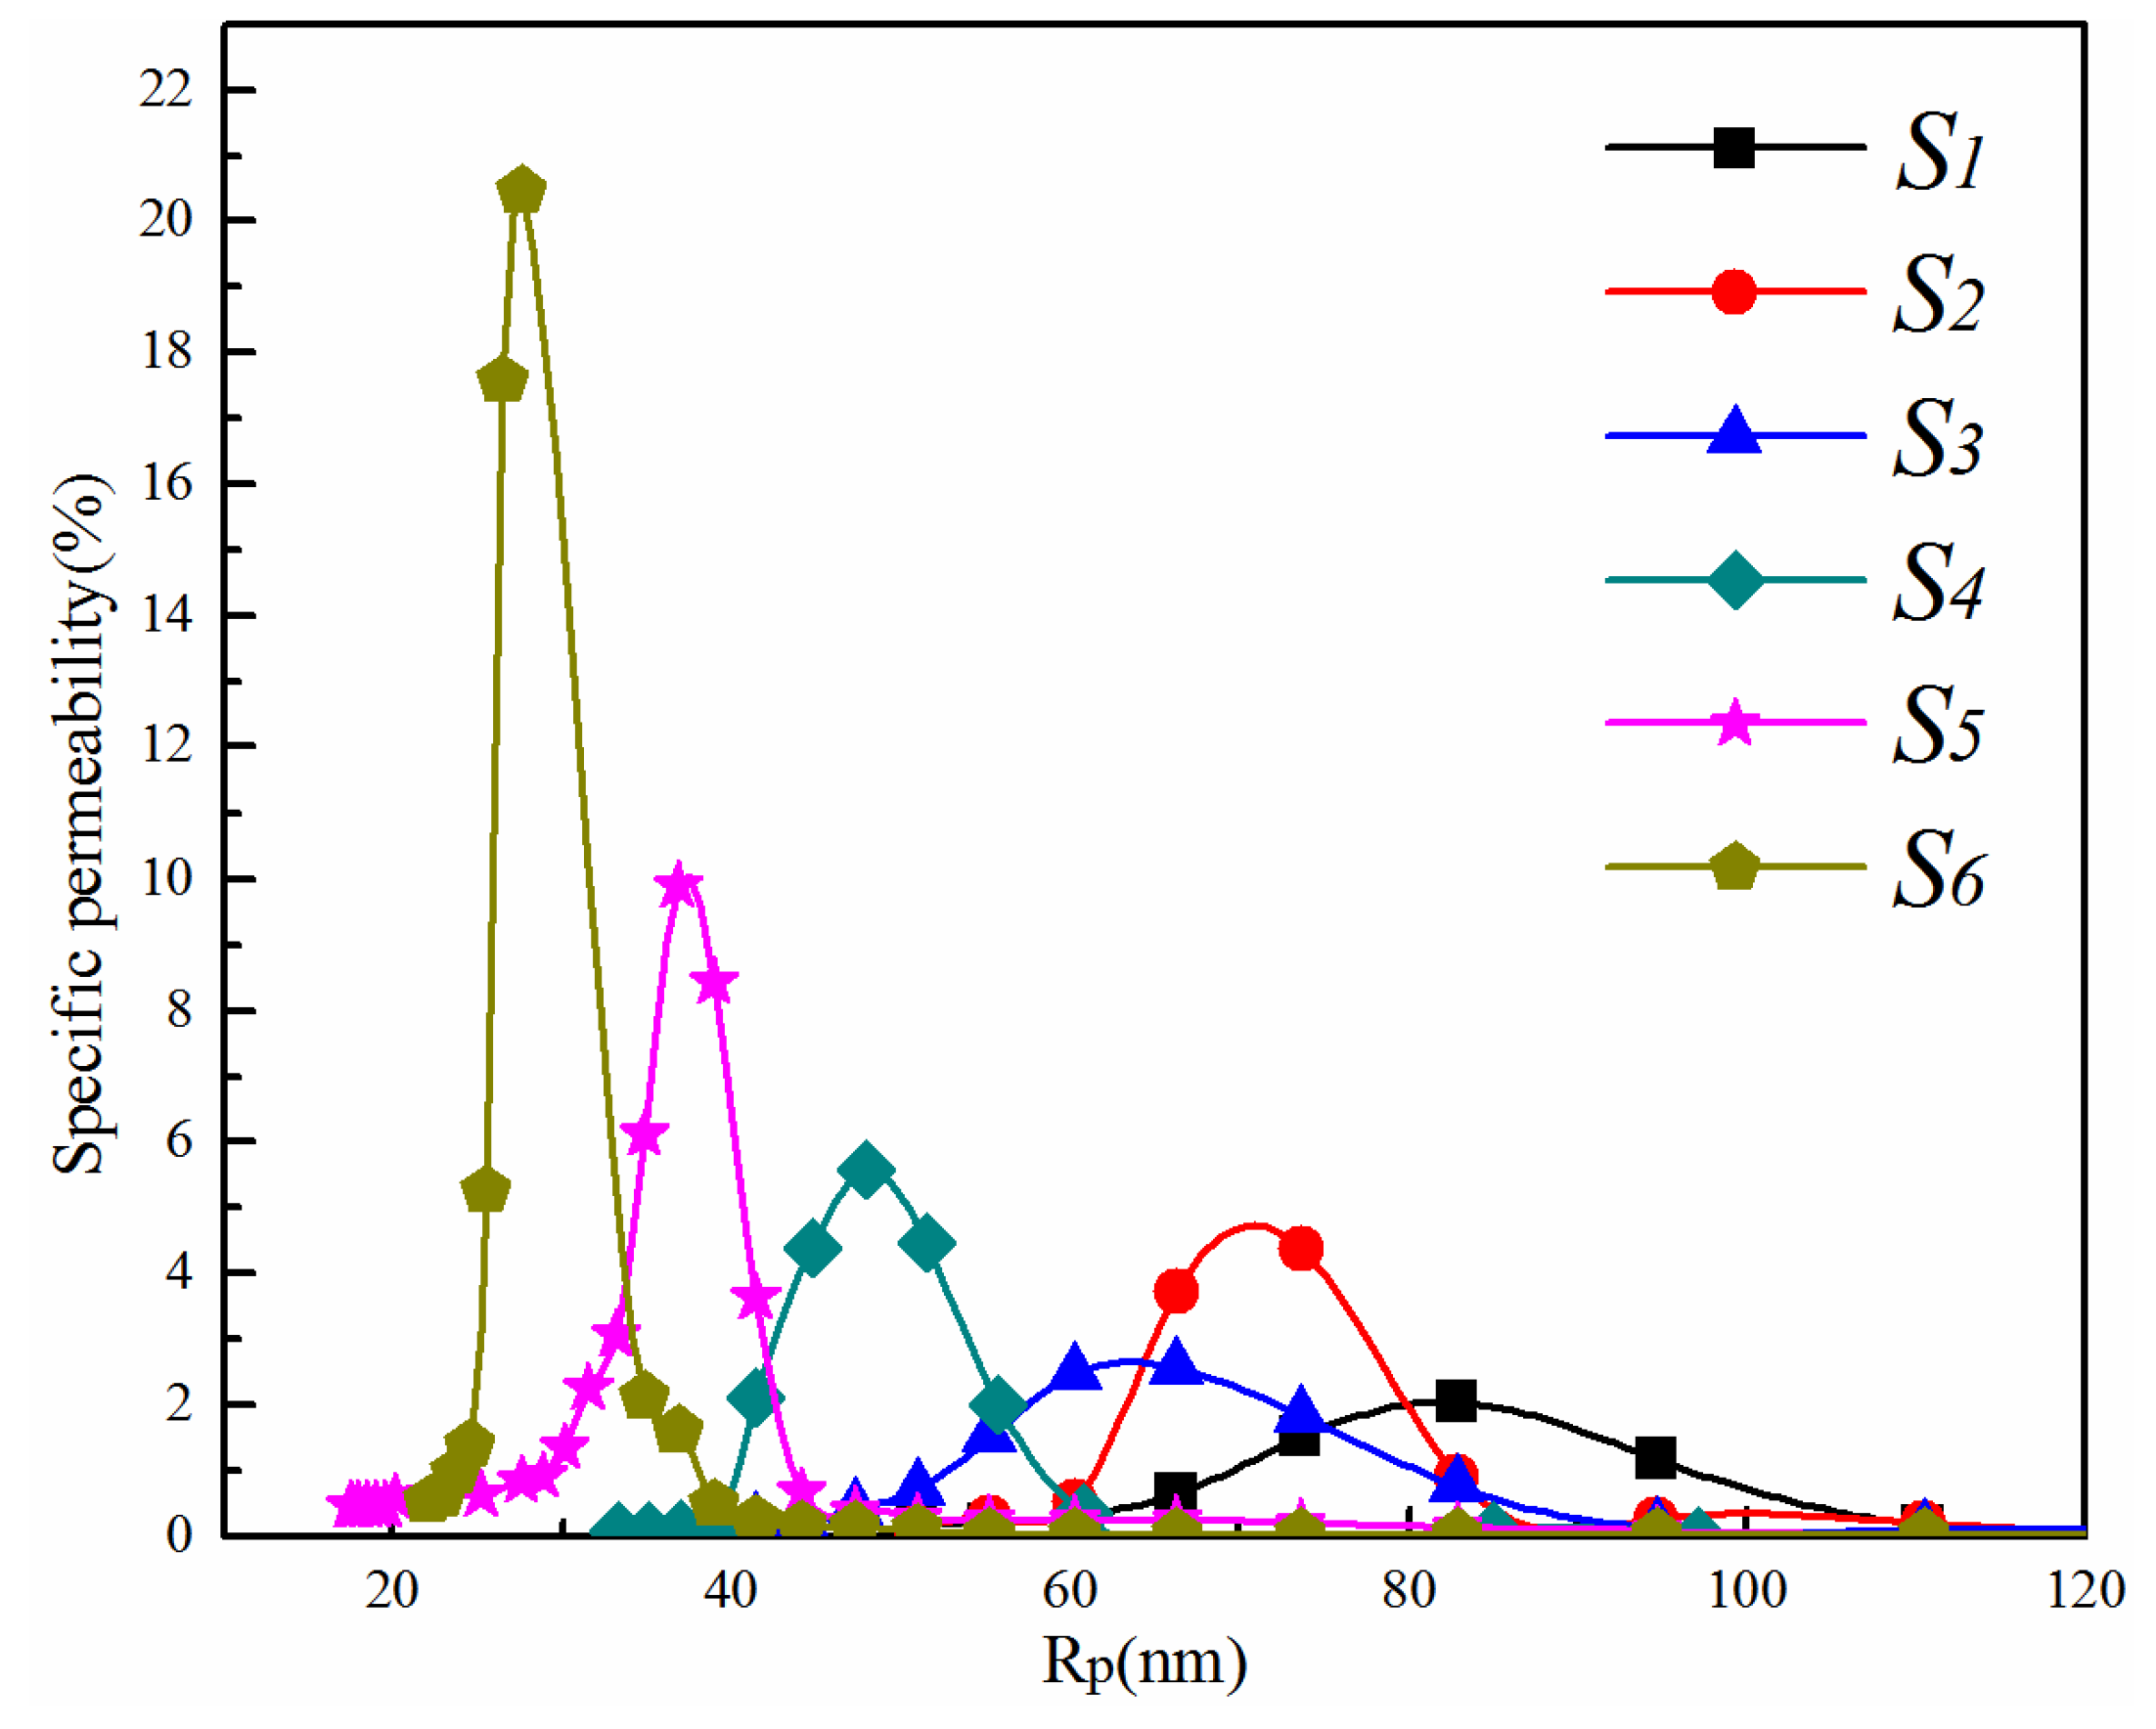
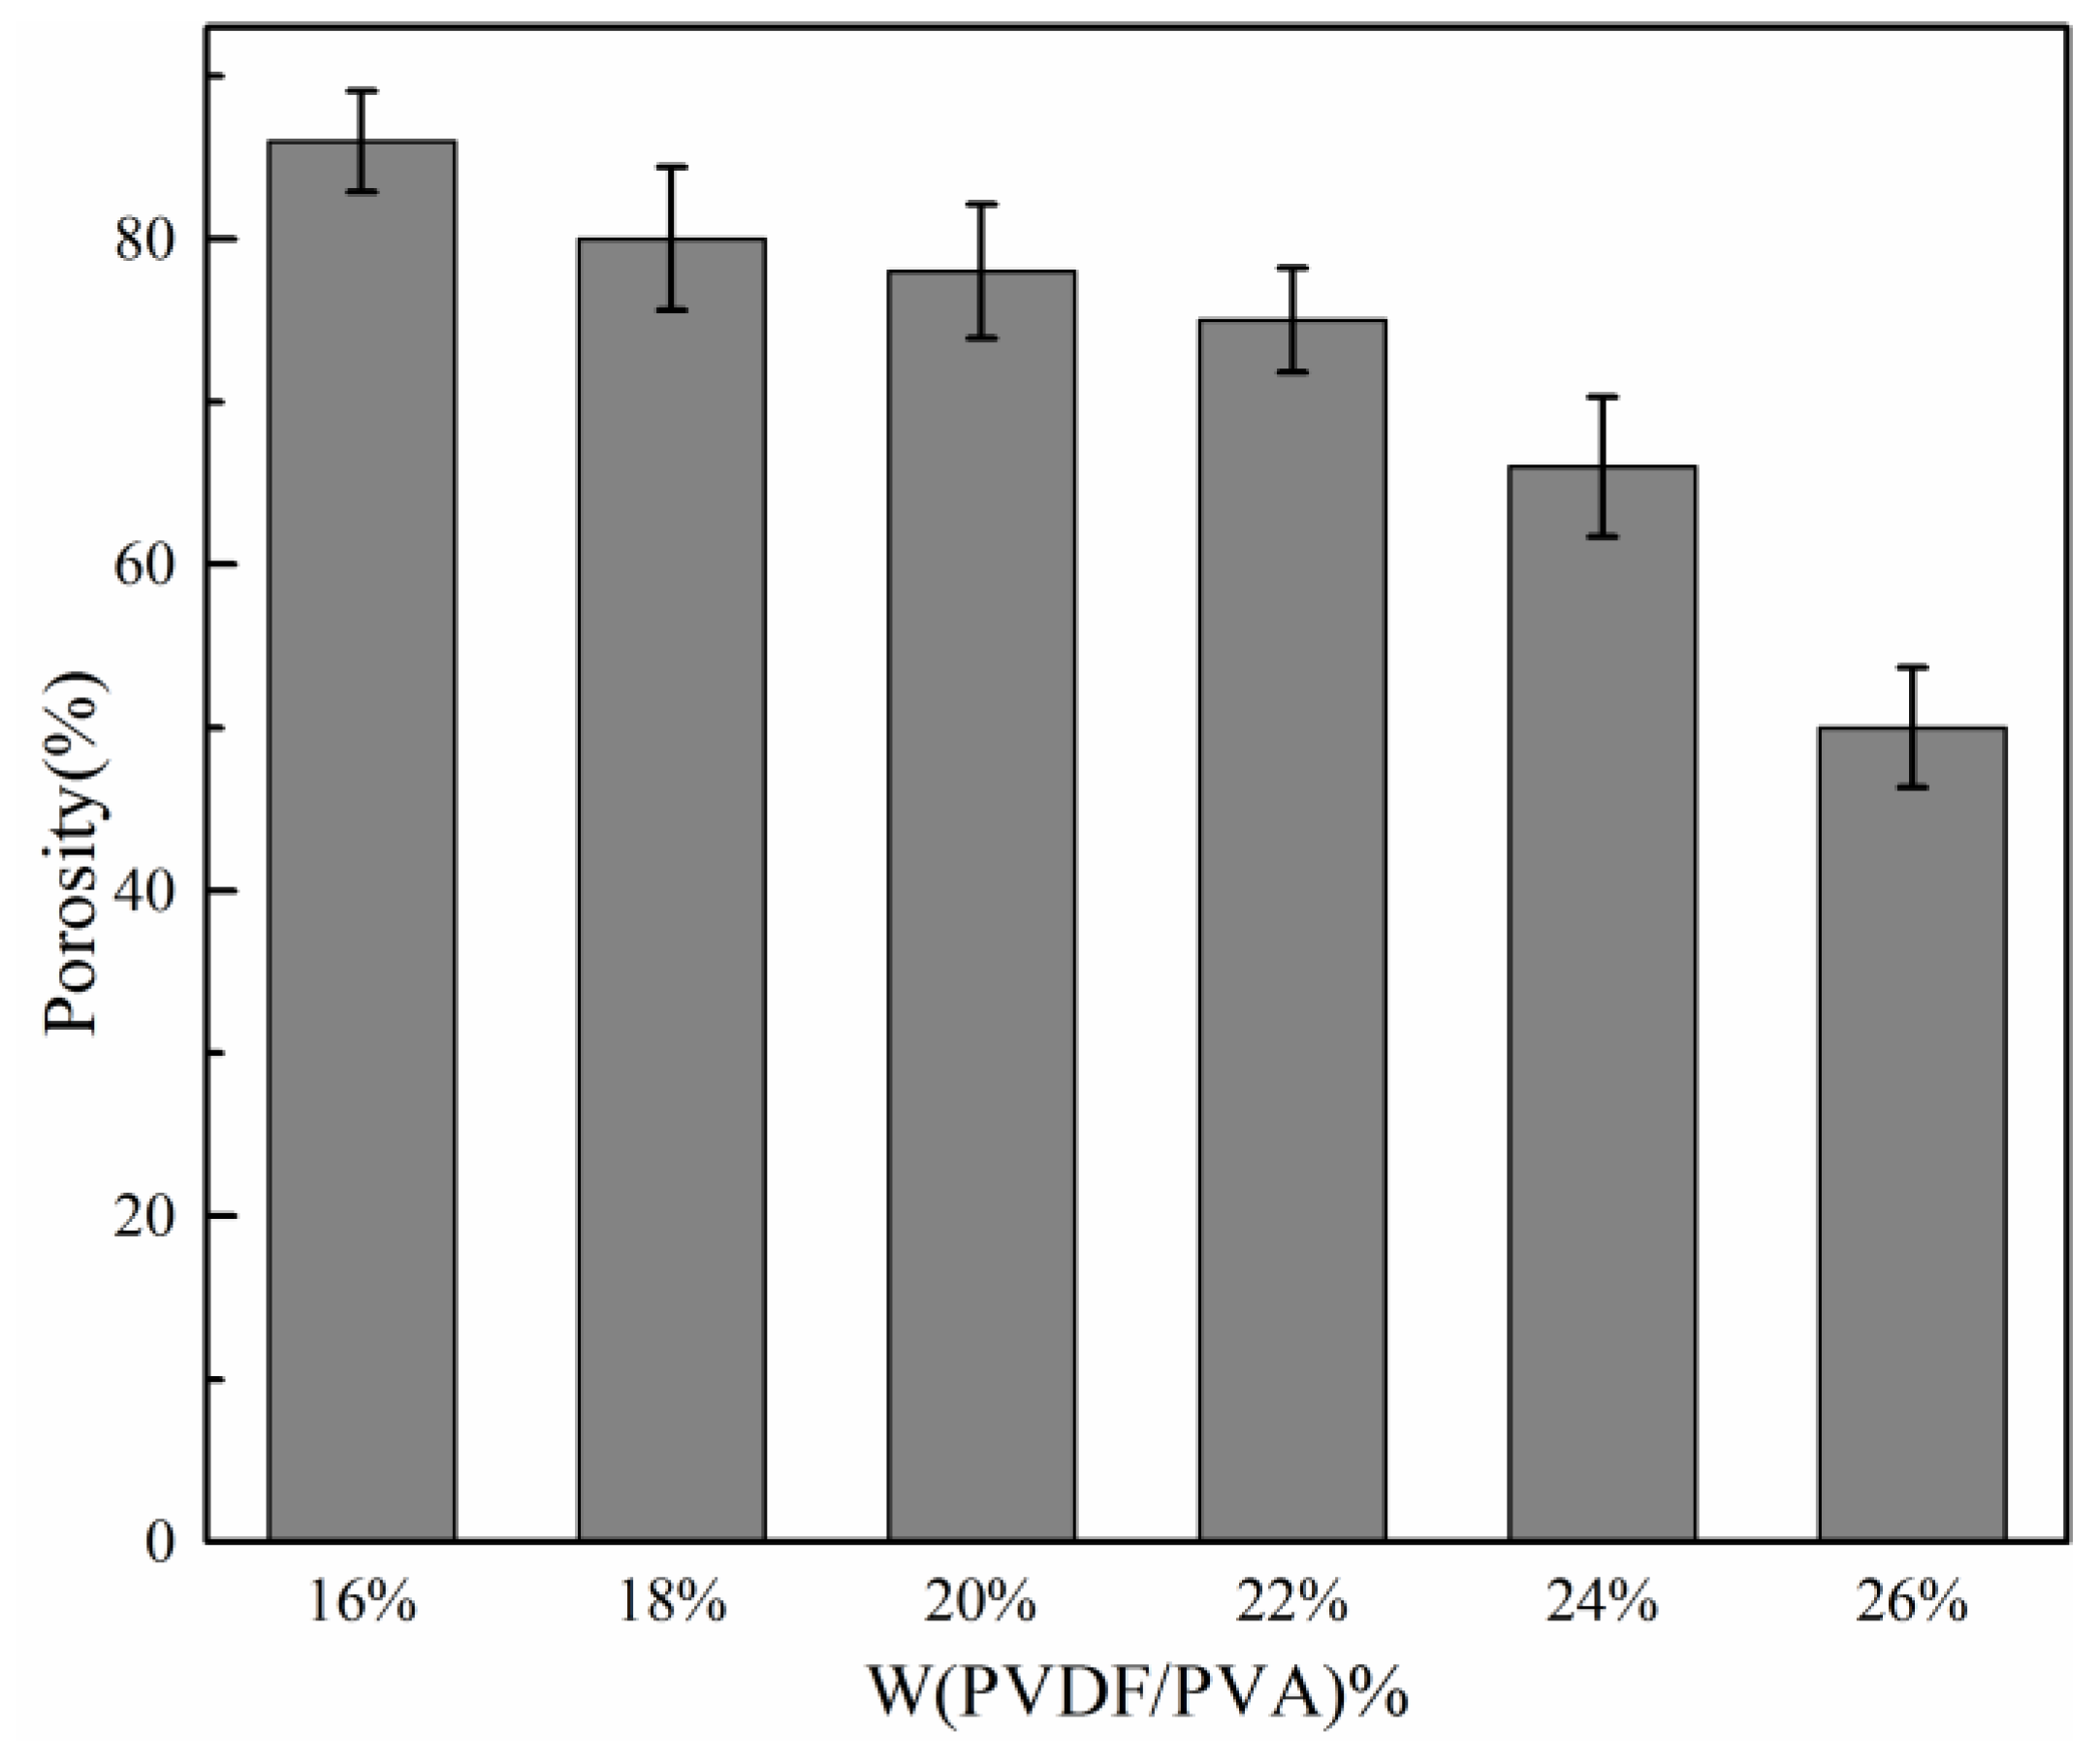
3.1.2. Effect of Total Polymer Concentration on Membrane Pore Size and Pore Size Distribution

Pore size distribution curves and mean pore size of membranes S1S6 are shown in Figure 3 and Table 2, respectively. With the increase of total polymer concentration, the curves of the membrane pore size distribution shift toward the left, and the mean pore size decreases. Overall, the width of the pore size distribution becomes narrower with increasing polymer concentration, indicating a more uniform pore structure. This corresponds to the decrease of the mean pore size from 81.7 nm down to 27.6 nm as the polymer concentration increased from 16 wt %–26 wt %. Membranes with UF (0.01 μm–0.1 μm) and MF (0.1 μm–10 μm) pore size ranges could be easily fabricated by adjusting the dope composition to meet the separation requirements.

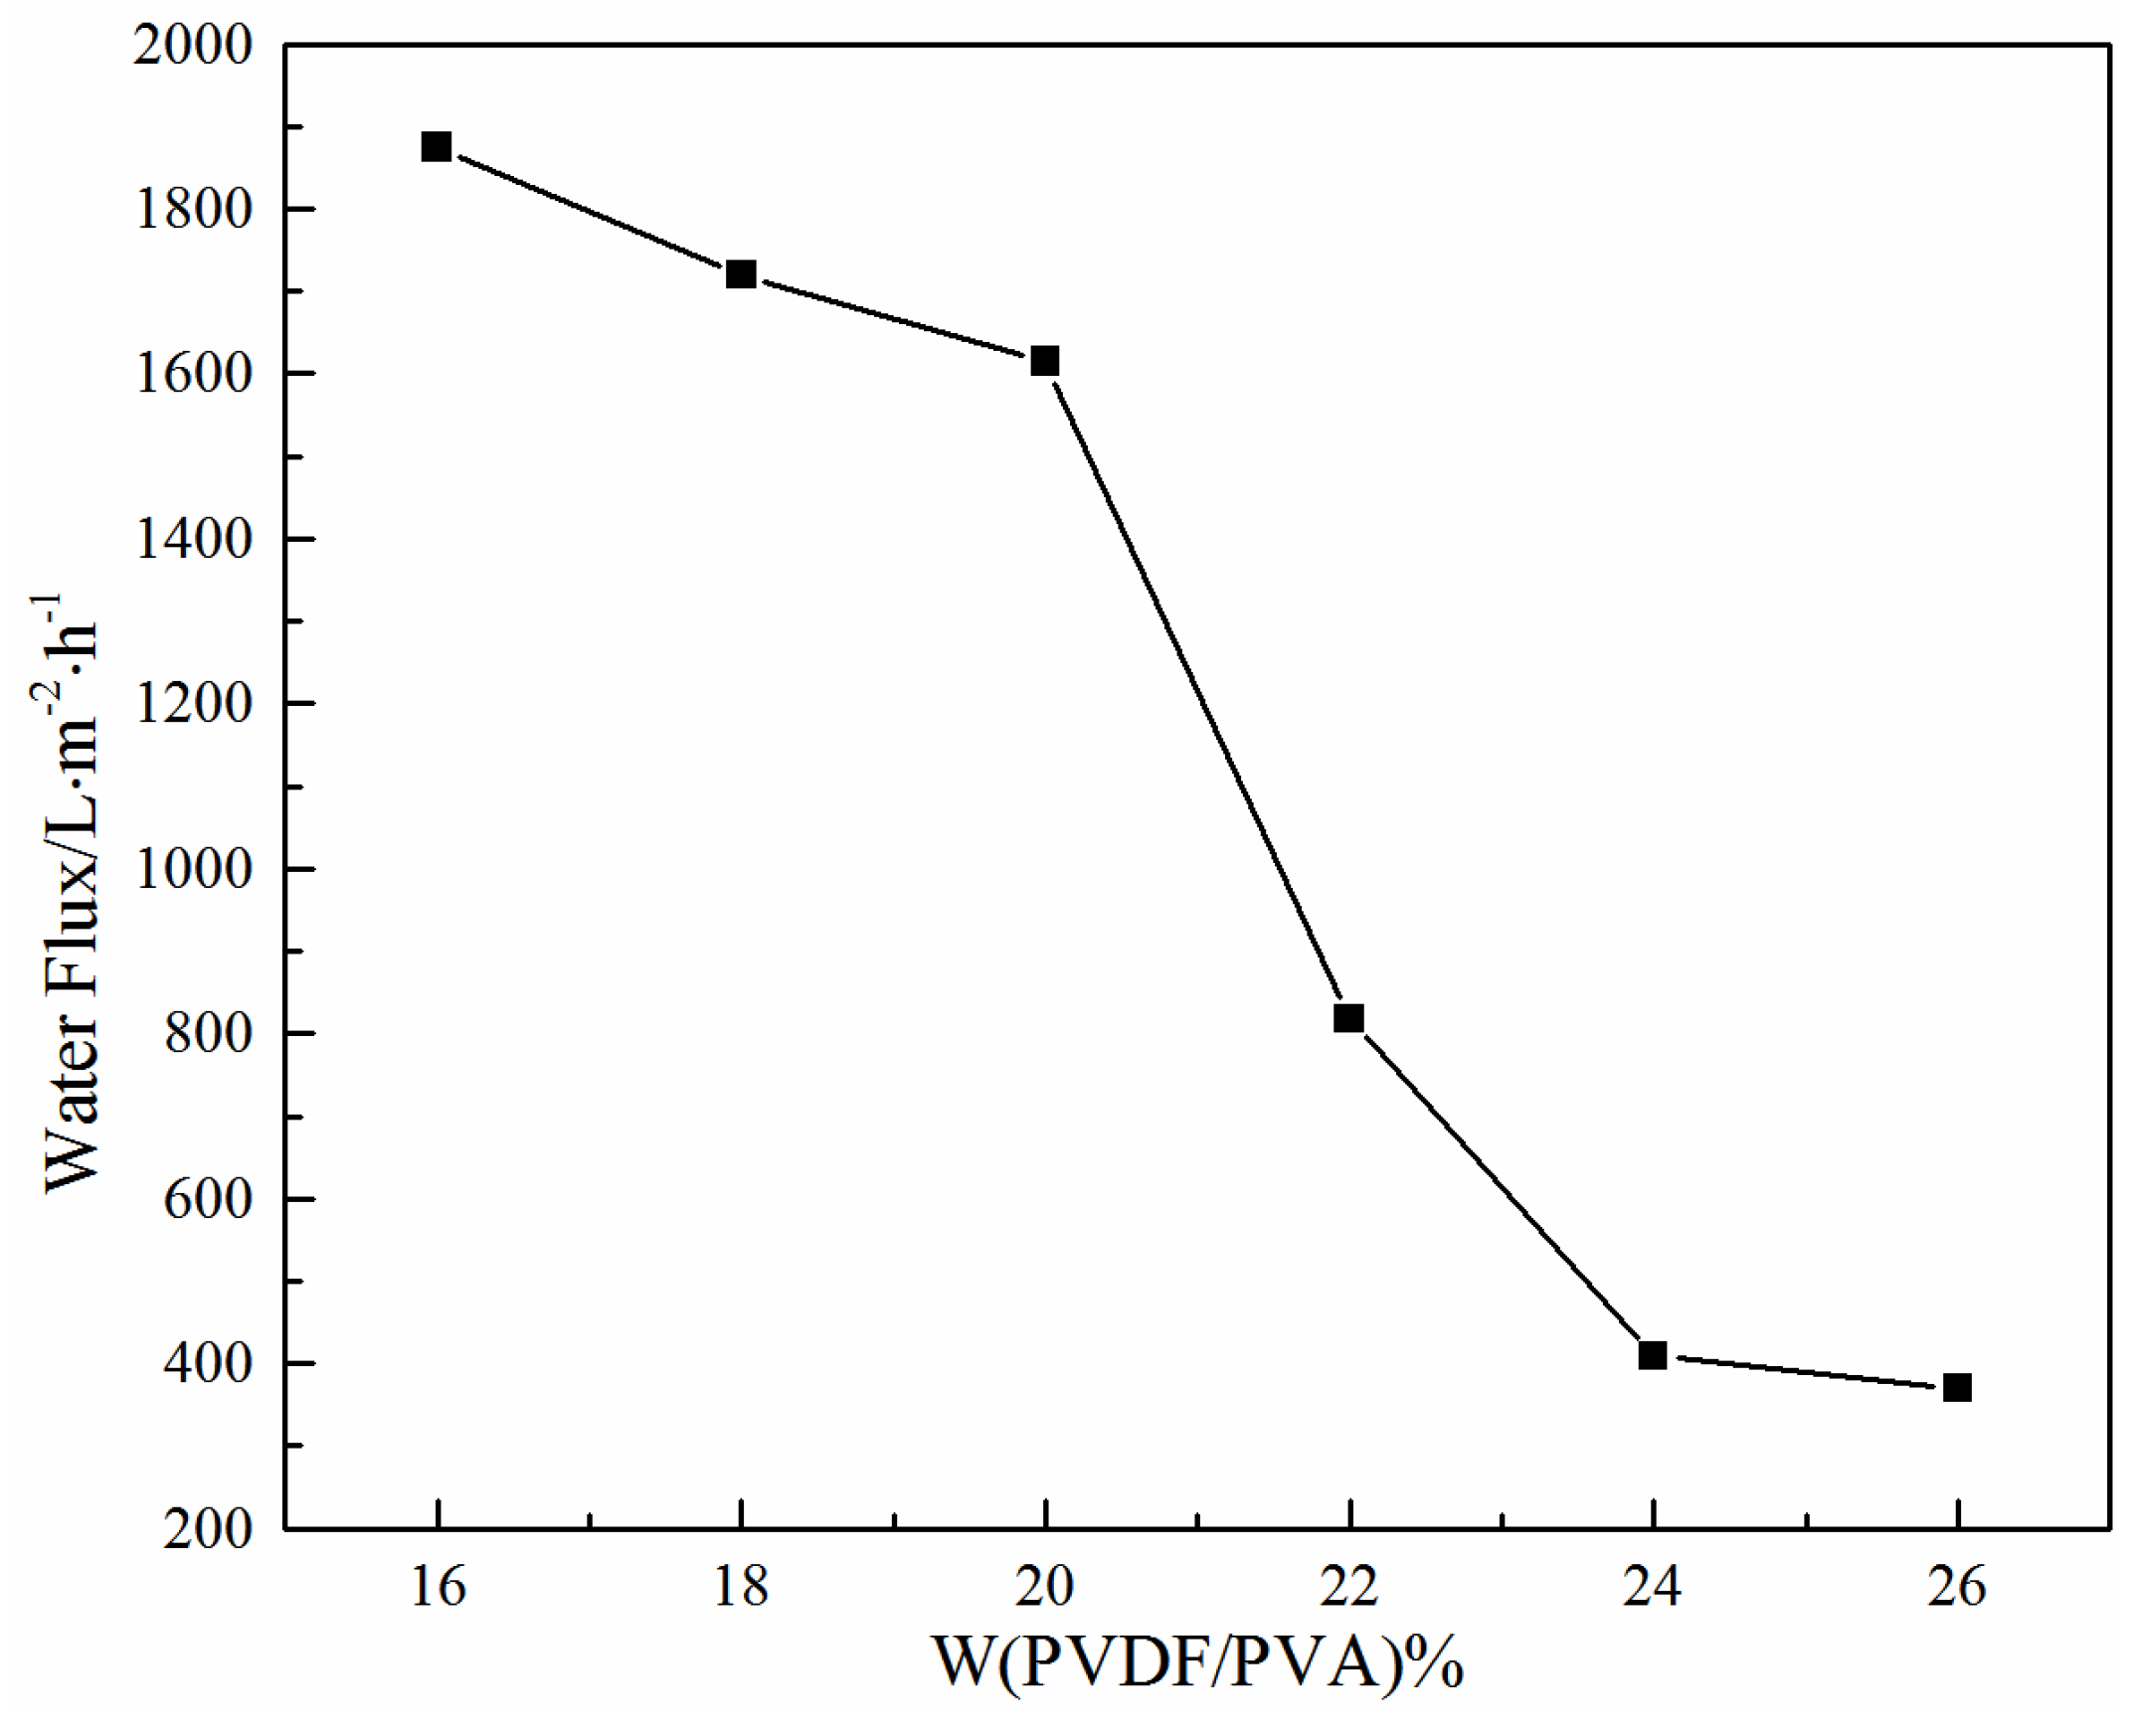
3.1.3. Effect of Total Polymer Concentration on Water Flux

The effect of total polymer concentration on membrane flux is shown in Figure 4, in which the water flux of the membrane decreases with the increase of the total polymer concentration. This is mainly due to the decreasing pore size, as indicated in Table 2. At a total polymer concentration of 26 wt %, the water flux of the PVDF/PVA blend membrane S6 is about 370 L·m−2·h−1.

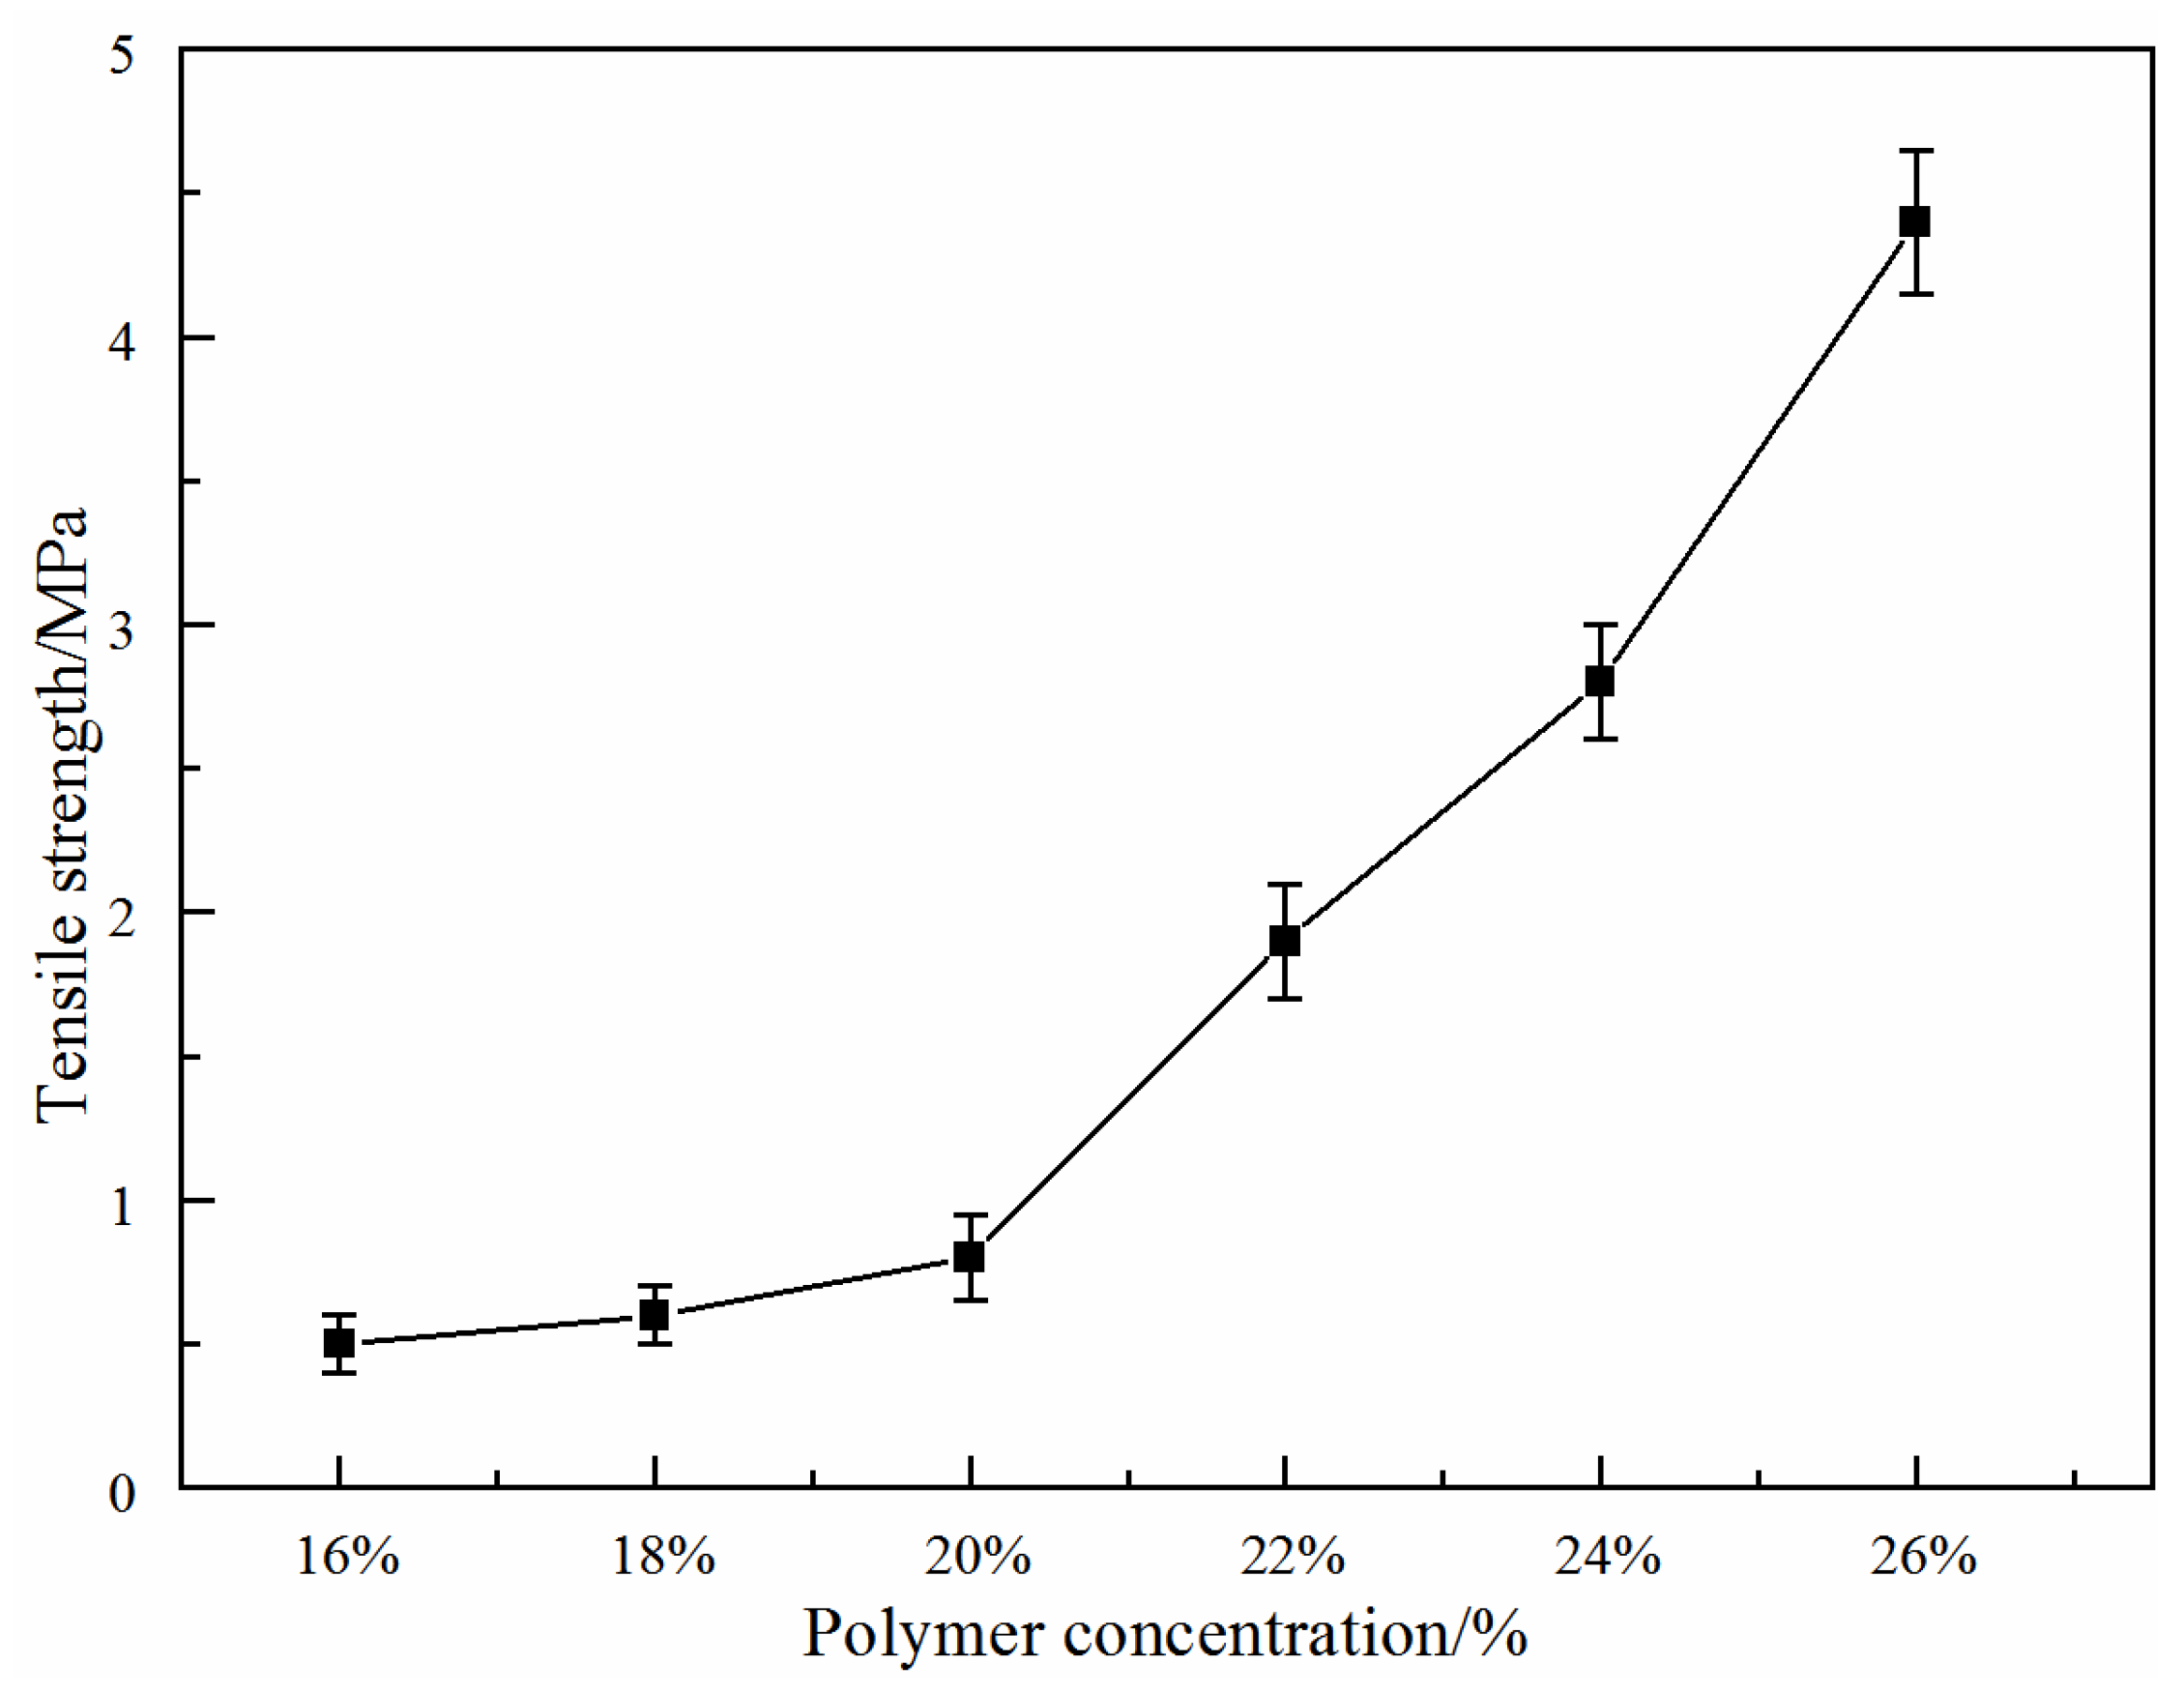
3.1.4. Effect of Total Polymer Concentration on Membrane Mechanical Properties

Figure 5 shows the effect of total polymer concentration on the membrane tensile strength for PVDF/PVA blend membranes S1S6. In general, the tensile strength of the membranes increases from 0.5 MPa–4.5 MPa with increasing total polymer concentration from 16 wt % (S1)–26 wt % (S6). The enhancement of mechanical strength is due to the change of the membrane structure from a long finger-like pore to a cellular pore structure, which led to decreased pore size and a narrower pore size distribution, as the total polymer concentration increased (Figure 1). This is also consistent with the decreasing porosity, as shown in Figure 2, which was also observed in previous work [25].

3.2. Investigation on the PVDF/PVA Blend Ratio

With a pure PVDF membrane N as the benchmark, hydrophilically-modified PVDF/PVA blend membranes M and S3 (Table 1) with the same total polymer concentration of 20 wt % at varying PVDF/PVA blend ratios 9:1 (M) and 8:2 (S3) were fabricated for comparing the membrane structure and filtration performance. The effect of the PVDF/PVA blend ratio on the membrane mechanical properties is shown in Figure 6, in which the tensile strength of the blend membrane decreases from about 1.7 MPa down to 0.8 MPa with increasing blend ratio from 10:0 to 8:2. When the blend ratio of PVA further increased to 7:3 (membrane L; Table 1), the tensile strength of the PVDF/PVA blend membrane was as weak as 0.16 MPa, and the structure strength of blend membrane was poor for the performance test; hence, only the blend ratio lower than 7:3 was considered appropriate.

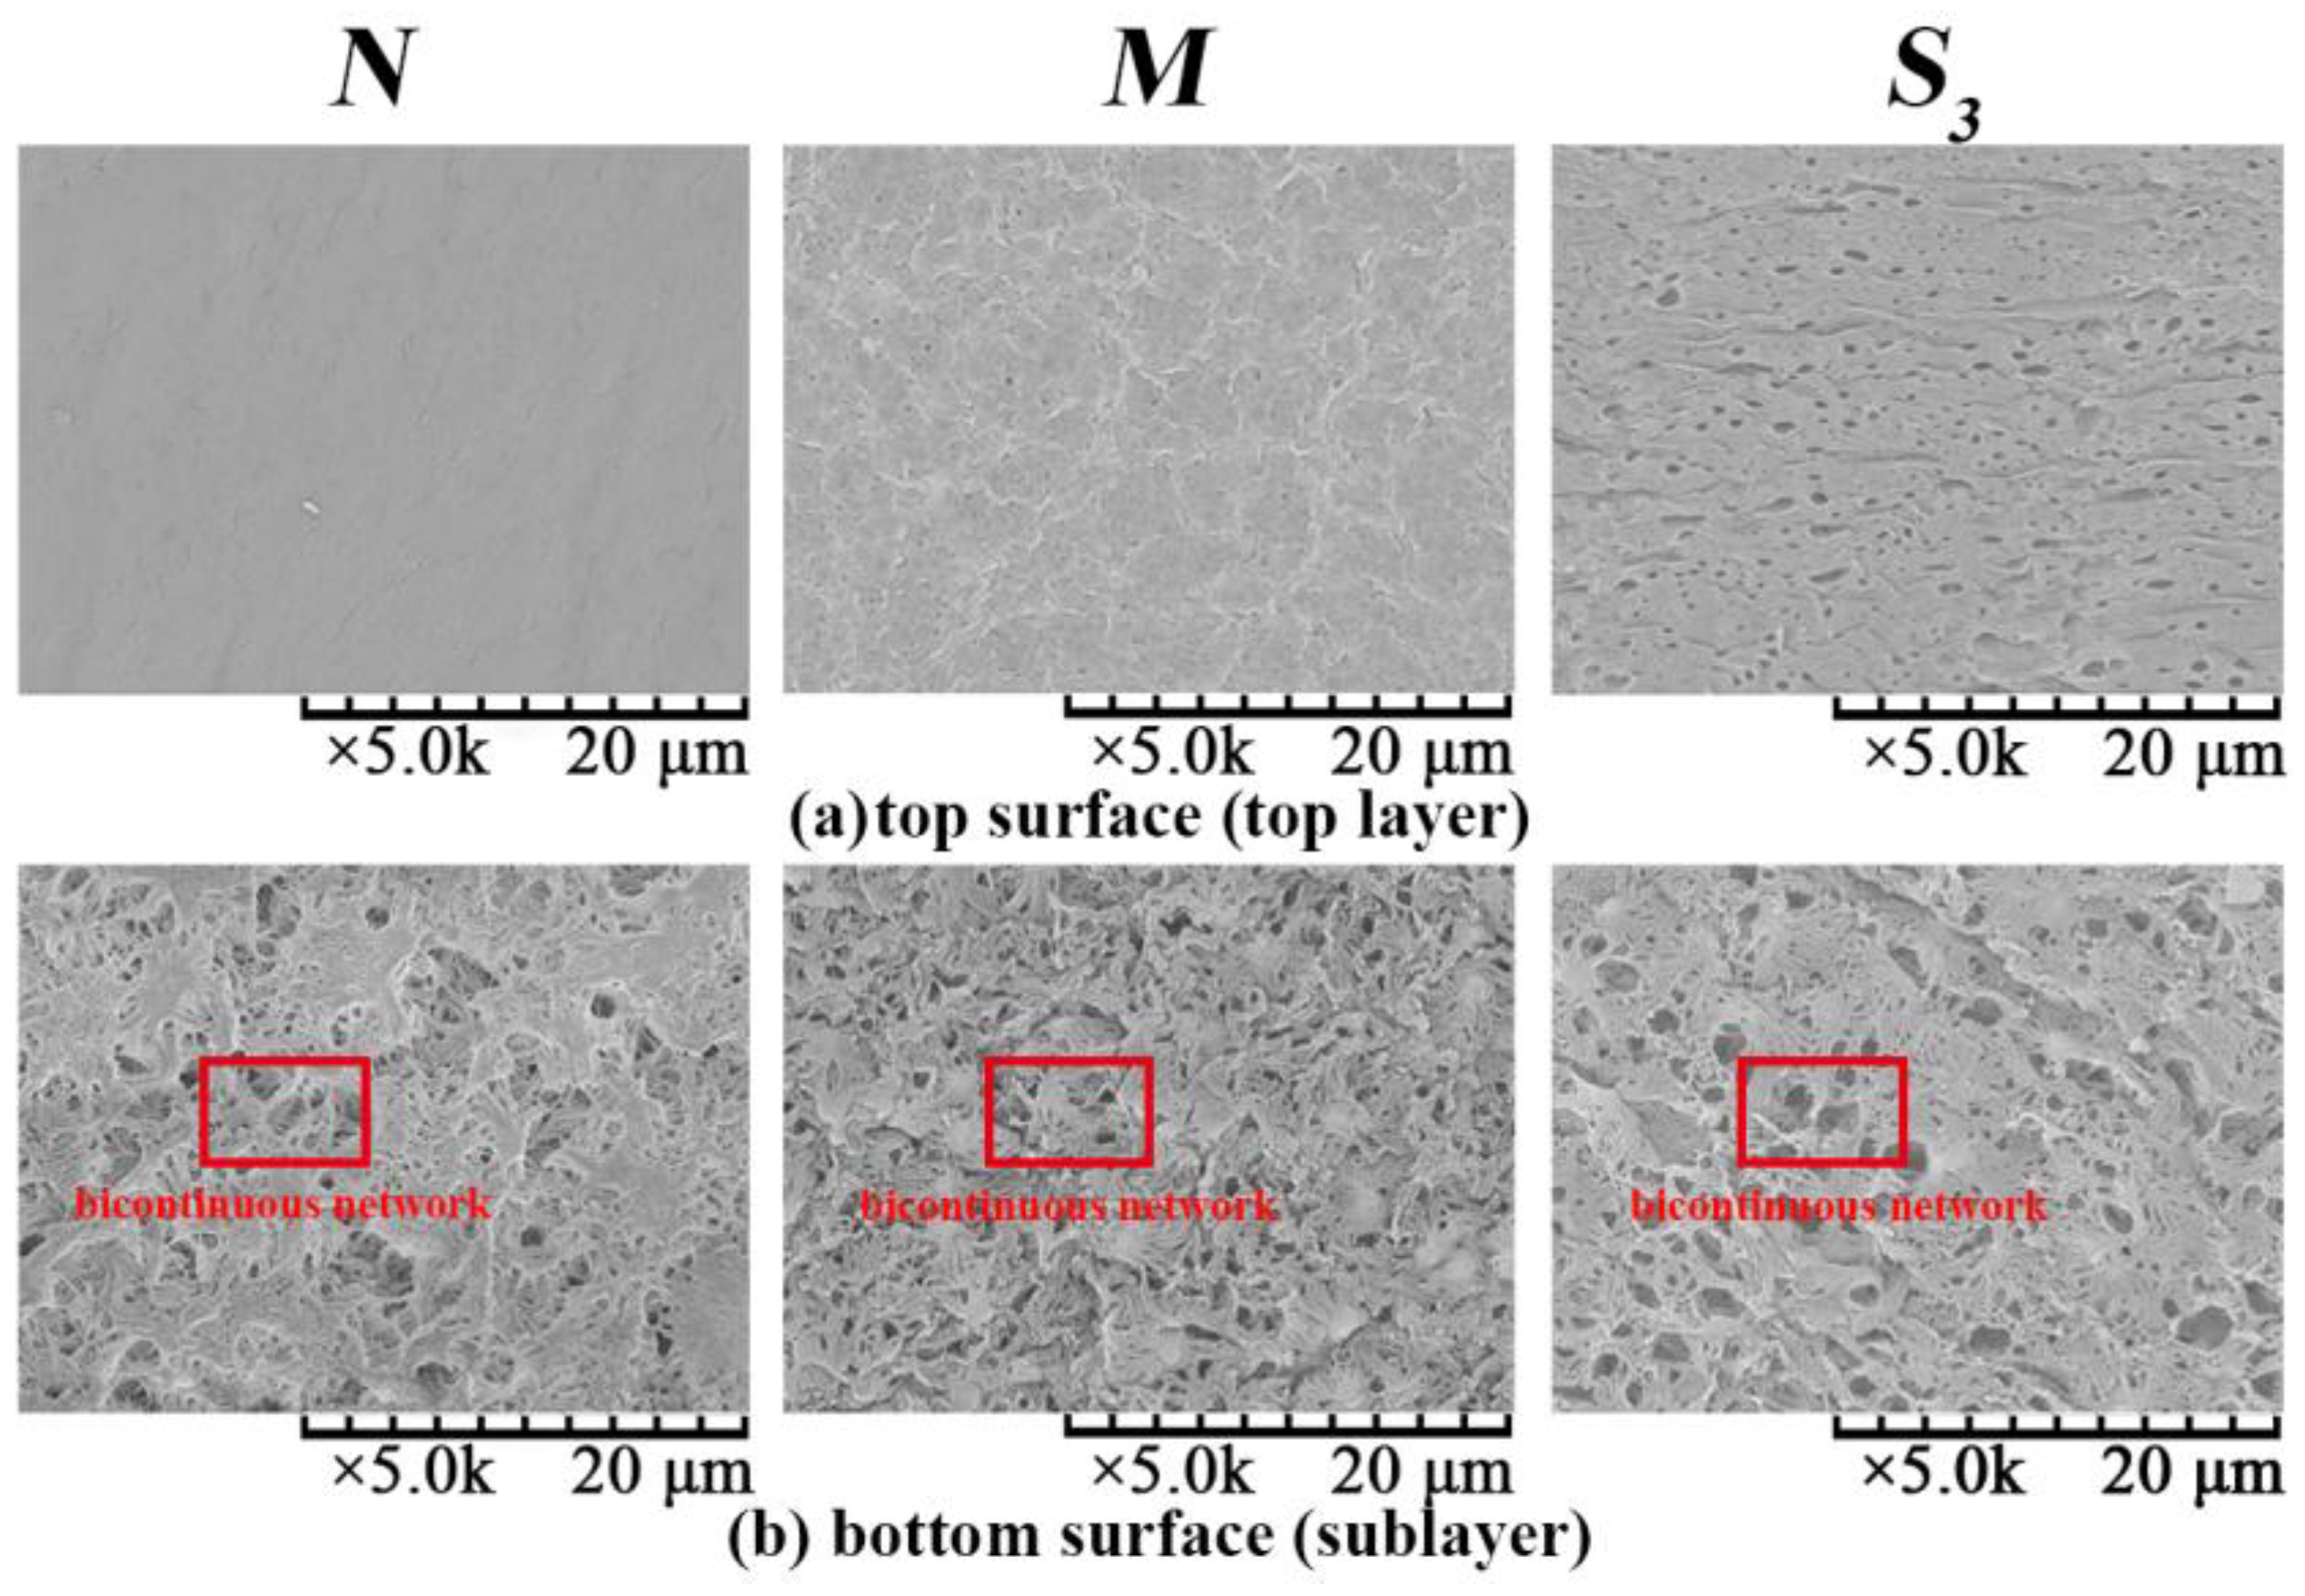
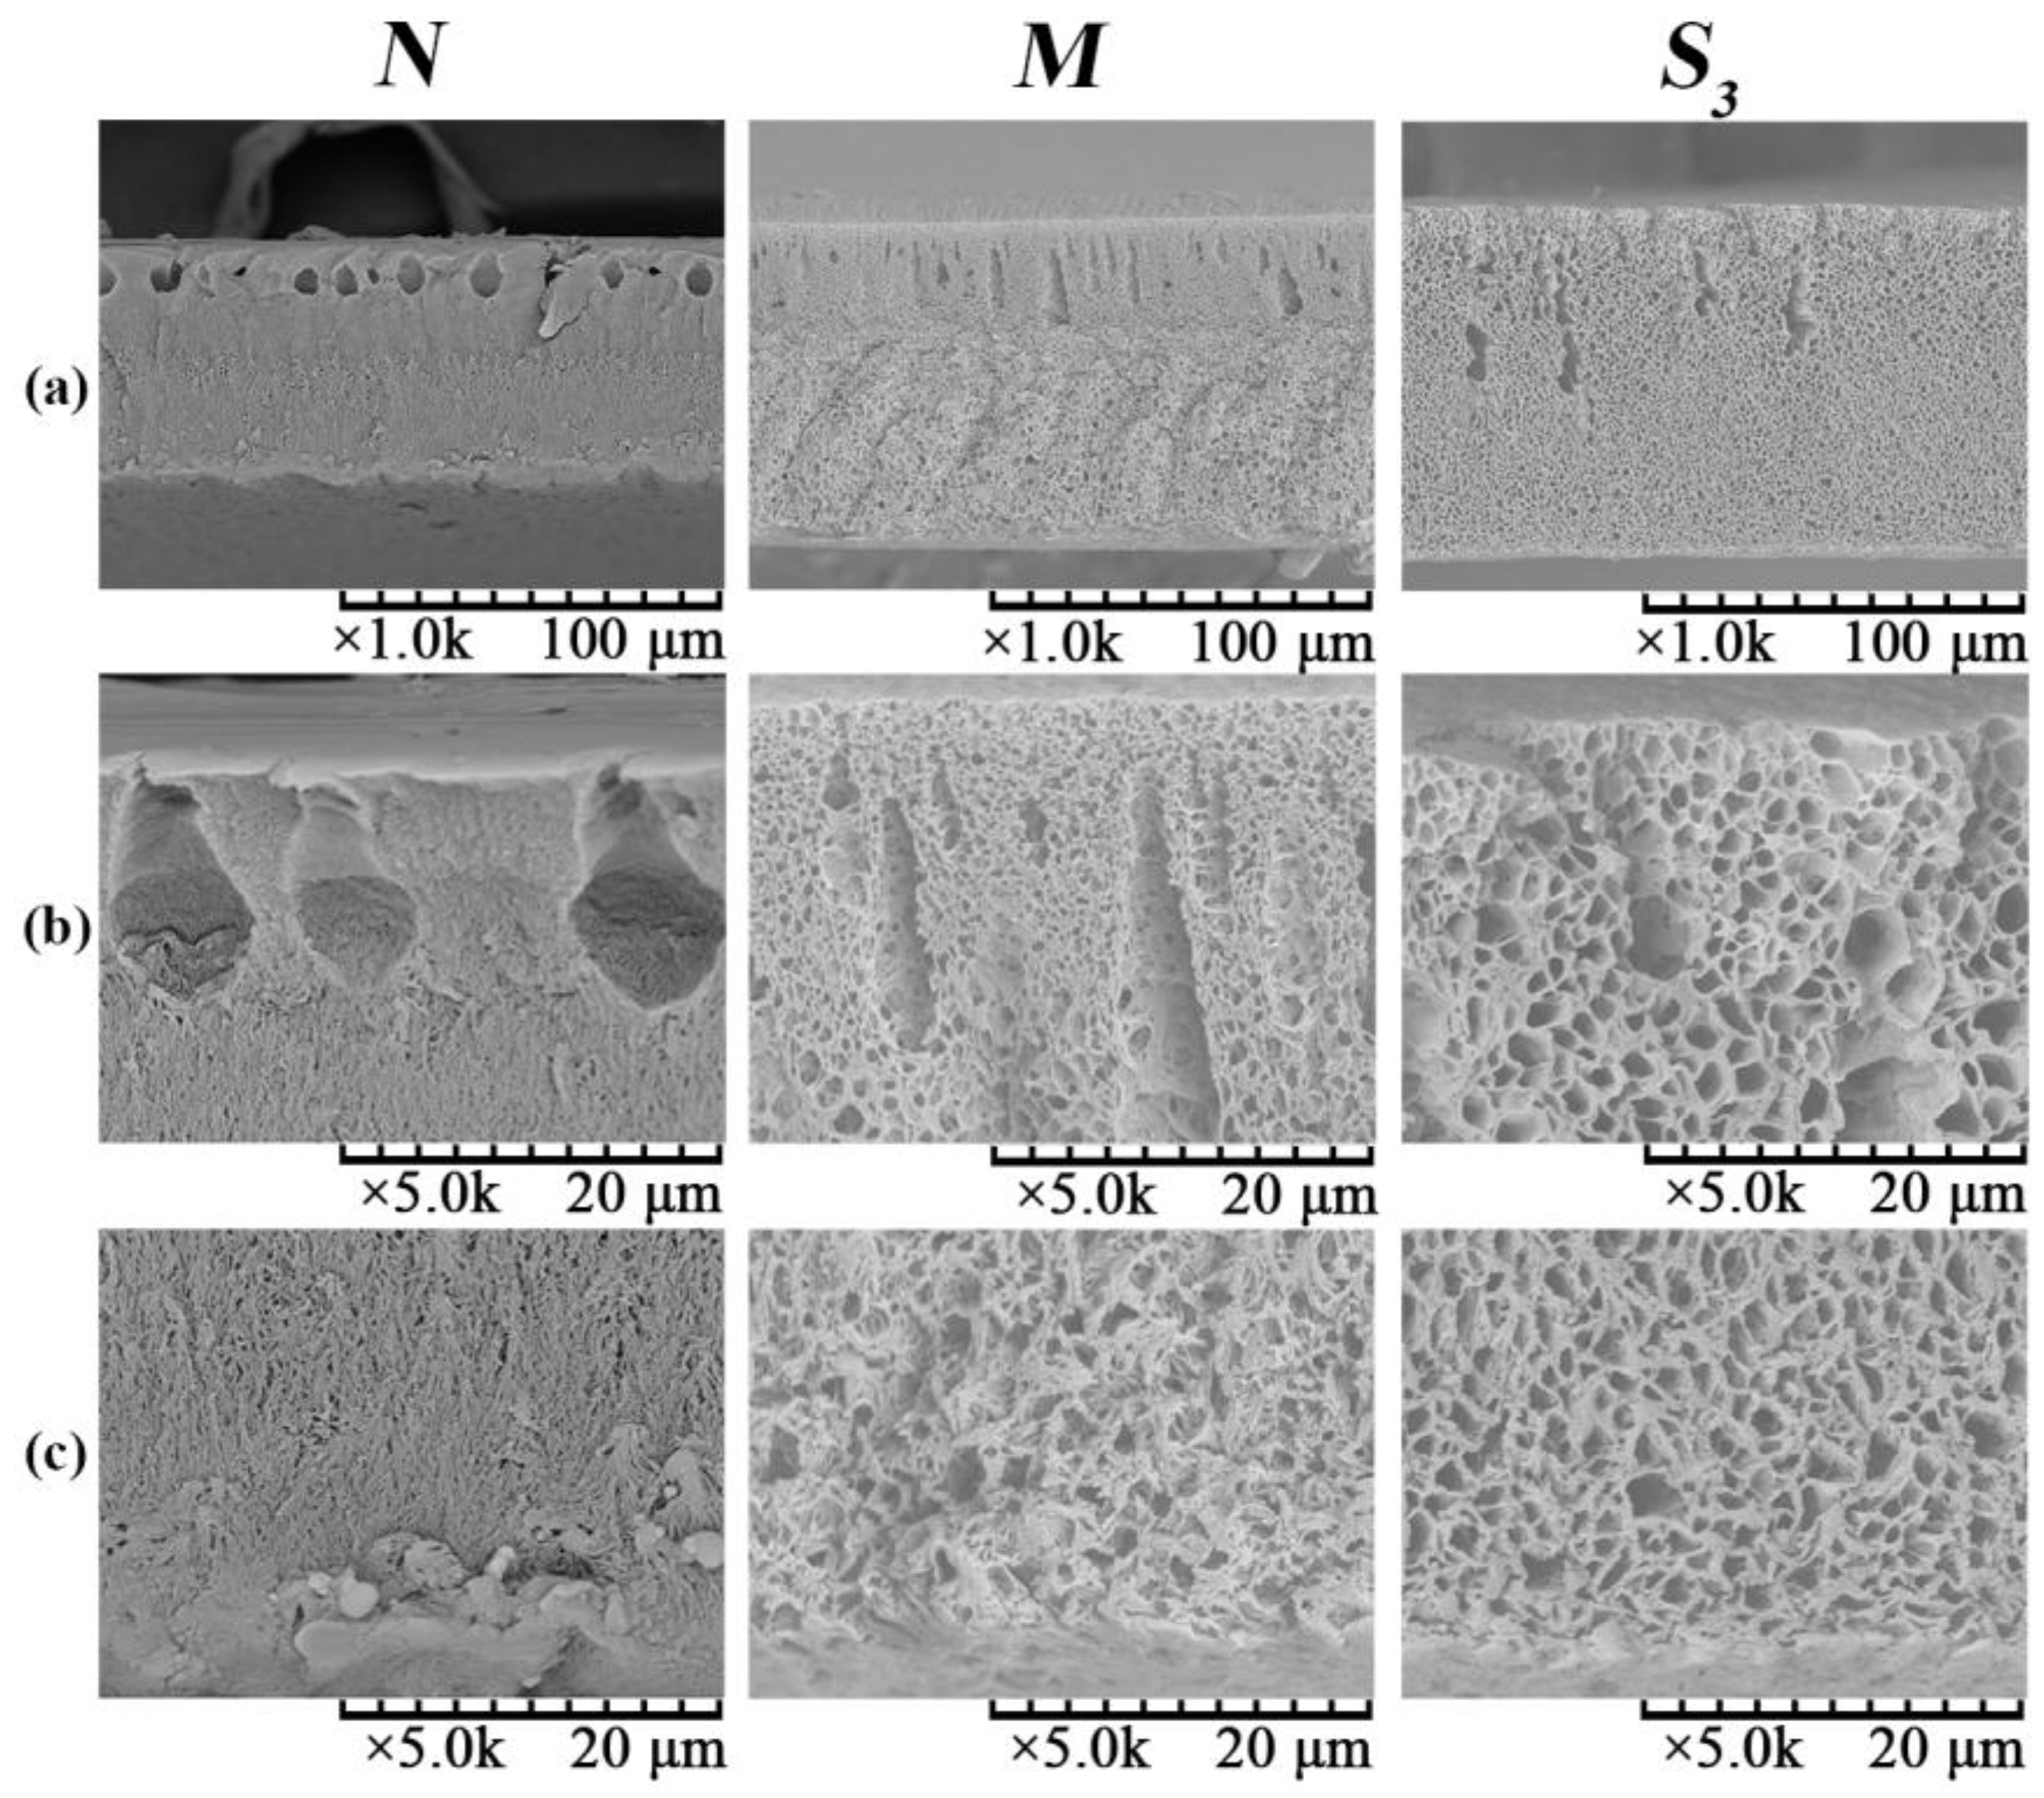
3.2.1. Effect of PVDF/PVA Blend Ratio on Membrane Morphology

The SEM images of the surface of membranes N, M and S3 are shown in Figure 7. The morphologies of the top surface (top layer) of PVDF/PVA blend membranes M (blend ratio 9:1) and S3 (blend ratio 8:2) are rough with microvoids; while the pure PVDF membrane N has a smooth top surface without observable microvoids. With increasing PVA content, the top surface becomes rougher and more porous. This is due to the enhanced integration between the interface of PVDF and PVA as the PVA content increases [11]. Meanwhile, all of the bottom surface (sublayer) morphologies exhibit a bicontinuous network porous structure and are significantly different from the top surface morphologies. The combined results from Figure 7a,b suggest that the top layer and the bottom layer of the membrane were formed by different phase separation mechanisms. Specifically, during the formation of PVDF/PVA blend membrane, TIPS and NIPS occurred simultaneously when the homogeneous dope solution was immersed into the coagulation bath of water, which serves as both a coagulant (in NIPS) and a coolant (in TIPS) . The solvent in contact with the outer surface of the casted layer (facing the coagulant side; Section 2) would exchange with water and then trigger the occurrence of the NIPS process, which determines the structure of the top layer (as shown in Figure 7a). Meanwhile, for the inner surface of the casted layer (facing the glass plate; Section 2), the heat exchange occurred between high temperature casting solution (140 °C) and coolant water (25 °C), inducing TIPS and subsequently the formation of the bicontinuous pore structure of the bottom sublayer (as shown in Figure 7b). The TIPS mechanism contributed heavily to the solid-liquid separation and crystallization in the polymer-rich phase and eventually to the formation of the network porous structure of the bottom surface of the membrane. This occurred because compared to the mass-transfer dominant NIPS process in the top layer, the heat transfer (dominant in TIPS) is much faster for forming the bottom surface [25]. This hence has explained the fundamental difference in the top and bottom surface morphologies.
The SEM images of the cross-section of membranes N, M and S3 are shown in Figure 8; Rows (a), (b) and (c) are the full cross-section, the cross-section adjacent to the top surface and the cross-section adjacent to the bottom surface, respectively. Specifically, in Figure 8a, the finger-like pores beneath the top surface for the pure PVDF membrane N were formed mainly based on the NIPS mechanisms. This is because during membrane formation, the water (nonsolvent) quickly diffuses into the polymer solution beneath the top surface; hence, the rapid exchange rate of water and diluent CPL leads to the formation of the finger-like structure beneath the top surface. As the PVA content increases for the PVDF/PVA blend membranes M and S3, the number of the finger-like pores beneath the top surface decreases. This is due to the addition of hydrophilic PVA into the polymer dopes that increases the precipitation rate of the casting solution [14]. This may result in the formation of cellular morphologies via typical liquid-liquid (L-L) phase separation in the NIPS process [21]. Consistent with the observation in Figure 7, the cross-sectional morphologies adjacent to the bottom surface of all membranes exhibit a bicontinuous network porous structure. This is induced by the TIPS mechanism, in which the crystallization for macromolecules (i.e., PVDF) is much slower as a result of chain conformation compared to low molecular weight compound CPL. As CPL rapidly crystallizes at its original locations in a homogenous solution, this effectively suppresses the growth of PVDF crystals and subsequently dictates the pore structure. Thus, as CPL is dissolved in water, the space occupied by the polymer lean phase, or CPL-rich phase, becomes membrane pores with a well-connected bicontinuous network structure [25]. Hence, both surface and cross-sectional morphologies in Figure 1, Figure 7 and Figure 8 confirm that the formation mechanisms of the blend membranes are combined NIPS and TIPS, namely NTIPS.

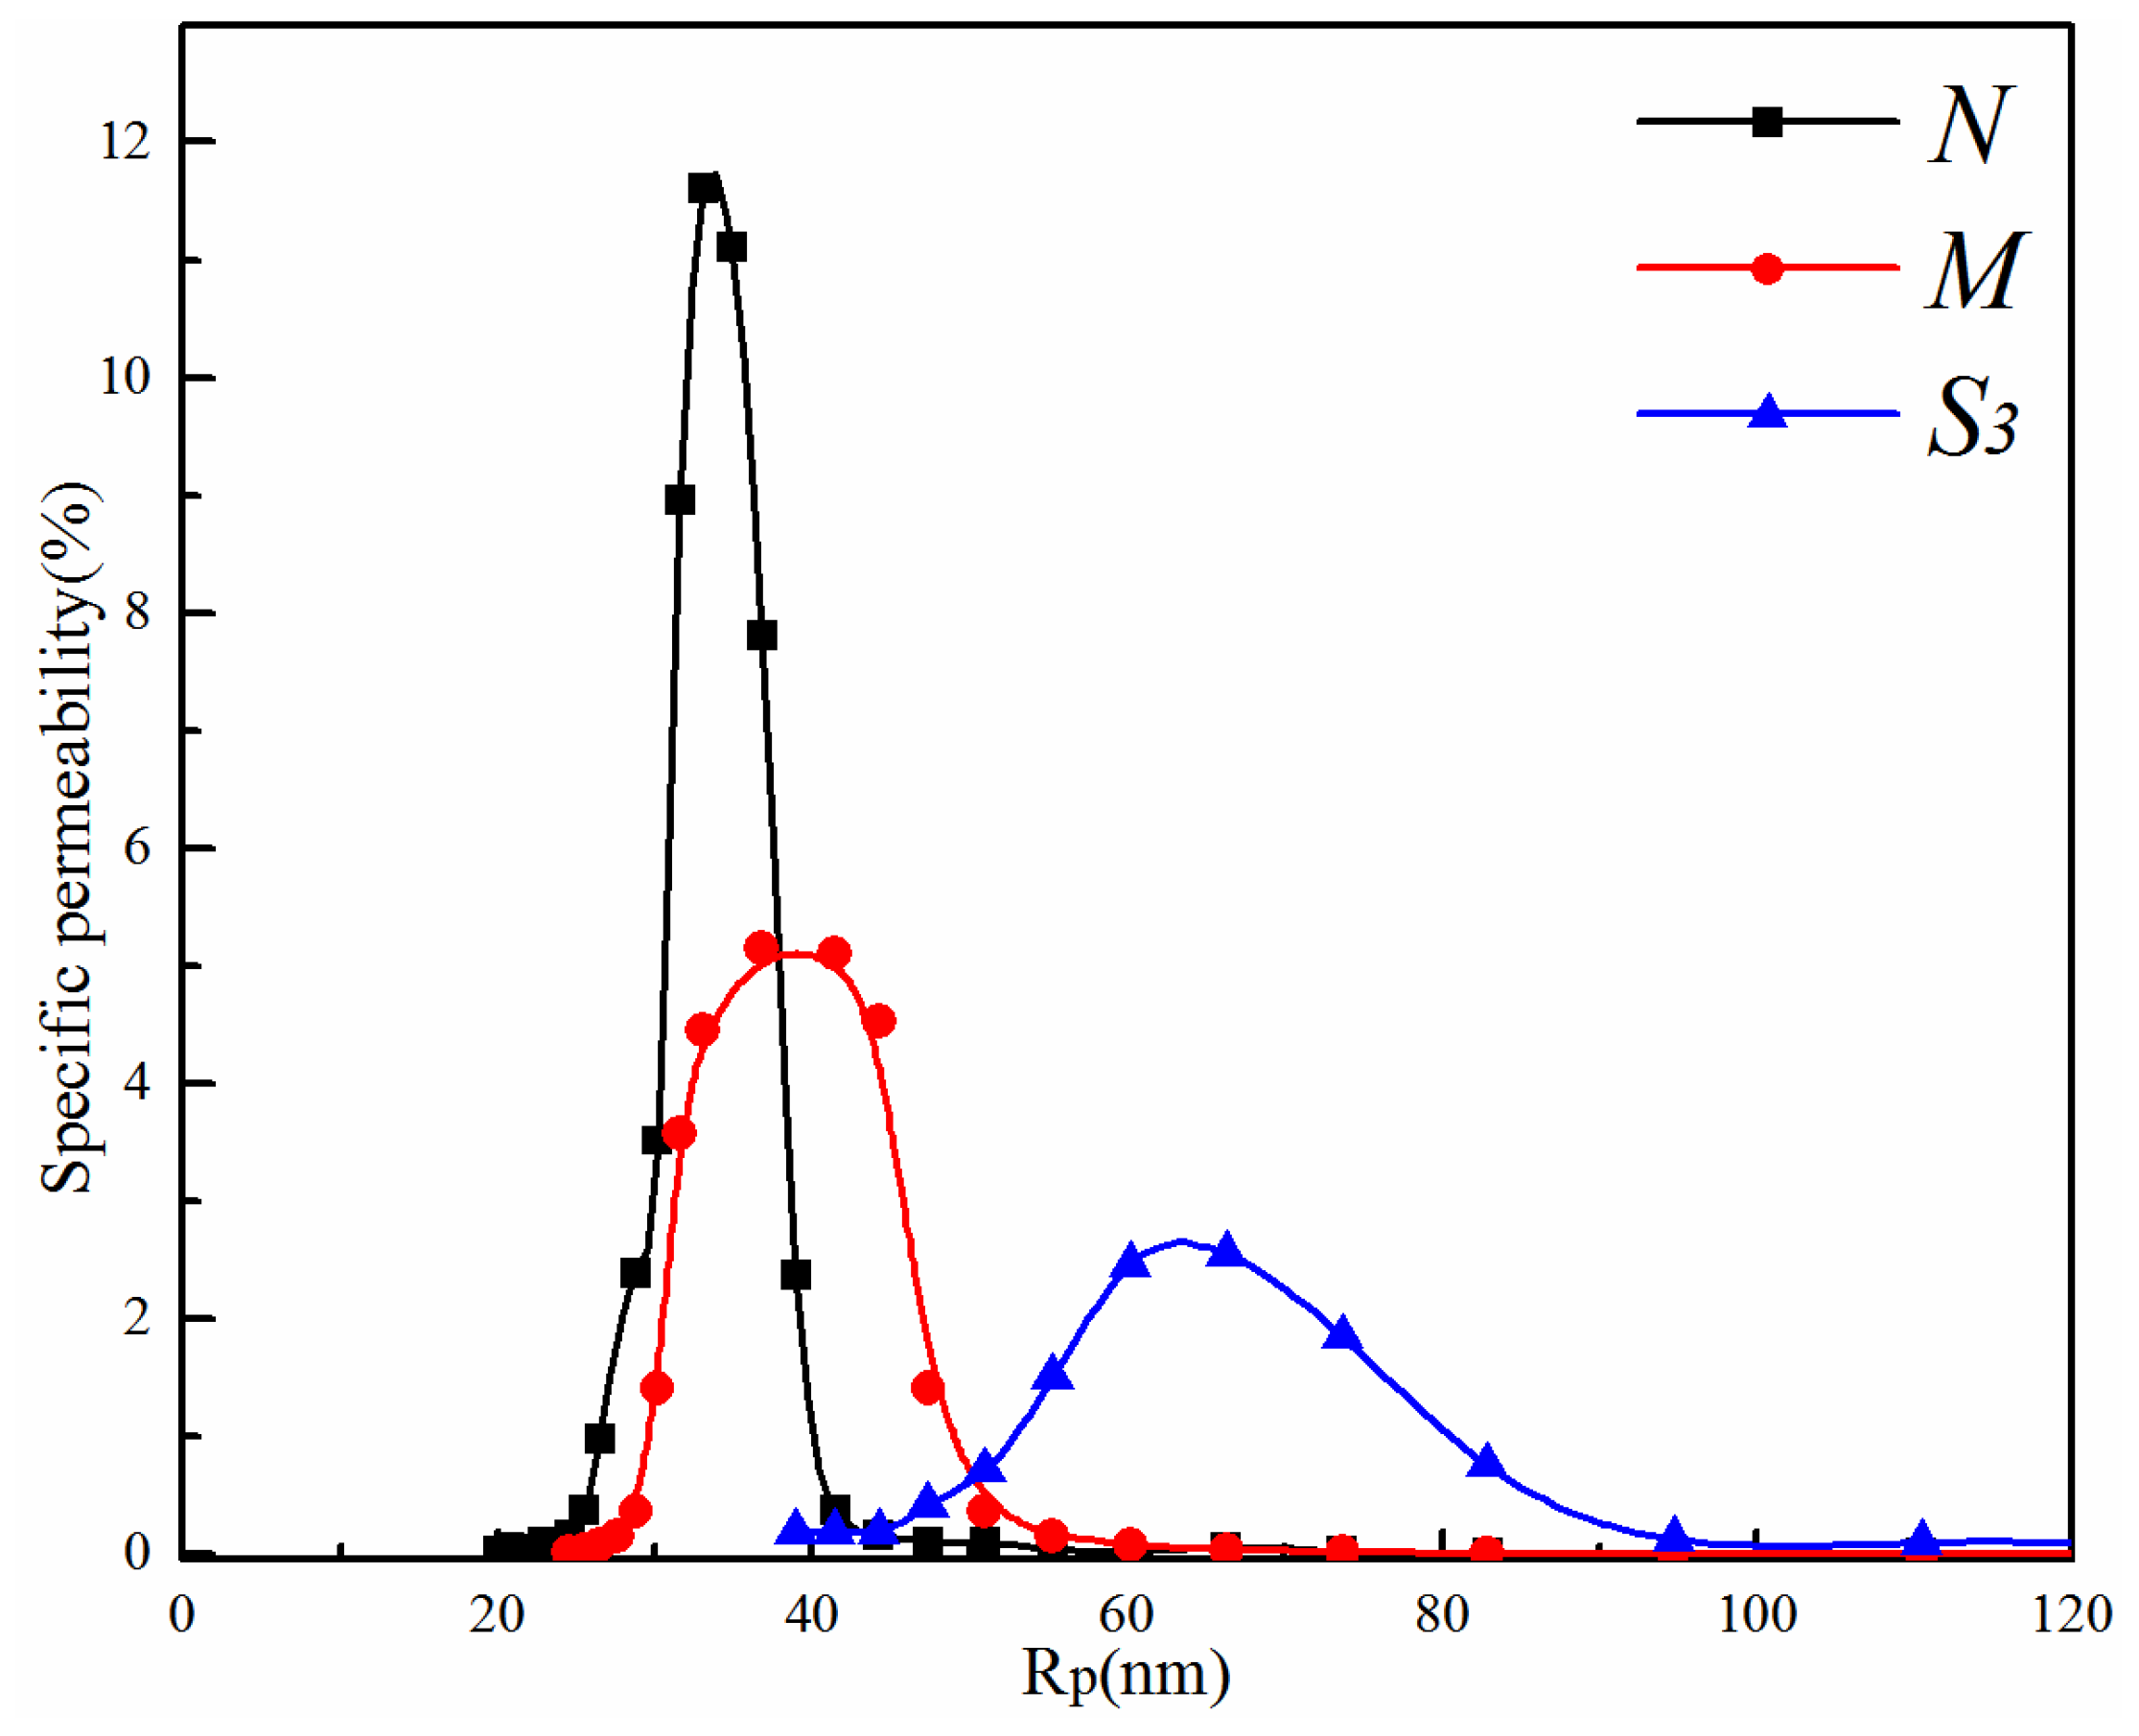
3.2.2. Effect of the PVDF/PVA Blend Ratio on Membrane Pore Size and Pore Size Distribution

The pore size distribution curves of membranes N, M and S3 are depicted in Figure 9, and the corresponding mean pore size is given in Table 3. As the PVA content increases, the pore size distribution becomes wider, corresponding to the increasing mean pore size from 34.3 nm (N)–64.6 nm (S3) in Table 3. This is consistent with the morphological observations from Figure 7 and Figure 8.

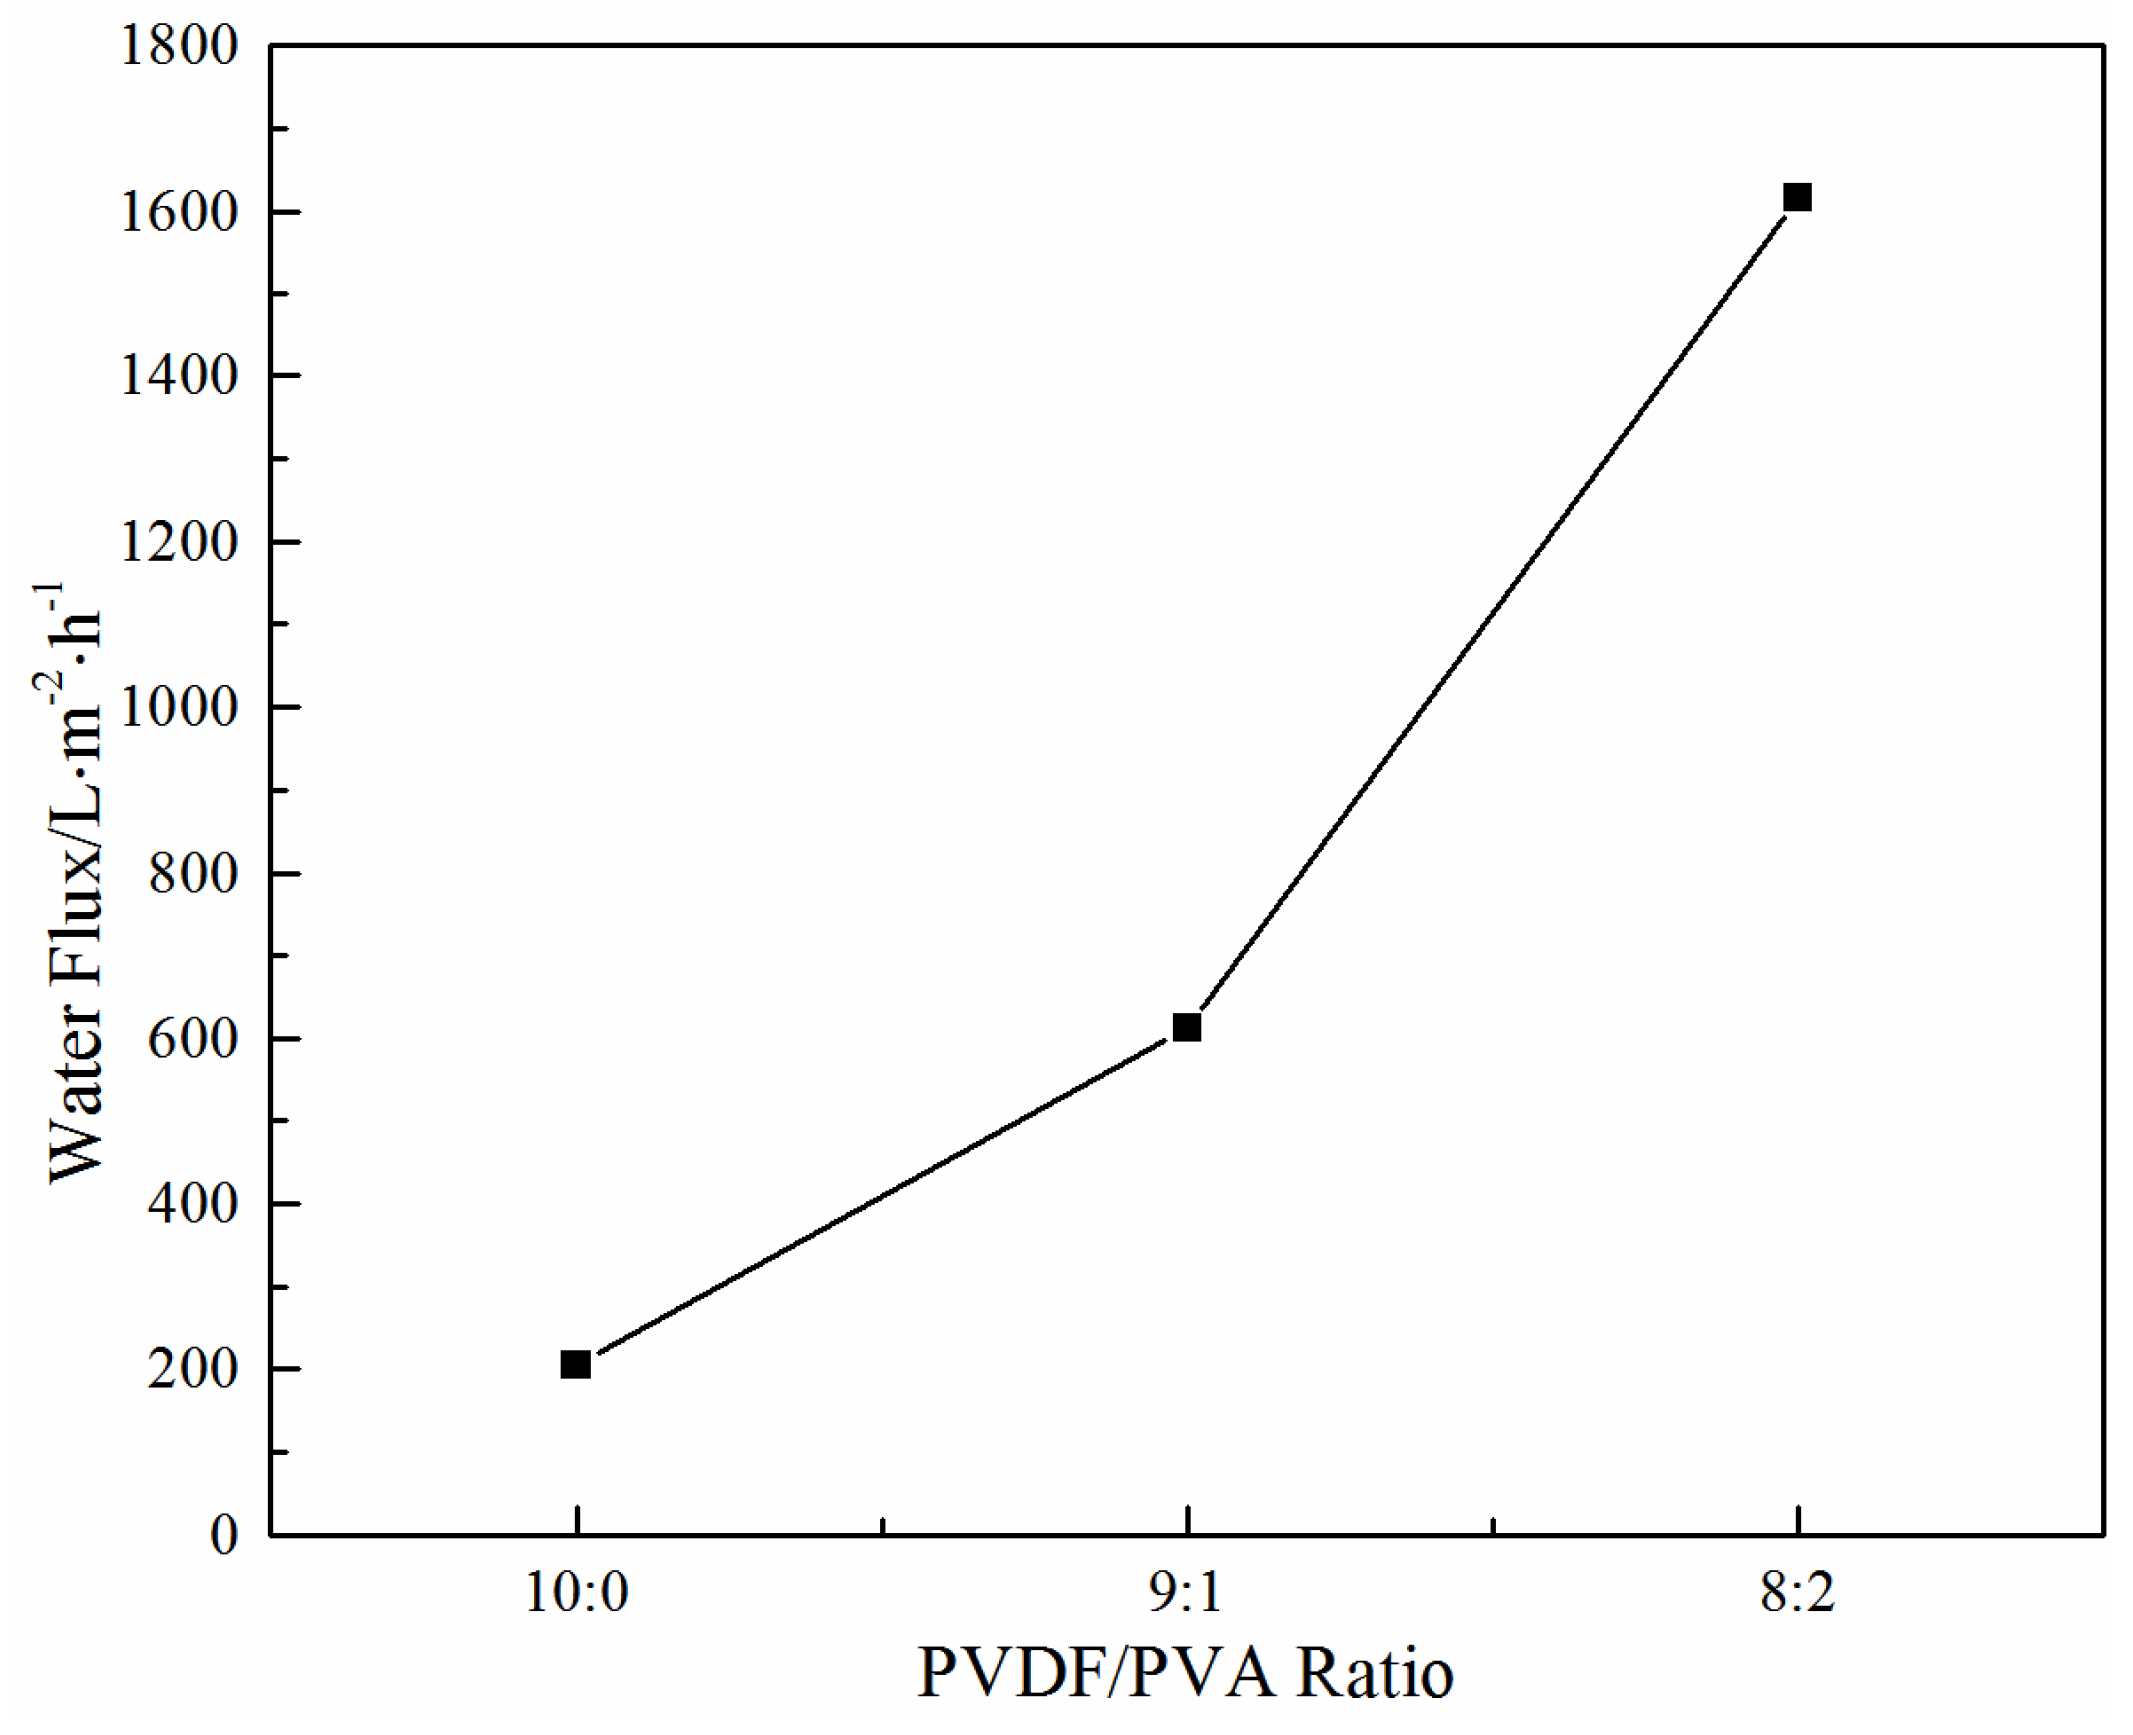
3.2.3. Effect of the PVDF/PVA Blend Ratio on Water Flux

Figure 10 illustrates the effect of the PVDF/PVA blend ratio on the water flux. As the PVDF/PVA blend ratio decreases from 10:0 to 8:2, the water flux increases significantly. The enhanced permeability is mainly due to the larger pore size (as shown in Table 3) and the wider pore size distribution with the increase of PVDF/PVA blend ratio. The results are also consistent with the structural variation of these membranes shown in Figure 7 and Figure 8, i.e., with the number of surface pores and pore size increasing, the water flux increases. The substantial improvement on membrane permeability is also attributed to the higher hydrophilicity of the blend membranes, which will be discussed in Section 3.2.4.

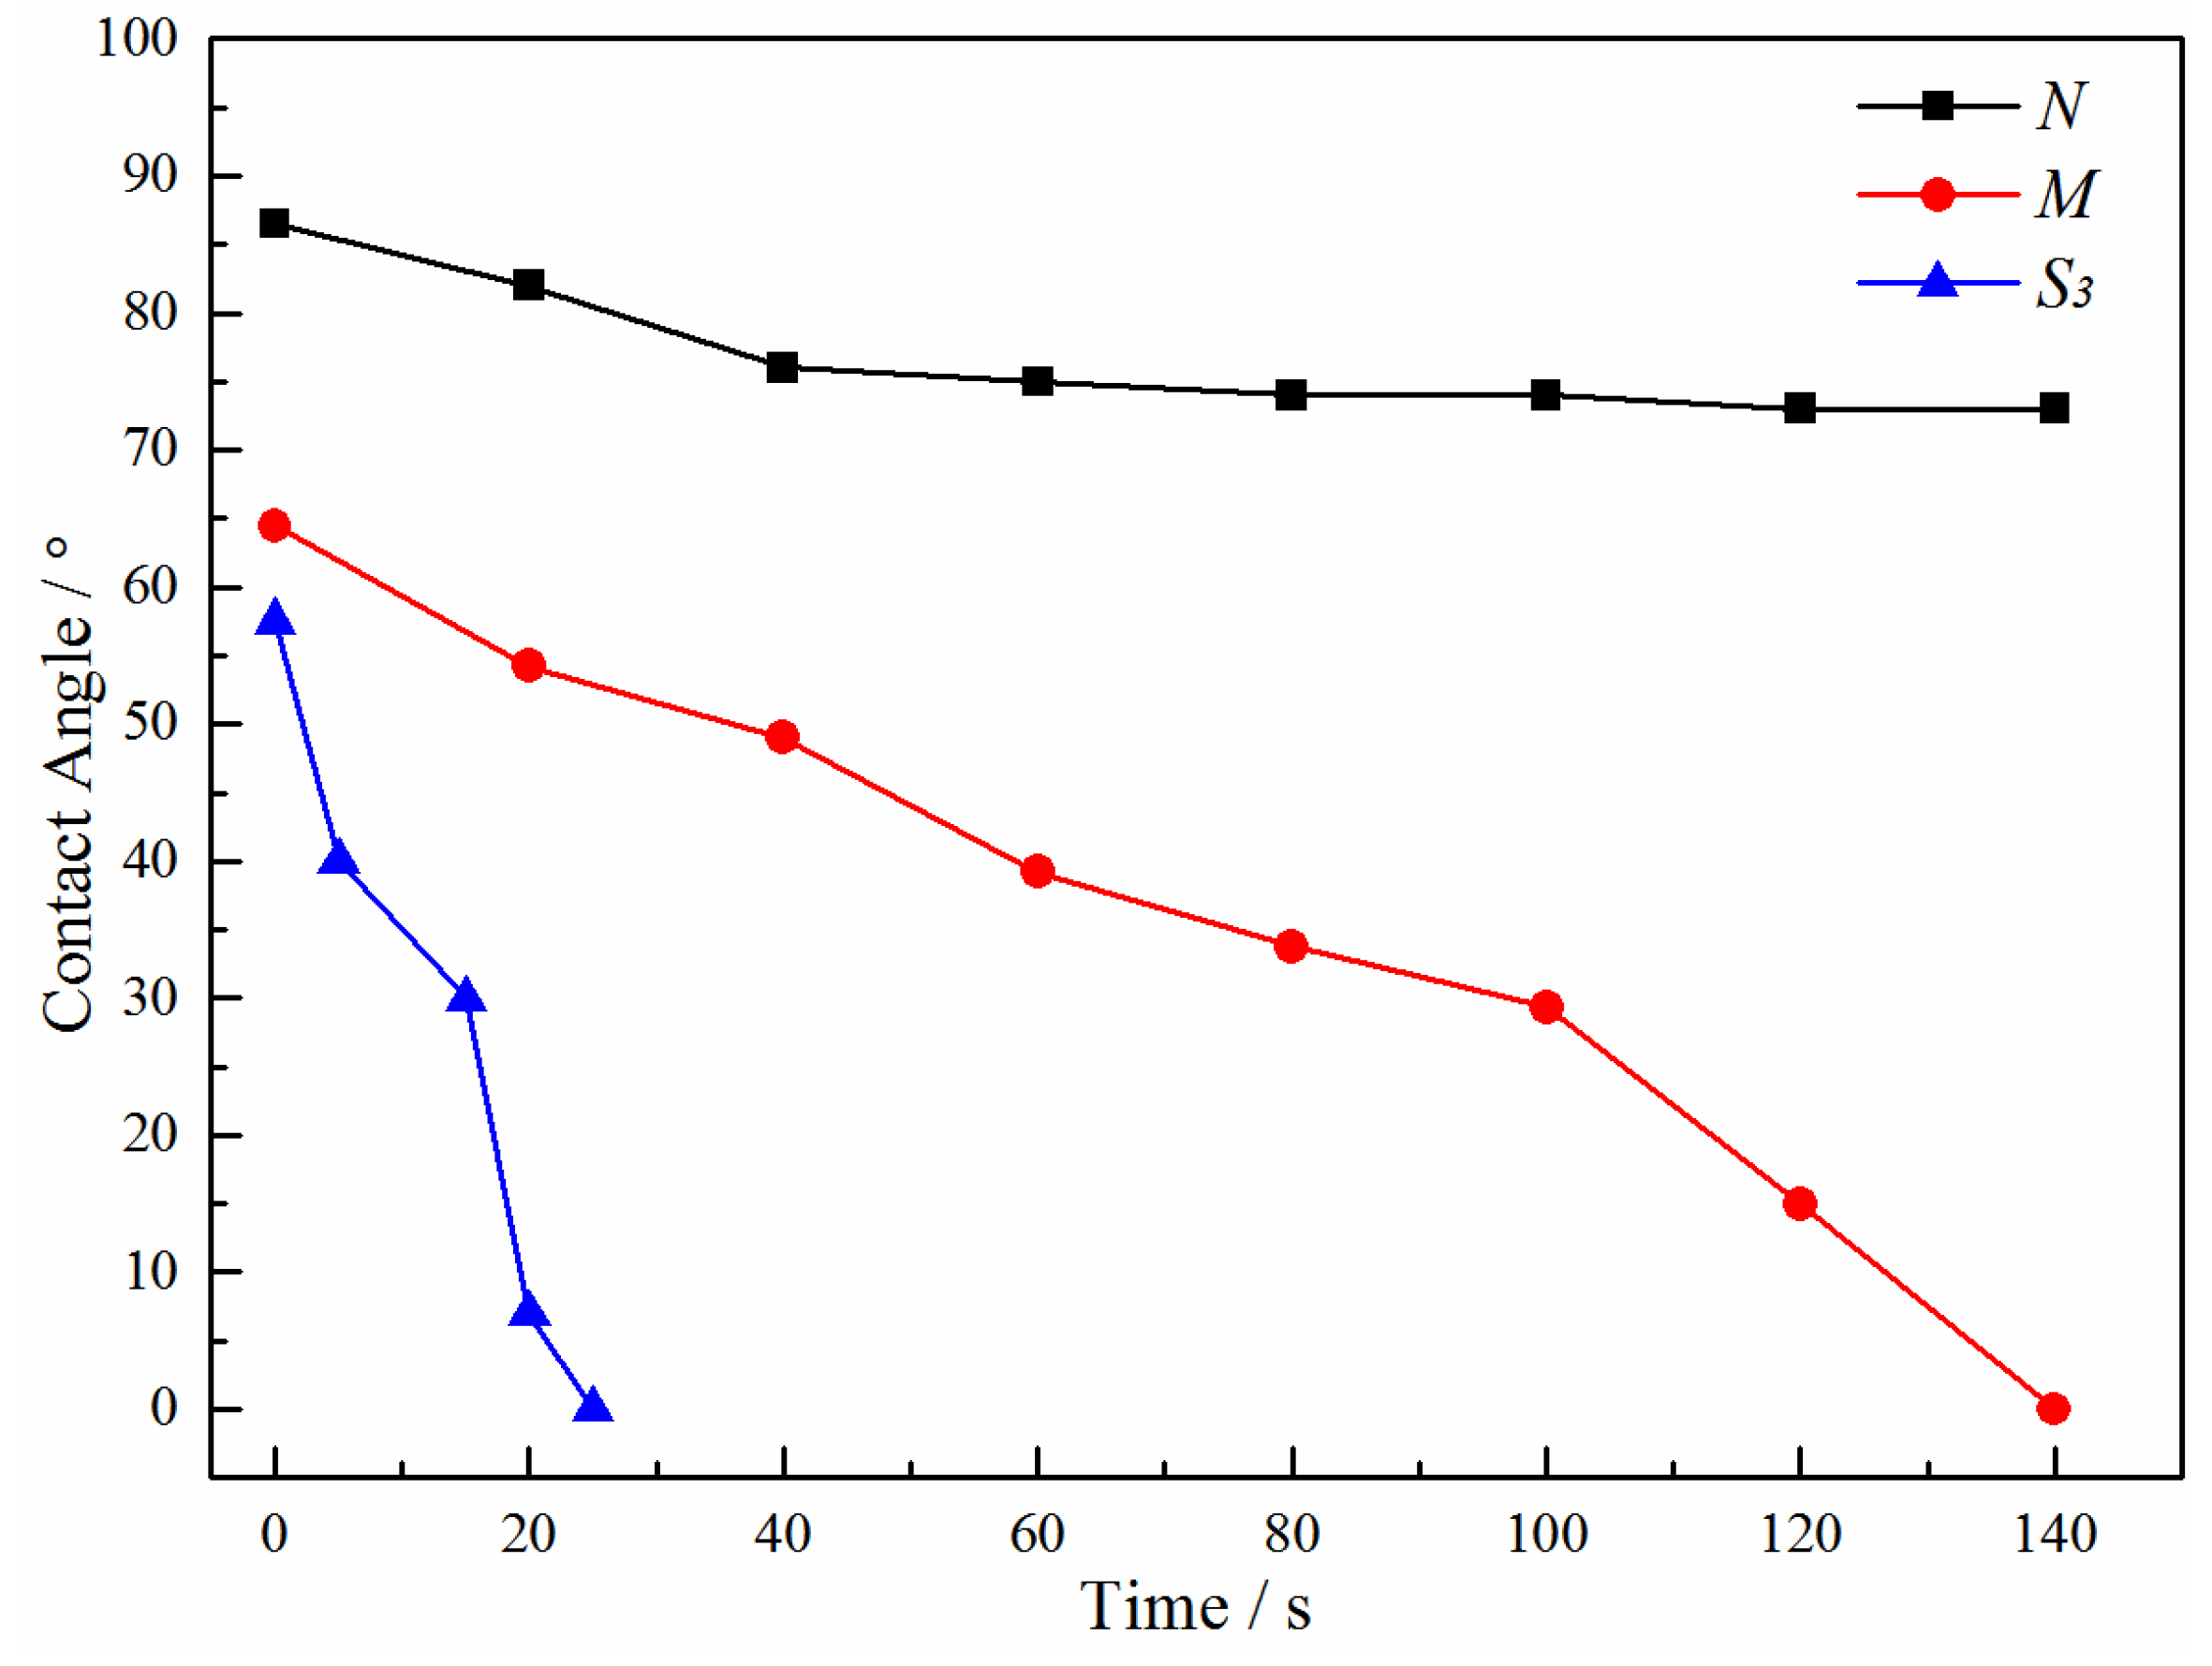
3.2.4. Hydrophilicity of PVDF/PVA Blend Membranes

To study the membrane hydrophilicity, the dynamic water contact angles of the PVDF/PVA blend membranes M and S3 were measured and compared against the pure PVDF membrane N. The results are shown in Figure 11, in which the water contact angle decreases more significantly with increasing PVDF/PVA blend ratio from pure PVDF (N) to 8:2 (S3). For the control membrane N, the contact angle decreases from the initial value of about 86.5° and reaches a plateau of 73°; while that of the blend membrane S3 decreases most drastically from 57° down to 0° in 25 s, indicating complete penetration of water into the membrane matrix. Hence, it is obvious that the hydrophilic properties of PVDF/PVA blend membranes were prominently improved with the addition of PVA.

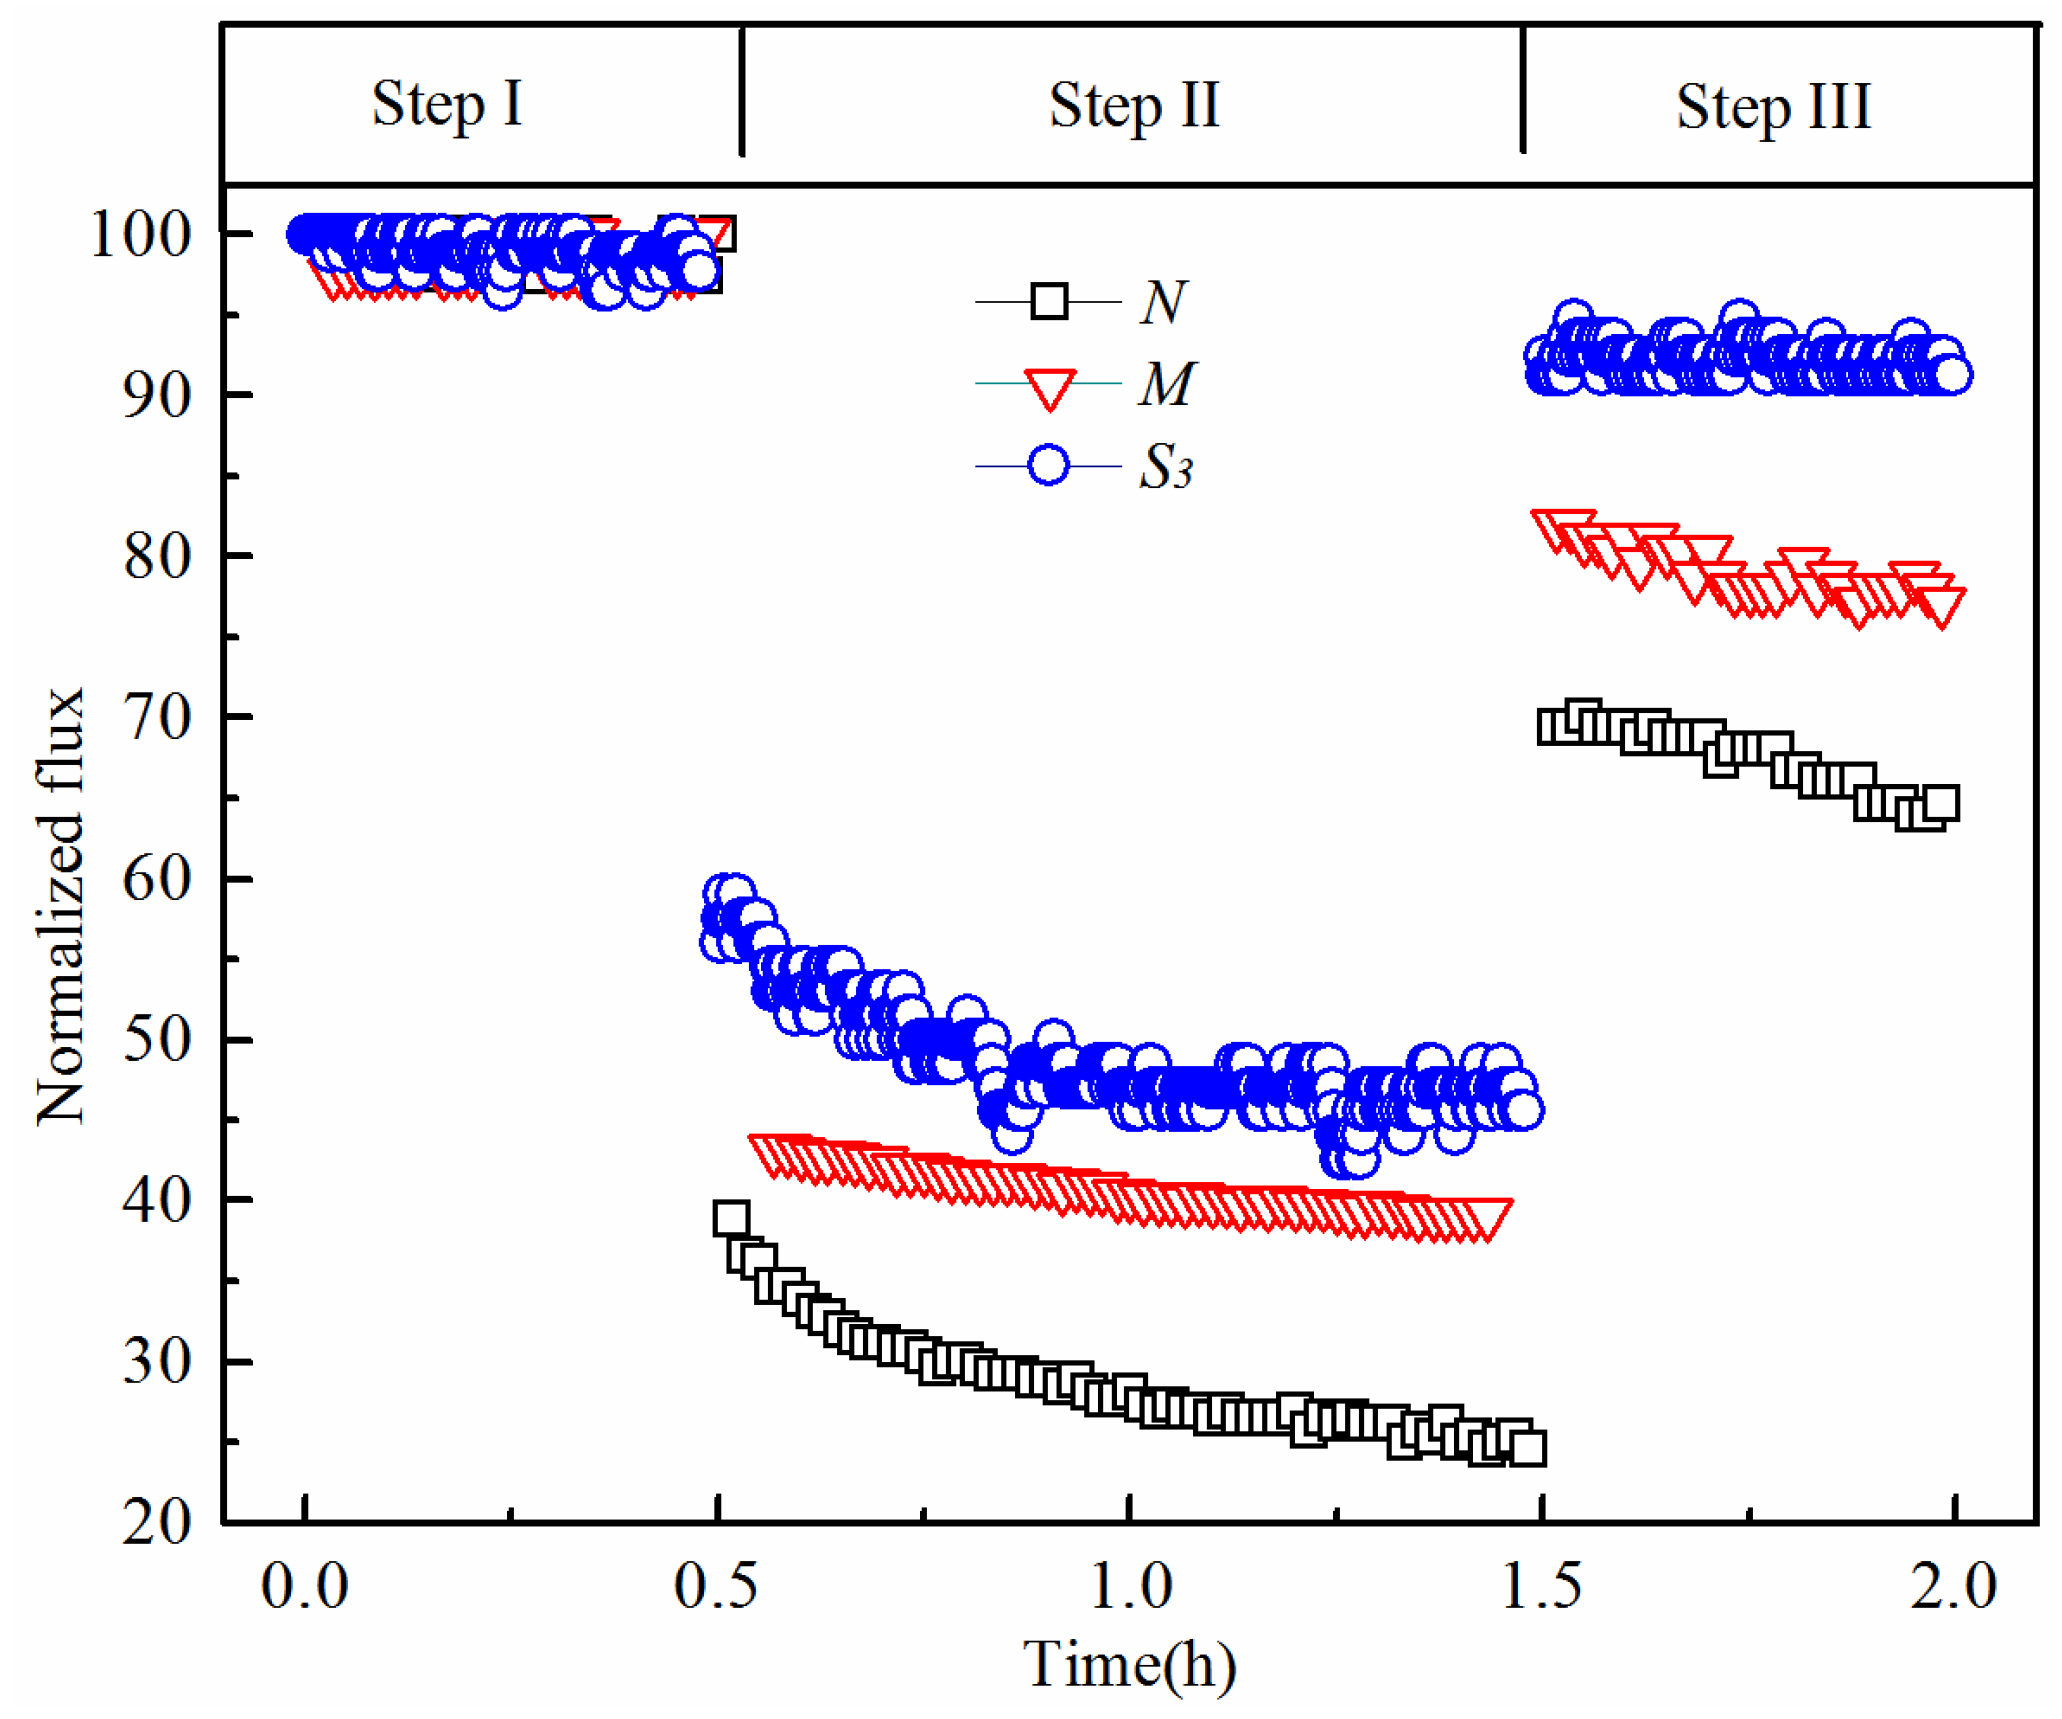
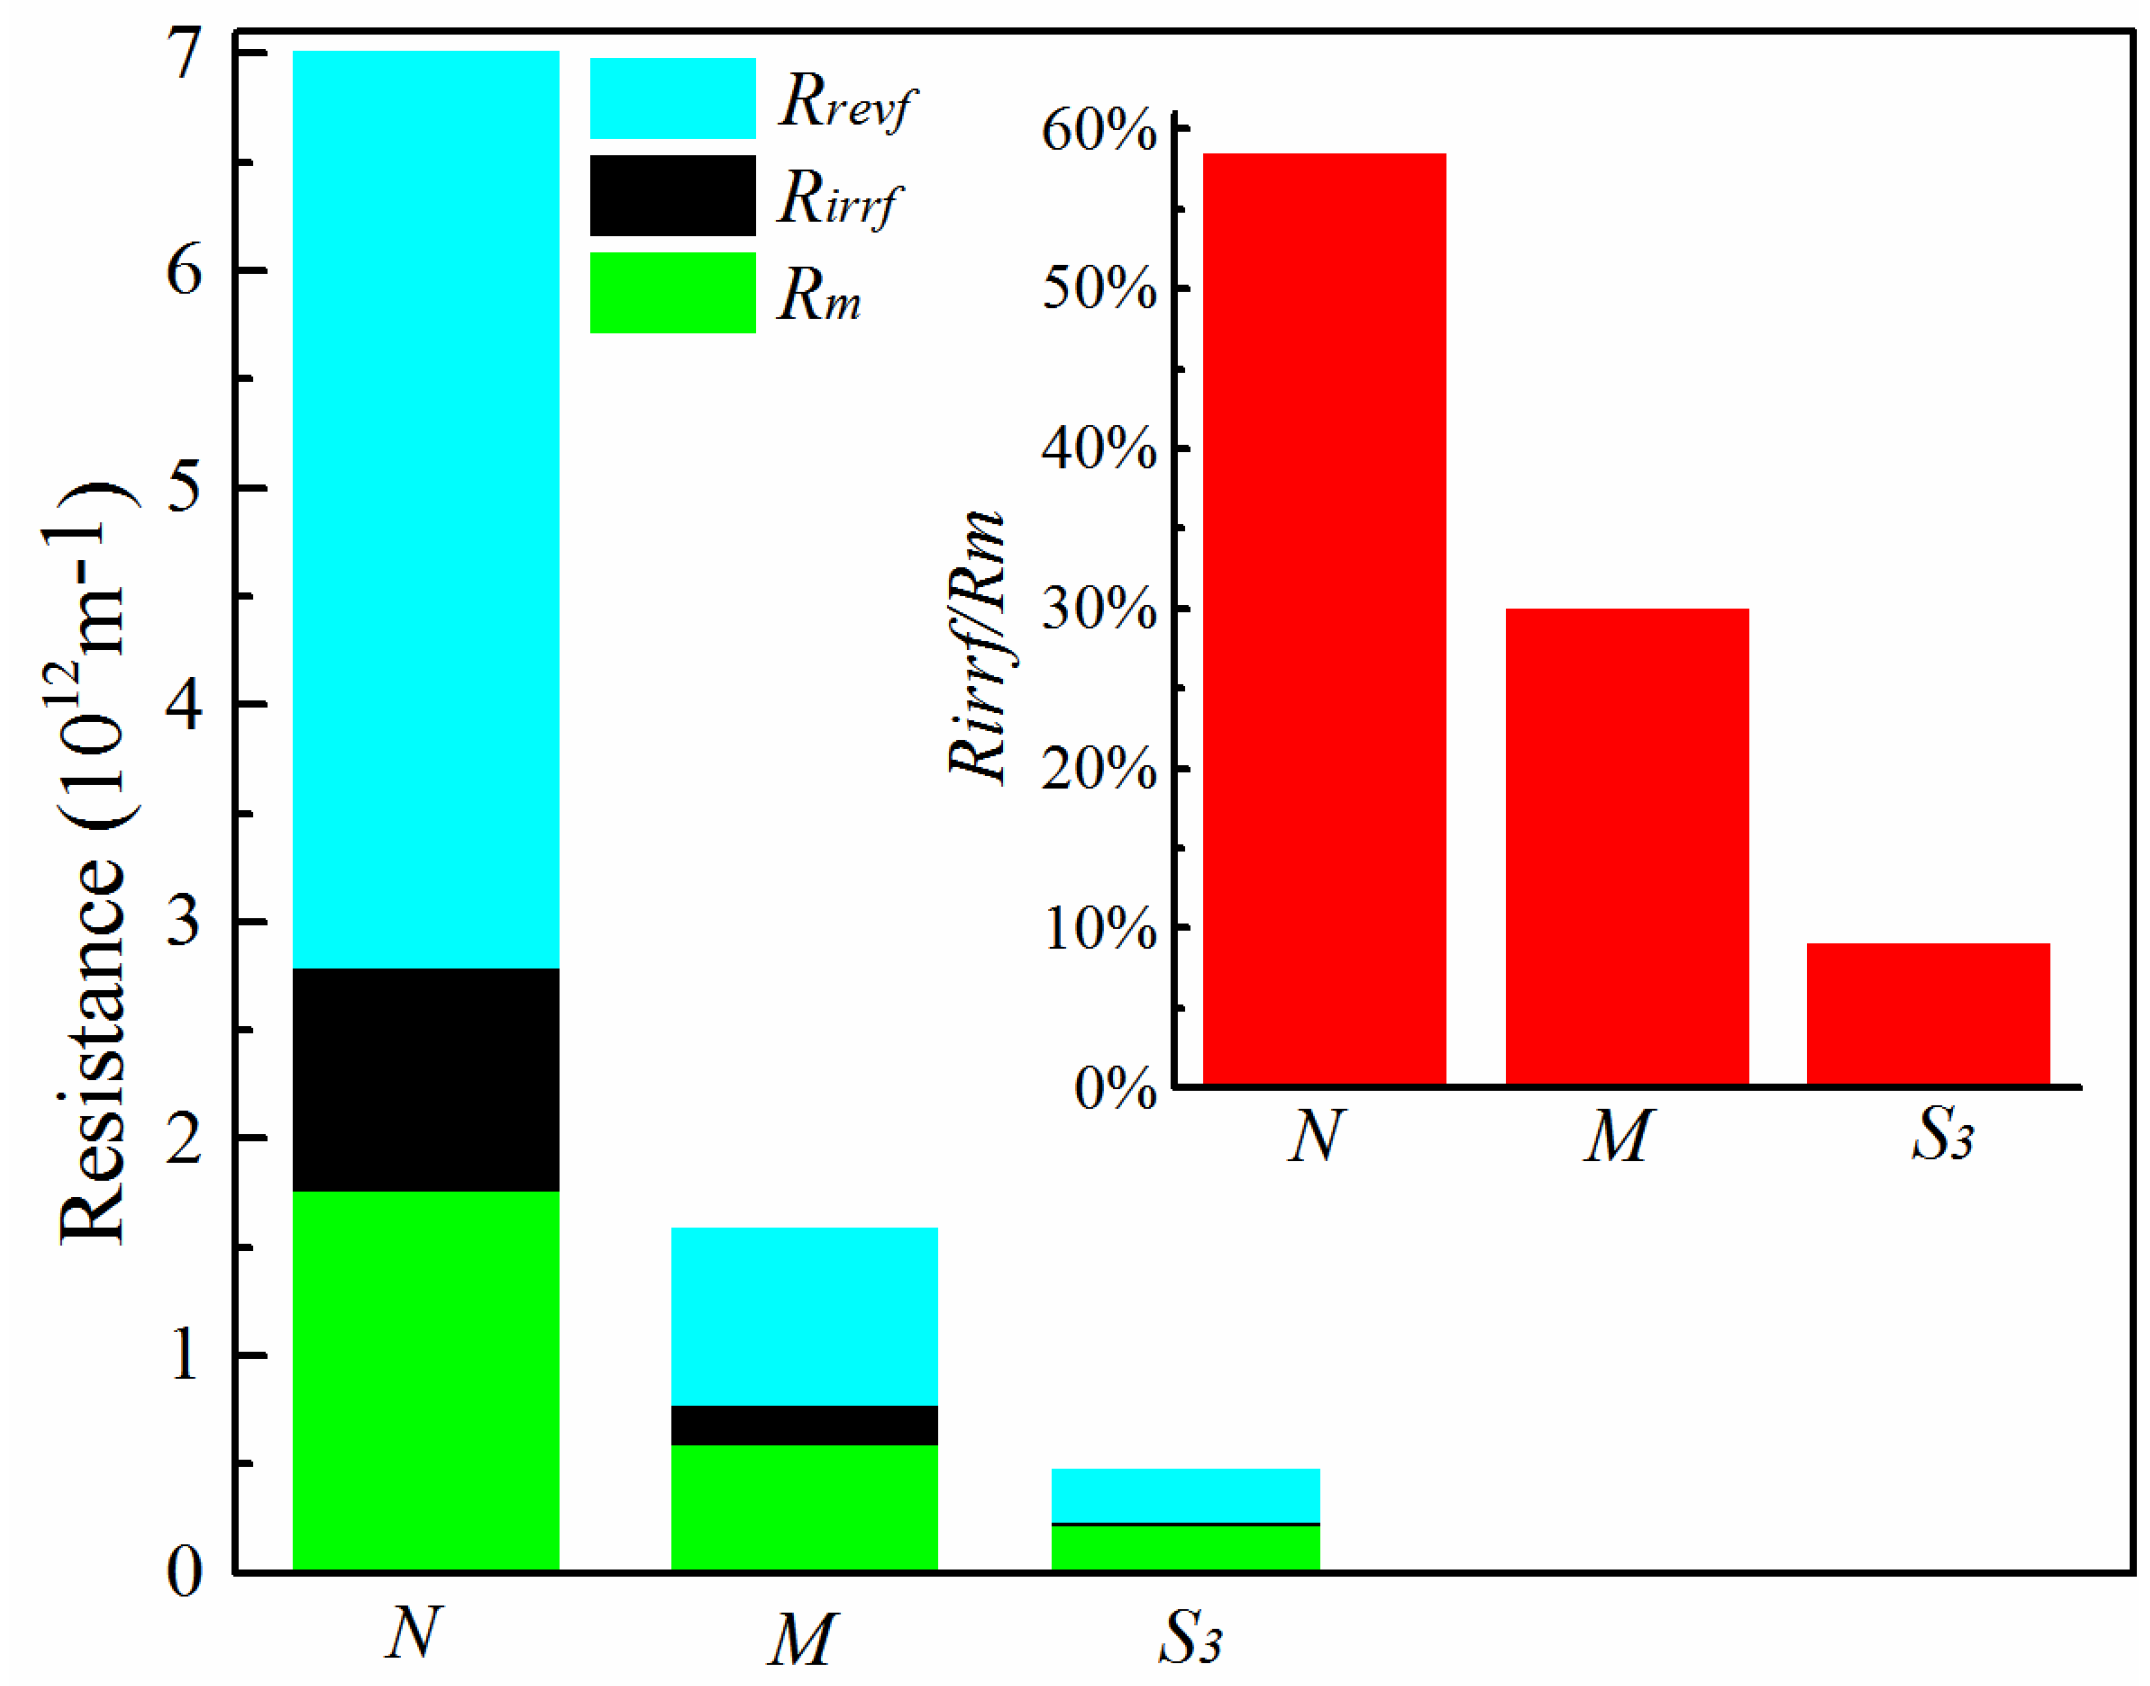
3.3. Antifouling Performance and Membrane Resistance Analysis

Hydrophilicity is an important factor affecting the fouling behaviour and filtration performance for MF/UF applications. The newly-prepared PVDF/PVA blend membranes M and S3 were selected to examine the antifouling performance, benchmarking against the pure PVDF membrane N.
As shown in Figure 12, the normalized fluxes Jf/Ji due to fouling and Jr/Ji after physical cleaning were used to evaluate the antifouling performance of the membranes. In the first filtration step as described in Section 2.4, the water flux (Ji) declined slightly during the first 30 min for all tested membranes due to pre-pressurizing. However, in the second filtration step, the relative water flux (Jf/Ji) decreased significantly when the BSA solution was fed. The ratios of the water flux of the fouled membrane to their initial fluxes, i.e., Jf/Ji, of the membranes N, M and S3 reached plateau values of 24.7% (N), 39% (M) and 46.4% (S3), respectively. After cleaning with DI water in the third filtration, the water flux of all membranes was partially restored. However, the effect of physical cleaning on flux recovery is more efficient for the blend membranes M and S3. Specifically, for the pure PVDF membrane N, the water flux recovery ratio Jr/Ji stabilizes at 64.4% after cleaning; while for the hydrophilically-modified PVDF membranes M and S3, Jr/Ji are 77.6% and 91.1%, respectively. Hence, compared to the hydrophilically-modified membranes, the pure PVDF membrane is more susceptible to fouling caused by organic molecules, and the foulants stick to the membranes’ surface more tightly, which poses challenge for cleaning and long-term operation. The NTIPS PVDF membranes showed great potential for mitigating organic fouling by appropriately controlling the fabrication conditions.
To further understand the fouling characteristics of the pure PVDF membrane N and hydrophilically-modified PVDF membranes M and S3, the local resistances Rm, Rrevf, Rirrf and Rt are calculated based on Equations (3)–(5). The calculation results are shown in Table 4 and Figure 13. The total resistance Rt of membranes N, M and S3 follows a decreasing order of 7.02 × 10¹² m−1, 1.59 × 10¹² m−1 and 0.49 × 10¹² m−1, respectively. Thus, a significant reduction of Rt was obtained for membrane S3 due to the higher PVA proportion. Consistent with the flux recovery results, this confirms the benefits of the hydrophilic modification for obtaining better filtration membranes with low fouling propensity and, hence, improved long-term performance.
Furthermore, as the PVDF/PVA blend ratio increases from 10:0 to 8:2, the value of Rirrf/Rm decreases from 58.5% down to 9.1%, as shown in Figure 13. Thus, the proportion of irreversible fouling resistance Rirrf of the hydrophilically-modified PVDF membrane S3 is more significantly decreased compared to that of the control membrane N, resulting in less irreversible fouling, such as pore blocking and adsorption onto the membrane surface. Overall, the hydrophilic modification of the PVDF membranes exhibited good antifouling properties.

4. Conclusions

From this study, the following conclusions can be drawn:
(1)
A novel nonsolvent thermally-induced phase separation (NTIPS) method was successfully employed to prepare hydrophilically-modified PVDF membranes. The PVDF/PVA blend membranes exhibited improved hydrophilicity, higher water permeability and enhanced fouling propensity.
(2)
As the total polymer concentrations increased, the pore size, porosity and water flux of the PVDF/PVA blend membranes reduced, and the mechanical strength was improved. The membrane pore size could be deliberately tuned to meet separation requirements.
(3)
Both surface and cross-sectional morphologies suggested that the formation of the hydrophilically-modified PVDF/PVA blend membranes was due to NTIPS mechanisms. Different from the top surface structure, which was mainly formed via the NIPS mechanism, the bottom surface of all membranes exhibited a bicontinuous network induced by TIPS.
(4)
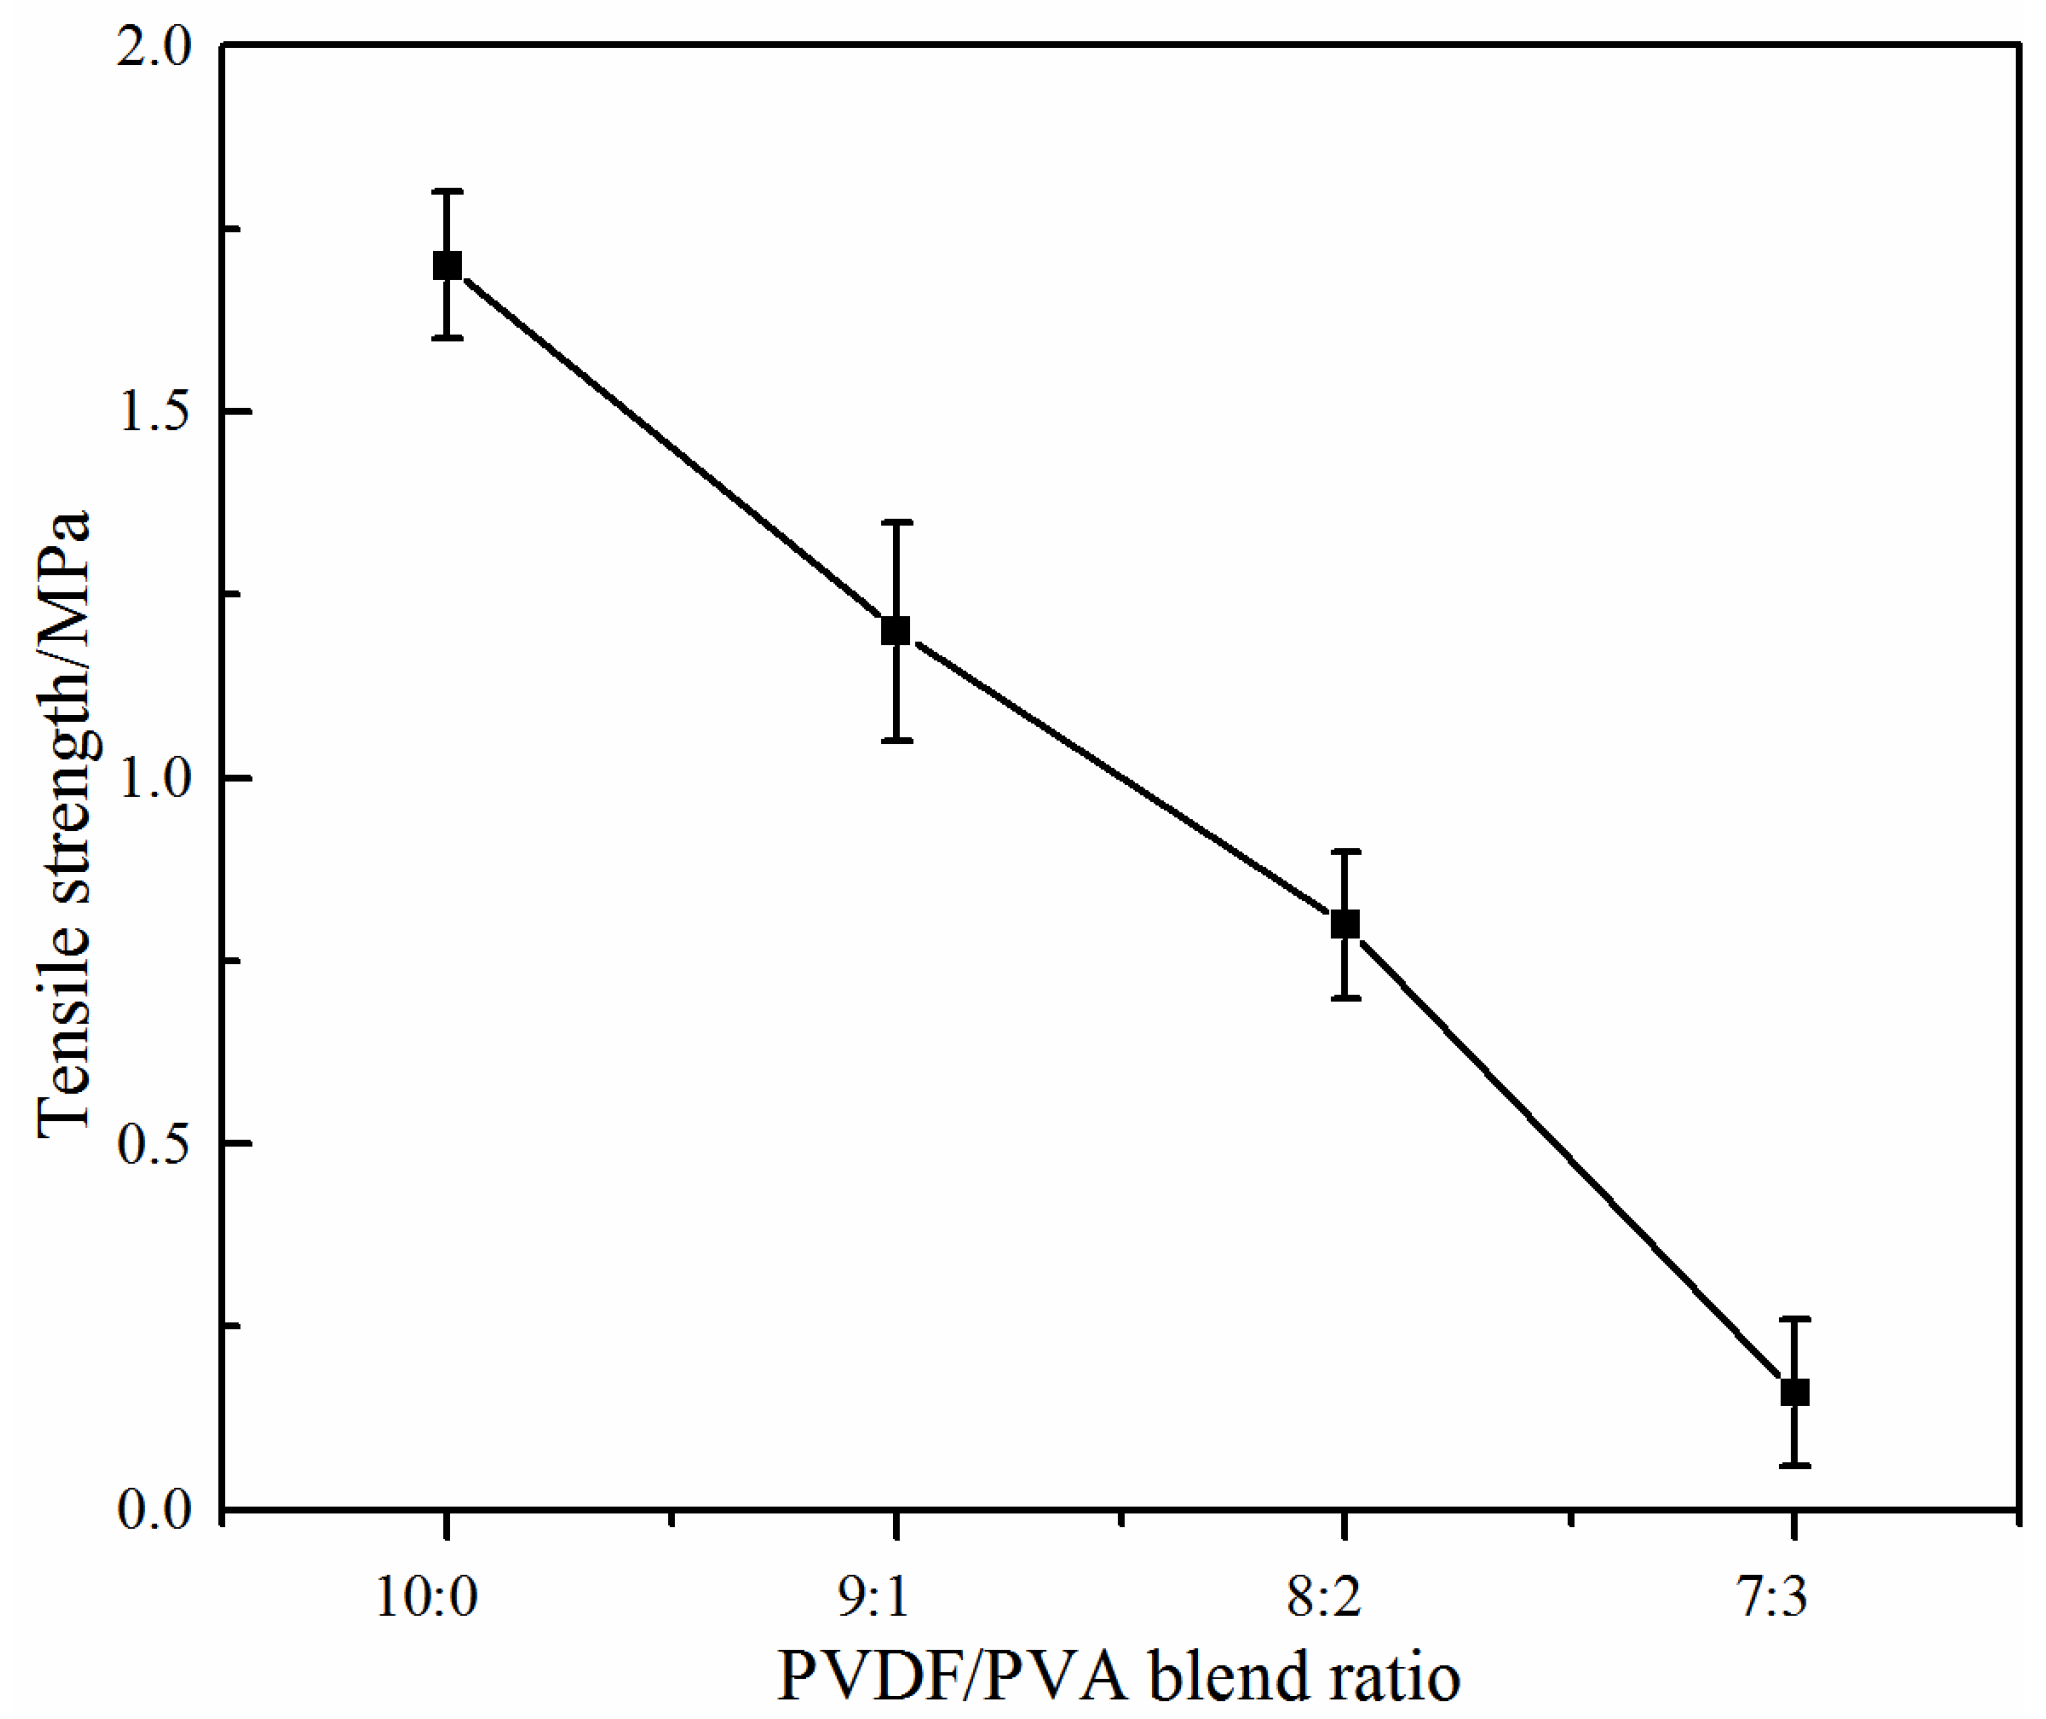
The dynamic water contact angle of the modified membrane dropped more rapidly indicating improved hydrophilicity with the addition of PVA. However, the ratio of PVA to PVDF should be carefully chosen with the considerations of membrane mechanical strength and filtration performance.
(5)
Membrane resistance analysis revealed that the hydrophilically-modified PVDF membranes had lower total resistance of mass transfer (hence, higher permeability) and showed great potential for mitigating irreversible fouling. High performance MF/UF membranes with the desired pore size can be achieved by optimizing fabrication parameters in NTIPS. In future research, surface functionalization could be incorporated into this work to obtain advanced composite membranes with further improved hydrophilicity and antifouling properties for wastewater treatment.

Acknowledgments

This study was financially supported by the Social Development Research Projects from Science and Technology Department of Zhejiang Province (No. 2016C33023), the General Project of Department of Education of Zhejiang Province (No. Y201533832), the Ningbo International Science Technology Cooperation Project (No. 2014D10017) and the New-Shoot Talents Program of Zhejiang Province (No. 2016R405024). This work was also sponsored by the K.C. Wong Magna Fund from Ningbo University. Xing Yang gratefully thanks the support given by City West Water, Victoria, Australia, and the Industry Fellowship by Victoria University, Australia.

Author Contributions

Tonghu Xiao and Ningen Hu conceived of and defined the problem. Ningen Hu, Tonghu Xiao and Xinhai Cai developed the methodology and case studies. Ningen Hu wrote the paper. Yuhua Fu and Lining Ding contributed to the discussion. Xing Yang reviewed and contributed to the discussion and paper structure.

Conflicts of Interest

The authors declare no conflict of interest.

References

  1. Le-Clech, P.; Chen, V.; Fane, T.A.G. Fouling in membrane bioreactors used in wastewater treatment. J. Membr. Sci. 2006, 284, 17–53. [Google Scholar] [CrossRef]
  2. Bruggen, B.V.D.; Vandecasteele, C.; Gestel, T.V.; Doyen, W.; Leysen, R. A review of pressure-driven membrane processes in wastewater treatment and drinking water production. Environ. Prog. 2003, 22, 46–56. [Google Scholar] [CrossRef]
  3. Sukitpaneenit, P.; Chung, T.S. Molecular design of the morphology and pore size of PVDF hollow fiber membranes for ethanol-water separation employing the modified pore-flow concept. J. Membr. Sci. 2011, 374, 67–82. [Google Scholar] [CrossRef]
  4. Kang, G.D.; Cao, Y.M. Application and modification of poly(vinylidene fluoride) (PVDF) membranes—A review. J. Membr. Sci. 2014, 463, 145–165. [Google Scholar] [CrossRef]
  5. Kyllönen, H.; Pirkonen, P.; Nyström, M.; Nuortila-Jokinen, J.; Grönroos, A. Experimental aspects of ultrasonically enhanced cross-flow membrane filtration of industrial wastewater. Ultrason. Sonochem. 2006, 13, 295–302. [Google Scholar] [CrossRef] [PubMed]
  6. Argüello, M.A.; Álvarez, S.; Riera, F.A.; Álvarez, R. Enzymatic cleaning of inorganic ultrafiltration membranes used for whey protein fractionation. J. Membr. Sci. 2003, 216, 121–134. [Google Scholar] [CrossRef]
  7. Chen, S.C.; Fu, X.Z.; Chung, T.S. Fouling behaviors of polybenzimidazole (PBI)-polyhedral oligomericsilsesquioxane (POSS)/polyacrylonitrile (PAN) hollow fiber membranes for engineering osmosis processes. Desalination 2014, 335, 17–26. [Google Scholar] [CrossRef]
  8. Juang, R.S.; Lin, K.H. Flux recovery in the ultrafiltration of suspended solutions with ultrasound. J. Membr. Sci. 2004, 243, 115–124. [Google Scholar] [CrossRef]
  9. Muthukumaran, S.; Kentish, S.E.; Ashokkumar, M.; Stevens, G.W. Mechanisms for the ultrasonic enhancement of dairy whey ultrafiltration. J. Membr. Sci. 2005, 258, 106–114. [Google Scholar] [CrossRef]
  10. Muthukumaran, S.; Kentish, S.; Lalchandani, S.; Ashokkumar, M.; Mawson, R.; Stevens, G.W.; Grieser, F. The optimisation of ultrasonic cleaning procedures for dairy fouled ultrafiltration membranes. Ultrason. Sonochem. 2005, 12, 29–35. [Google Scholar] [CrossRef] [PubMed]
  11. Li, N.N.; Xiao, C.F.; An, S.L.; Hu, X.Y. Preparation and properties of PVDF/PVA hollow fiber membranes. Desalination 2010, 250, 530–537. [Google Scholar] [CrossRef]
  12. Rana, D.; Matsuura, T. Surface modifications for antifouling membranes. Chem. Rev. 2010, 110, 2448–2471. [Google Scholar] [CrossRef] [PubMed]
  13. Bonyadi, S.; Chung, T.S.; Krantz, W.B. Investigation of corrugation phenomenon in the inner contour of hollow fibers during the non-solvent induced phase-separation process. J. Membr. Sci. 2007, 299, 200–210. [Google Scholar] [CrossRef]
  14. Deshmukh, S.P.; Li, K. Effect of ethanol composition in water coagulation bath on morphology of PVDF hollow fibre membranes. J. Membr. Sci. 1998, 150, 75–85. [Google Scholar] [CrossRef]
  15. Edwie, F.; Teoh, M.M.; Chung, T.S. Effects of additives on dual-layer hydrophobic–hydrophilic PVDF hollow fiber membranes for membrane distillation and continuous performance. Chem. Eng. Sci. 2012, 68, 567–578. [Google Scholar] [CrossRef]
  16. Young, T.H.; Cheng, L.P.; Lin, D.J.; Fane, L.; Chuang, W.Y. Mechanisms of PVDF membrane formation by immersion-precipitation in soft (1-octanol) and harsh (water) nonsolvents. Polymer 1999, 40, 5315–5323. [Google Scholar] [CrossRef]
  17. Gu, M.H.; Zhang, J.; Wang, X.L.; Tao, H.J.; Ge, L.T. Formation of poly (vinylidene fluoride) (PVDF) membranes via thermally induced phase separation. Desalination 2006, 192, 160–167. [Google Scholar] [CrossRef]
  18. Li, D.M.; Krantz, W.B.; Greenberg, A.R.; Sani, R.L. Membrane formation via thermally induced phase separation (TIPS): Model development and validation. J. Membr. Sci. 2006, 279, 50–60. [Google Scholar] [CrossRef]
  19. Li, X.F.; Wang, Y.G.; Lu, X.L.; Xiao, C.F. Morphology changes of polyvinylidene fluoride membrane under different phase separation mechanisms. J. Membr. Sci. 2008, 320, 477–482. [Google Scholar] [CrossRef]
  20. Lin, D.J.; Chang, H.H.; Chen, T.C.; Lee, Y.C.; Cheng, L.P. Formation of porous poly(vinylidene fluoride) membranes with symmetric or asymmetric morphology by immersion precipitation in the water/TEP/PVDF system. Eur. Polym. J. 2006, 42, 1581–1594. [Google Scholar] [CrossRef]
  21. Van de Witte, P.; Dijkstra, P.J.; Van den Berg, J.W.A.; Feijen, J. Phase separation processes in polymer solutions in relation to membrane formation. J. Membr. Sci. 1996, 117, 1–31. [Google Scholar] [CrossRef]
  22. Atkinson, P.M.; Lloyd, D.R. Anisotropic flat sheet membrane formation via TIPS: Atmospheric convection and polymer molecular weight effects. J. Membr. Sci. 2000, 175, 225–238. [Google Scholar] [CrossRef]
  23. Ji, G.L.; Zhu, B.K.; Cui, Z.Y.; Zhang, C.F.; Xu, Y.Y. PVDF porous matrix with controlled microstructure prepared by TIPS process as polymer electrolyte for lithium ion battery. Polymer 2007, 48, 6415–6425. [Google Scholar] [CrossRef]
  24. Holland, B.J.; Hay, J.N. The thermal degradation of poly(vinyl alcohol). Polymer 2001, 42, 6775–6783. [Google Scholar] [CrossRef]
  25. Xiao, T.H.; Wang, P.; Yang, X.; Cai, X.H.; Lu, J. Fabrication and characterization of novel asymmetric polyvinylidene fluoride (PVDF) membranes by the nonsolvent thermally induced phase separation (NTIPS) method for membrane distillation applications. J. Membr. Sci. 2015, 489, 160–174. [Google Scholar] [CrossRef]
  26. Zhang, L.P.; Chen, G.W.; Tang, H.W.; Cheng, Q.Z.; Wang, S.Q. Preparation and Characterization of composite membranes of Polysulfone and Microcrystalline Cellulos. J. Appl. Polym. Sci. 2009, 112, 550–556. [Google Scholar] [CrossRef]
  27. Calvo, J.I.; Bottino, A.; Capannelli, G.; Hernández, A. Comparison of liquid-liquid displacement porosimetry and scanning electron microscopy image analysis to characterize ultrafiltration track-etched membranes. J. Membr Sci. 2004, 239, 189–197. [Google Scholar] [CrossRef]
  28. Sanz, J.M.; Jardines, D.; Bottino, A.; Capannelli, G.; Hernández, A.; Calvo, J.I. Liquid–liquid porometry for an accurate membrane characterization. Desalination 2006, 200, 195–197. [Google Scholar] [CrossRef]
  29. Calvo, J.I.; Peinador, R.I.; Prádanos, P.; Palacio, L.; Bottino, A.; Capannelli, G.; Hernández, A. Liquid-liquid displacement porometry to estimate the molecular weight cut-off of ultrafiltration membranes. Desalination 2011, 268, 174–181. [Google Scholar] [CrossRef]
  30. Peinador, R.I.; Calvo, J.I.; Prádanos, P.; Palacio, L.; Hernández, A. Characterisation of polymeric UF membranes by liquid–liquid displacement porosimetry. J. Membr. Sci. 2010, 348, 238–244. [Google Scholar] [CrossRef]
  31. An, Q.F.; Li, F.; Ji, Y.L.; Chen, H.L. Influence of polyvinyl alcohol on the surface morphology, separation and anti-fouling performance of the composite polyamide nanofiltration membranes. J. Membr. Sci. 2011, 367, 158–165. [Google Scholar] [CrossRef]
  32. Gohari, R.J.; Lau, W.J.; Matsuura, T.; Ismail, A.F. Effect of surface pattern formation on membrane fouling and its control in phase inversion process. J. Membr. Sci. 2013, 446, 326–331. [Google Scholar] [CrossRef]
  33. Mi, B.X.; Elimelech, M. Organic fouling of forward osmosis membranes: Fouling reversibility and cleaning without chemical reagents. J. Membr. Sci. 2010, 348, 337–345. [Google Scholar] [CrossRef]
  34. Liang, S.; Kang, Y.; Tiraferri, A.; Giannelis, E.P.; Huang, X.; Elimelech, M. Highly hydrophilic polyvinylidene fluoride (PVDF) ultrafiltration membranes via postfabrication grafting of surface-tailored silica nanoparticles. Appl. Mater. Interfaces 2013, 5, 6694–6703. [Google Scholar] [CrossRef] [PubMed]
  35. Mulder, J. Basic Principles of Membrane Technology; Springer: Kluwer Academic Publishers: Dordrecht, The Netherlands, 1996; pp. 281–311. [Google Scholar]
  36. Luján-Facundo, M.J.; Mendoza-Roca, J.A.; Cuartas-Uribe, B.; Álvarez-Blanco, S. Ultrasonic cleaning of ultrafiltration membranes fouled with BSA solution. Sep. Purif. Technol. 2013, 120, 275–281. [Google Scholar] [CrossRef]
  37. Wei, D.Q.; Tao, Y.; Zhang, Z.H.; Zhang, X.H. Effect of pre-ozonation on mitigation of ceramic UF membrane fouling caused by algal extracellular organic matters. Chem. Eng. J. 2016, 294, 157–166. [Google Scholar] [CrossRef]
  38. Shang, M.; Matsuyama, H.; Maki, T.; Teramoto, M.; Lloyd, D.R. Preparation and characterization of poly (ethylene-co-vinyl alcohol) membranes via thermally induced liquid–liquid phase separation. Appl. Polym. Sci. 2003, 87, 853–860. [Google Scholar] [CrossRef]
  39. Wang, L.; Huang, D.X.; Wang, X.D.; Meng, X.R.; Lv, Y.T.; Wang, X.; Miao, R. Preparation of PVDF membranes via the low-temperature TIPS method with diluent mixtures: The role of coagulation conditions and cooling rate. Desalination 2015, 361, 25–37. [Google Scholar] [CrossRef]
Figure 1. SEM images of PVDF/PVA membranes S1S6: (a) full cross-section; (b) cross-section adjacent to the top surface; (c) cross-section adjacent to the bottom surface.
Membranes 06 00047 g001
Figure 2. Effect of total polymer concentration on membrane porosity.
Membranes 06 00047 g002
Figure 3. Pore size distribution curves of PVDF/PVA blend membranes S1S6.
Membranes 06 00047 g003
Figure 4. Effect of total polymer concentration on water flux for PVDF/PVA blend membranes S1S6.
Membranes 06 00047 g004
Figure 5. Effect of total polymer concentration on membrane tensile strength for PVDF/PVA blend membranes S1S6.
Membranes 06 00047 g005
Figure 6. Effect of the PVDF/PVA blend ratio on tensile strength (total polymer concentration of 20 wt %).
Membranes 06 00047 g006
Figure 7. SEM images of membrane top and bottom surfaces of N, M and S3: (a) top surface (top layer); (b) bottom surface (sublayer).
Membranes 06 00047 g007
Figure 8. SEM images of membrane cross-section of N, M, S3: (a) full cross-section; (b) cross-section adjacent to the top surface; (c) cross-section adjacent to the bottom surface.
Membranes 06 00047 g008
Figure 9. Pore size distribution curves of membranes N, M and S3 (total polymer concentration of 20 wt %).
Membranes 06 00047 g009
Figure 10. Effect of the PVDF/PVA blend ratio on water flux (total polymer concentration of 20 wt %).
Membranes 06 00047 g010
Figure 11. Dynamic water contact angles of membranes N, M and S3 (total polymer concentration of 20 wt %).
Membranes 06 00047 g011
Figure 12. Antifouling performance of membranes N, M and S3 (total polymer concentration of 20 wt %).
Membranes 06 00047 g012
Figure 13. Fouling resistance analysis for membranes N, M and S3 (total polymer concentration of 20 wt %).
Membranes 06 00047 g013
Table 1. Composition of casting solutions for various PVDF/PV blend membranes. CPL, ε-caprolactam.
Membrane IDTotal Polymer (PVDF/PVA) Concentration (wt %)PVDF/PVA Blend RatioCPL Concentration (wt %)
S1168:284
S2188:282
S3208:280
S4228:278
S5248:276
S6268:274
L207:380
M209:180
N2010:080
Table 2. Mean pore size of PVDF/PVA blend membranes S1S6.
Membrane ID
(Polymer Concentration)
S1
16 wt %
S2
18 wt %
S3
20 wt %
S4
22 wt %
S5
24 wt %
S6
26 wt %
Mean pore size (nm)81.773.664.648.036.227.6
Table 3. Mean pore size of membranes N, M and S3.
Membrane ID
(PVDF:PVA Blend Ratio)
N
(10:0)
M
(9:1)
S3
(8:2)
Mean pore size (nm)34.341.664.6
Table 4. Calculation of the membrane resistance for membranes N, M and S3.
Local ResistanceNMS3
Rm (1012 m−1)1.760.600.22
Rirrf (1012 m−1)1.030.180.02
Rrevf (1012 m−1)4.220.810.24
Rt (1012 m−1)7.021.590.49
Rirrf/Rm58.5%30.0%9.1%

