Separation of Organic Compounds from ABE Model Solutions via Pervaporation Using Activated Carbon/PDMS Mixed Matrix Membranes


Abstract
:1. Introduction
2. Materials and Methods
2.1. Material
2.2. Membrane Fabrication
2.2.1. Neat PDMS Membrane Active Layer
2.2.2. Activated Carbon (AC) Nanoparticles-PDMS Mixed Matrix Membranes
2.3. Membrane Characterization
2.3.1. Morphology
2.3.2. Degree of Swelling (DS)
2.3.3. Gas Chromatography (GC)
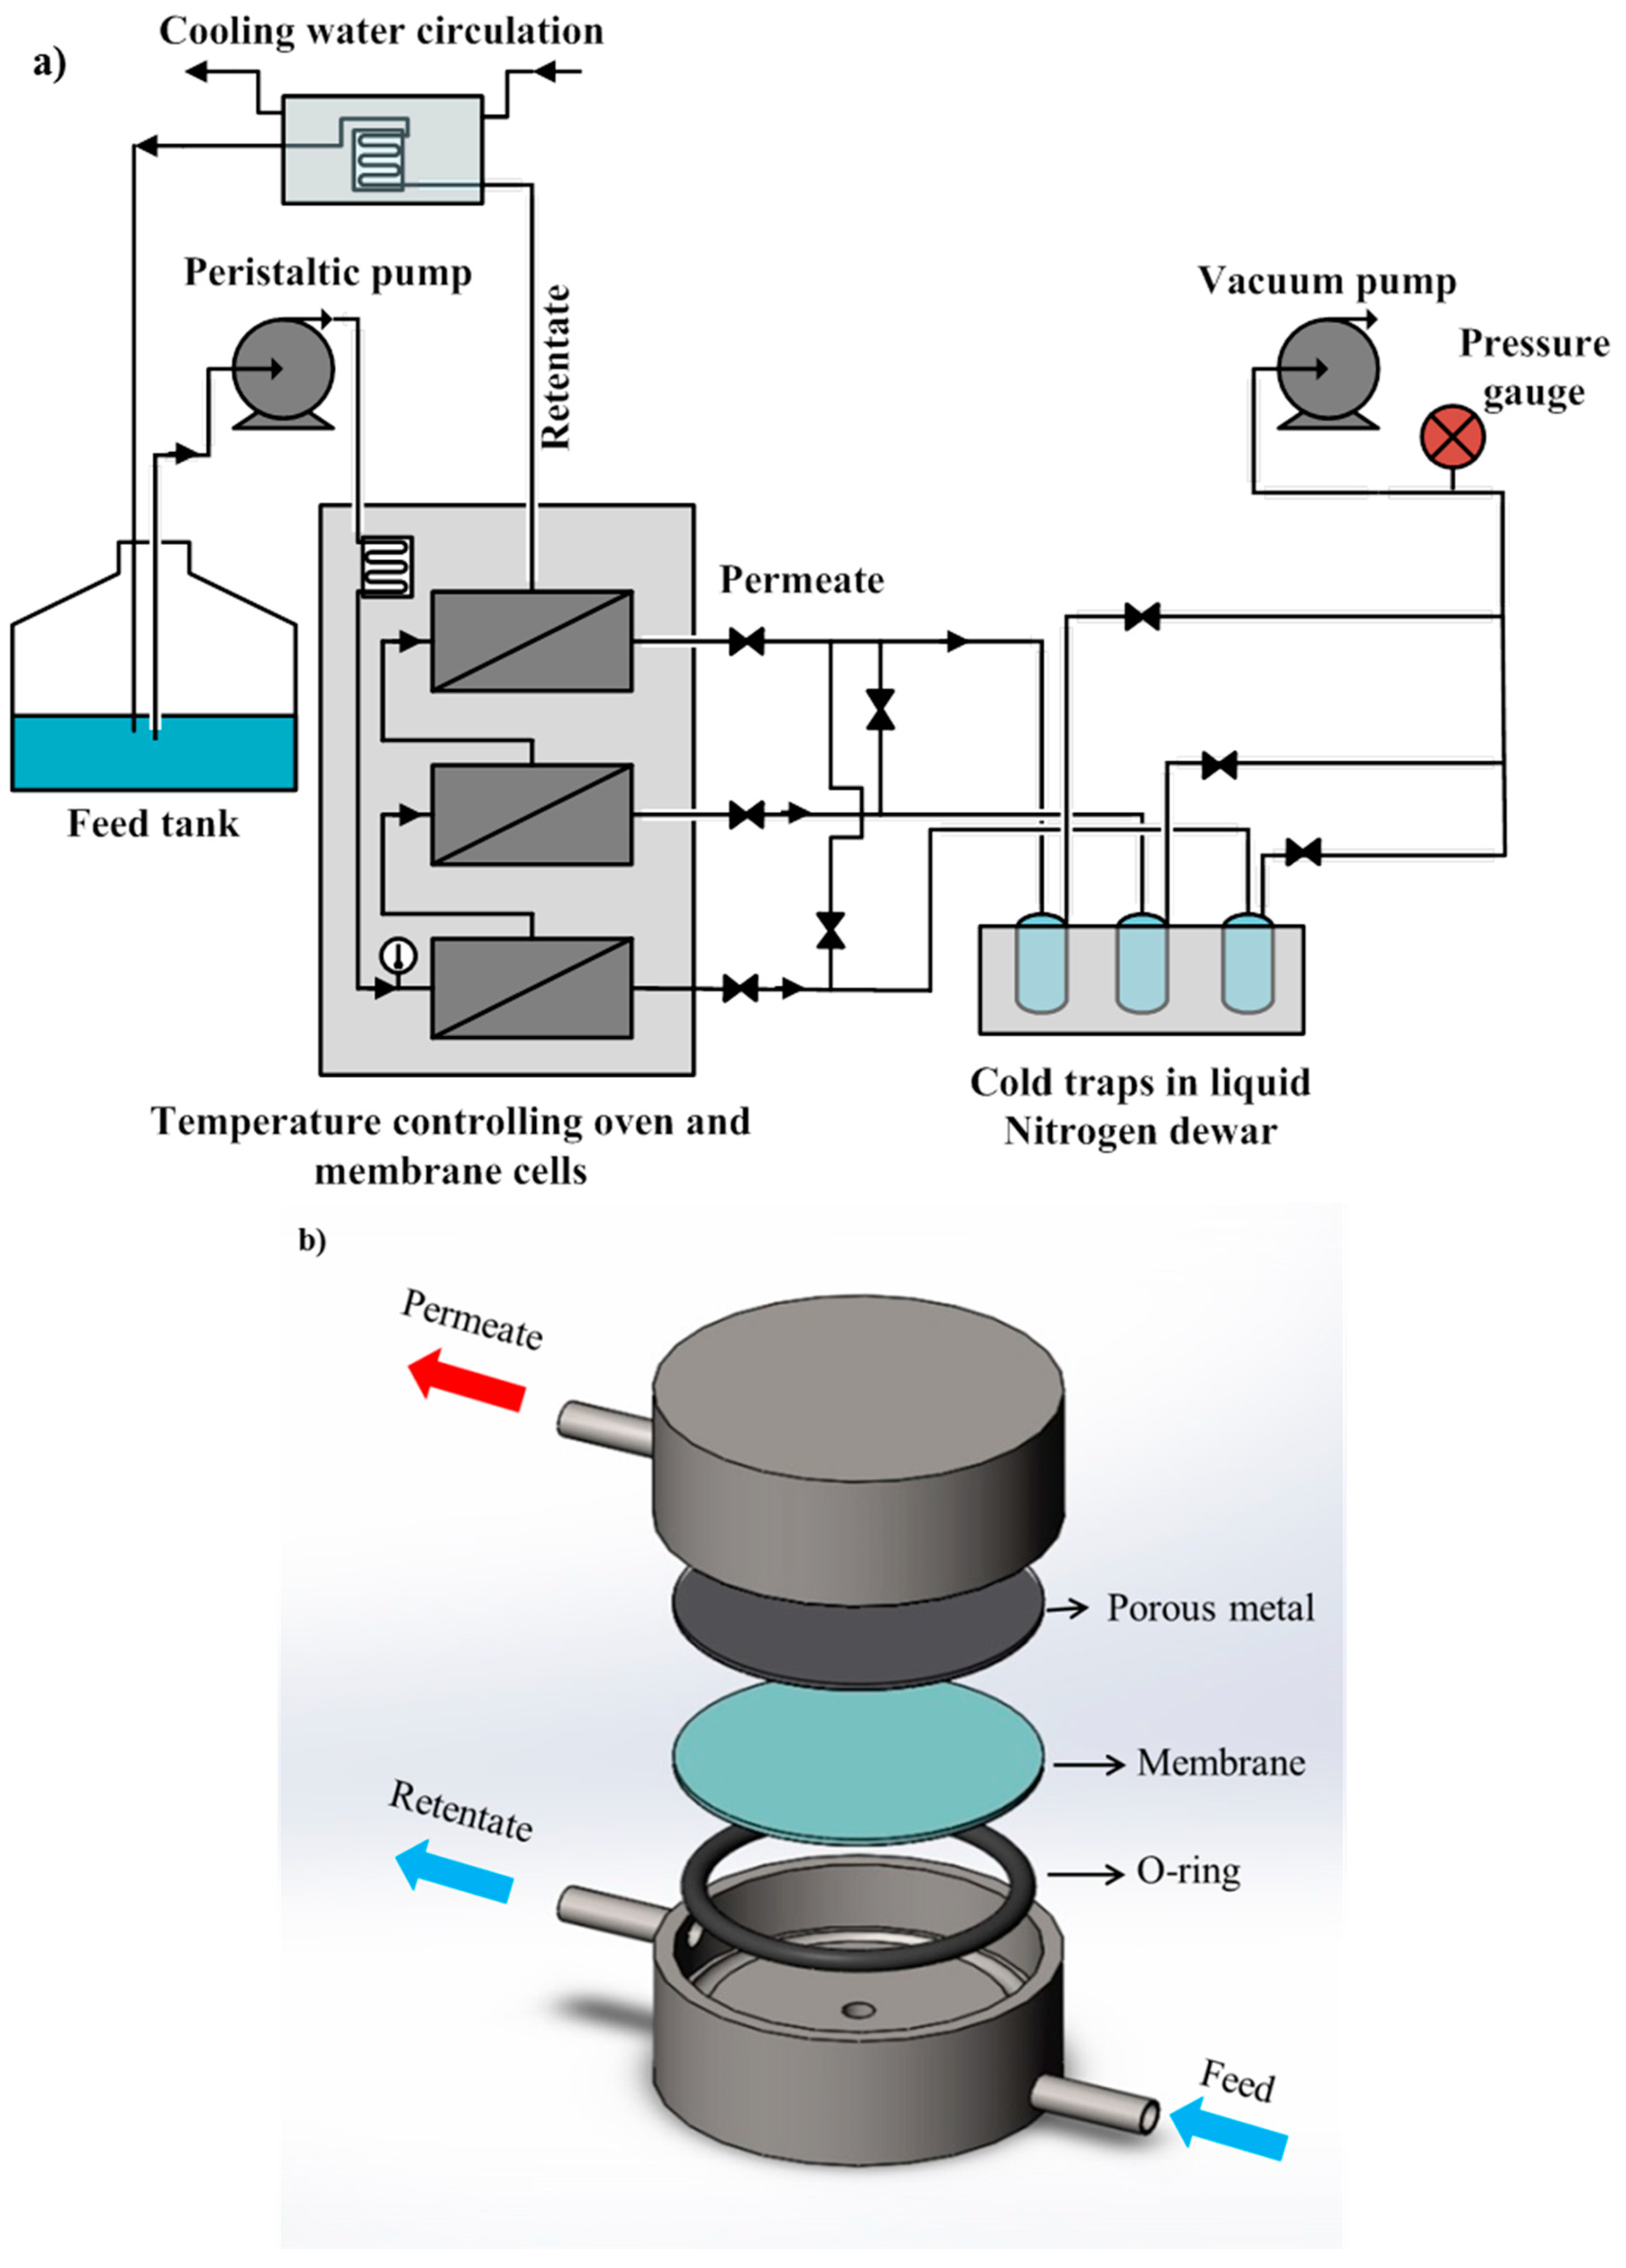
2.3.4. Pervaporation Experiments
2.3.5. Performance Metrics
3. Results and Discussion
3.1. Morphology and Structure of AC-PDMS
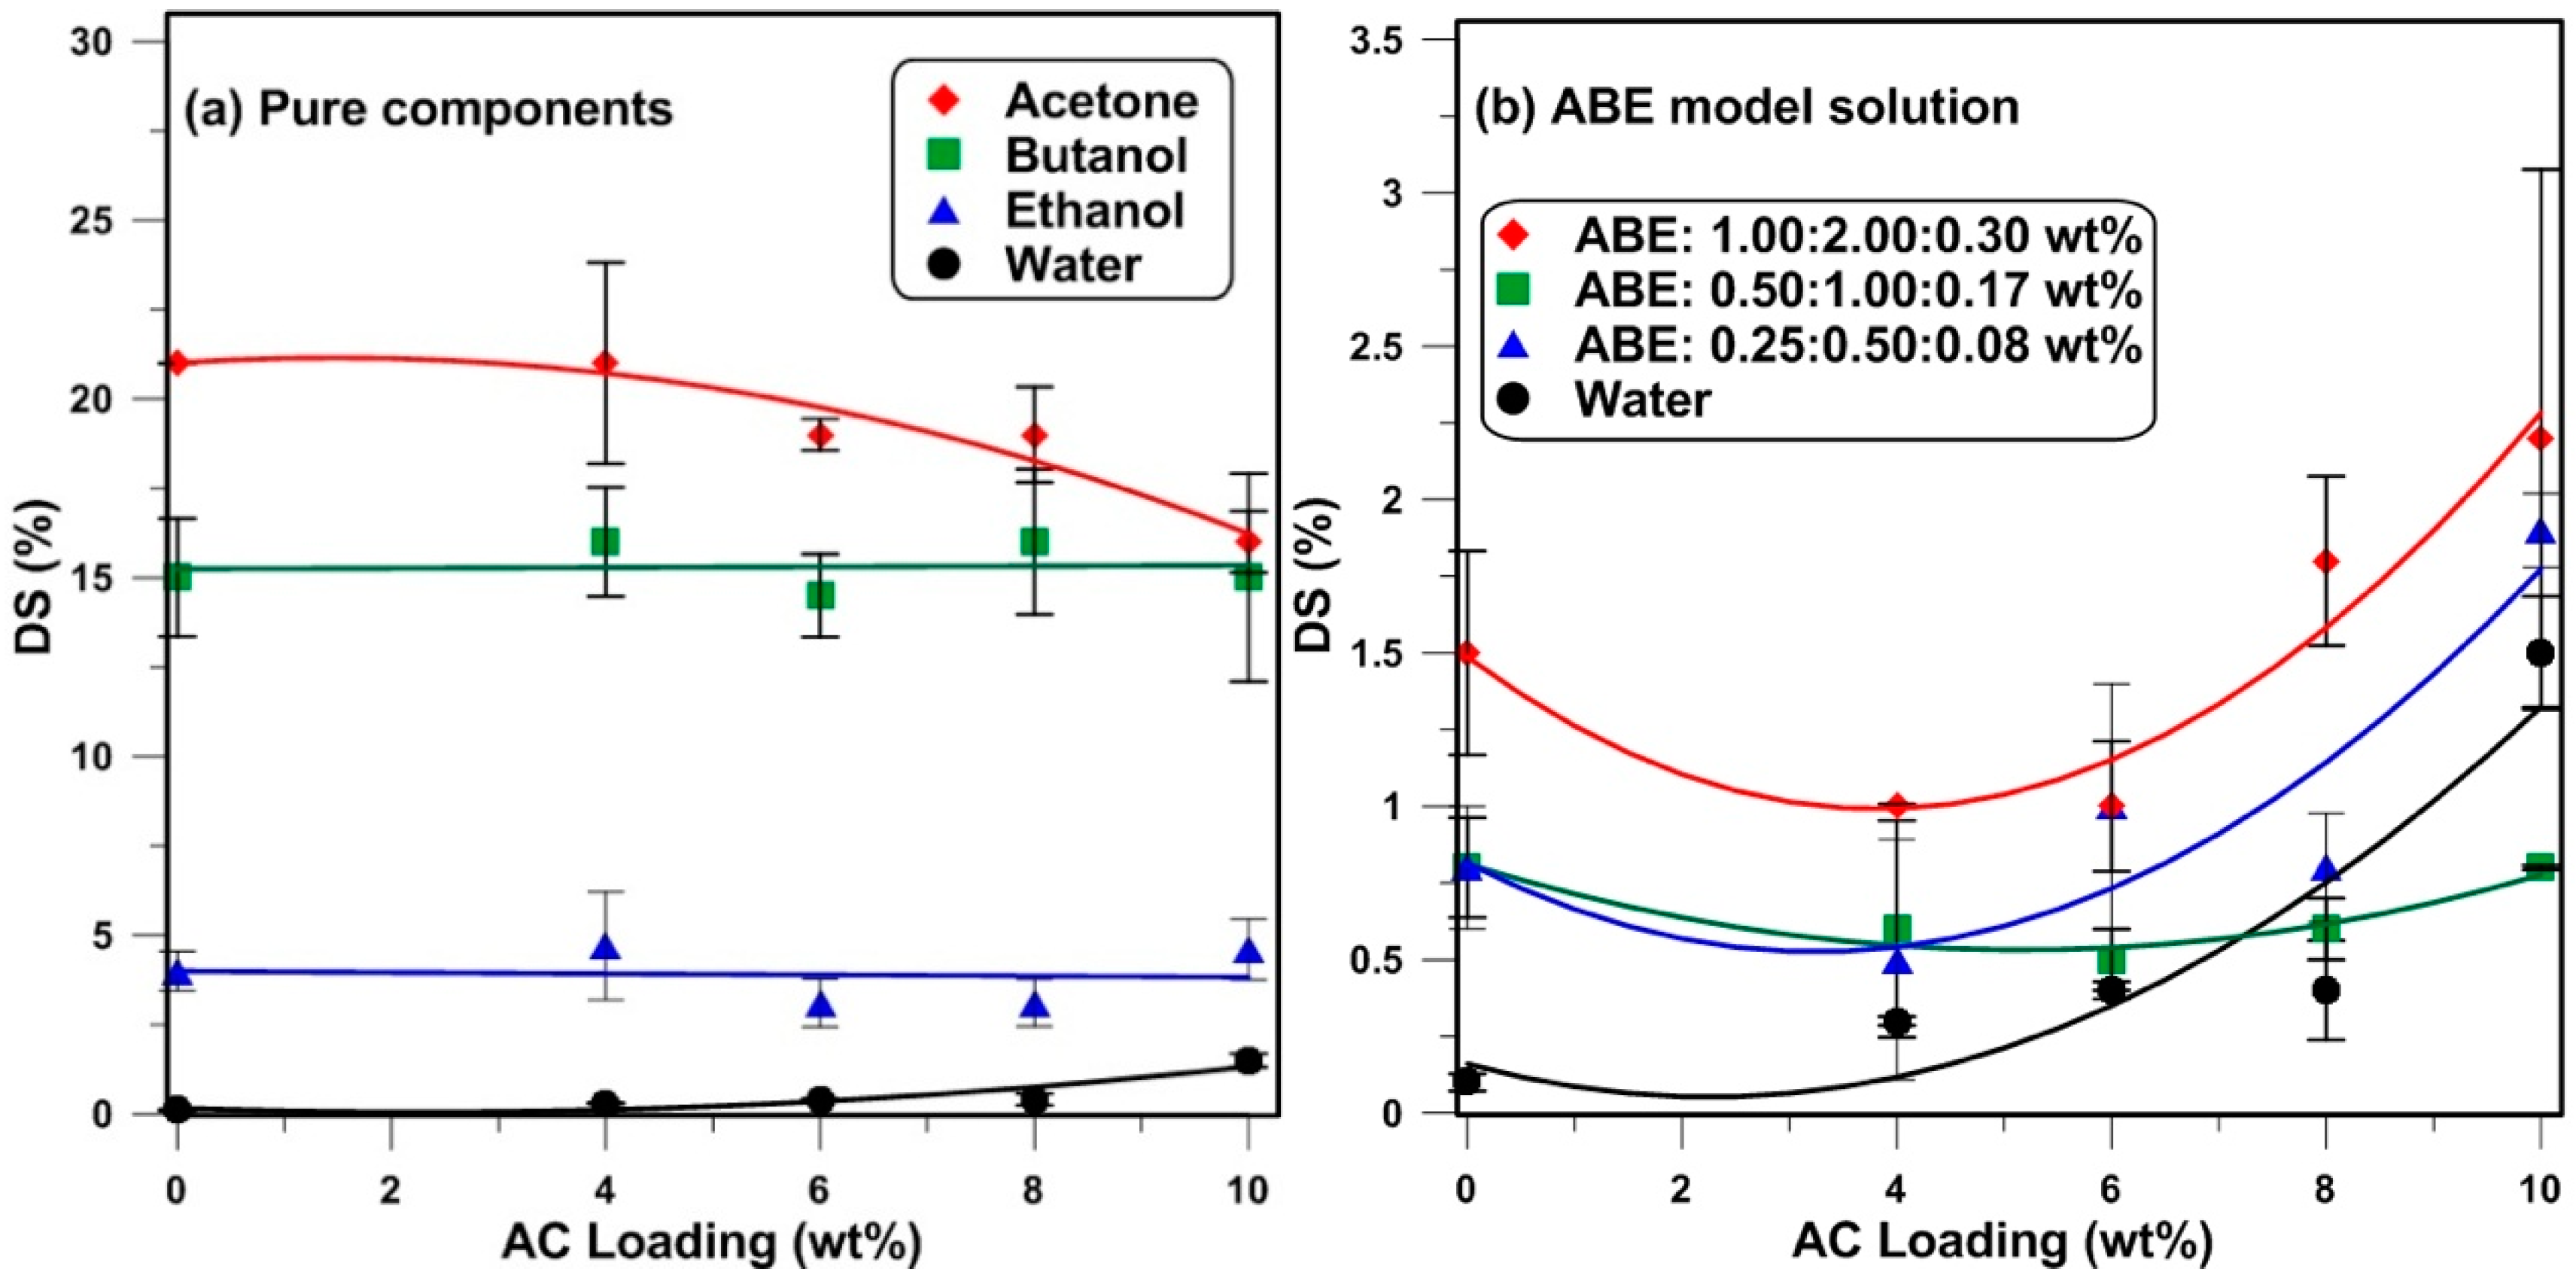
3.2. Degree of Swelling (DS)
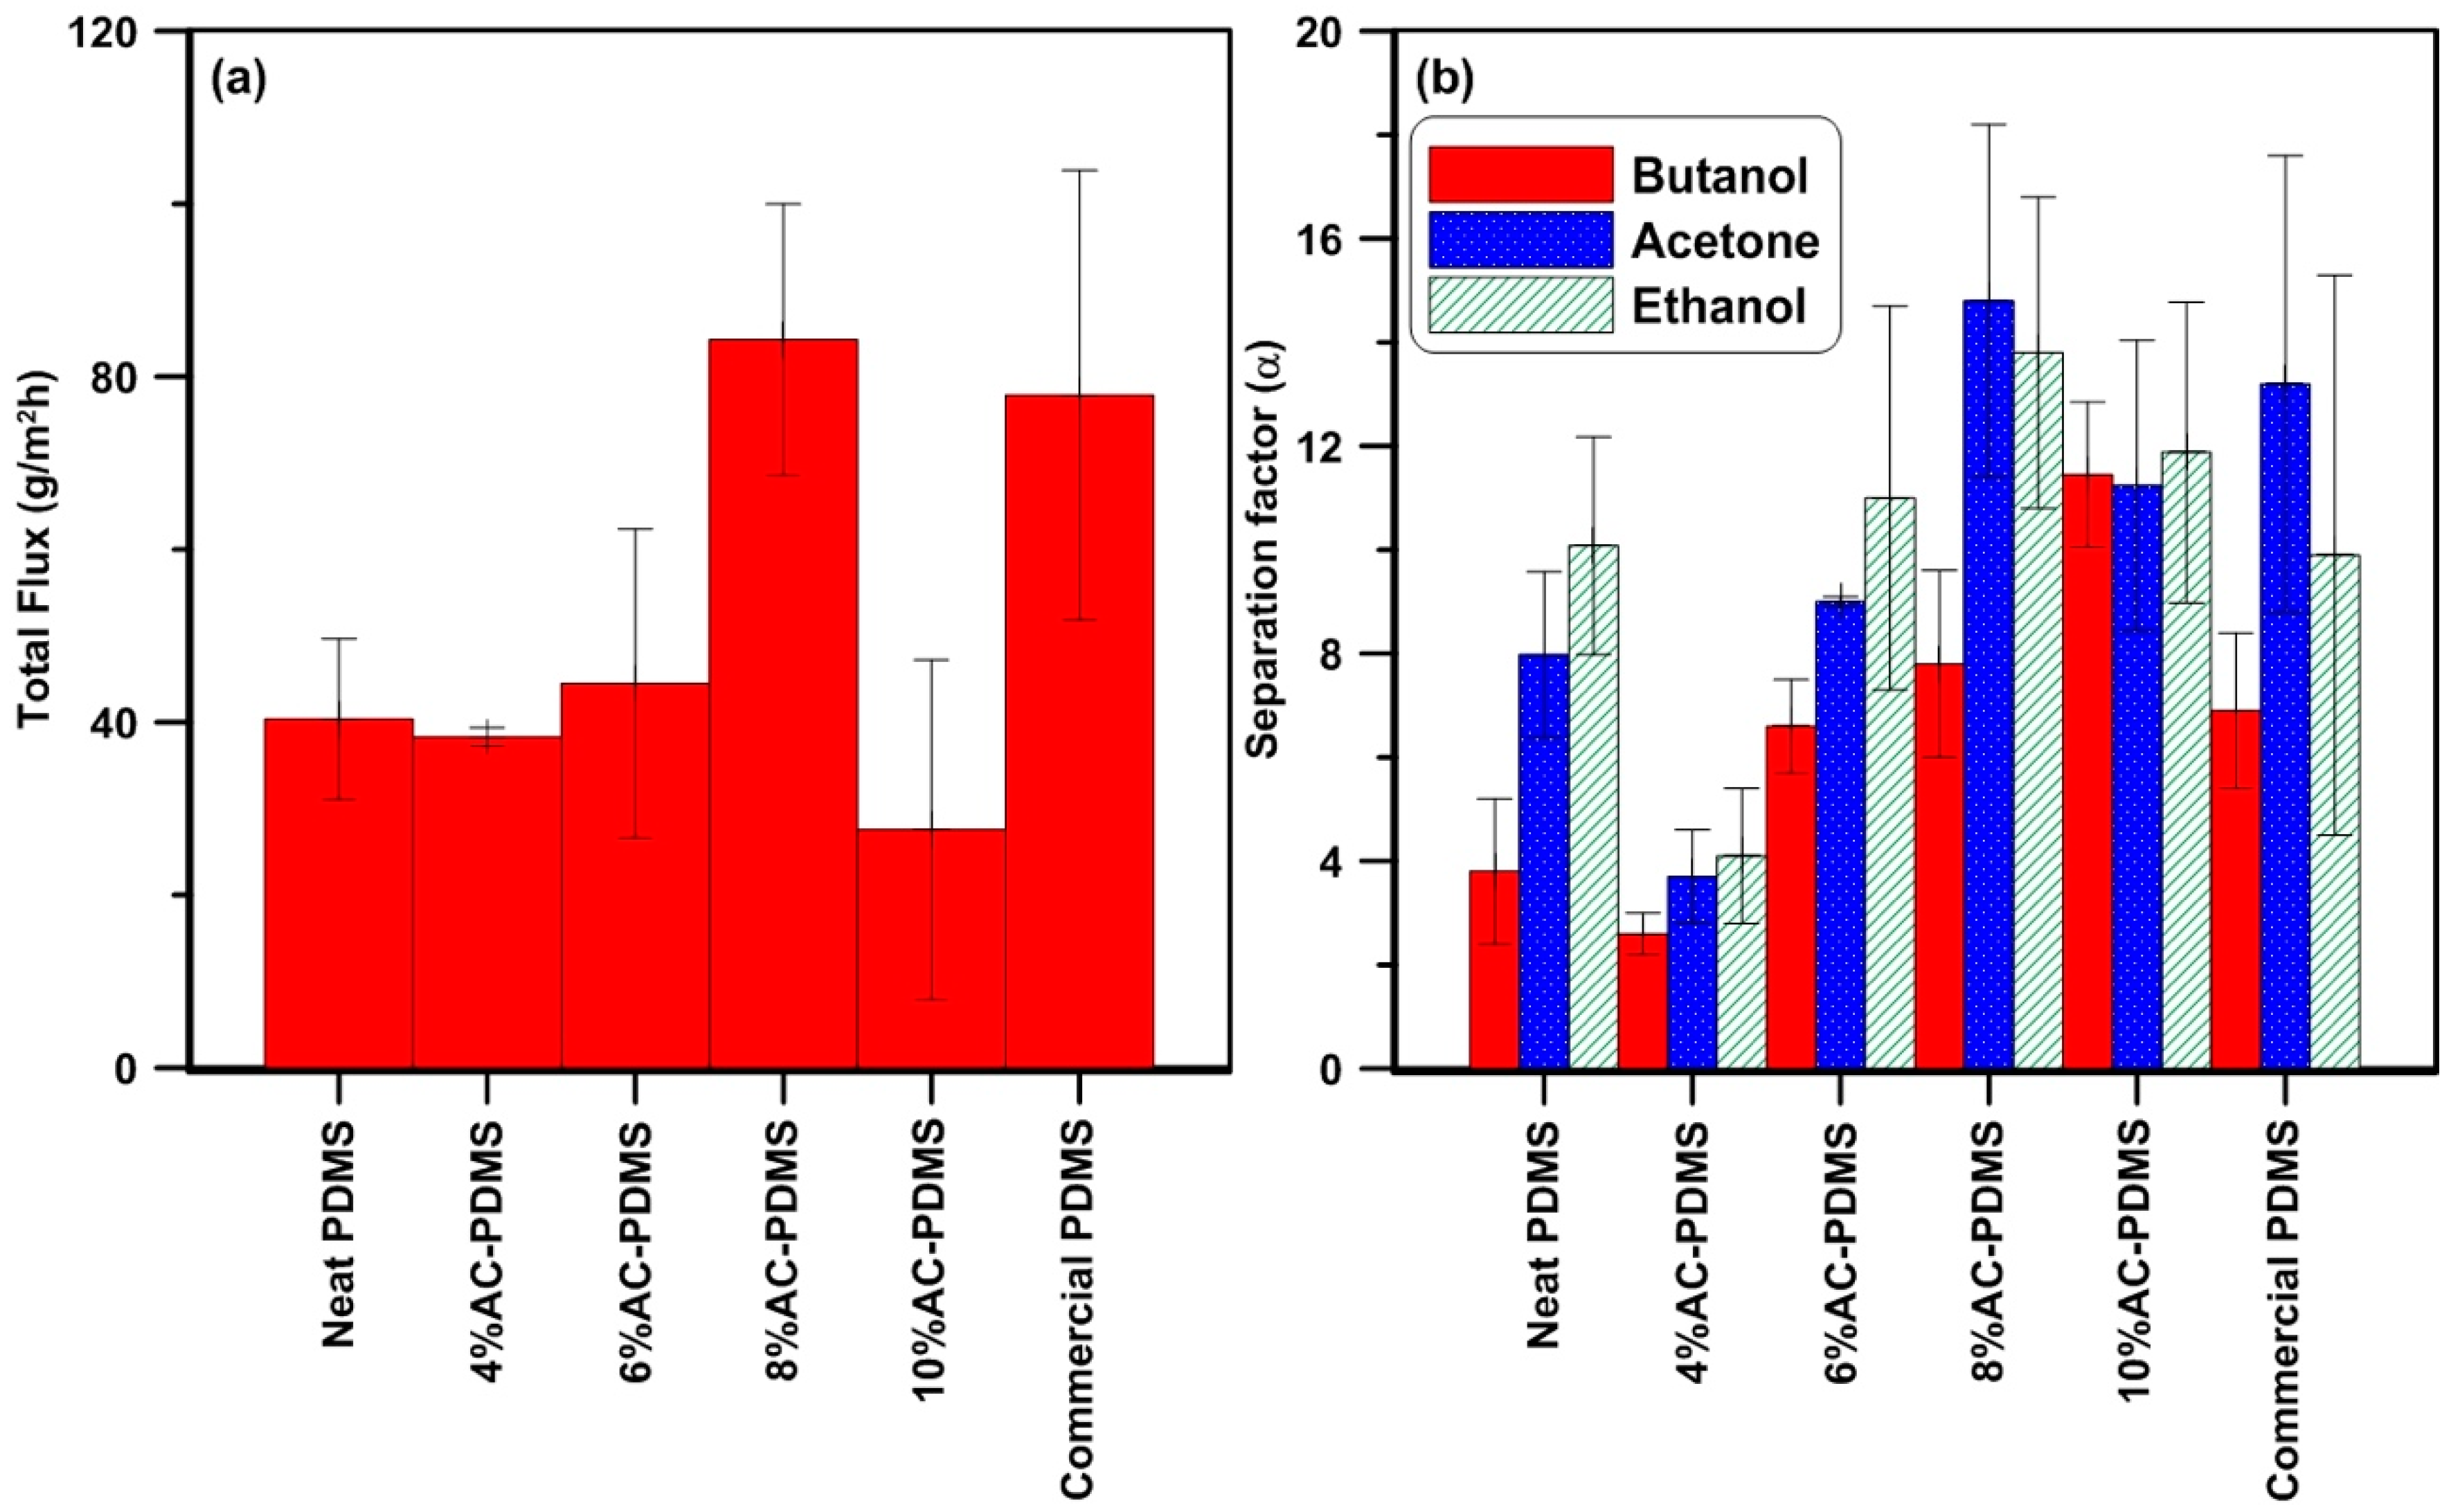
3.3. Effect of the Activated Carbon Nanoparticle Loading on the Membrane Performance
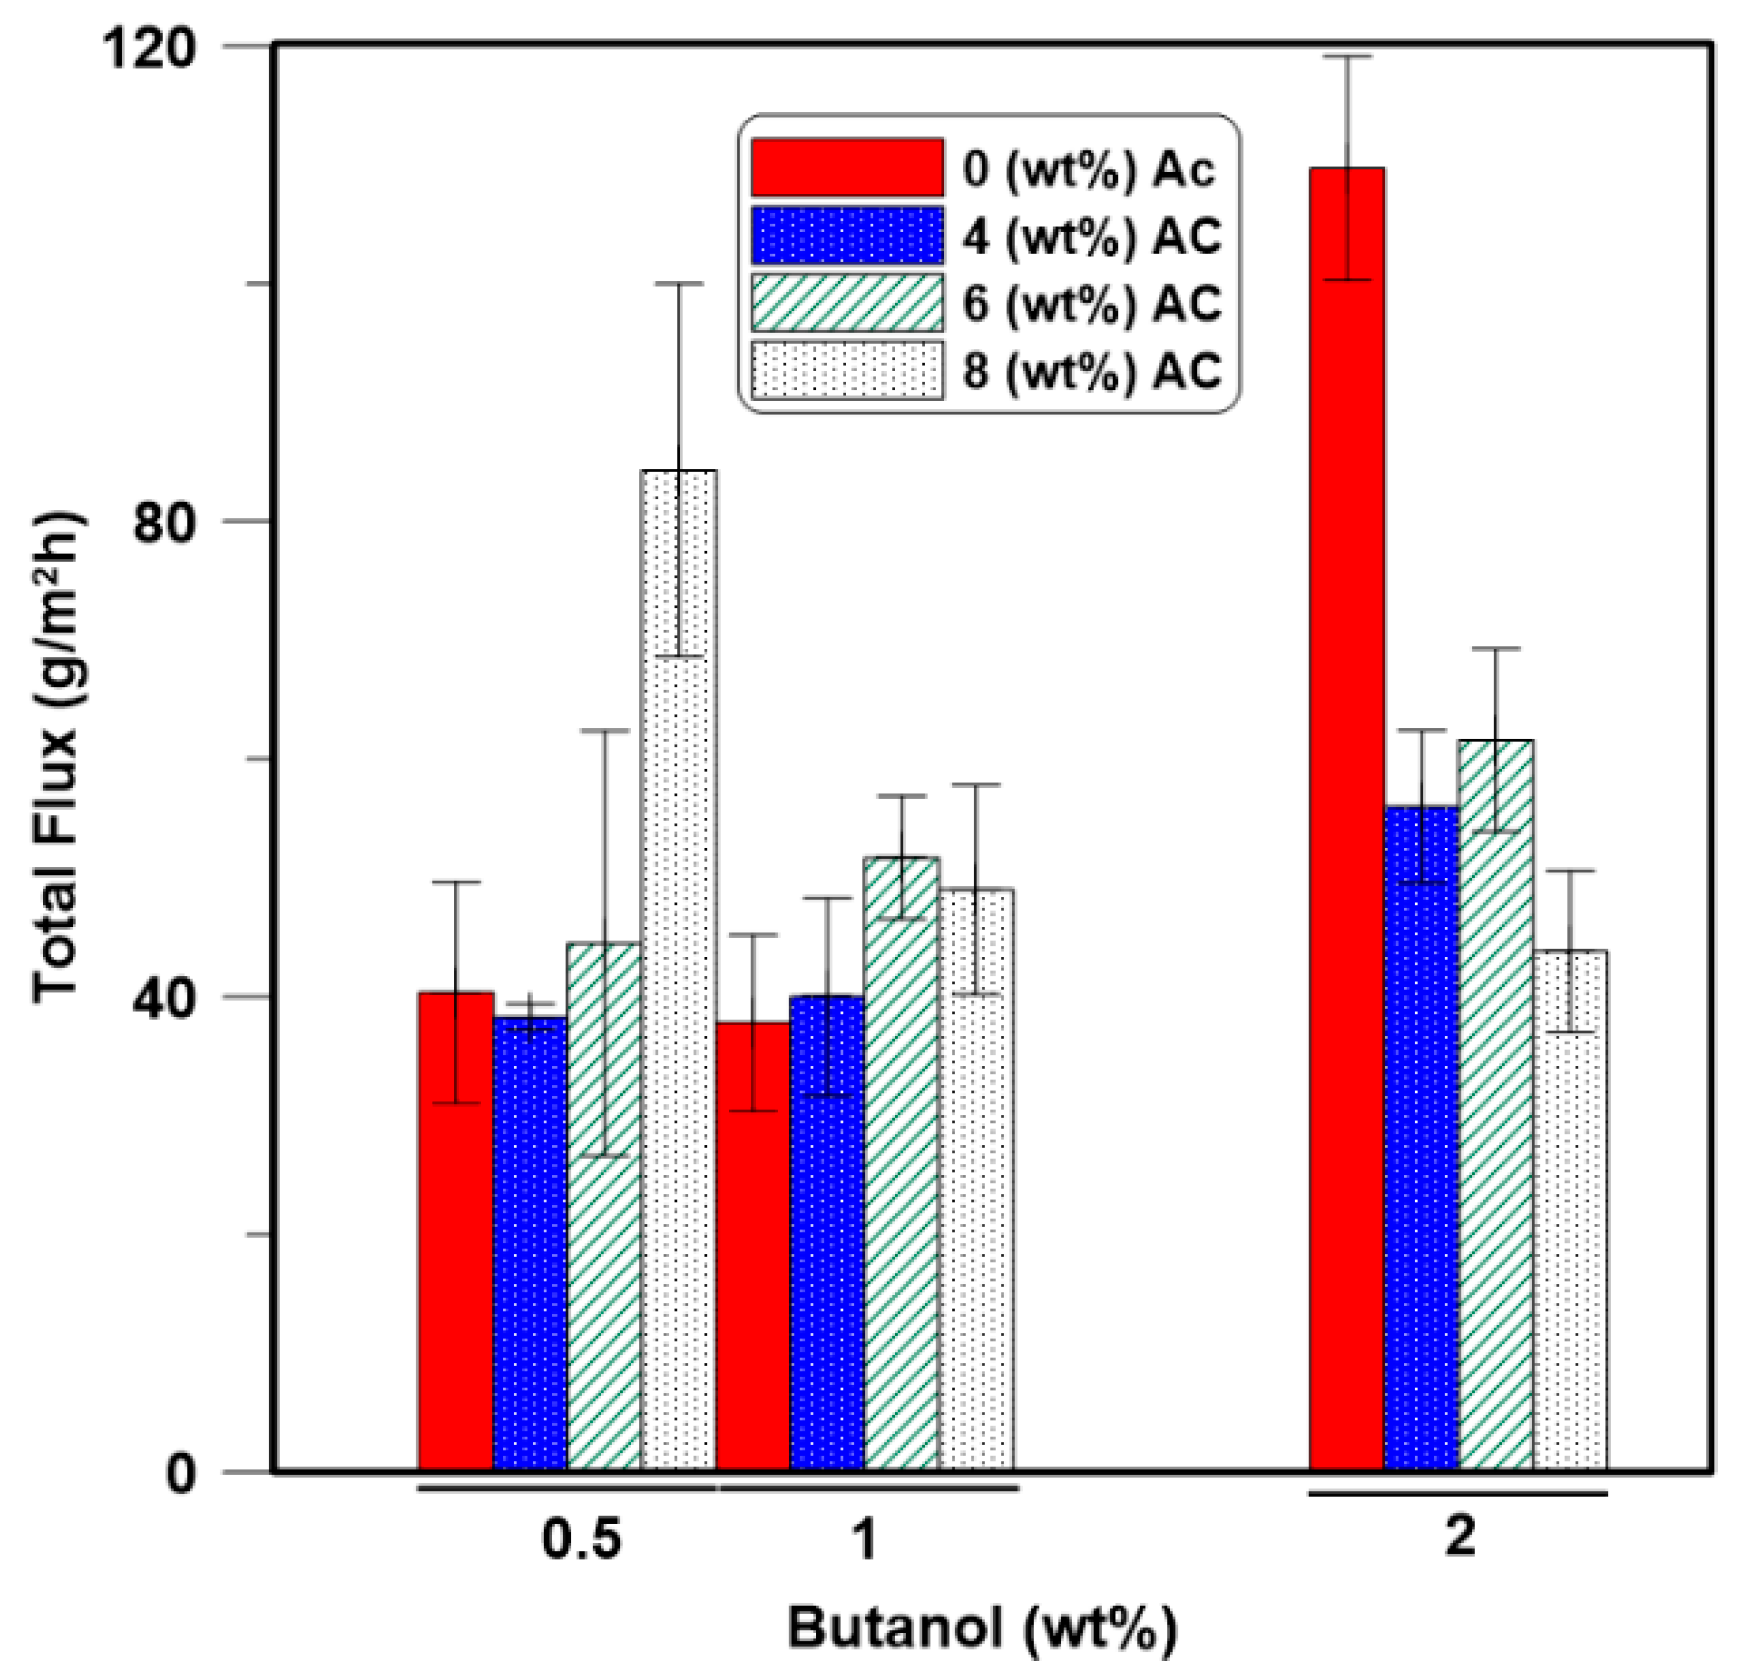
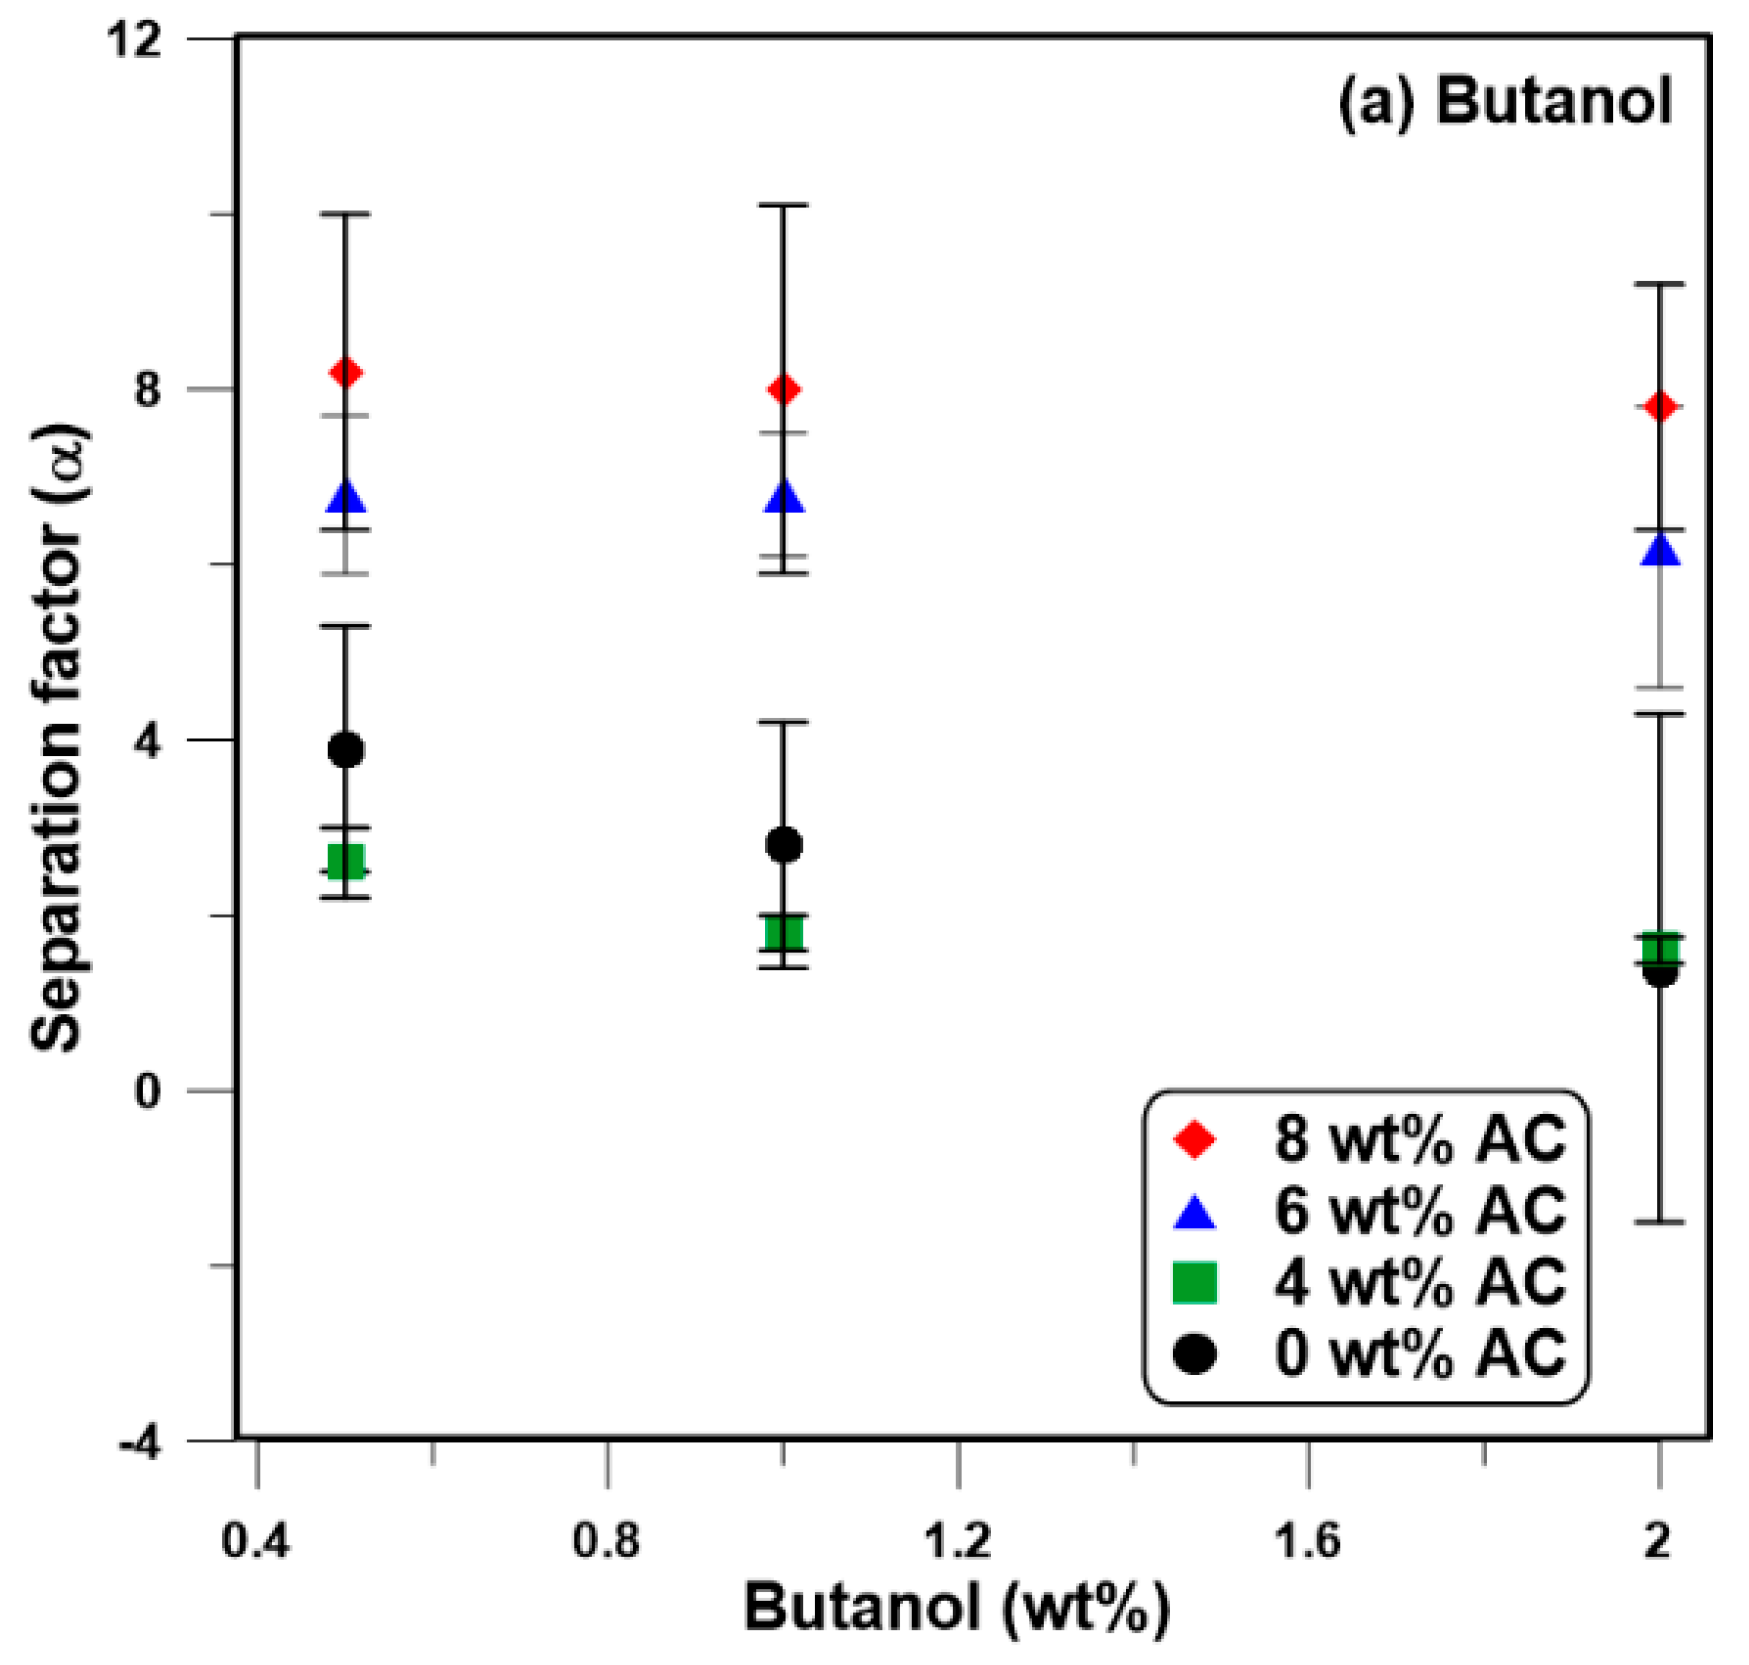
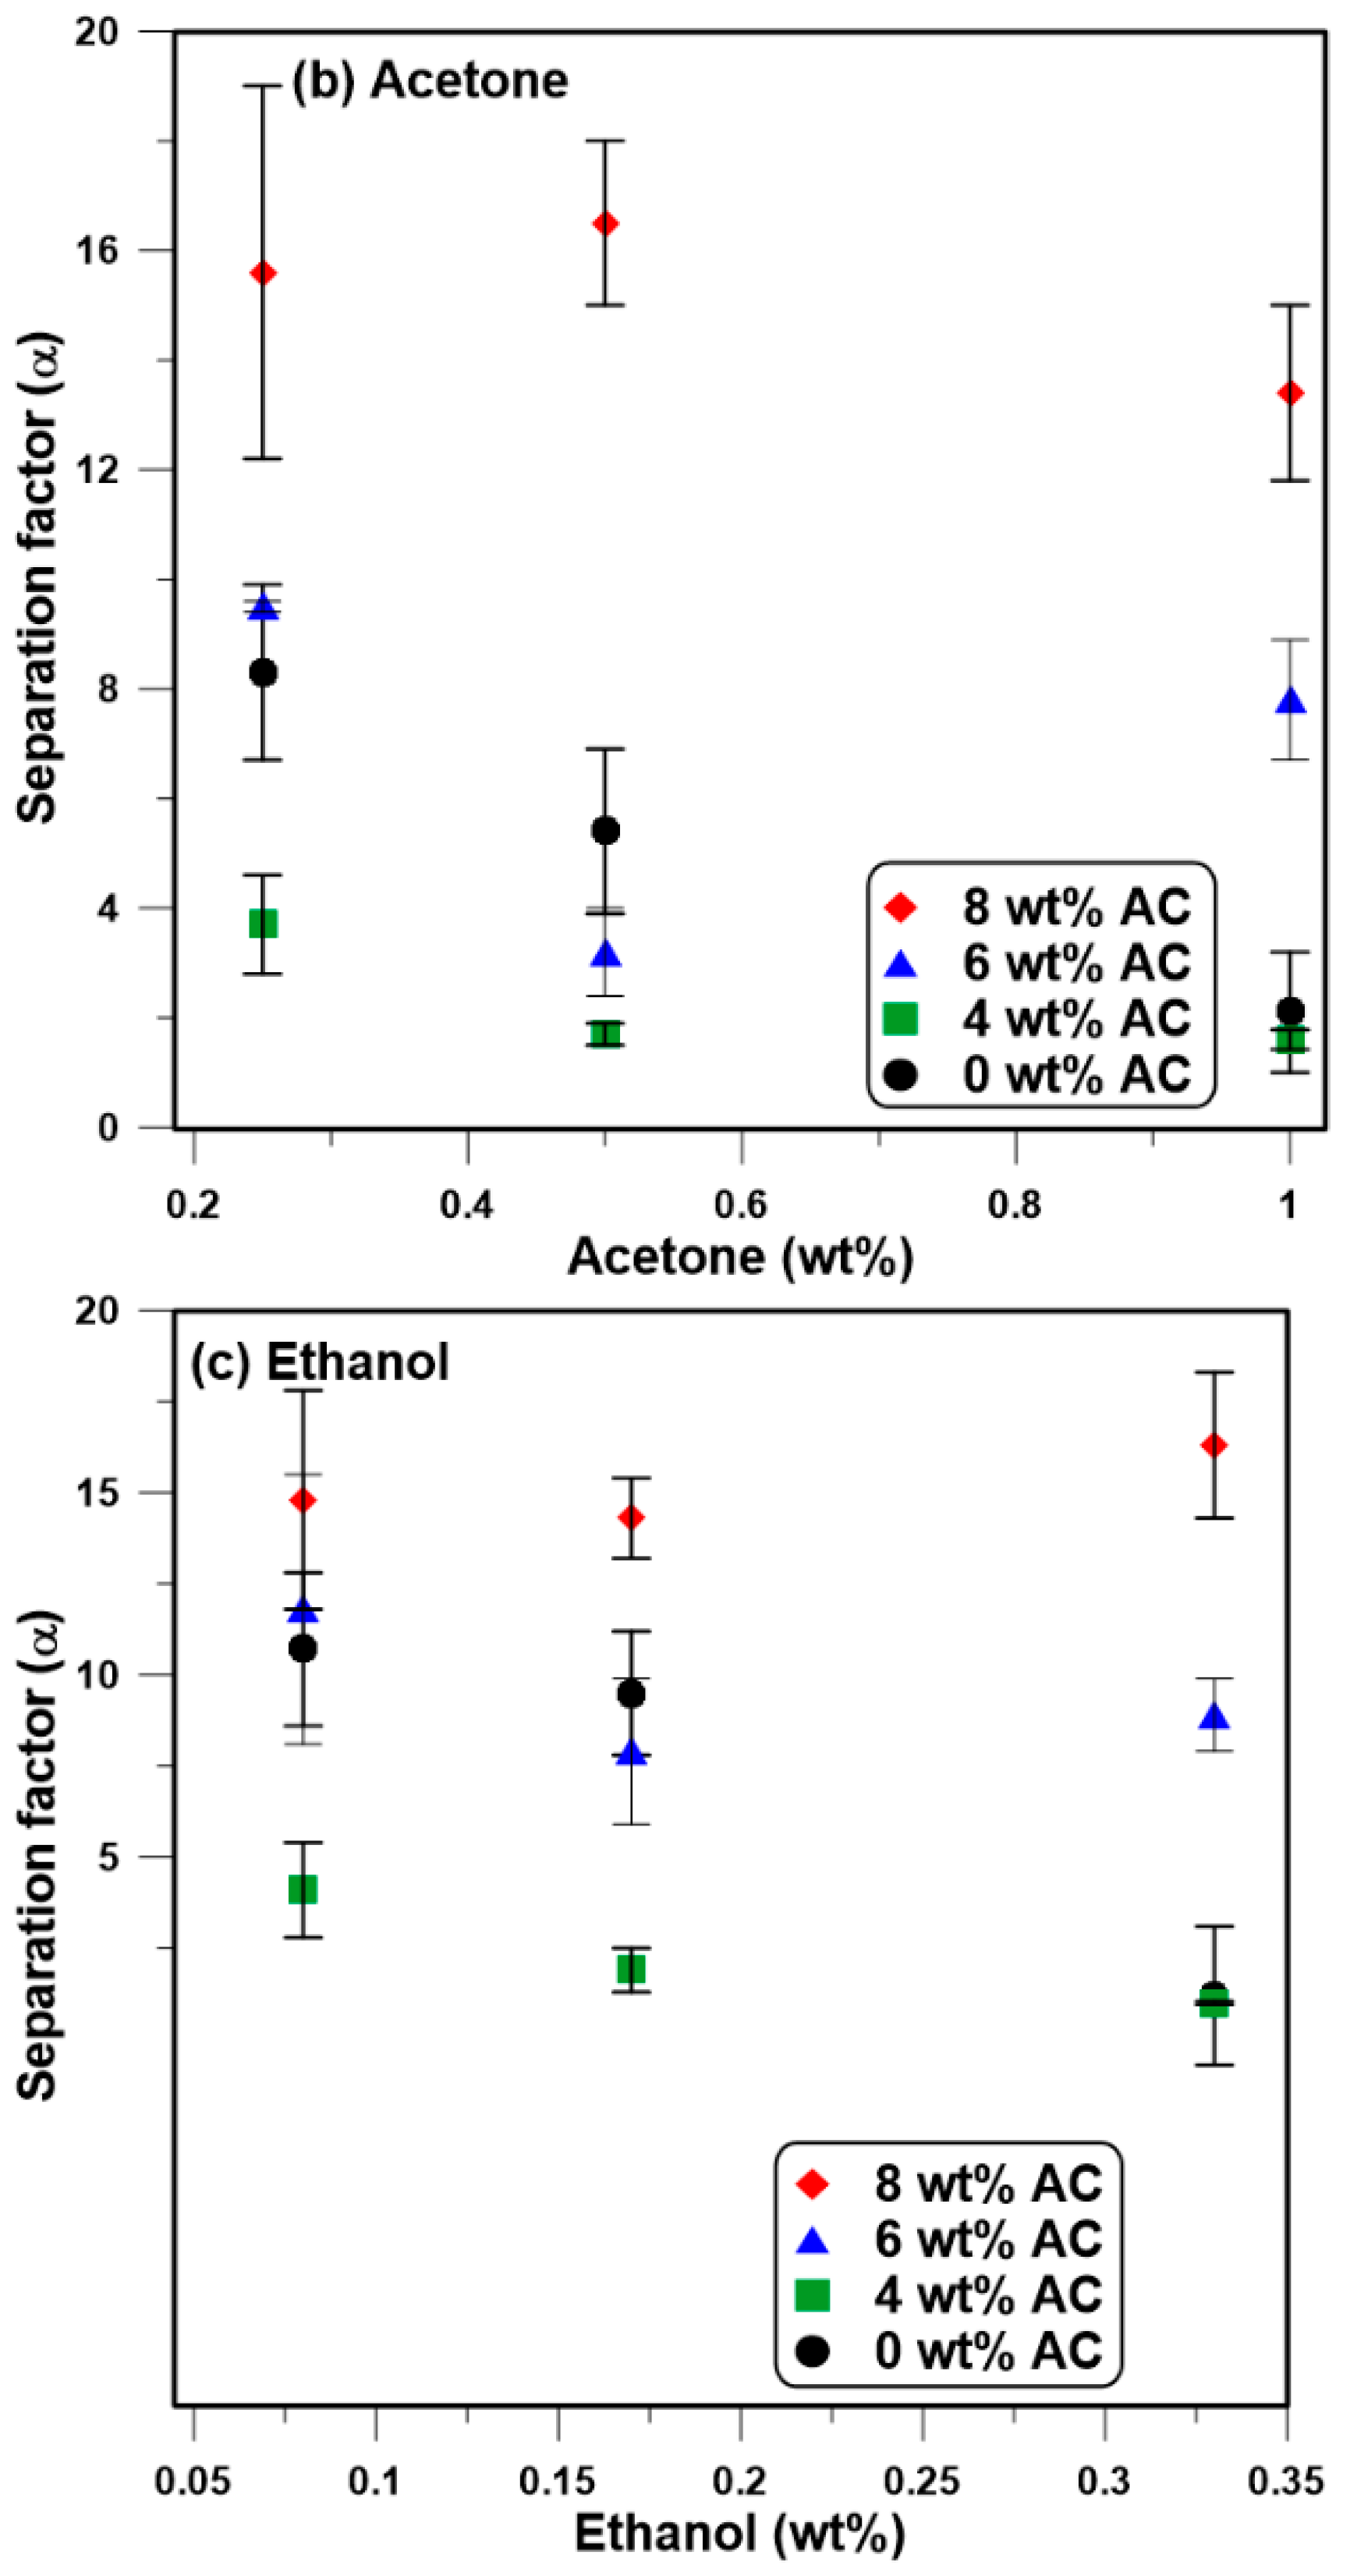
3.4. Effect of the Initial Feed Concentration
4. Conclusions
Author Contributions
Funding
Conflicts of Interest
Nomenclature
| A | Surface area of the membrane (m2) |
| DS | Degree of swelling (%) |
| Ea | Activation energy of permeation (kJ/mol) |
| J | Flux (g/m2 h) |
| J0 | Pre-exponential factor in the Arrhenius-type equation of the flux (g/m2 h) |
| m | Mass of the permeate stream (g) |
| R | Gas constant (kJ/kmol K) |
| t | Time of permeation (h) |
| T | Temperature (K) |
| wtAC% | Weight percent of the activated carbon nanoparticle in the membrane |
| WAC | Weight of the activated carbon nanoparticles (g) |
| Wd | Weight of the dry membrane (g) |
| WPDMS | Weight of the PDMS polymer (g) |
| Ws | Weight of the swelled membrane (g) |
| xi | Mass fraction of species i in the feed streams (g i/g solution) |
| yi | Mass fraction of species i in the permeate (g i/g solution) |
| xw | Mass fraction of water in the feed streams (g w/g solution) |
| yw | Mass fraction of water in the permeate (g w/g solution) |
| αi,w | Separation factor of species i |
| ΔPDMS,i | Solvent-PDMS membrane interaction (J1/2 m−3/2) |
Abbreviations
| ABE | Acetone, Butanol, Ethanol |
| AC | Activated Carbon |
| EPDM | Ethylene propylene diene rubber |
| GC | Gas Chromatography |
| MMM | Mixed matrix membrane |
| PAI | Polyamide-imide |
| PAN | Polyacrylonitrile |
| PDMS | Polydimethylsiloxane |
| PE | Polyethylene |
| PEBA | Polyether block-amide |
| PET | Polyethylene terephthalate |
| PI | Polyimide |
| PMS | Poly (methoxy siloxane) |
| PP | Polypropylene |
| PTFE | Polytetrafluoroethylene |
| SEM | Scanning Electron Microscope |
References
- Qureshi, N.; Blaschek, H.P. Butanol recovery from model solution/fermentation broth by pervaporation: Evaluation of membrane performance. Biomass Bioenergy 1999, 17, 175–184. [Google Scholar] [CrossRef]
- Bankar, S.B.; Survase, S.A.; Ojamo, H.; Granstrom, T. Biobutanol: The outlook of an academic and industrialist. RSC Adv. 2013, 3, 24734–24757. [Google Scholar] [CrossRef]
- Rom, A.; Friedl, A. Investigation of pervaporation performance of POMS membrane during separation of butanol from water and the effect of added acetone and ethanol. Sep. Purif. Technol. 2016, 170, 40–48. [Google Scholar] [CrossRef]
- Amiri, H.; Karimi, K. Autohydrolysis: A promising pretreatment for the improvement of acetone, butanol, and ethanol production from woody materials. Chem. Eng. Sci. 2015, 137, 722–729. [Google Scholar] [CrossRef]
- Abdehagh, N.; Tezel, F.H.; Thibault, J. Adsorbent screening for biobutanol separation by adsorption: Kinetics, isotherms and competitive effect of other compounds. Adsorption 2013, 19, 1263–1272. [Google Scholar] [CrossRef]
- Abdehagh, N.; Thibault, J.; Tezel, F.H. Separation techniques in butanol production: Challenges and developments. Biomass Bioenergy 2014, 60, 222–246. [Google Scholar] [CrossRef]
- Qureshi, N.; Blaschek, H.P. Recovery of butanol from fermentation broth by gas stripping. Renew. Energy 2001, 22, 557–564. [Google Scholar] [CrossRef]
- Vahdani, S.; Bayat, Z. Computational approaches to the predication of the octanol-water partition coefficient (LogPo/w). J. Chem. Pharm. Res. 2011, 3, 565–575. [Google Scholar]
- Mariano, A.P.; Keshtkar, M.J.; Atala, D.I.P.; Maugeri Filho, F.; Wolf Maciel, M.R.; Maciel Filho, R.; Stuart, P. Energy Requirements for Butanol Recovery Using the Flash Fermentation Technology. Energy Fuels 2011, 25, 2347–2355. [Google Scholar] [CrossRef]
- Fu, Y.-J.; Lai, C.-L.; Chen, J.T.; Liu, C.-T.; Huang, S.-H.; Huang, W.-S.; Hu, C.-C.; Lee, K.-R. Hydrophobic composite membranes for separating of water–alcohol mixture by pervaporation at high temperature. Chem. Eng. Sci. 2014, 111, 203–210. [Google Scholar] [CrossRef]
- Liu, G.; Wei, W.; Jin, W. Pervaporation Membranes for Biobutanol Production. ACS Sustain. Chem. Eng. 2014, 2, 546–560. [Google Scholar] [CrossRef]
- Essawy, H.; Tawfik, M.; El-Sabbagh, S.; El-Gendi, A.; El-Zanati, E.; Abdallah, H. Novel amphiphilic conetworks based on compatibilized NBR/SBR–montmorillonite nanovulcanizates as membranes for dehydrative pervaporation of water–butanol mixtures. Polym. Eng. Sci. 2014, 54, 1560–1570. [Google Scholar] [CrossRef]
- Jitesh, K.D.; Pangarkar, V.G.; Niranjan, K. Pervaporative stripping of acetone, butanol and ethanol to improve ABE fermentation. Bioseparation 2000, 9, 145–154. [Google Scholar] [CrossRef] [PubMed]
- Hu, M.; Gao, L.; Fu, W.; Liu, X.; Huang, F.; Luo, Y.; Huang, C. High-performance interpenetrating polymer network polyurethane pervaporation membranes for butanol recovery. J. Chem. Technol. Biotechnol. 2015, 90, 2195–2207. [Google Scholar] [CrossRef]
- Liu, F.; Liu, L.; Feng, X. Separation of acetone–butanol–ethanol (ABE) from dilute aqueous solutions by pervaporation. Sep. Purif. Technol. 2005, 42, 273–282. [Google Scholar] [CrossRef]
- Hickey, P.J.; Juricic, F.P.; Slater, C.S. The Effect of Process Parameters on the Pervaporation of Alcohols through Organophilic Membranes. Sep. Sci. Technol. 1992, 27, 843–861. [Google Scholar] [CrossRef]
- Azimi, H.; Tezel, F.H.; Thibault, J. Effect of embedded activated carbon nanoparticles on the performance of polydimethylsiloxane (PDMS) membrane for pervaporation separation of butanol. J. Chem. Technol. Biotechnol. 2017, 92, 2901–2911. [Google Scholar] [CrossRef]
- Borisov, I.L.; Malakhov, A.O.; Khotimsky, V.S.; Litvinova, E.G.; Finkelshtein, E.S.; Ushakov, N.V.; Volkov, V.V. Novel PTMSP-based membranes containing elastomeric fillers: Enhanced 1-butanol/water pervaporation selectivity and permeability. J. Membr. Sci. 2014, 466, 322–330. [Google Scholar] [CrossRef]
- Wang, Y.; Chung, T.S.; Wang, H. Polyamide–imide membranes with surface immobilized cyclodextrin for butanol isomer separation via pervaporation. AIChE J. 2011, 57, 1470–1484. [Google Scholar] [CrossRef]
- Zhou, H.; Su, Y.; Chen, X.; Wan, Y. Separation of acetone, butanol and ethanol (ABE) from dilute aqueous solutions by silicalite-1/PDMS hybrid pervaporation membranes. Sep. Purif. Technol. 2011, 79, 375–384. [Google Scholar] [CrossRef]
- Li, S.; Qin, F.; Qin, P.; Karim, M.N.; Tan, T. Preparation of PDMS membrane using water as solvent for pervaporation separation of butanol-water mixture. Green Chem. 2013, 15, 2180–2190. [Google Scholar] [CrossRef]
- Li, S.-Y.; Srivastava, R.; Parnas, R.S. Separation of 1-butanol by pervaporation using a novel tri-layer PDMS composite membrane. J. Membr. Sci. 2010, 363, 287–294. [Google Scholar] [CrossRef]
- Mai, N.L.; Kim, S.H.; Ha, S.H.; Shin, H.S.; Koo, Y.-M. Selective recovery of acetone-butanol-ethanol from aqueous mixture by pervaporation using immobilized ionic liquid polydimethylsiloxane membrane. Korean J. Chem. Eng. 2013, 30, 1804–1809. [Google Scholar] [CrossRef]
- Huang, J.; Meagher, M.M. Pervaporative recovery of n-butanol from aqueous solutions and ABE fermentation broth using thin-film silicalite-filled silicone composite membranes. J. Membr. Sci. 2001, 192, 231–242. [Google Scholar] [CrossRef]
- Xue, C.; Du, G.-Q.; Chen, L.-J.; Ren, J.-G.; Sun, J.-X.; Bai, F.-W.; Yang, S.-T. A carbon nanotube filled polydimethylsiloxane hybrid membrane for enhanced butanol recovery. Sci. Rep. 2014, 4, 5925. [Google Scholar] [CrossRef] [PubMed]
- Qureshi, N.; Hughes, S.; Maddox, I.S.; Cotta, M.A. Energy-efficient recovery of butanol from model solutions and fermentation broth by adsorption. Bioprocess Biosyst. Eng. 2005, 27, 215–222. [Google Scholar] [CrossRef] [PubMed]
- Martinelli, E.; Suffredini, M.; Galli, G.; Glisenti, A.; Pettitt, M.E.; Callow, M.E.; Callow, J.A.; Williams, D.; Lyall, G. Amphiphilic block copolymer/poly(dimethylsiloxane) (PDMS) blends and nanocomposites for improved fouling-release. Biofouling 2011, 27, 529–541. [Google Scholar] [CrossRef] [PubMed] [Green Version]
- Chen, D.; Chen, F.; Hu, X.; Zhang, H.; Yin, X.; Zhou, Y. Thermal stability, mechanical and optical properties of novel addition cured PDMS composites with nano-silica sol and MQ silicone resin. Compos. Sci. Technol. 2015, 117, 307–314. [Google Scholar] [CrossRef]
- Patterson, D.A.; Havill, A.; Costello, S.; See-Toh, Y.H.; Livingston, A.G.; Turner, A. Membrane characterisation by SEM, TEM and ESEM: The implications of dry and wetted microstructure on mass transfer through integrally skinned polyimide nanofiltration membranes. Sep. Purif. Technol. 2009, 66, 90–97. [Google Scholar] [CrossRef]
- Liu, G.; Zhou, T.; Liu, W.; Hu, S.; Pan, F.; Wu, H.; Jiang, Z.; Wang, B.; Yang, J.; Cao, X. Enhanced desulfurization performance of PDMS membranes by incorporating silver decorated dopamine nanoparticles. J. Mater. Chem. 2014, 2, 12907–12917. [Google Scholar] [CrossRef]
- Tan, H.; Wu, Y.; Li, T. Pervaporation of n-butanol aqueous solution through ZSM-5-PEBA composite membranes. J. Appl. Polym. Sci. 2013, 129, 105–112. [Google Scholar] [CrossRef]
- Lan, Y.; Yan, N.; Wang, W. Application of PDMS pervaporation membranes filled with tree bark biochar for ethanol/water separation. RSC Adv. 2016, 6, 47637–47645. [Google Scholar] [CrossRef]
- Niemisto, J.; Kujawski, W.; Keiski, R.L. Pervaporation performance of composite poly(dimethyl siloxane) membrane for butanol recovery from model solutions. J. Membr. Sci. 2013, 434, 55–64. [Google Scholar] [CrossRef]
- Abdehagh, N.; Gurnani, P.; Tezel, F.H.; Thibault, J. Adsorptive separation and recovery of biobutanol from ABE model solutions. Adsorption 2015, 21, 185–194. [Google Scholar] [CrossRef]
- Wahab, M.F.A.; Rahim, R.A.; Ismail, A.F. Latest Development of Mixed Matrix Membrane Using Glassy Polymer as Continuous Phase for Gas Separation. Available online: http://citeseerx.ist.psu.edu/viewdoc/download?doi=10.1.1.618.8454&rep=rep1&type=pdf (accessed on 7 July 2018).
- Fouad, E.A.; Feng, X. Pervaporative separation of n-butanol from dilute aqueous solutions using silicalite-filled poly(dimethyl siloxane) membranes. J. Membr. Sci. 2009, 339, 120–125. [Google Scholar] [CrossRef]


| Solvent-Membrane Interaction | Acetone | Butanol | Ethanol | Water |
|---|---|---|---|---|
| ΔPDMS,i (J1/2 m−3/2) | 10.6 | 12.4 | 17.1 | 40.9 |
© 2018 by the authors. Licensee MDPI, Basel, Switzerland. This article is an open access article distributed under the terms and conditions of the Creative Commons Attribution (CC BY) license (http://creativecommons.org/licenses/by/4.0/).
Share and Cite
Azimi, H.; Ebneyamini, A.; Tezel, F.H.; Thibault, J. Separation of Organic Compounds from ABE Model Solutions via Pervaporation Using Activated Carbon/PDMS Mixed Matrix Membranes. Membranes 2018, 8, 40. https://doi.org/10.3390/membranes8030040
Azimi H, Ebneyamini A, Tezel FH, Thibault J. Separation of Organic Compounds from ABE Model Solutions via Pervaporation Using Activated Carbon/PDMS Mixed Matrix Membranes. Membranes. 2018; 8(3):40. https://doi.org/10.3390/membranes8030040
Chicago/Turabian StyleAzimi, Hoda, Arian Ebneyamini, Fatma Handan Tezel, and Jules Thibault. 2018. "Separation of Organic Compounds from ABE Model Solutions via Pervaporation Using Activated Carbon/PDMS Mixed Matrix Membranes" Membranes 8, no. 3: 40. https://doi.org/10.3390/membranes8030040