Article

Implementation of Spiegler–Kedem and Steric Hindrance Pore Models for Analyzing Nanofiltration Membrane Performance for Smart Water Production

1
Department of Chemistry, Bioscience and Environmental Engineering, University of Stavanger, Kjell Arholmsgate 41, 4036 Stavanger, Norway
2
Department of Energy and Petroleum Engineering, University of Stavanger, Kjell Arholmsgate 41, 4036 Stavanger, Norway
*
Author to whom correspondence should be addressed.
Membranes 2018, 8(3), 78; https://doi.org/10.3390/membranes8030078
Submission received: 8 August 2018 / Revised: 27 August 2018 / Accepted: 31 August 2018 / Published: 6 September 2018
(This article belongs to the Special Issue Mass Transfer in Membranes)

Abstract

:
A predictive model correlating the parameters in the mass transfer-based model Spiegler–Kedem to the pure water permeability is presented in this research, which helps to select porous polyamide membranes for enhanced oil recovery (EOR) applications. Using the experimentally obtained values of flux and rejection, the reflection coefficient σ and solute permeability Ps have been estimated as the mass transfer-based model parameters for individual ions in seawater. The reflection coefficient and solute permeability determined were correlated with the pure water permeability of a membrane, which is related to the structural parameters of a membrane. The novelty of this research is the development of a model that consolidates the various complex mechanisms in the mass transfer of ions through the membrane to an empirical correlation for a given feed concentration and membrane type. These correlations were later used to predict ion rejections of any polyamide membrane with a known pure water permeability and flux with seawater as a feed that aids in the selection of suitable nanofiltration (NF) for smart water production.

Graphical Abstract

1. Introduction

Nanofiltration (NF) membranes are pressure driven and selectively separate ions from mixed electrolyte solutes with low energy requirements compared to other desalination technologies. Smart water can be produced by modifying the ionic composition of seawater [1]. Smart water for EOR in carbonate and sandstone reservoirs require different ionic compositions depending on reservoir properties. Divalent ion-rich brine is required for carbonates, whereas a salinity of less than 5000 ppm is preferred for sandstones [1]. Production of smart water from seawater using membranes and the resulting power consumption was discussed in detail in our previous research [2]. However, selection of suitable membranes for smart water production is an extensive process. Thus, predicting membrane ion rejection limited to a couple of steps will avoid intensive membrane experiments.
Application of mathematical models to predict NF membrane performance for selective ion rejection is important for the optimal design and operation of NF membranes for smart water production. However, most modeling studies to date have considered only very dilute solutions and typically containing two or three types of ions. Modeling of concentrated solutions with multi-feed ions, such as seawater, predicts NF performance realistically with regard to industrial applications.
Spiegler–Kedem is a mass transfer-based model that relates flux to the concentration difference of a solute for a given membrane and solvent properties. The experimental data of flux versus rejection for individual ions for different membranes is used to validate a model. The model is developed using the estimated equation parameters or transport parameters in the Spiegler–Kedem model and is correlated to the structural parameters of a membrane using a steric hindrance pore model. This approach simplifies membrane performance prediction for a given feed ionic composition and provides a consolidated approach to various interacting phenomena that are difficult to define mathematically for mass transport. For the correlations predicted in this research, the model fitting is carried out for a given feed concentration with a certain membrane type (polyamide) so that active mechanisms for all the membranes are similar and can be easily understood. The proposed correlations can be used for predicting ion rejection, thereby aiding the selection of suitable NF membranes for smart water production administered to both carbonate and sandstone reservoirs.
The principal objective of this research is to develop a predictive model to quantify the selectivity of porous polyamide membranes with high feed concentrations for smart water production. To develop such a model, membrane transport parameters and effective pore size were determined using the Spiegler–Kedem model and a steric-hindrance pore model.

2. Theory

2.1. Nanofiltration Membranes

NF membranes permit preferential transport of ions. Separation processes are differentiated based on membrane pore sizes. NF membranes have pore sizes between 0.1 and 1 nm [3] with a molecular weight cut off (MWCO) of 100–5000 Da [4]. Mass transfer through NF includes convection and solution-diffusion [5]. NF selectively separates divalent and monovalent ions. This is mainly due to the strong dependence on the operating parameters, pressure, and feed concentrations, and on the membrane structural parameters such as pore radius and the ratio of membrane porosity to membrane thickness, Ak/Δx. The separation mechanisms also depend on the hydrophilic/hydrophobic characteristics of the membrane [6].
The performance of the membranes is generally measured in terms of rejection R and flux Jv. Rejection is a measure of the membrane’s ability to reject a solute. Membrane rejection is calculated using Equation (1).
R = ( 1 C p C f )
where Cp and Cf are the permeate and feed concentrations, respectively.
Flux Jv (Lm−2 h−1) is calculated using Equation (2)
J v = V t × A
where V is the volume of the permeate collected in a given time interval t, and A is the membrane area.

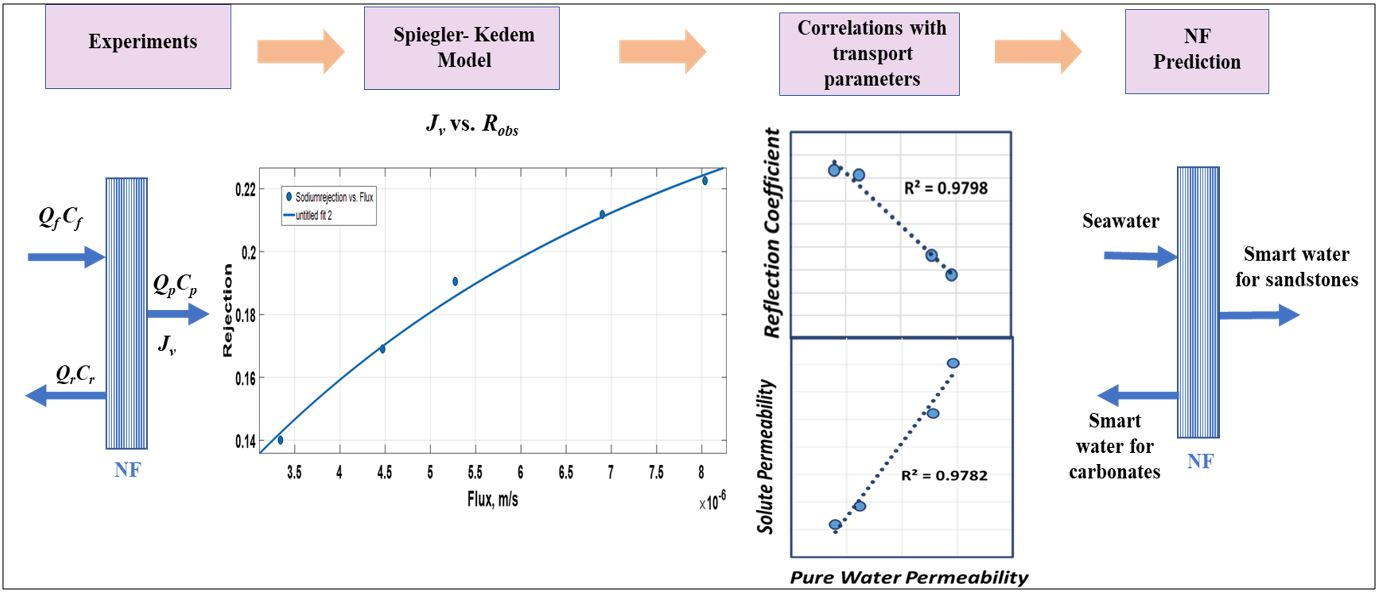
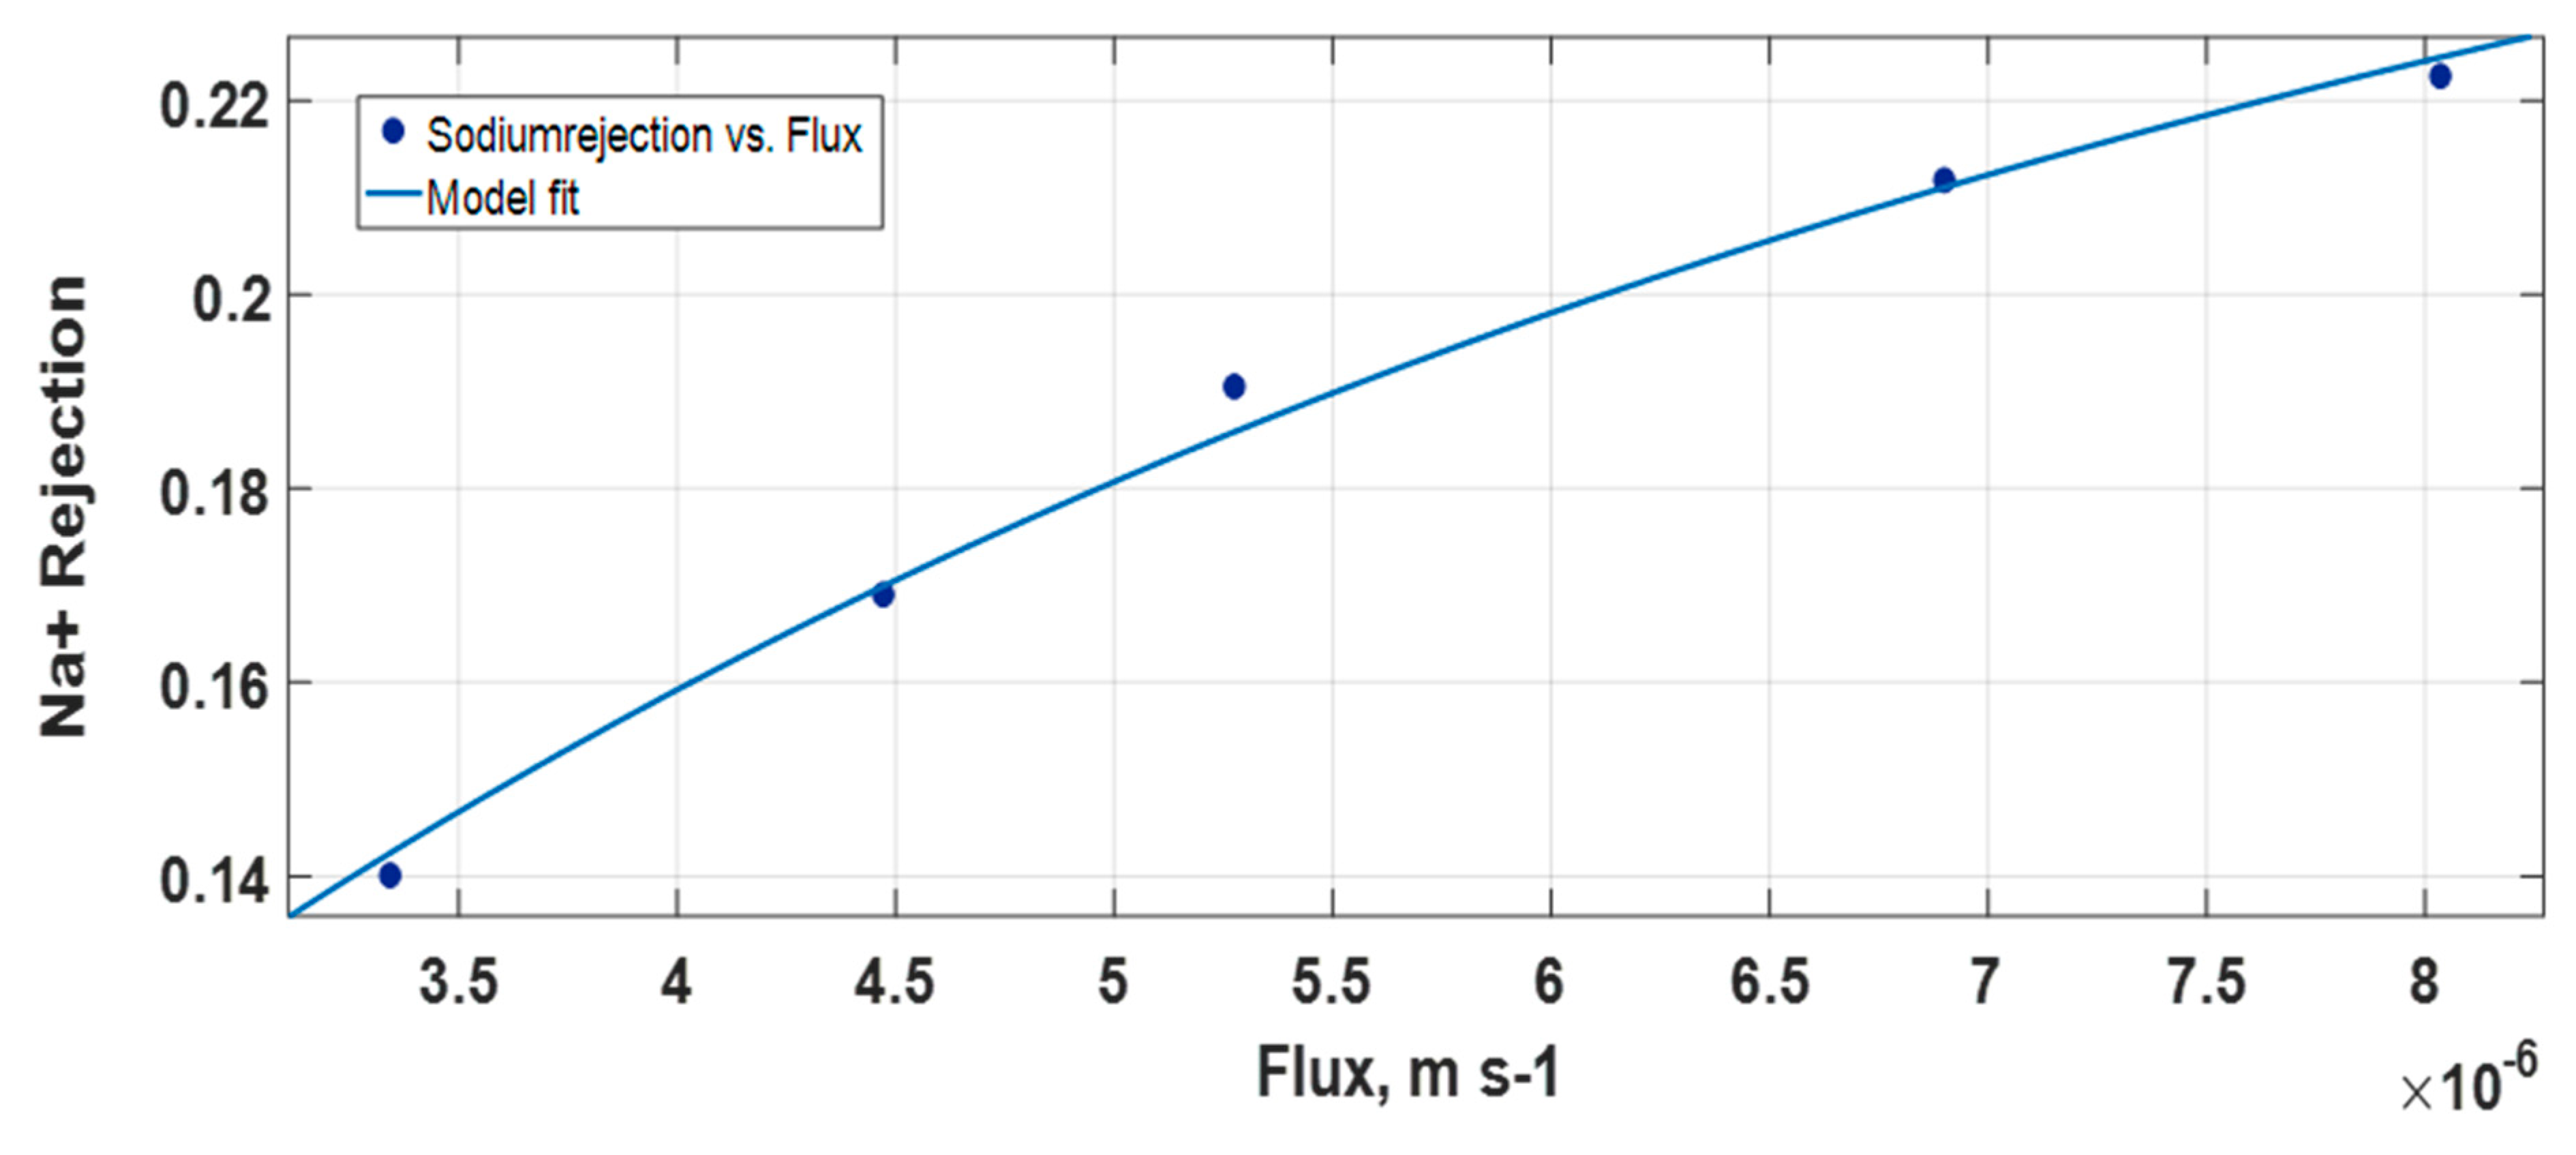
2.2. Spiegler–Kedem Model

Transport of solutes through a charged membrane can be described using the principles of non-equilibrium thermodynamics where the membrane is considered a black box. This approach allows the membranes to be characterized in terms of only the reflection coefficient σ and solute permeability Ps. In a two-component system consisting of solute and water with flux Jv, the solute flux Js is related by three membrane coefficients [7]:
  • The hydraulic permeability Lp.
  • The solute permeability Ps.
  • The reflection coefficient σ.
The relation between Jv and Js and the membrane coefficients is given by Equations (3) and (4) as introduced by Kedem and Katchalsky [8].
J V = L p ( Δ Ρ σ Δ π )
J s = P s Δ C s + ( 1 σ ) J v   C m
where ΔCs = CmCp, and Cm is the solute concentration at the membrane surface. ΔP is the pressure difference between the feed and permeate, and Δπ is the osmotic pressure difference of the two fluids. According to Equation (4), the solute flux is the sum of diffusive and convective terms. Transport of the solute by convection is due to an applied pressure gradient across the membrane. The concentration difference on the membrane side and the permeate results in transport by diffusion.
When a high concentration difference exists between the retentate and the permeate, the Spiegler–Kedem model can be used [5], as in this research. The solute permeability coefficient Ps and reflection coefficient σ can be obtained by fitting experimental values of solute rejection versus flux, according to the Spiegler–Kedem model as represented by Equations (5) and (6).
R obs = σ   ( 1 F ) 1 σ F
where
F = exp   ( 1 σ P s J v )
F is a dimensionless parameter that depends on the reflection coefficient, solvent flux, and solute permeability coefficient. The reflection coefficient represents the rejection capability of a membrane. No rejection occurs when σ = 0 and 100% rejection occur when σ = 1 [9]. Also, σ can be considered to represent the maximum rejection at an infinite volume flux.
Permeability can be defined as the flux of a solute or solvent through the membrane per unit driving force. Ps is the overall solute permeability coefficient.
The Spiegler–Kedem model is based on irreversible thermodynamics to describe transport when the membrane structure and transport mechanism within the membrane is not fully understood [10]. The Spiegler–Kedem model is generally applied when there are no electrostatic interactions between the solute and the membrane such as when the membrane is uncharged or when the solute is neutral. NF membranes are mostly negatively or positively charged. Many authors have used this model with charged NF membranes [6,11] and suggested that σ and Ps depend on the effective membrane charge and concentration of the feed solution. The effect of membrane charge is, however, neglected in this research for analyzing membrane performance at high feed concentrations.
The following assumptions were made while using the Spiegler–Kedem model in this research:
(1)
The driving forces are pressure and concentration gradients.
(2)
The model predicts the transport of the solute and solvent through the membrane irrespective of the type of solute, charge, solvent, and membrane.
(3)
Membrane fouling and membrane sensitivity towards chemicals such as chlorine, effects of temperature, and pH are not considered.

2.3. Steric Hindrance Pore Model (SHP)

Structural parameters of the membranes were estimated using the SHP model developed by Nakao and Kimura [12] for the separation of aqueous solutions of a single organic solute by ultrafiltration membranes and was later successfully used for NF membranes by researchers such as Wang et al. [13]. According to the model, transport of spherical ions through cylindrical pores hindered by frictional forces and the steric effect are considered. Following this model, the membrane parameters σ and Ps are given as
σ = 1 S F   { 1 + ( 16 9 ) q 2 }
P s = D × S D ( A k Δ x )
where
S D = ( 1 q ) 2
S F = 2 ( 1 q ) 2 ( 1 q ) 4
and
q = r s r p
where SD and SF are the steric hindrance factors for diffusion and convection respectively. D is diffusivity, Akx is the ratio of membrane porosity to membrane thickness, rs is the Stokes radius of the solute, and rp is the pore radius. The Stokes radii used for calculations [14,15] are presented in Table 1.
The stability of membranes is usually tested to assure the reliability of the experiments. This is mainly performed by measuring the pure water permeability (Lp = JvP) of the membranes. The pure water permeability Lp is also expressed by Hagen–Poiseuille in the pore model and is defined as
L P = r p 2 ( A k Δ x ) / 8 µ
where µ is the viscosity.

3. Experimental Methods

Experiments were performed with a lab-scale membrane unit consisting of low-pressure and high-pressure pumps, a pressure valve, a pressure gauge, and two prefilters with 20 µ and 5 µ pore size as pre-treatment units upstream of the NF. One membrane is operated at a time and the retentate and permeate were recirculated to a 100 L feed tank to retain identical feed concentrations. The experiments were performed at room temperature with pure water and seawater. The applied pressure across the membranes ranged from 9 bar to 18 bar. Three trials were performed for each membrane with both pure water and seawater as feed. Pre-filtered seawater used for membrane experiments had total dissolved solids (TDS) of 30,400 mg/L, conductivity of 47.5 mS/cm, and pH at 7.9.
Prior to the experiments, the membranes were washed with pure water to remove any membrane preservatives. Eight different membranes with spiral wound configurations from two manufacturers (Nitto Hydranautics, Oceanside, CA, USA and Dow Filmtec, Oceanside, CA, USA) were used for the experiments and the membrane characteristics are provided in Table 2. NF 270 and SR 90 were from Dow Filmtec while all other six membranes were from Nitto Hydranautics. These commercially available membranes were negatively charged since their surface layers were made of polyamide or sulfonated polysulphone.
Individual ion concentrations in the feed, permeate, and retentate was measured using ion chromatography (DionexTM ICS-5000+ DP, from Thermo Fisher Scientific, Waltham, MA, USA). TDS and conductivity were measured using a TDS meter VWR collection CO3100N and pH by VWR Phenomenal pH 1100 L (both from VWR International Limited, Leicestershire, UK)
All membranes, except for HYDRApro 501, had a maximum operating temperature of 45 °C. For HYDRApro 501, the operating temperature was pressure dependent: 41 bar at 65 °C and 14 bar at 90 °C. Maximum operating pressure for the rest of the membranes ranged from 41–41.6 bar according to the manufacturers.
Pure water permeability (Lp) was experimentally determined by plotting flux Jv versus transmembrane pressure ΔP and is represented by Lm−2 h−1 bar−1. The slope corresponding to each linear line determined the pure water permeability [10]. The hydraulic properties of the studied membranes were analyzed by measuring water flux as a function of pressure. Membrane water permeability was evaluated after achieving a steady-state condition with stable flux after operating the membranes for about 30 min.

4. Results and Discussion

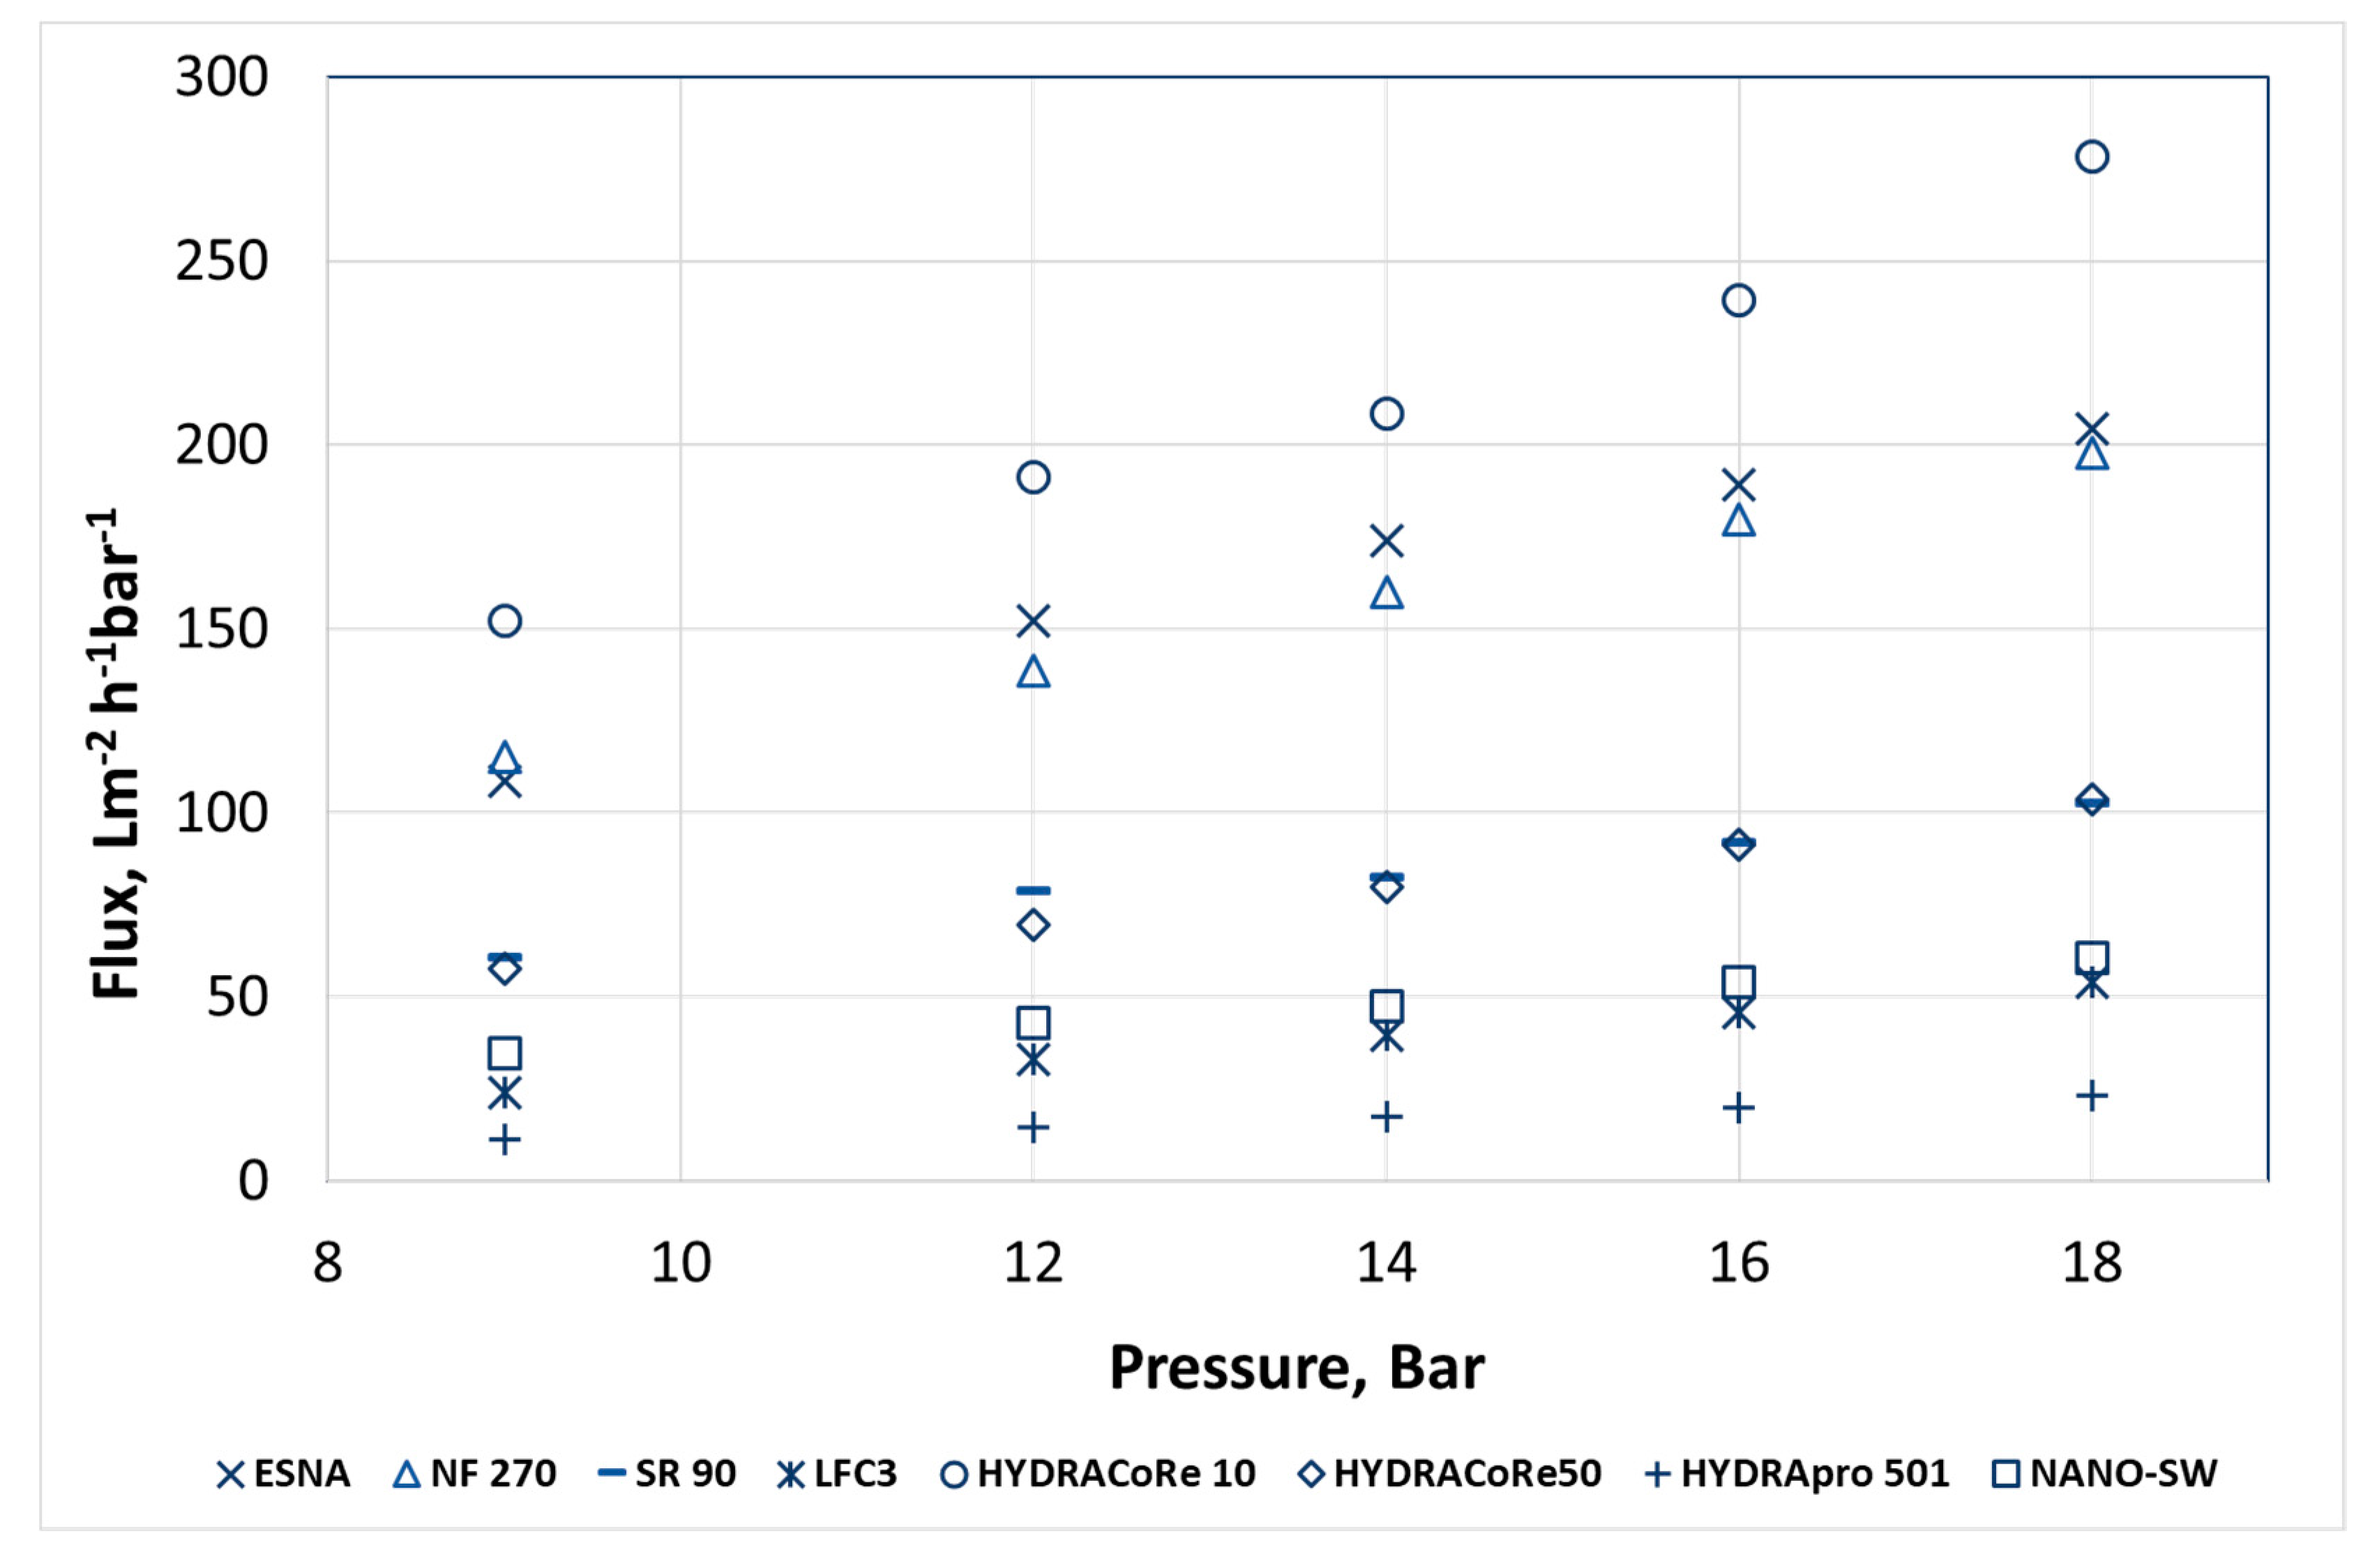
4.1. Pure Water Permeability

Figure 1 shows the dependency of operating pressure on flux through eight membranes. A linear relation was obtained for water flux as a function of operating pressure. According to Figure 1, the pure water permeability of the membranes decreased in the sequence HYDRACoRE 10 ˃ ESNA ˃ NF 270 ˃ HYDRACoRe 50 ˃ SR 90 ˃ NANO-SW ˃ LFC3 ˃ HYDRApro 501.
LFC3 is a reverse osmosis membrane while HYDRApro 501 is used specifically for industrial applications with difficult feed streams, according to the manufactures. The permeabilities of these two membranes were lowest among the tested membranes. Thus, only pure water permeability experiments were performed for LFC3 and HYDRApro 501 membranes and these two membranes were not considered for further calculations of membrane transport parameters.
Relatively high flux was obtained for the other six membranes. High fluxes of these NF membranes at low pressure confirmed that NF membranes can be used as in energy saving compared to reverse osmosis membranes. Table 3 shows the water permeability of membranes when pure water and seawater were used as the feed.
Lp of the tested membranes did not vary throughout the experiments. Hence, the membranes could be considered stable during the experimental period.
The effect of feed concentrations on the membrane flux was evident from the difference in water permeability between the two solutions in Table 3. Pure water permeability was highest through HYDRACoRe10, suggesting more open pores compared to the other tested membranes.

4.2. Calculation of σ, Ps, and rp Based on the Spiegler–Kedem and SHP Models

Experimental results for rejection and flux during permeation experiments with seawater were calculated using Equations (1) and (2). First, the transport parameters σ and Ps for each ion were estimated using a nonlinear least squares method by fitting the Spiegler–Kedem model by plotting rejection versus flux for six membranes. Coefficients selected were with above 95% confidence bounds. Second, the pore radius based on individual ion rejection data for every membrane was determined from its membrane parameter σ based on the steric hindrance pore model (SHP) using Equations (7), (10), and (11). The value for rp (determined as = rs/q) were calculated using the Stokes radius of the solute (rs) as presented in Table 1.
Membrane parameters were estimated by fitting rejection versus flux using the Spiegler–Kedem equation. Figure 2 shows the dependency of the real rejection on volume flux for Na+ for NANO-SW. The data points present the rejection values from the experiment and the solid line shows the values calculated using the Spiegler–Kedem equation with the best-fitted σ and Ps. Figure 2 shows that the theoretical curves are in close agreement with experimental values.
The effective membrane pore radius for each ion was calculated from the transport parameters σ and Ps based on the SHP model when seawater was used as the feed and is presented in Table 4.
Table 4 shows that reflection coefficients and solute permeability vary for each ion. The pore radii of these membranes were calculated using the Stokes radius of each ion. It was earlier reported by Luo and Wan [16] that the rp of NF 270 is 0.43 nm. The pore size of NF 270 was previously determined using atomic force microscopy by Hilal et al. [17] and suggested to be between 0.47–0.99 nm with a mean of 0.71 nm. An average pore size of 0.47 nm was determined for NF 270 using the SHP model in this research. The calculated pore size of NF 270 was in the same range as recorded by several researchers confirming the validity of the calculations. The results show that for these membranes, a pore size distribution was more likely than a fixed pore size, and the identification of an effective pore radius does not indicate the presence of geometrically defined pores in NF membranes.
According to Table 4, polyamide membranes showed better rejection for divalent ions since the reflection coefficient was high for divalent ions compared to monovalent ions. According to the obtained results, the Spiegler–Kedem model was able to fit the experimental data of flux versus rejection for all ions and for all membranes except for HYDRACoRe 10. For HYDRACoRe 10, negative Cl reflection coefficients were obtained for all performed trials with the model. This could be due to the very low rejection of Cl or probably a negative rejection of Cl even though it was not observed during experiments. Negative rejection implies that the system has more Cl in the permeate compared to the feed. Negative rejection of an ion occurs when a higher concentration of that ion is present in the smaller permeate volume relative to the larger feed volume. Negative rejection is observed mostly at low operating pressures [18]. The results show that HYDRACoRe 10 membrane has a larger pore size than the usual NF range which explains the poor ion separation of HYDRACoRe 10.
Table 4 shows that membranes with larger pore sizes had lower reflection coefficients. In other words, membranes with higher pure water permeability had lower individual ion reflection coefficients. A relative pore size comparison was performed with Mg2+ since it is a divalent cation with the highest Stokes radius compared to other ions tested for pore radius calculations, along with the fact that Mg2+ is attracted by the negatively charged membrane (unlike SO42−) and would therefore permeate the membrane easily if the pore size was appropriately large for the ion. Hence, with respect to Mg2+, the pore size of the tested membranes was in the sequence HYDRACoRe 10 > ESNA > HYDRACoRe 50 > NF 270 > SR 90 > NANO-SW.
However, the high feed concentrations and the ionic interactions that occurred among unaccounted ions and major ions in seawater, along with the interactions between ions and the membrane, added to the overall complexity in separation mechanisms of NF membranes. This provides a challenge to any model based on high feed concentrations.

4.3. Selection of NF Membranes for Smart Water Production Using a Predictive Model

The ionic composition required for smart water depends mainly on the type of reservoir. For carbonate reservoirs, an NF membrane with a high rejection of divalent ions and low monovalent ion rejection should be selected. For sandstone reservoirs, low salinity is preferred. Thus, a membrane with moderate flux will be suitable, which results in low divalent ion permeation.
According to Equation (12), pure water permeability is a parameter that combines the structural properties of the membrane and is used as a critical parameter that determines the ion rejection of a membrane. The only other property that influences water permeability is the feed viscosity, as shown in Equation (12). During the experiments, the structural parameters remained the same provided temperature and pH of the feed are controlled. Several researchers [19,20] have established that temperature and pH affect the pore size and change the flux. In this research, the difference in viscosity between pure water and seawater was neglected when Lp was used for correlating the reflection coefficient and solute permeability of membranes.
Thus, according to Equation (12), pure water permeability was directly related to the structural parameters such as effective membrane pore radius, and to Ak/Δx (ratio of membrane porosity to membrane thickness). It can be inferred that the transport parameters of a solute are related to the structural properties of a specific membrane, as shown in Equations (7)–(11). Knowing the transport parameters, it is possible to predict the rejection (Robs) of a membrane using the Spiegler–Kedem model.

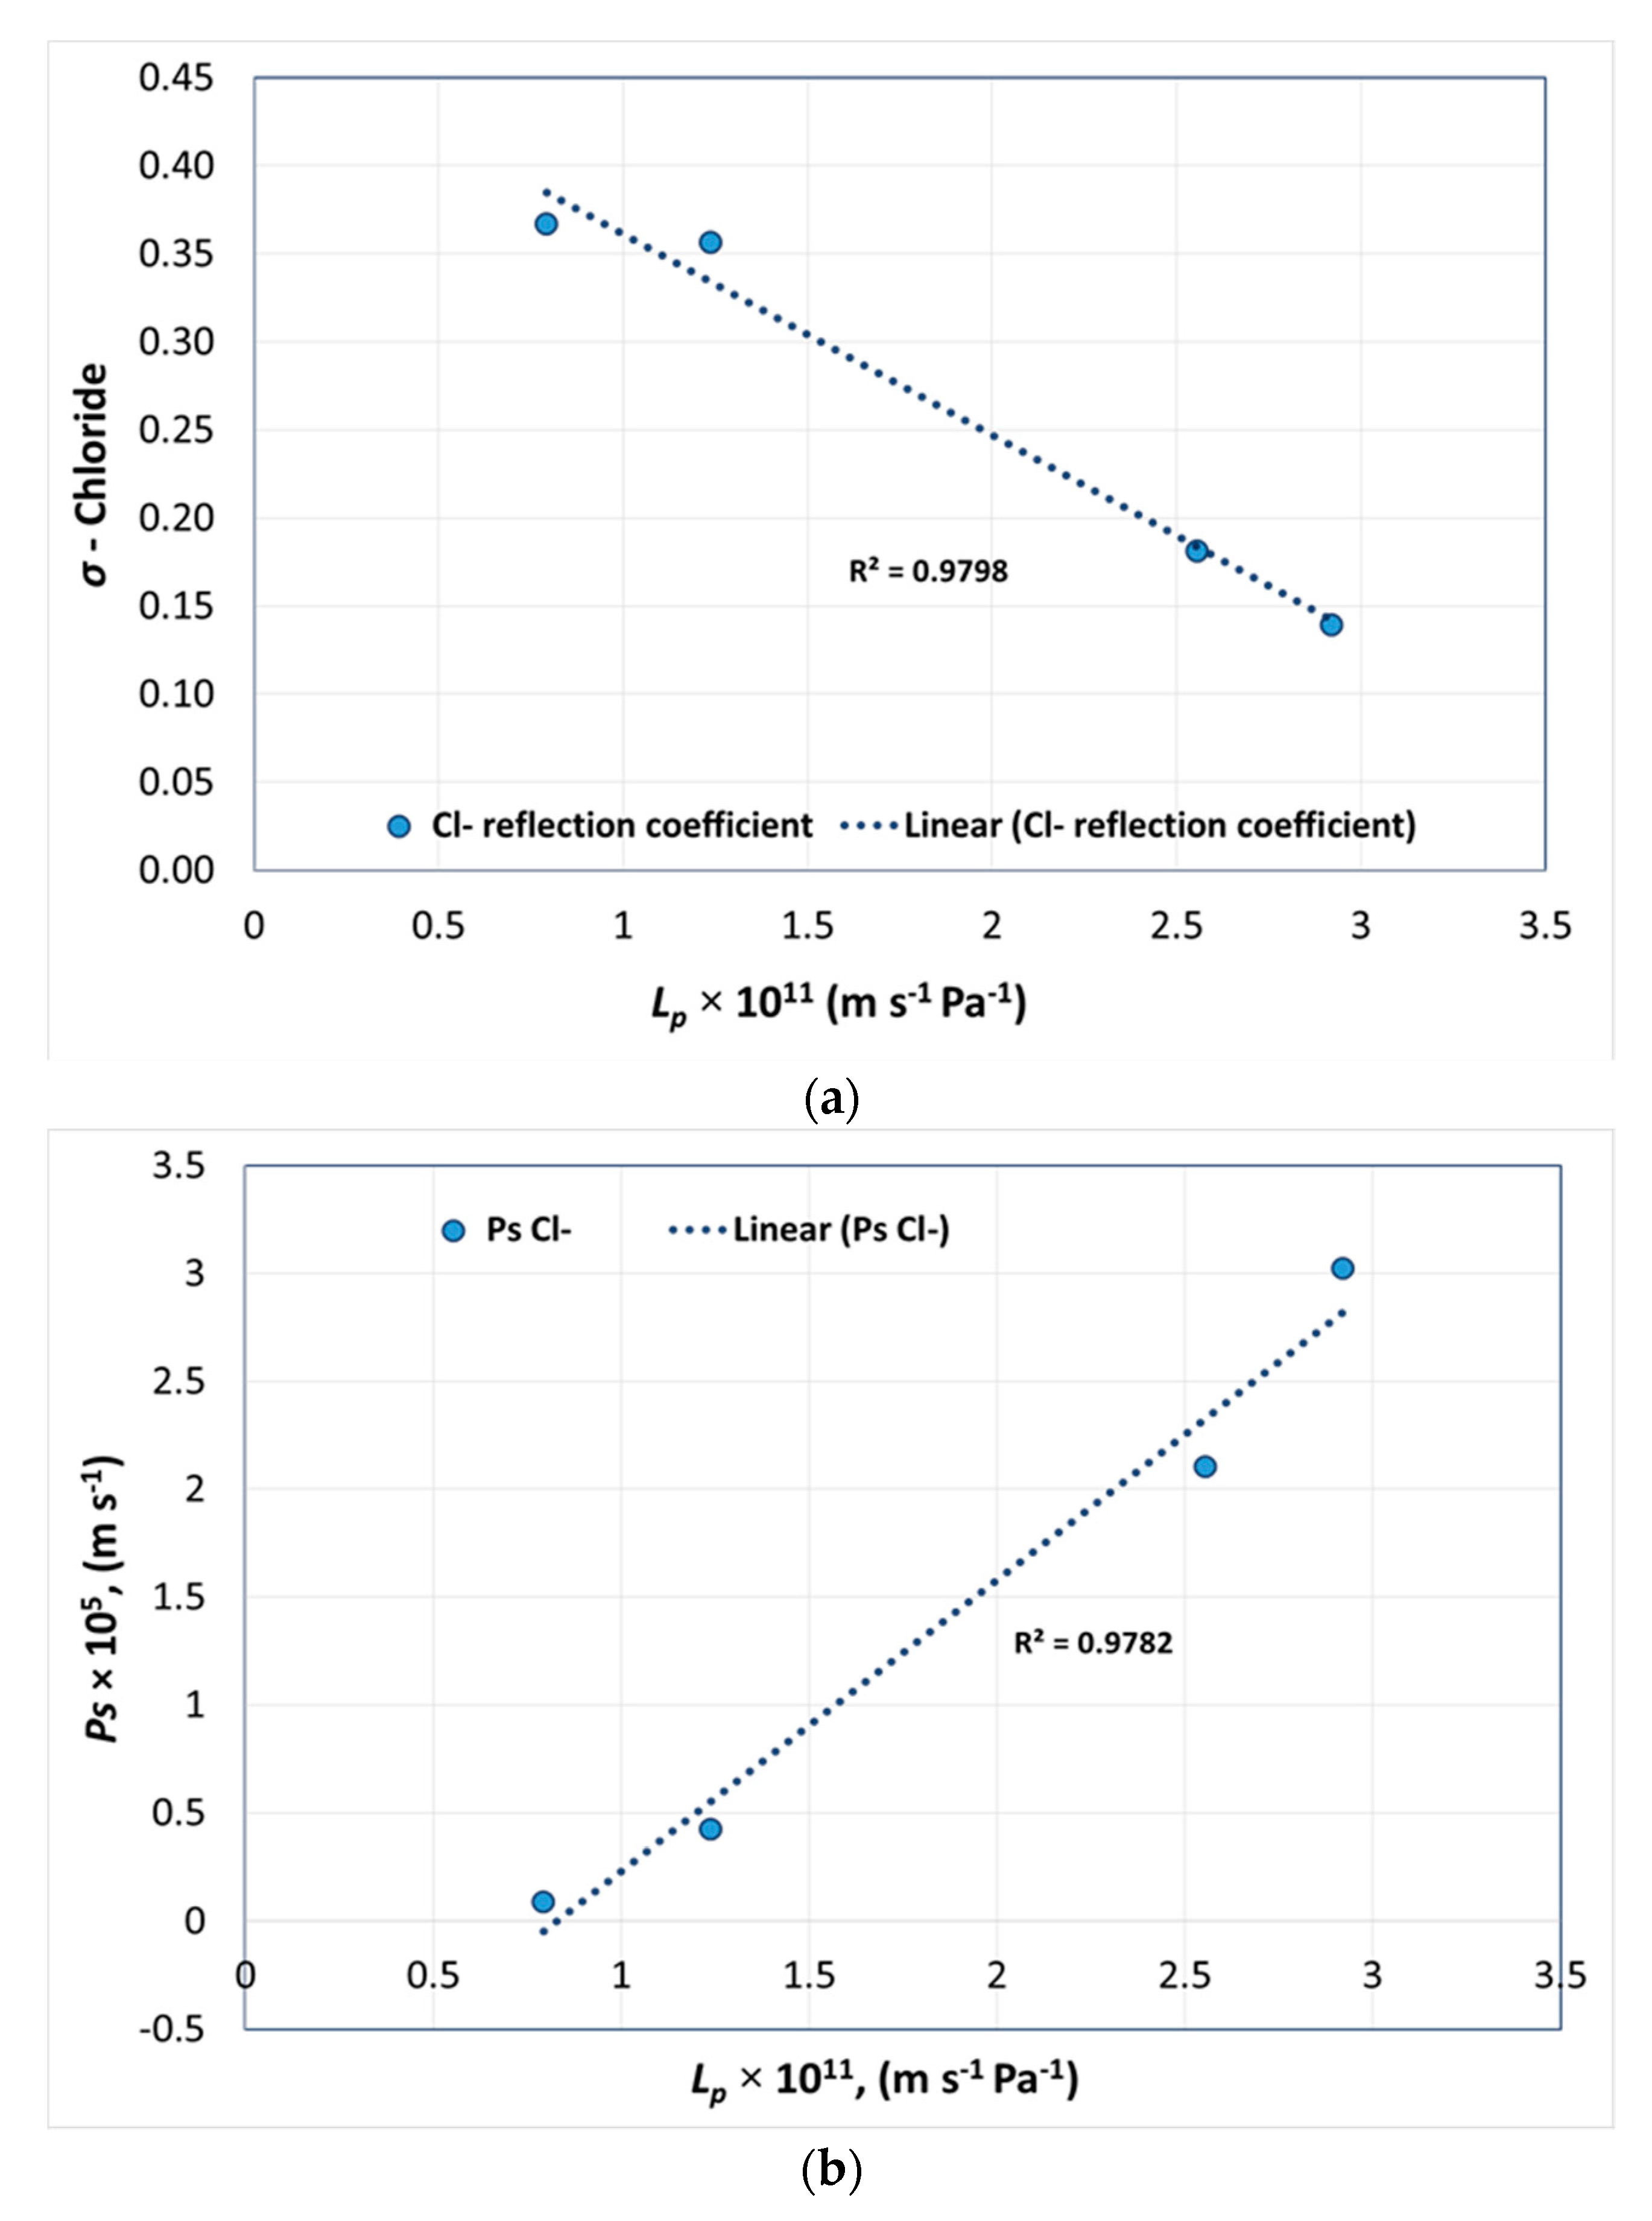
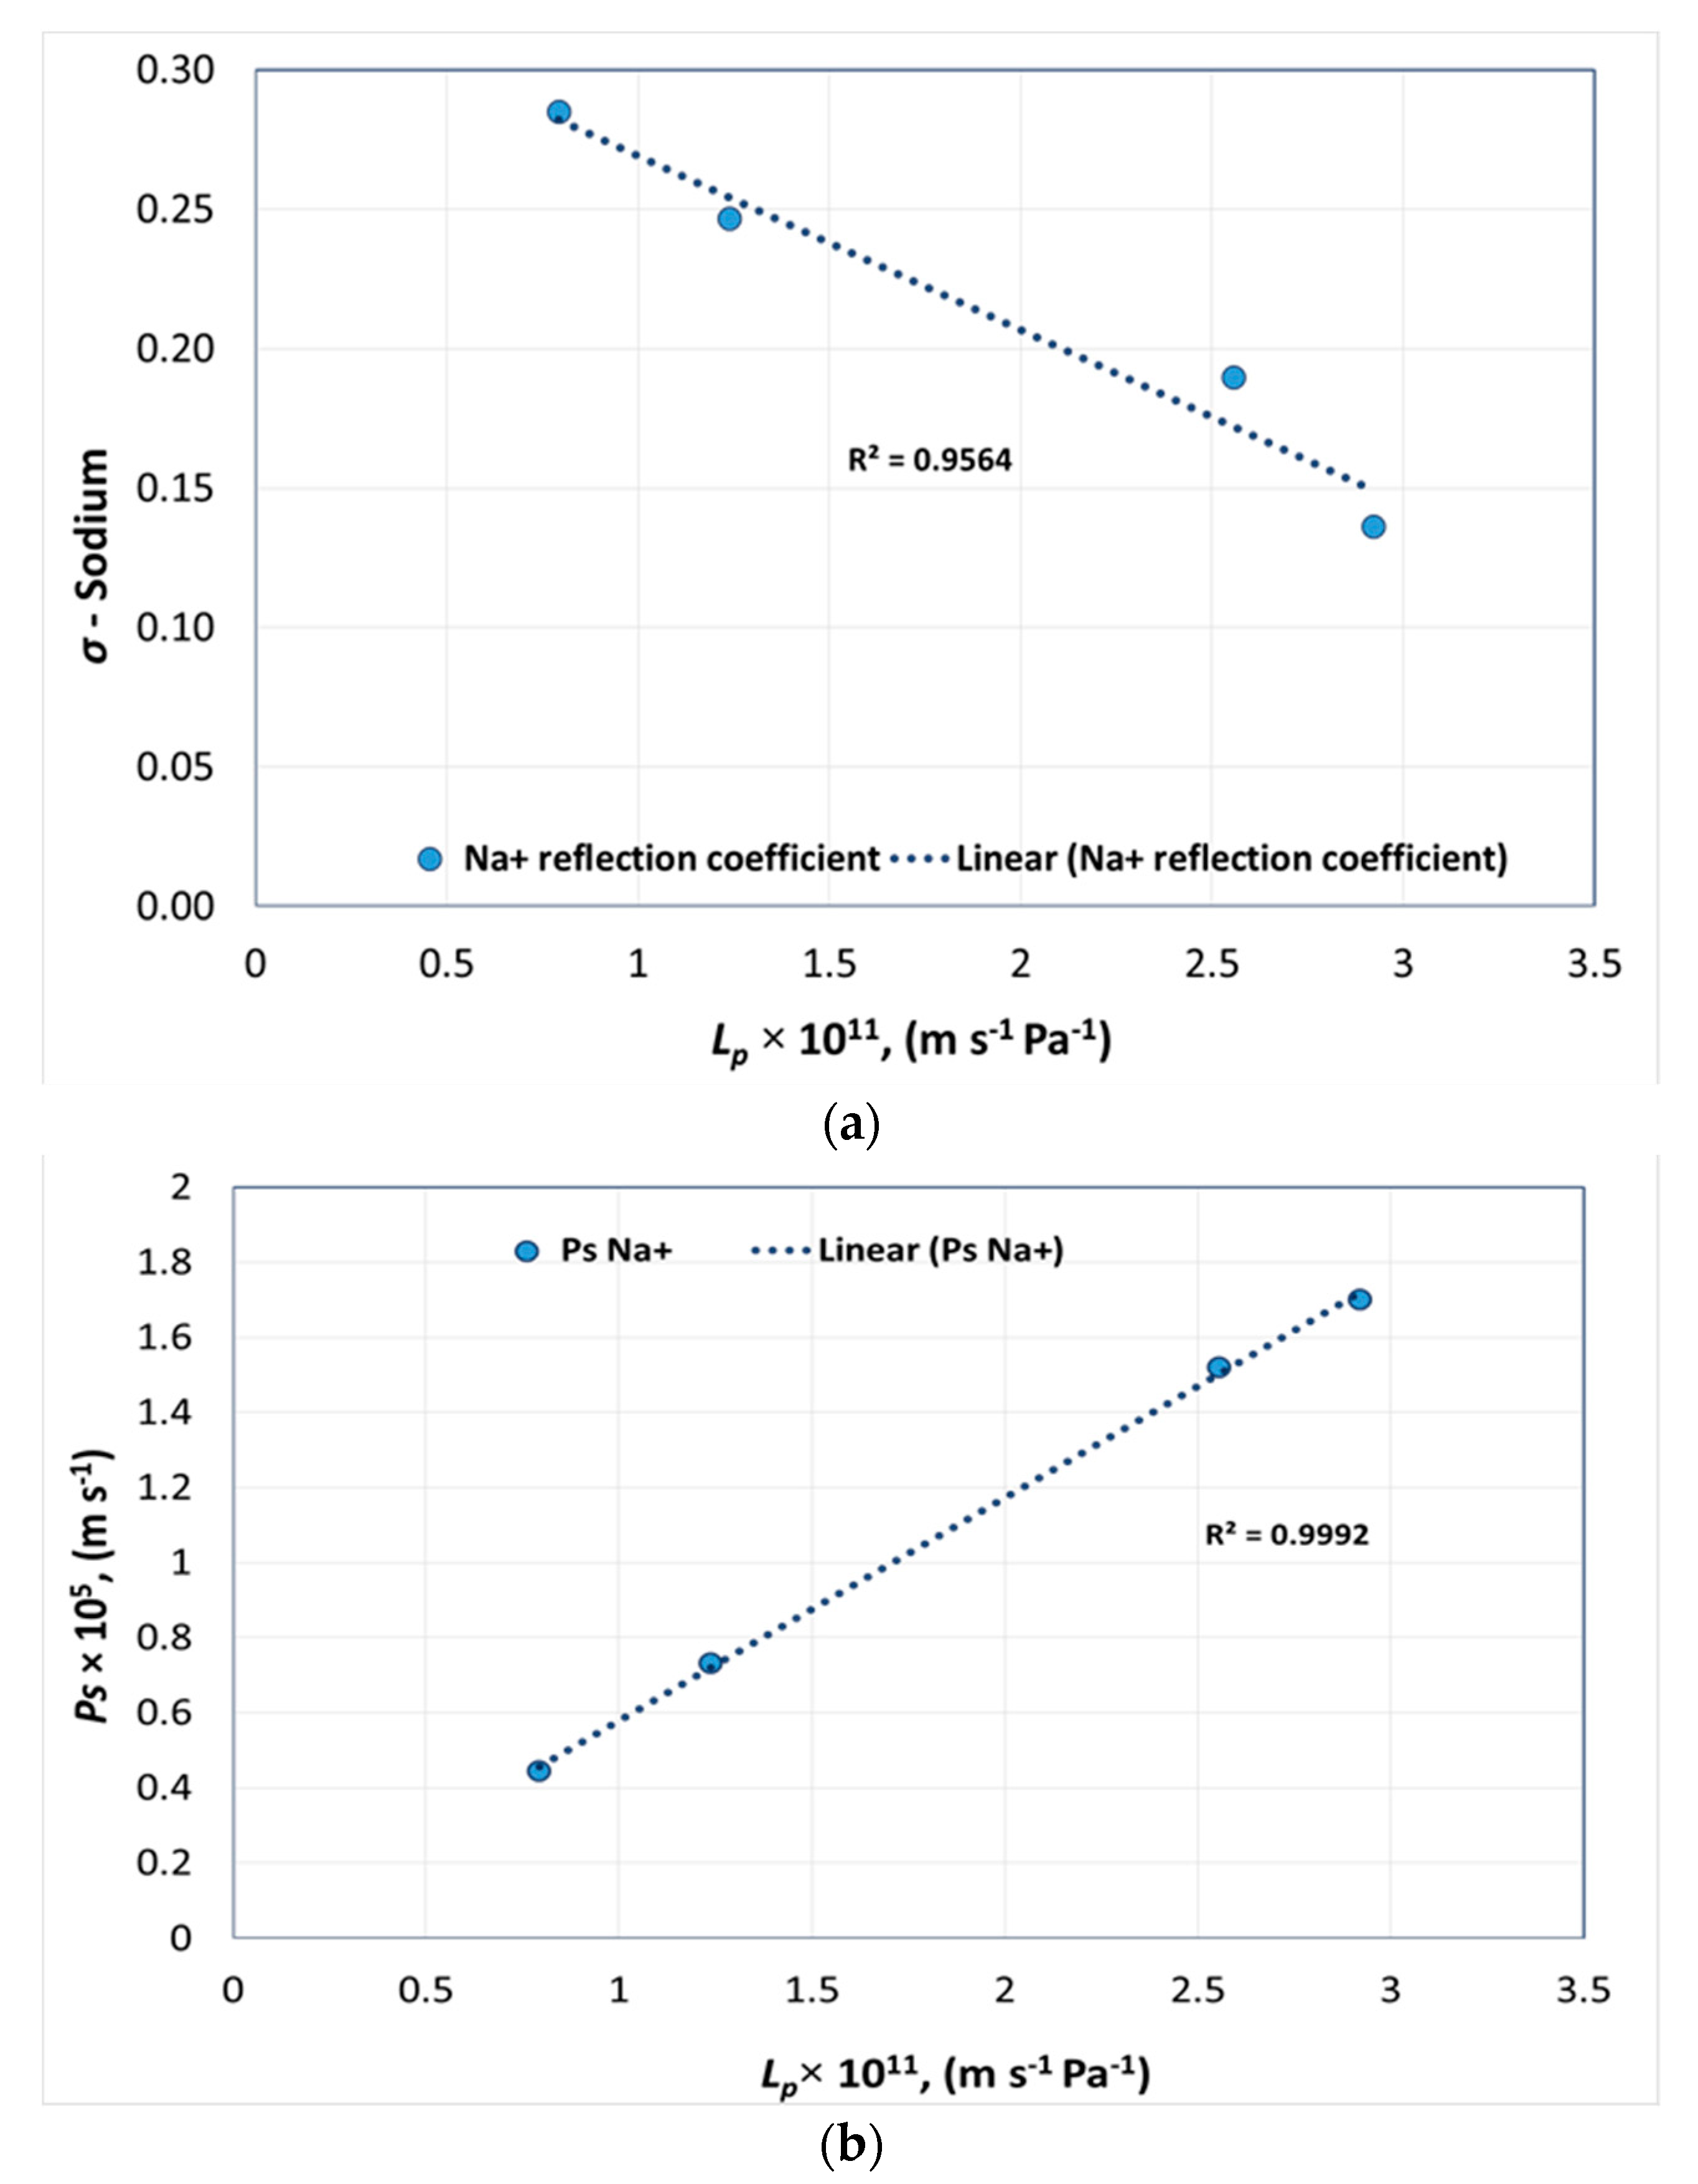
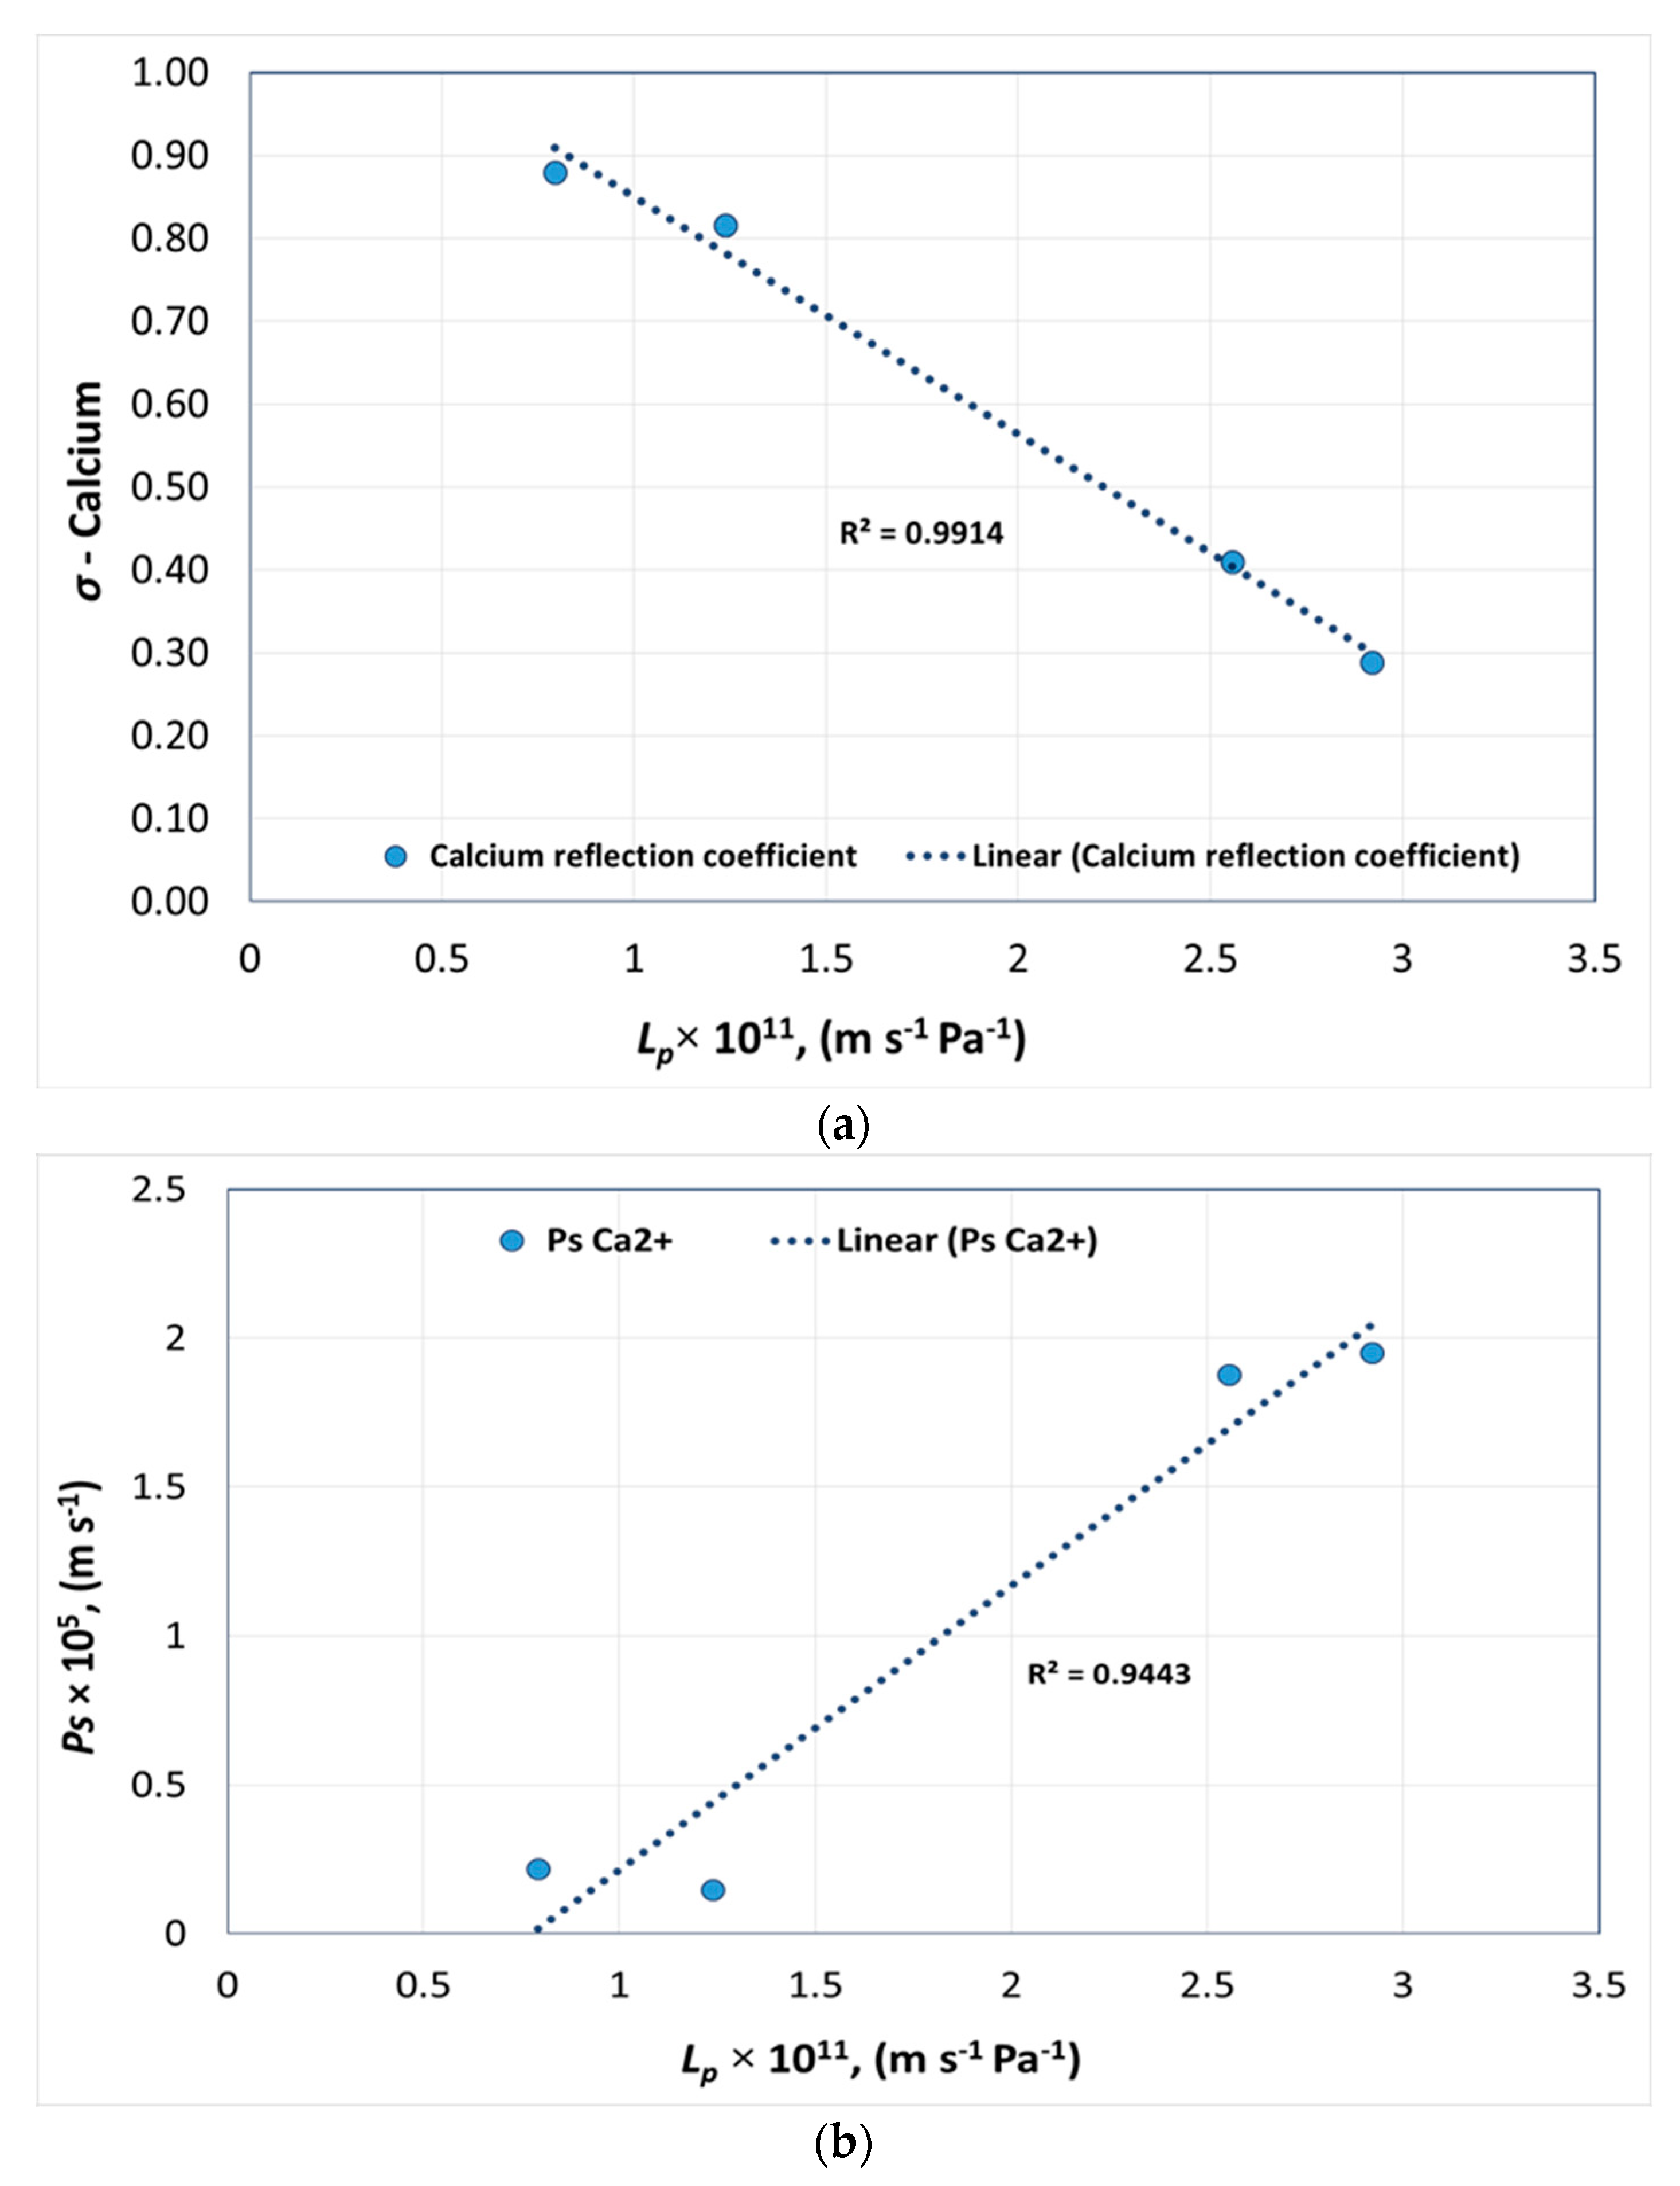
4.3.1. Relating Lp with σ and Ps

Lp versus σ and Ps of individual ions were plotted to find a relation between pure water permeability, reflection coefficient, and Ps. Transport parameters were calculated for four polyamide membranes, ESNA, NF 270, SR 90, and NANO-SW with varying Lp. These four membranes were chosen since:
(1)
Table 4 shows that HYDRACoRe 10 had poor ion separation. HYDRACoRe 50, made of sulfonated polyethersulfone, was not used to have comparable membrane materials for the model.
(2)
The Lp chosen for the plot to create the model was in the range required for smart water production. Pure water permeability higher than that of ESNA would have resulted in very low divalent ion rejection. Choosing a membrane with lower permeability than NANO-SW meant a tighter membrane leading to higher rejection for any flux and low recovery thereby increasing power consumption.
Figure 3a shows the pure water permeability of polyamide NF membranes versus σ and Figure 3b presents Lp versus solute permeability Ps of chloride for each membrane.
Figure 3a shows that with an increase in water permeability, the reflection coefficient of ions decreased whereas Figure 3b shows that the solute permeability increased. This confirmed that when the effective membrane pore radius increases, permeability increases, resulting in lower ion rejection.
Similarly, Figure 4a and Figure 4b represents the pure water permeability of NF membranes versus σ and Ps of sodium for each membrane, respectively.
Figure 5a presents the pure water permeability of membranes versus σ and Figure 5b presents Lp versus Ps of sulfate for each membrane.
According to Figure 5a, the sulfate reflection coefficient shows a sharp decline with a small change in water permeability. This was mainly because of divalent anion on the negatively charged membrane surface. In Figure 5b showing pure water permeability versus Ps, the sulfate permeability remains unchanged for a range of permeabilities until approximately 2.6 × 10⁻¹¹ m s−1 Pa−1. After this value, a sharp increase was observed similar to the sharp decline in reflection coefficient of sulfate. A deviation in the reflection coefficient and solute permeability of SO42− can be explained in relation to the thermodynamic properties of the ion. Ion permeation through a membrane is affected by the hydrated size and hydration free energy of the ions. During membrane transport, the transmembrane pressure creates shear stress that results in ions with low hydration energy being able to easily permeate through the membrane whereas ions with higher hydration energy and hydrated radius will be rejected by the membrane. SO42− is a divalent anion with a hydration free energy of −1145 KJ/mol and a hydrated radius of 0.379 nm [21]. When the negatively charged ion is in contact with a negatively charged membrane surface, ion repulsion occurs, resulting in a higher rejection. Similarly, to maintain electroneutrality on both sides of the membrane, anions with a lower hydration energy and hydrated radius permeate through the membrane. Hence, Cl will be preferentially permeated compared to SO42− due to a lower hydration energy of −340 KJ/mol and hydrated radius of 0.324 nm. In Figure 5a, for ESNA, the reflection coefficient for SO42− was lower at 0.66, whereas for the other three membranes, the SO42− reflection coefficient was greater than 0.95. This can be explained with regard to the rp calculated relative to Mg2+ as presented in Table 4. The pore radius rp calculated was 0.86 nm, thus SO42− permeated more for ESNA due to the steric effect resulting in lower σ and higher Ps compared to the other three membranes with a pore size close to 0.4 nm that is in close proximity to the SO42− hydrated radius. Hence, a combination of steric effect and divalent anion-membrane repulsion prompted SO42− rejection in NANO-SW, SR 90, and NF 270.
Figure 6a,b shows the pure water permeability of membranes versus σ and Ps of calcium for each membrane, respectively.
According to Figure 6a, the reflection coefficient decreased gradually with increasing permeability. However, a small variation in calcium permeability was observed at lower permeabilities as shown in Figure 6b.
Figure 7a,b shows the pure water permeability of membranes versus σ and Ps of magnesium for each membrane, respectively.
According to Figure 7a, the reflection coefficient of Mg2+ deviated slightly from linear behavior for membranes with low pure water permeability. Mg2+ is a divalent cation with a hydration energy of −1922 KJ/mol with a hydrated radius of 0.470 nm [21]. According to Figure 7a,b, when pure water permeability decreased with respect to pore radius, the reflection coefficient of Mg2+ increased, confirming the higher rejection and lower permeation of Mg2+. The deviation from linear behavior was observed for membranes (NANO-SW and SR 90) with a calculated rp ≈ 0.4 nm with respect to Mg2+, where rp is close to its hydrated radius.

4.3.2. Correlations for the Determination of σ and Ps of a Polyamide Membranes

The correlation developed was considered valid if the feed is seawater with no change in ionic concentration and viscosity for all tested polyamide membranes.
The following equations were obtained from Figure 3, Figure 4, Figure 5, Figure 6 and Figure 7, to determine σ and Ps of each ion with a given pure water permeability Lp0.
σ C l = 1 × 10 10 × L p 0 + 0.4749
σ N a + = 6 × 10 9 × L p 0 + 0.3318
σ S O 4 2 = 1 × 10 10 × L p 0 + 1.118
σ C a 2 + = 3 × 10 10 × L p 0 + 1.1354
σ M g 2 + = 3 × 10 10 × L p 0 + 1.2559
P s C l = 1 × 10 11 × L p 0 1.1144
P s N a + = 6 × 10 10 × L p 0 0.0147
P s S O 4 2 = 4 × 10 31 × L p 0 3.0496
P s C a 2 + = 1 × 10 11 × L p 0 0.7388
P s M g 2 + = 9 × 10 30 × L p 0 2.9414
As previously explained, the correlations represented by Equations (13)–(22) are applicable only for seawater with similar TDS and ionic composition. For a change in feed, the coefficients need to be established through experimental data. Equations (13)–(22) can be used for determining σ and Ps of polyamide membranes with pure water permeabilities between 5 × 10⁻¹² to 3 × 10⁻¹¹ m s−1 Pa−1, which include membranes with a pore size of 0.4 to 0.86 nm, according to Table 4.
The following steps were performed to run the model for predicting transport parameters and rejection.
(1)
Using Equations (13)–(22), the model was run to predict σtheoretical and Ps,theoretical for two NF membranes with pure water permeabilities as in Table 5.
(2)
Flux for the above-mentioned NF membranes with seawater as feed was calculated using Equation (2). A random flux value at 12 bar was chosen for the model.
(3)
The values for σtheoretical and Ps,theoretical, and flux at 12 bar was substituted into Equations (5) and (6) to calculate the theoretical rejection (Rtheoretical).
(4)
To validate the calculated equations, ion rejection by the two chosen NF membranes was experimentally determined (Rexperimental) using Equation (1) for individual ions in seawater. These rejection values were plotted against the respective membrane flux values, and transport parameters were determined by fitting the values using the Spiegler–Kedem equation. Hence, σexperimental and Ps,experimental were determined.
Table 5 shows the results obtained based on the model and on experiments performed by two chosen NF membranes.
Table 5 shows a close correlation between the model and experimental values of σ, Ps, and rejection of all ions except for Ca2+ for the membrane with lower pure water permeability. This validates the robustness of the model. Table 5 indicates that rejection for the divalent anion SO42− was highest for all tested membranes indicating the negative surface of the NF membranes. Focusing on the rejection of divalent cations, Mg2+ was rejected more than Ca2+ due to its larger Stokes radius as shown in Table 1.
The individual ion selectivity is a key parameter for selecting appropriate membrane for smart water production. In this research, the Spiegler–Kedem model was used for determining individual ion transport through the membrane rather than overall solute transport, which has been extensively studied previously. The study is relevant for end users to select proper NF membranes for producing smart water without extensive membrane experiments.

5. Conclusions

Membrane transport parameters were determined by fitting the Spiegler–Kedem equation using flux and rejection values obtained from experiments using six NF membranes. The theoretical rejection values obtained by fitting the Spiegler–Kedem equation showed good correlations with experimental values for NF membranes with a similar membrane material. It was evident that it was difficult to increase the membrane water flux without losing ion selectivity and membrane flux was directly related to the effective membrane pore radius. The flux was higher for membranes with rp > 0.7 nm. However, membrane ion rejection decreased with higher rp. The hypothetical pore radii of six membranes were evaluated from permeation experiments with charged ions using a steric hindrance pore model. The pore radii of membranes were estimated from 0.4 nm to 2.15 nm. The experiments concluded that the membranes had a pore size distribution rather than a single pore radius. A sharp change in σ and Ps of sulfate were observed when plotted against pure water permeabilities of polyamide membranes. Hence, choosing an NF membrane for smart water production in carbonates requires much attention when having pure water permeabilities above 2.6 × 10⁻¹¹ m s−1 Pa−1 where the SO42− rejection will be low. The suggested method helps to predict NF rejection for smart water production from seawater and for feeds with a high concentration and multi-ionic solutions as in softening and desalination.

Supplementary Materials

The following are available online at https://www.mdpi.com/2077-0375/8/3/78/s1, Figure S1: Rejection versus flux for Na+ for ESNA fitted using Spiegler–Kedem model, Figure S2: Rejection versus flux for Na+ for HYDRACoRe10 fitted using Spiegler–Kedem model, Figure S3: Rejection versus flux for Na+ for HYDRACoRe50, Figure S4: Rejection versus flux for Na+ for NF270, Figure S5: Rejection versus flux for Na+ for SR 90, Figure S6: Rejection versus flux for Na+ for NANO SW, Figure S7: Rejection versus flux for Na+ for all NF membranes.

Author Contribution

Conceptualization, R.N. and T.B.; Methodology, R.N.; Software, R.N.; Validation, R.N., E.P., S.S. and T.B.; Formal Analysis, R.N.; Investigation, R.N.; Resources, R.N., E.P.; Data Curation, R.N.; Writing-Original Draft Preparation, R.N.; Writing-Review & Editing, E.P., S.S., T.B.; Visualization, R.N.; Supervision, S.S., T.B.; Project Administration, T.B.; Funding Acquisition, T.B.

Funding

This research did not receive any specific grant from funding agencies in the public, commercial, or not-for-profit sectors.

Acknowledgment

The authors acknowledge the Research Council of Norway and the industry partners, ConocoPhillips Skandinavia AS, Aker BP ASA, Eni Norge AS, Total E&P Norge AS, Equinor ASA, Neptune Energy Norge AS, Lundin Norway AS, Halliburton AS, Schlumberger Norge AS, Wintershall Norge AS, and DEA Norge AS of The National IOR Centre of Norway for support.

Conflicts of Interest

The authors declare no conflict of interest.

References

  1. Austad, T. Water-based EOR in Carbonate and Sandstone: New Chemical Understanding of the EOR-Potential using “Smart water”. In Enhanced Oil Recovery Field Case Studies; Sheng, J., Ed.; Gulf Professional Publishing: Houston, TX, USA, 2013; pp. 301–335. [Google Scholar]
  2. Nair, R.R.; Protasova, E.; Strand, S.; Bilstad, T. Membrane performance analysis for smart water production for enhanced oil recovery in carbonate and sandstone reservoirs. Energy Fuels 2018, 32, 4988–4995. [Google Scholar] [CrossRef]
  3. Cheryan, M. Ultrafiltration and Microfiltration Handbook; CRC Pres: Boca Raton, FL, USA, 1998. [Google Scholar]
  4. Oatley-Radcliffe, D.; Walters, M.; Ainscough, T.J.; Williams, P.M.; Mohammad, A.W.; Hilal, N. Nanofiltration membranes and processes: A review of research trends over the past decade. J. Water Process. Eng. 2017, 19, 164–171. [Google Scholar] [CrossRef]
  5. Hilal, N.; Al-Zoubi, H.; Mohammad, A.; Darwish, N. Nanofiltration of highly concentrated salt solutions up to seawater salinity. Desalination 2005, 184, 315–326. [Google Scholar] [CrossRef]
  6. Gilron, J.; Gara, N.; Kedem, O. Experimental analysis of negative salt rejection in nanofiltration membranes. J. Membr. Sci. 2001, 185, 223–236. [Google Scholar] [CrossRef]
  7. Spiegler, K.; Kedem, O. Thermodynamics of hyperfiltration (reverse osmosis): Criteria for efficient membranes. Desalination 1966, 1, 311–326. [Google Scholar] [CrossRef]
  8. Kedem, O.; Katchalsky, A. Permeability of composite membranes: Part 1. Electric current, volume flow and flow of solutes through membranes. Trans. Faraday Soc. 1963, 59, 1918–1953. [Google Scholar] [CrossRef]
  9. Murthy, Z.; Gupta, S.K. Estimation of mass transfer coefficient using a combined nonlinear membrane transport and film theory model. Desalination 1997, 109, 39–49. [Google Scholar] [CrossRef]
  10. Jye, L.W.; Ismail, A.F. Nanofiltration Membranes—Synthesis, Characterization and Applications; CRC Press, Taylor & Francis Group: Boca Raton, FL, USA, 2017. [Google Scholar]
  11. Diwara, C.K.; Lo, S.; Rumeau, M.; Pontie, M.; Sarr, O. A phenomenological mass transfer approach in nanofiltration of halide ions for a selective defluorination of brackish drinking water. J. Membr. Sci. 2003, 219, 103–112. [Google Scholar] [CrossRef]
  12. Nakao, S.I.; Kimura, S. Models of membrane transport phenomena and their applications for ultrafiltration data. J. Chem. Eng. Jpn. 1982, 15, 200–205. [Google Scholar] [CrossRef]
  13. Wang, X.L.; Tsuru, T.; Togoh, M.; Nakao, S.I.; Kimura, S. Evaluation of pore structure and electrical properties of nanofiltration membranes. J. Chem. Eng. Jpn. 1994, 28, 186–192. [Google Scholar] [CrossRef]
  14. Bowen, R.; Mohammad, W.A. Diafiltration by Nanofiltration: Prediction and Optimization. AIChe J. 1998, 44, 1799–1812. [Google Scholar] [CrossRef]
  15. Hussain, A.; Nataraj, S.; Abashar, M.; Al-Mutaz, I.; Aminabhavi, T. Prediction of physical properties of nanofiltration membranes using experiment and theoretical models. J. Membr. Sci. 2008, 310, 321–336. [Google Scholar] [CrossRef]
  16. Luo, J.; Wan, Y. Effect of highly concentrated salt on retention of organic solutes by nanofiltration polymeric membranes. J. Membr. Sci. 2011, 372, 145–153. [Google Scholar] [CrossRef]
  17. Hilal, N.; Al-Zoubi, H.; Darwish, N.; Mohammad, A. Characterisation of nanofiltration membranes using atomic force microscopy. Desalination 2005, 177, 187–199. [Google Scholar] [CrossRef]
  18. Yaroshchuk, A. Negative rejection of ions in pressure-driven membrane processes. Adv. Colloid Interface Sci. 2008, 139, 150–173. [Google Scholar] [CrossRef] [PubMed]
  19. Nilsson, M.; Tragårdh, G.; Ostergren, K. The influence of pH, salt and temperature of nanofiltration performance. J. Membr. Sci. 2008, 312, 97–106. [Google Scholar] [CrossRef]
  20. Deshmukh, S.S.; Childress, A. Zeta potential of commercial RO membranes: Influence of source water type and chemistry. Desalination 2001, 140, 87–95. [Google Scholar] [CrossRef]
  21. Tansel, B. Significance of thermodynamic and physical characteristics on permeation of ions during membrane separation: Hydrated radius, hydration free energy and viscous effects. Sep. Purif. Technol. 2012, 86, 119–126. [Google Scholar] [CrossRef]
Figure 1. Pure water flux as a function of operating pressure for eight different membranes.
Membranes 08 00078 g001
Figure 2. Rejection versus flux (m s-1) for Na+ for NANO-SW.
Membranes 08 00078 g002
Figure 3. Pure water permeability versus (a) reflection coefficient and (b) solute permeability of chloride.
Membranes 08 00078 g003
Figure 4. Pure water permeability versus (a) reflection coefficient and (b) solute permeability of sodium.
Membranes 08 00078 g004
Figure 5. Pure water permeability versus (a) reflection coefficient and (b) solute permeability of sulfate.
Membranes 08 00078 g005
Figure 6. Pure water permeability versus (a) reflection coefficient and (b) solute permeability of calcium.
Membranes 08 00078 g006
Figure 7. Pure water permeability versus (a) reflection coefficient and (b) solute permeability of magnesium.
Membranes 08 00078 g007
Table 1. Stokes radii of major ions used for calculations [14,15].
IonsClNa+SO42−Ca2+Mg2+
Stokes Radius (nm)0.1210.1840.2310.3100.348
Table 2. Membrane characteristics as provided by the suppliers.
MembranesHYDRACoRe10HYDRACoRe50NF 270SR 90ESNANANO-SWLFC3HYDRApro501
MaterialSulphonated PolyethersulfoneComposite Polyamide
pH range2–113–102–103–92–10.62–11
Area (m2)2.32.62.3
MWCO of HYDRACoRe10 and HYDRACoRe50 are 3000 and 1000 Daltons, respectively.
Table 3. The permeability of membranes with different feed solutions.
MembranesPure Water (L m−2 h−1 bar−1)Seawater (L m−2 h−1 bar−1)
HYDRACoRe 1013.569.5
ESNA10.527.9
NF 2709.386.1
HYDRACoRe 505.153.8
SR 904.463.3
NANO-SW3.271.9
LFC32.85-
HYDRApro 5011.32-
Table 4. Calculated σ, Ps, and average rp for ions for all tested membranes.
MembranesIonsσ (−)Ps (m s−1)qrp (nm)
ESNACl0.143.023 × 10−50.300.41
Na+0.141.701 × 10−50.290.63
SO42−0.666.211 × 10−60.690.34
Ca2+0.291.953 × 10−50.440.71
Mg2+0.241.26 × 10−50.400.86
NF 270Cl0.182.105 × 10−50.340.35
Na+0.191.521 × 10−60.350.52
SO42−0.975.341 × 10−70.930.25
Ca2+0.411.879 × 10−50.530.58
Mg2+0.456.154 × 10−60.560.62
SR 90Cl0.364.241 × 10−60.500.24
Na+0.257.313 × 10−60.410.45
SO42−0.994.859 × 10−70.960.24
Ca2+0.821.474 × 10−60.790.39
Mg2+0.923.276 × 10−70.850.41
HYDRACoRe10Cl−0.01−4.844 × 10⁻⁷--
Na+0.033.115 × 10−50.131.42
SO42−0.161.728 × 10−50.320.73
Ca2+0.157.254 × 10−50.310.99
Mg2+0.055.447 × 10−50.162.15
HYDRACoRe50Cl0.171.329 × 10−50.330.37
Na+0.241.538 × 10−50.400.46
SO42−0.673.849 × 10−60.700.33
Ca2+0.325.928 × 10−60.470.67
Mg2+0.381.417 × 10−50.510.68
NANO-SWCl0.379.045 × 10−70.500.24
Na+0.294.439 × 10−60.440.42
SO42−0.993.298 × 10−80.960.24
Ca2+0.882.171 × 10−60.840.37
Mg2+0.933.471 × 10−70.880.40
Table 5. Comparison of experimental and theoretical values from the Spiegler–Kedem equation.
Pure Water Permeability, m s−1 Pa−1Flux at 12 bar, m s−1IonsσtheoreticalσexperimentalPs,theoretical, m s−1Ps,experimental, m s−1RtheoreticalRexperimental
2.56 × 10−112.06 × 10⁻⁵Cl0.220.181.44 × 10−52.11 × 10−50.160.11
Na+0.180.191.52 × 10−51.52 × 10−50.130.14
SO42−0.830.971.99 × 10−65.34 × 10−70.790.96
Ca2+0.370.411.82 × 10−51.88 × 10−50.230.24
Mg2+0.440.456.27 × 10−66.15 × 10−60.420.41
1.24 × 10−118.90 × 10⁻⁶Cl0.350.361.23 × 10−64.24 × 10−60.350.29
Na+0.260.257.28 × 10−67.31 × 10−60.170.16
SO42−0.990.992.18 × 10−74.86 × 10−70.971.00
Ca2+0.760.824.99 × 10−61.47 × 10−60.530.75
Mg2+0.890.927.44 × 10−73.28 × 10−70.850.96

