Effects of Alcohol Hangover on Cognitive Performance: Findings from a Field/Internet Mixed Methodology Study

 , ,
, ,  ,
,
Abstract
:1. Introduction
2. Experimental Section
2.1. Pilot Study
2.2. Main Study
2.2.1. Design
2.2.2. Participants
2.2.3. Breath Alcohol
2.2.4. Online Measures
2.2.5. Procedure
2.2.6. Statistics and Analysis
3. Results
3.1. Pilot Study
3.2. Main Study
4. Discussion
5. Conclusions
Author Contributions
Funding
Conflicts of Interest
References
- Van Schrojenstein Lantman, M.; van de Loo, A.J.; Mackus, M.; Verster, J.C. Development of a definition for the alcohol hangover: Consumer descriptions and expert consensus. Curr. Drug Abuse Rev. 2016, 9, 148–154. [Google Scholar] [CrossRef] [PubMed]
- Stephens, R.; Grange, J.A.; Jones, K.; Owen, L. A critical analysis of alcohol hangover research methodology for surveys or studies of effects on cognition. Psychopharmacology 2014, 231, 2223–2236. [Google Scholar] [CrossRef]
- Prat, G.; Adan, A.; Sánchez-Turet, M. Alcohol hangover: A critical review of explanatory factors. Hum. Psychopharmacol. 2009, 24, 259–267. [Google Scholar] [CrossRef]
- Penning, R.; van Nuland, M.; Fliervoet, L.A.; Olivier, B.; Verster, J.C. The pathology of alcohol hangover. Curr. Drug Abuse Rev. 2010, 3, 68–75. [Google Scholar] [CrossRef]
- Swift, R.; Davidson, D. Alcohol hangover: Mechanisms and mediators. Alcohol Health Res. World 1998, 22, 54–60. [Google Scholar] [PubMed]
- Verster, J.C. The alcohol hangover—A puzzling phenomenon. Alcohol Alcohol. 2008, 43, 124–126. [Google Scholar] [CrossRef] [PubMed]
- Wiese, J.G.; Shlipak, M.G.; Browner, W.S. The alcohol hangover. Ann. Int. Med. 2000, 132, 897–902. [Google Scholar] [CrossRef] [PubMed]
- Verster, J.C.; van Schrojenstein Lantman, M.; Mackus, M.; van de Loo, A.J.A.E.; Garssen, J.; Scholey, A. Differences in the Temporal Typology of Alcohol Hangover. Alcohol. Clin. Exp. Res. 2018, 42, 691–697. [Google Scholar] [CrossRef] [PubMed] [Green Version]
- Van De Loo, A.J.A.E.; Slot, K.A.; Kleinjan, M.; Knipping, K.; Garssen, J.; Verster, J.C. Time-dependent changes in saliva cytokine concentrations during alcohol hangover: A comparison of two naturalistic studies. Alcohol. Clin. Exp. Res. 2016, 40, 95A. [Google Scholar]
- Van de Loo, A.J.A.E.; van Schrojenstein Lantman, M.; Mackus, M.; Scholey, A.; Verster, J.C. Impact of mental resilience and perceived immune functioning on the severity of alcohol hangover. BMC Res. Notes 2018, 11, 526. [Google Scholar]
- Tipple, C.T.; Benson, S.; Scholey, A. A review of the physiological factors associated with alcohol hangover. Curr. Drug Abuse Rev. 2016, 9, 93–98. [Google Scholar] [CrossRef] [PubMed]
- Farokhnia, M.; Lee, M.R.; Farinelli, L.A.; Ramchandani, V.A.; Akhlaghi, F.; Leggio, L. Pharmacological manipulation of the ghrelin system and alcohol hangover symptoms in heavy drinking individuals: Is there a link? Pharmacol. Biochem. Behav. 2018, 172, 39–49. [Google Scholar] [CrossRef] [PubMed]
- Brust, J. Ethanol and cognition: Indirect effects, neurotoxicity and neuroprotection: A review. Int. J. Environ. Res. Public Health 2010, 7, 1540–1557. [Google Scholar] [CrossRef] [PubMed]
- Ling, J.; Heffernan, T.M.; Buchanan, T.; Rodgers, J.; Scholey, A.B.; Parrott, A.C. Effects of alcohol on subjective ratings of prospective and everyday memory deficits. Alcohol. Clin. Exp. Res. 2003, 27, 970–974. [Google Scholar] [CrossRef]
- Ogden, E.J.; Moskowitz, H. Effects of alcohol and other drugs on driver performance. Traffic Inj. Prev. 2004, 5, 185–198. [Google Scholar] [CrossRef]
- Scholey, A.B.; Benson, S.; Neale, C.; Owen, L.; Tiplady, B. Neurocognitive and mood effects of alcohol in a naturalistic setting. Hum. Psychopharmacol. 2012, 27, 514–516. [Google Scholar] [CrossRef]
- Tiplady, B.; Franklin, N.; Scholey, A. Effect of ethanol on judgments of performance. Br. J. Psychol. 2004, 95, 105–118. [Google Scholar] [CrossRef]
- Parrott, A.; Morinan, A.; Moss, M.; Scholey, A. Understanding Drugs and Behaviour; John Wiley & Sons Ltd.: Chichester, West Sussex, UK, 2005. [Google Scholar]
- Farquhar, K.; Lambert, K.; Drummond, G.B.; Tiplady, B.; Wright, P. Effect of ethanol on psychomotor performance and on risk taking behaviour. J. Psychopharmacol. 2002, 16, 379–384. [Google Scholar] [CrossRef] [PubMed]
- Maylor, E.A.; Rabbitt, P. Alcohol, reaction time and memory: A meta-anlysis. Br. J. Psychol. 1993, 84, 301–317. [Google Scholar] [CrossRef] [PubMed]
- Mackay, M.; Tiplady, B.; Scholey, A.B. Interactions between alcohol and caffeine in relation to psychomotor speed and accuracy. Hum. Psychopharmacol. 2002, 17, 151–156. [Google Scholar] [CrossRef]
- Van Schrojenstein Lantman, M.; Mackus, M.; van de Loo, A.J.A.E.; Verster, J.C. The impact of alcohol hangover symptoms on cognitive and physical functioning, and mood. Hum. Psychopharmacol. 2017, 32. [Google Scholar] [CrossRef] [PubMed]
- Verster, J.C.; van Duin, D.; Volkerts, E.R.; Schreuder, A.H.; Verbaten, M.N. Alcohol hangover effects on memory functioning and vigilance performance after an evening of binge drinking. Neuropsychopharmacology 2003, 28, 740–746. [Google Scholar] [CrossRef] [PubMed]
- Gunn, C.; Mackus, M.; Griffin, C.; Munafò, M.R.; Adams, S. A systematic review of the next-day effects of heavy alcohol consumption on cognitive performance. Addiction 2018, 113, 2182–2193. [Google Scholar] [CrossRef] [PubMed]
- Verster, J.C.; Bervoets, A.C.; de Klerk, S.; Vreman, R.A.; Olivier, B.; Roth, T.; Brookhuis, K.A. Effects of alcohol hangover on simulated highway driving performance. Psychopharmacology 2014, 231, 2999–3008. [Google Scholar] [CrossRef]
- Centers for Disease Control and Prevention. The Cost of Excessive Alcohol Use. 2015. Available online: www.cdc.gov/alcohol/onlinemedia/infographics/cost-excessive-alcohol-use.html (accessed on 10 February 2019).
- McKinney, A.; Coyle, K.; Penning, R.; Verster, J.C. Next day effects of naturalistic alcohol consumption on tasks of attention. Hum. Psychopharmacol. 2012, 27, 587–594. [Google Scholar] [CrossRef]
- Penning, R.; McKinney, A.; Bus, L.D.; Olivier, B.; Slot, K.; Verster, J.C. Measurement of alcohol hangover severity: Development of the Alcohol Hangover Severity Scale (AHSS). Psychopharmacology 2013, 225, 803–810. [Google Scholar] [CrossRef] [PubMed]
- McKinney, A.; Coyle, K. Next-day effects of alcohol and an additional stressor on memory and psychomotor performance. J. Stud Alcohol Drugs 2007, 68, 446–454. [Google Scholar] [CrossRef] [PubMed]
- McKinney, A.; Coyle, K. Next day effects of a normal night’s drinking on memory and psychomotor performance. Alcohol Alcohol. 2004, 39, 509–513. [Google Scholar] [CrossRef]
- Collins, W.E.; Chiles, W.D. Laboratory performance during acute alcohol intoxication and hangover. Hum. Factors 1980, 22, 445–462. [Google Scholar] [CrossRef]
- Kelly, M.; Myrsten, A.-L.; Neri, A.; Rydberg, U. Effects and after-effects of alcohol on psychological functions in man—A controlled study. Blutalkohol 1970, 7, 422–436. [Google Scholar]
- Kruisselbrink, L.D.; Martin, K.L.; Megeney, M.; Fowles, J.R.; Murphy, R.J. Physical and psychomotor functioning of females the morning after consuming low to moderate quantities of beer. J. Stud. Alcohol 2006, 7, 416–420. [Google Scholar] [CrossRef]
- Heffernan, T.M.; Jarvis, H.; Rodgers, J.; Scholey, A.B.; Ling, J. Prospective memory, everyday cognitive failure and central executive function in recreational users of Ecstasy. Hum. Psychopharmacol. 2001, 16, 607–612. [Google Scholar] [CrossRef] [PubMed]
- Parrott, A.C.; Buchanan, T.; Scholey, A.B.; Heffernan, T.; Ling, J.; Rodgers, J. Ecstasy/MDMA attributed problems reported by novice, moderate and heavy recreational users. Hum. Psychopharmacol. 2002, 17, 309–312. [Google Scholar] [CrossRef] [PubMed] [Green Version]
- Parrott, A.C.; Rodgers, J.; Buchanan, T.; Ling, J.; Heffernan, T.; Scholey, A.B. Dancing hot on Ecstasy: Physical activity and thermal comfort ratings are associated with the memory and other psychobiological problems reported by recreational MDMA users. Hum. Psychopharmacol. 2006, 21, 285–298. [Google Scholar] [CrossRef]
- Rodgers, J.; Buchanan, T.; Scholey, A.B.; Heffernan, T.M.; Ling, J.; Parrott, A. Differential effects of Ecstasy and cannabis on self-reports of memory ability: A web-based study. Hum. Psychopharmacol. 2001, 16, 619–625. [Google Scholar] [CrossRef]
- Rodgers, J.; Buchanan, T.; Scholey, A.B.; Heffernan, T.M.; Ling, J.; Parrott, A.C. Patterns of drug use and the influence of gender on self-reports of memory ability in ecstasy users: A web-based study. J. Psychopharmacol. 2003, 17, 389–396. [Google Scholar] [CrossRef]
- Scholey, A.B.; Parrott, A.C.; Buchanan, T.; Heffernan, T.M.; Ling, J.; Rodgers, J. Increased intensity of Ecstasy and polydrug usage in the more experienced recreational Ecstasy/MDMA users: A WWW study. Addict. Behav. 2004, 29, 743–752. [Google Scholar] [CrossRef] [PubMed] [Green Version]
- Verster, J.C.; Benson, S.; Scholey, A. Motives for mixing alcohol with energy drinks and other nonalcoholic beverages, and consequences for overall alcohol consumption. Int. J. Gen. Med. 2014, 7, 285. [Google Scholar] [CrossRef] [PubMed]
- Scholey, A.B.; Fowles, K.A. Retrograde enhancement of kinesthetic memory by alcohol and by glucose. Neurobiol. Learn. Mem. 2002, 78, 477–483. [Google Scholar] [CrossRef] [PubMed]
- Scholey, A.; Benson, S.; Stough, C.; Stockley, C. Effects of resveratrol and alcohol on mood and cognitive function in older individuals. Nutr. Aging 2014, 2, 133–138. [Google Scholar]
- Devilly, G.J.; Allen, C.; Brown, K. SmartStart: Results of a large point of entry study into preloading alcohol and associated behaviours. Int. J. Drug Policy 2017, 43, 130–139. [Google Scholar] [PubMed]
- Devilly, G.J.; Hides, L.; Kavanagh, D.J. A Big Night out Getting Bigger: Alcohol Consumption, Arrests and Crowd Numbers, before and after Legislative Change. PLoS ONE 2019. submitted for publication. [Google Scholar]
- Tombaugh, T.N. Trail Making Test A and B: Normative data stratified by age and education. Arch. Clin. Neuropsychol. 2004, 19, 203–214. [Google Scholar] [CrossRef] [Green Version]
- Bowie, C.R.; Harvey, P.D. Administration and interpretation of the Trail Making Test. Nat. Protoc. 2006, 1, 2277–2281. [Google Scholar] [PubMed]
- Sorbello, J.G.; Devilly, G.J.; Allen, C.; Hughes, L.R.J.; Brown, K. Fuel-cell breathalyser use for field research on alcohol intoxication: An independent psychometric evaluation. PeerJ 2018, 6, e4418. [Google Scholar] [CrossRef] [PubMed]
- Fernandez, A.L.; Marcopulos, B.A. A comparison of normative data for the Trail Making Test from several countries: Equivalence of norms and considerations for interpretation. Scand. J. Psychol. 2008, 49, 239–246. [Google Scholar] [CrossRef]
- Rohsenow, D.J.; Howland, J. The role of beverage congeners in hangover and other residual effects of alcohol intoxication: A review. Curr. Drug Abuse Rev. 2010, 3, 76–79. [Google Scholar] [PubMed]
- Köchling, J.; Geis, B.; Wirth, S.; Hensel, K.O. Grape or grain but never the twain? A randomized controlled multiarm matched-triplet crossover trial of beer and wine. Am. J. Clin. Nutr. 2019, 109, 345–352. [Google Scholar]
- Benson, S.; Tiplady, B.; Scholey, A. Attentional and working memory performance following alcohol and energy drink: A randomised, double-blind, placebo-controlled, factorial design laboratory study. PLoS ONE 2019. [Google Scholar] [CrossRef]
- Stephens, R.; Ling, J.; Heffernan, T.M.; Heather, N.; Jones, K. Review A review of the literature on the cognitive effects of alcohol hangover. Alcohol Alcohol. 2008, 43, 163–170. [Google Scholar] [CrossRef]
- Grange, J.A.; Stephens, R.; Jones, K.; Owen, L. The effect of alcohol hangover on choice response time. J. Psychopharmacol. 2016, 30, 654–661. [Google Scholar] [CrossRef] [PubMed] [Green Version]


| N | 105 |
|---|---|
| Males/Females (%) | 51.4/48.6 |
| Age | 24.7 (17–49) years |
| Weight | 74.0 (43–115) kg |
| BMI | 24.15 (16.58–40.28) |
| N | Mean | SD | Max | |
|---|---|---|---|---|
| Drinks consumed | ||||
| Beer/cider | 59 | 7.16 | 5.86 | 30 |
| Wine | 31 | 5.68 | 4.56 | 20 |
| Shots (unmixed) | 43 | 3.51 | 3.21 | 16 |
| Alcohol mixed with Energy Drink | 30 | 2.87 | 1.98 | 8 |
| Alcohol mixed with Other Beverage | 83 | 7.27 | 5.80 | 40 |
| Total | 105 | 13.48 | 5.94 | 35 |
| Drinking measures | ||||
| BAC (%) | - | 0.110 | 0.040 | 0.25 |
| Hours drinking | - | 7.45 | 4.09 | 17 |
| BAC (%) | Time Drinking (h) | HSS Score | Standard Drinks (N) | Beer/Cider (N) | Wine (N) | Shots (N) | AMED (N) | AMOB (N) | |
|---|---|---|---|---|---|---|---|---|---|
| N | 105 | 105 | 105 | 102 | 59 | 31 | 43 | 30 | 83 |
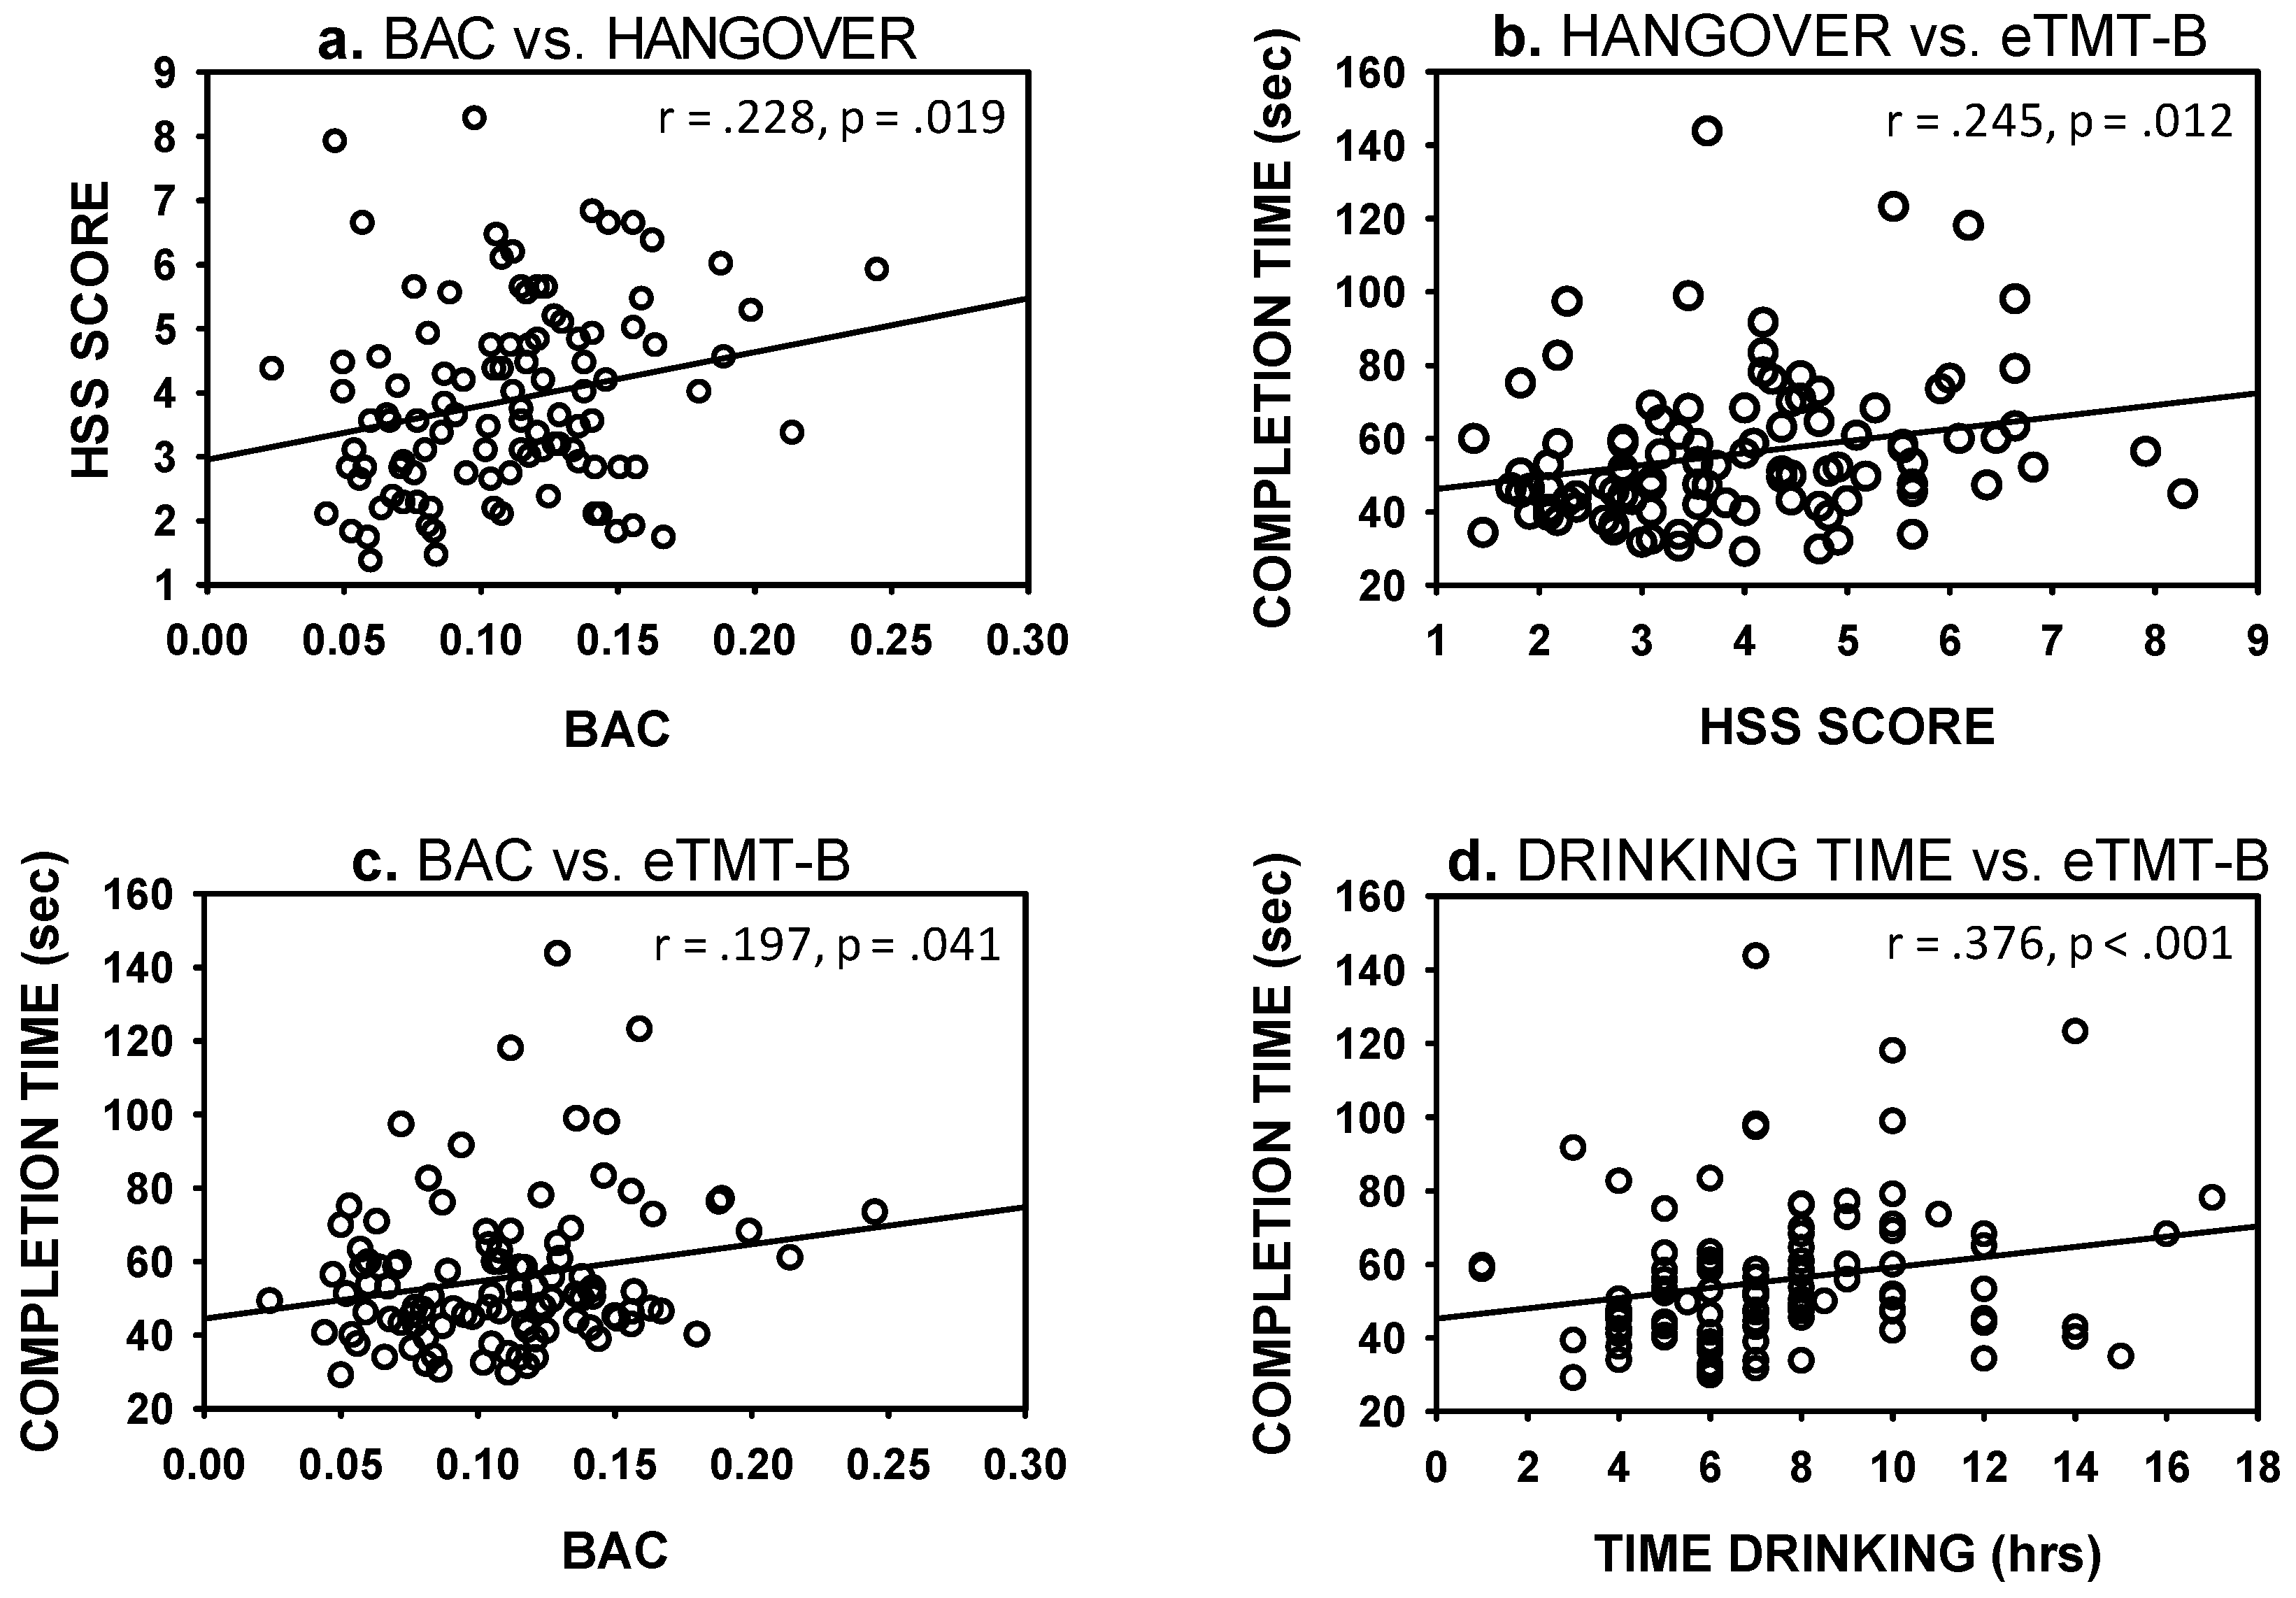
| BAC (%) | - | 0.376 *** | 0.228 * | 0.486 *** | 0.361 ** | 0.398 * | −0.028 | −0.099 | 0.228 * |
| Time drinking (h) | - | - | 0.148 | 0.633 *** | 0.503 *** | 0.223 | 0.166 | 0.068 | 0.257 * |
| HSS score | - | - | - | 0.184 | 0.171 | 0.293 | −0.010 | 0.019 | 0.018 |
| Standard drinks (N) | - | - | - | - | 0.623 *** | 0.437 * | 0.249 | 0.360 | 0.369 ** |
| Beer/cider (N) | - | - | - | - | - | −0.388 | −0.047 | 0.033 | −0.255 |
| Wine (N) | - | - | - | - | - | - | −0.131 | 0.162 | −0.284 |
| Shots (N) | - | - | - | - | - | - | - | 0.102 | −0.067 |
| AMED (N) | - | - | - | - | - | - | - | - | −0.023 |
© 2019 by the authors. Licensee MDPI, Basel, Switzerland. This article is an open access article distributed under the terms and conditions of the Creative Commons Attribution (CC BY) license (http://creativecommons.org/licenses/by/4.0/).
Share and Cite
Scholey, A.; Benson, S.; Kaufman, J.; Terpstra, C.; Ayre, E.; Verster, J.C.; Allen, C.; Devilly, G.J. Effects of Alcohol Hangover on Cognitive Performance: Findings from a Field/Internet Mixed Methodology Study. J. Clin. Med. 2019, 8, 440. https://doi.org/10.3390/jcm8040440
Scholey A, Benson S, Kaufman J, Terpstra C, Ayre E, Verster JC, Allen C, Devilly GJ. Effects of Alcohol Hangover on Cognitive Performance: Findings from a Field/Internet Mixed Methodology Study. Journal of Clinical Medicine. 2019; 8(4):440. https://doi.org/10.3390/jcm8040440
Chicago/Turabian StyleScholey, Andrew, Sarah Benson, Jordy Kaufman, Chantal Terpstra, Elizabeth Ayre, Joris C. Verster, Cory Allen, and Grant J. Devilly. 2019. "Effects of Alcohol Hangover on Cognitive Performance: Findings from a Field/Internet Mixed Methodology Study" Journal of Clinical Medicine 8, no. 4: 440. https://doi.org/10.3390/jcm8040440