1. Introduction
Piglets raised in a group is the mainstream form of livestock feeding at present, which can avoid chronic stress injury of confined pigs [
1]. Piglets reared in a group have distinct activity and excretion areas and form their behaviors in fixed areas, such as lying down, excretion, and feeding [
2,
3,
4]. Excessive activity density of piglets will affect the functional zoning of their activity and excretion spaces, which leads to sanitary pollution of piggery [
5,
6]. Therefore, optimizing the activity area of piglets is helpful in the optimization of piggery and the welfare feeding of pigs [
7,
8]. The behavior trajectory tracking of piglets is directly related to their activity range and behavior expression. The accuracy of tracking multiple behavior trajectories must be high in a piggery with a relatively narrow space. Accurately realizing multi-objective behavior tracking of piglets and solving the difficulties of multi-objective track loss, drift, and redundancy are the focus of this study.
Behavior recognition mainly focuses on the identification of specific behaviors of individual pigs, such as movement behavior [
9], aggressive behavior [
10], biting behavior [
11], lying behavior [
12], and exploration behavior [
13]. Research on pigs in a group mainly focuses on the identification and positioning of pigs, such as target segmentation [
14], individual identification and counting [
15], and aggressive behavior identification [
16]. Studies from the perspective of tracking different behaviors of pigs and analyzing their activity areas are rare. In recent years, machine vision and deep learning technology have been widely applied in the analysis of pigs’ activity [
17,
18]. Gao et al. [
19] studied the movement trajectory tracking of pigs in a group based on head and tail positioning, corrected the positioning accuracy of head and tail with the motion trend algorithm, and generated the movement trajectory. It provided a new way to analyze the herd behavior, but the recognition rate was only 79.67%. Kashiha et al. [
20] analyzed movement trajectories of pigs in a group by image histogram matching and elliptical approximation, but the recognition accuracy was overly dependent on the results of image segmentation. Zheng et al. [
21] used depth image and Faster R-CNN to realize automatic recognition of sows’ posture and position in the pen, and they obtained the position distribution of sows in 24 h. This study laid a technical foundation for position recognition and distribution in the pen of pigs, but the depth map was relatively high cost. DeepLabCut (DLC) [
22] has been used for the pose estimation of experimental animals (mice, fruit flies) under high-definition video because of its advantages of robust model and small sample labeling [
23,
24]. The multi-target tracking accuracy of this algorithm could reach more than 95% [
25], and the operating efficiency was also improved, which provided a feasible scheme for behavior trajectory tracking of piglets.
Trajectory tracking mainly utilizes Wi-Fi and GPS devices to capture human behavior, unmanned aerial vehicle (UAV) path, and navigation trajectories [
26]. Problems of trajectory redundancy and drift always exist. Commonly used technologies in dynamic trajectory correction include Kalman and particle filters [
27], which produces problems of low precision and filter divergence. Li et al. [
28] used a multiple regression model to fit position information and completed detection of aircraft abnormal trajectory based on the statistical method. Yin et al. [
29] used a convolutional neural network for anomaly detection and extracted low-level time features through a two-level sliding window to improve the classification performance of time series and the effect of anomaly detection. Zheng et al. [
30] proposed the gathering mode and used the linear interpolation method to improve the problem of missing data. He et al. [
31] proposed a mining algorithm based on elastic distributed data set RDD-gathering and R-tree index to realize the trajectory aggregation mode and solve the problem of large-scale trajectory data analysis. However, the feature description ability of the abovementioned algorithm was weakened when processing the behavior trajectory with nonlinear characteristics. Based on kernel principal component analysis (KPCA) [
32], this study introduced a high-dimensional spatiotemporal feature model to solve the nonlinear feature description problem of piglets. This algorithm could realize the dimension reduction of the features and provide a feasible solution for the correction of the abnormal trajectory of piglets. In summary, the main problems solved in this study are as follows:
(1) Sparse representation of individual behavior trajectories of piglets could reduce the amount of data calculation and improve the calculation efficiency;
(2) Behavior trajectory tracking accuracy and abnormal trajectory correction of piglets;
(3) The individual trajectories of piglets were analyzed, and the thermal map of trajectory distribution was established to obtain the four major activity areas of the piggery (resting, drinking, excretion, and feeding areas). It provided support for the optimal planning of piggery spatial distribution and welfare feeding.
In this study, we introduce a novel method for target tracking and trajectory correcting based on DLC-KPCA to overcome the abovementioned issues. The rest of the paper is organized as follows. The architecture of our method is described in
Section 2. The results and discussion are demonstrated in
Section 3 and
Section 4. The conclusion and future perspective are presented in
Section 5.
2. Materials and Methods
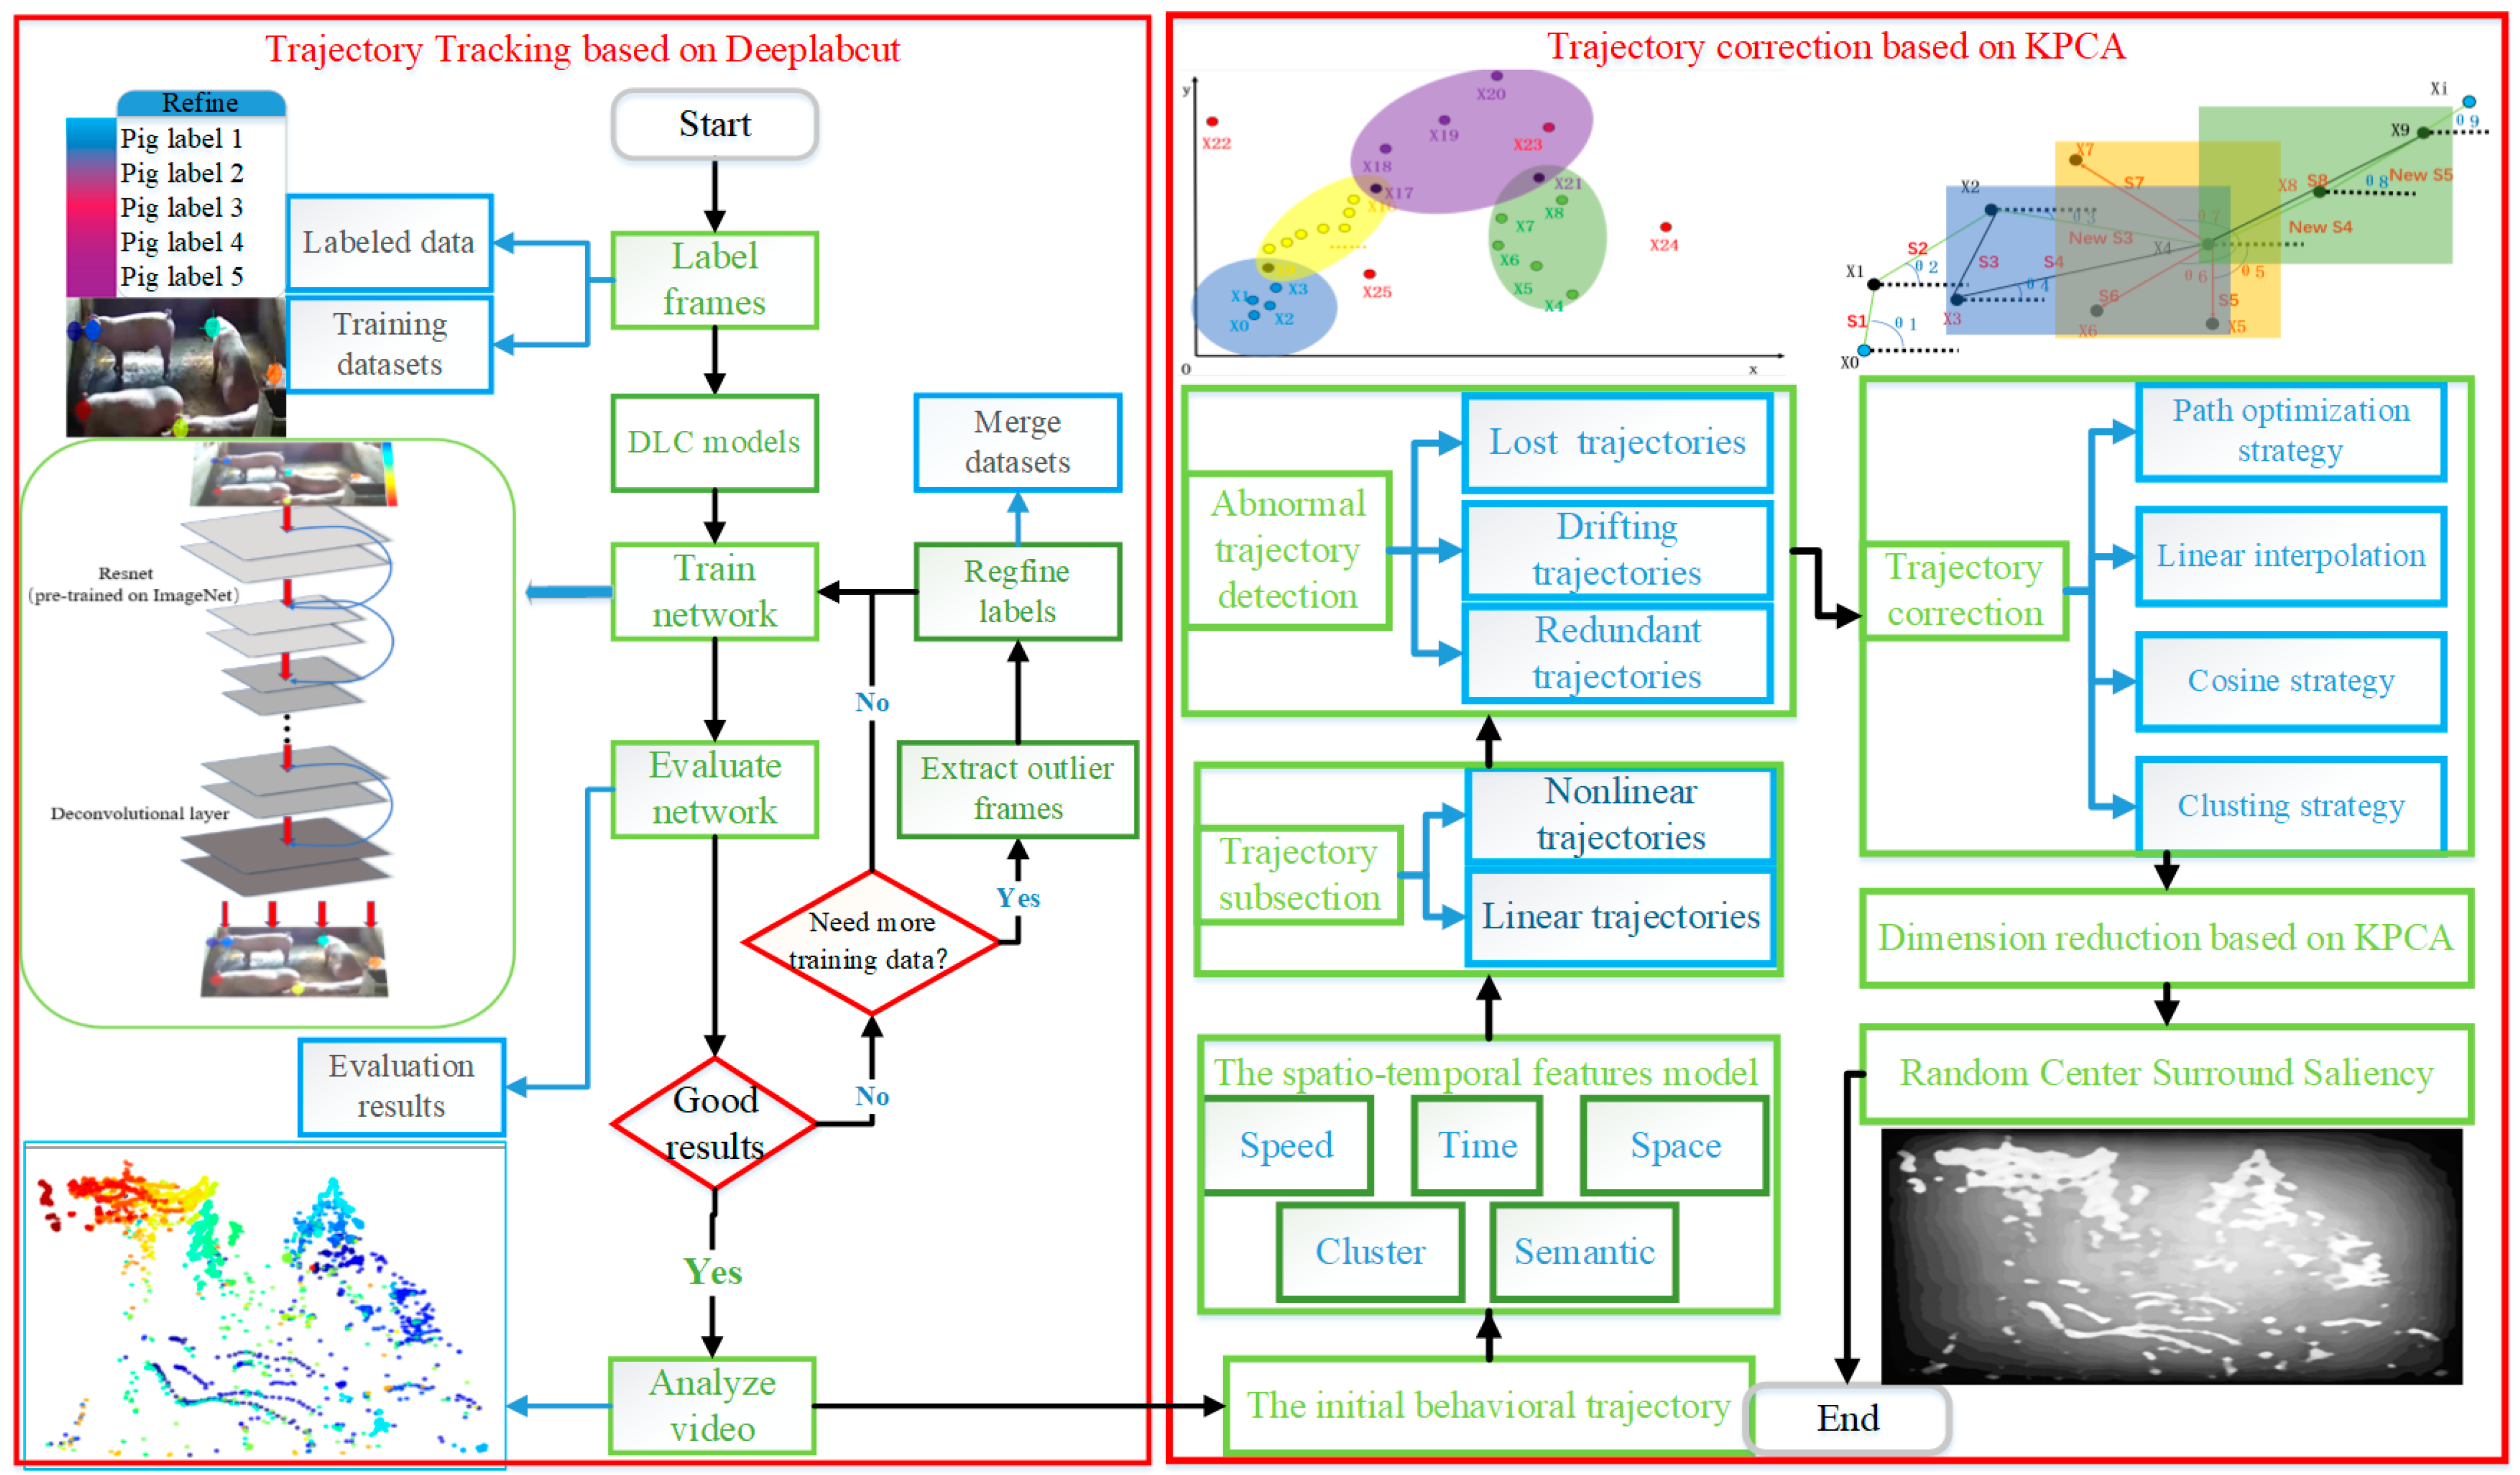
A multi-objective individual trajectory tracking model based on DLC was established to solve the problem of piglets’ behavior trajectory tracking. The robustness and generalization ability of the algorithm were improved to achieve multi-objective all-weather behavior trajectory tracking of piglets. Then, a high-dimensional spatiotemporal feature model was established based on KPCA to achieve the optimal clustering of nonlinear multi-target behavior trajectory. In addition, a trajectory correction model was established from five dimensions (semantic, space, angle, time, and velocity) for trajectory loss and drift. Finally, individual trajectories of piglets were analyzed, and thermal maps of trajectories were established to obtain four major activity areas of the piggery: resting, drinking, excretion, and feeding areas. The technical route is shown in .
Figure 1.
Method steps in this study.
2.1. Subject and Environment
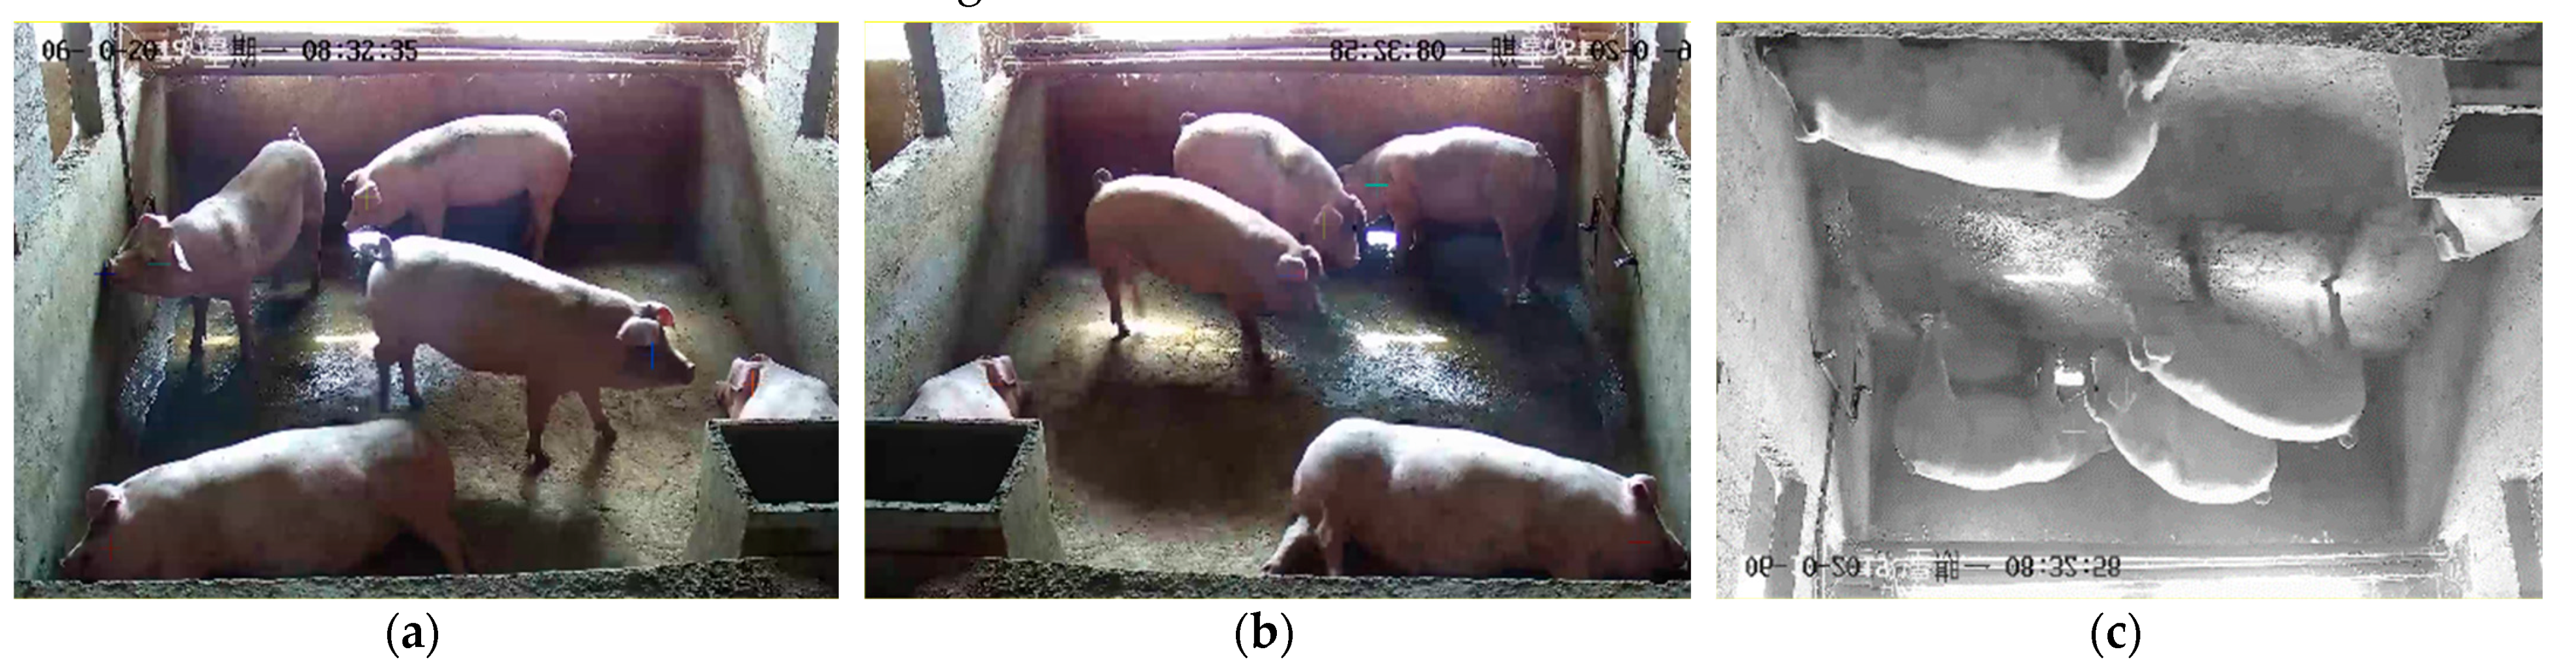
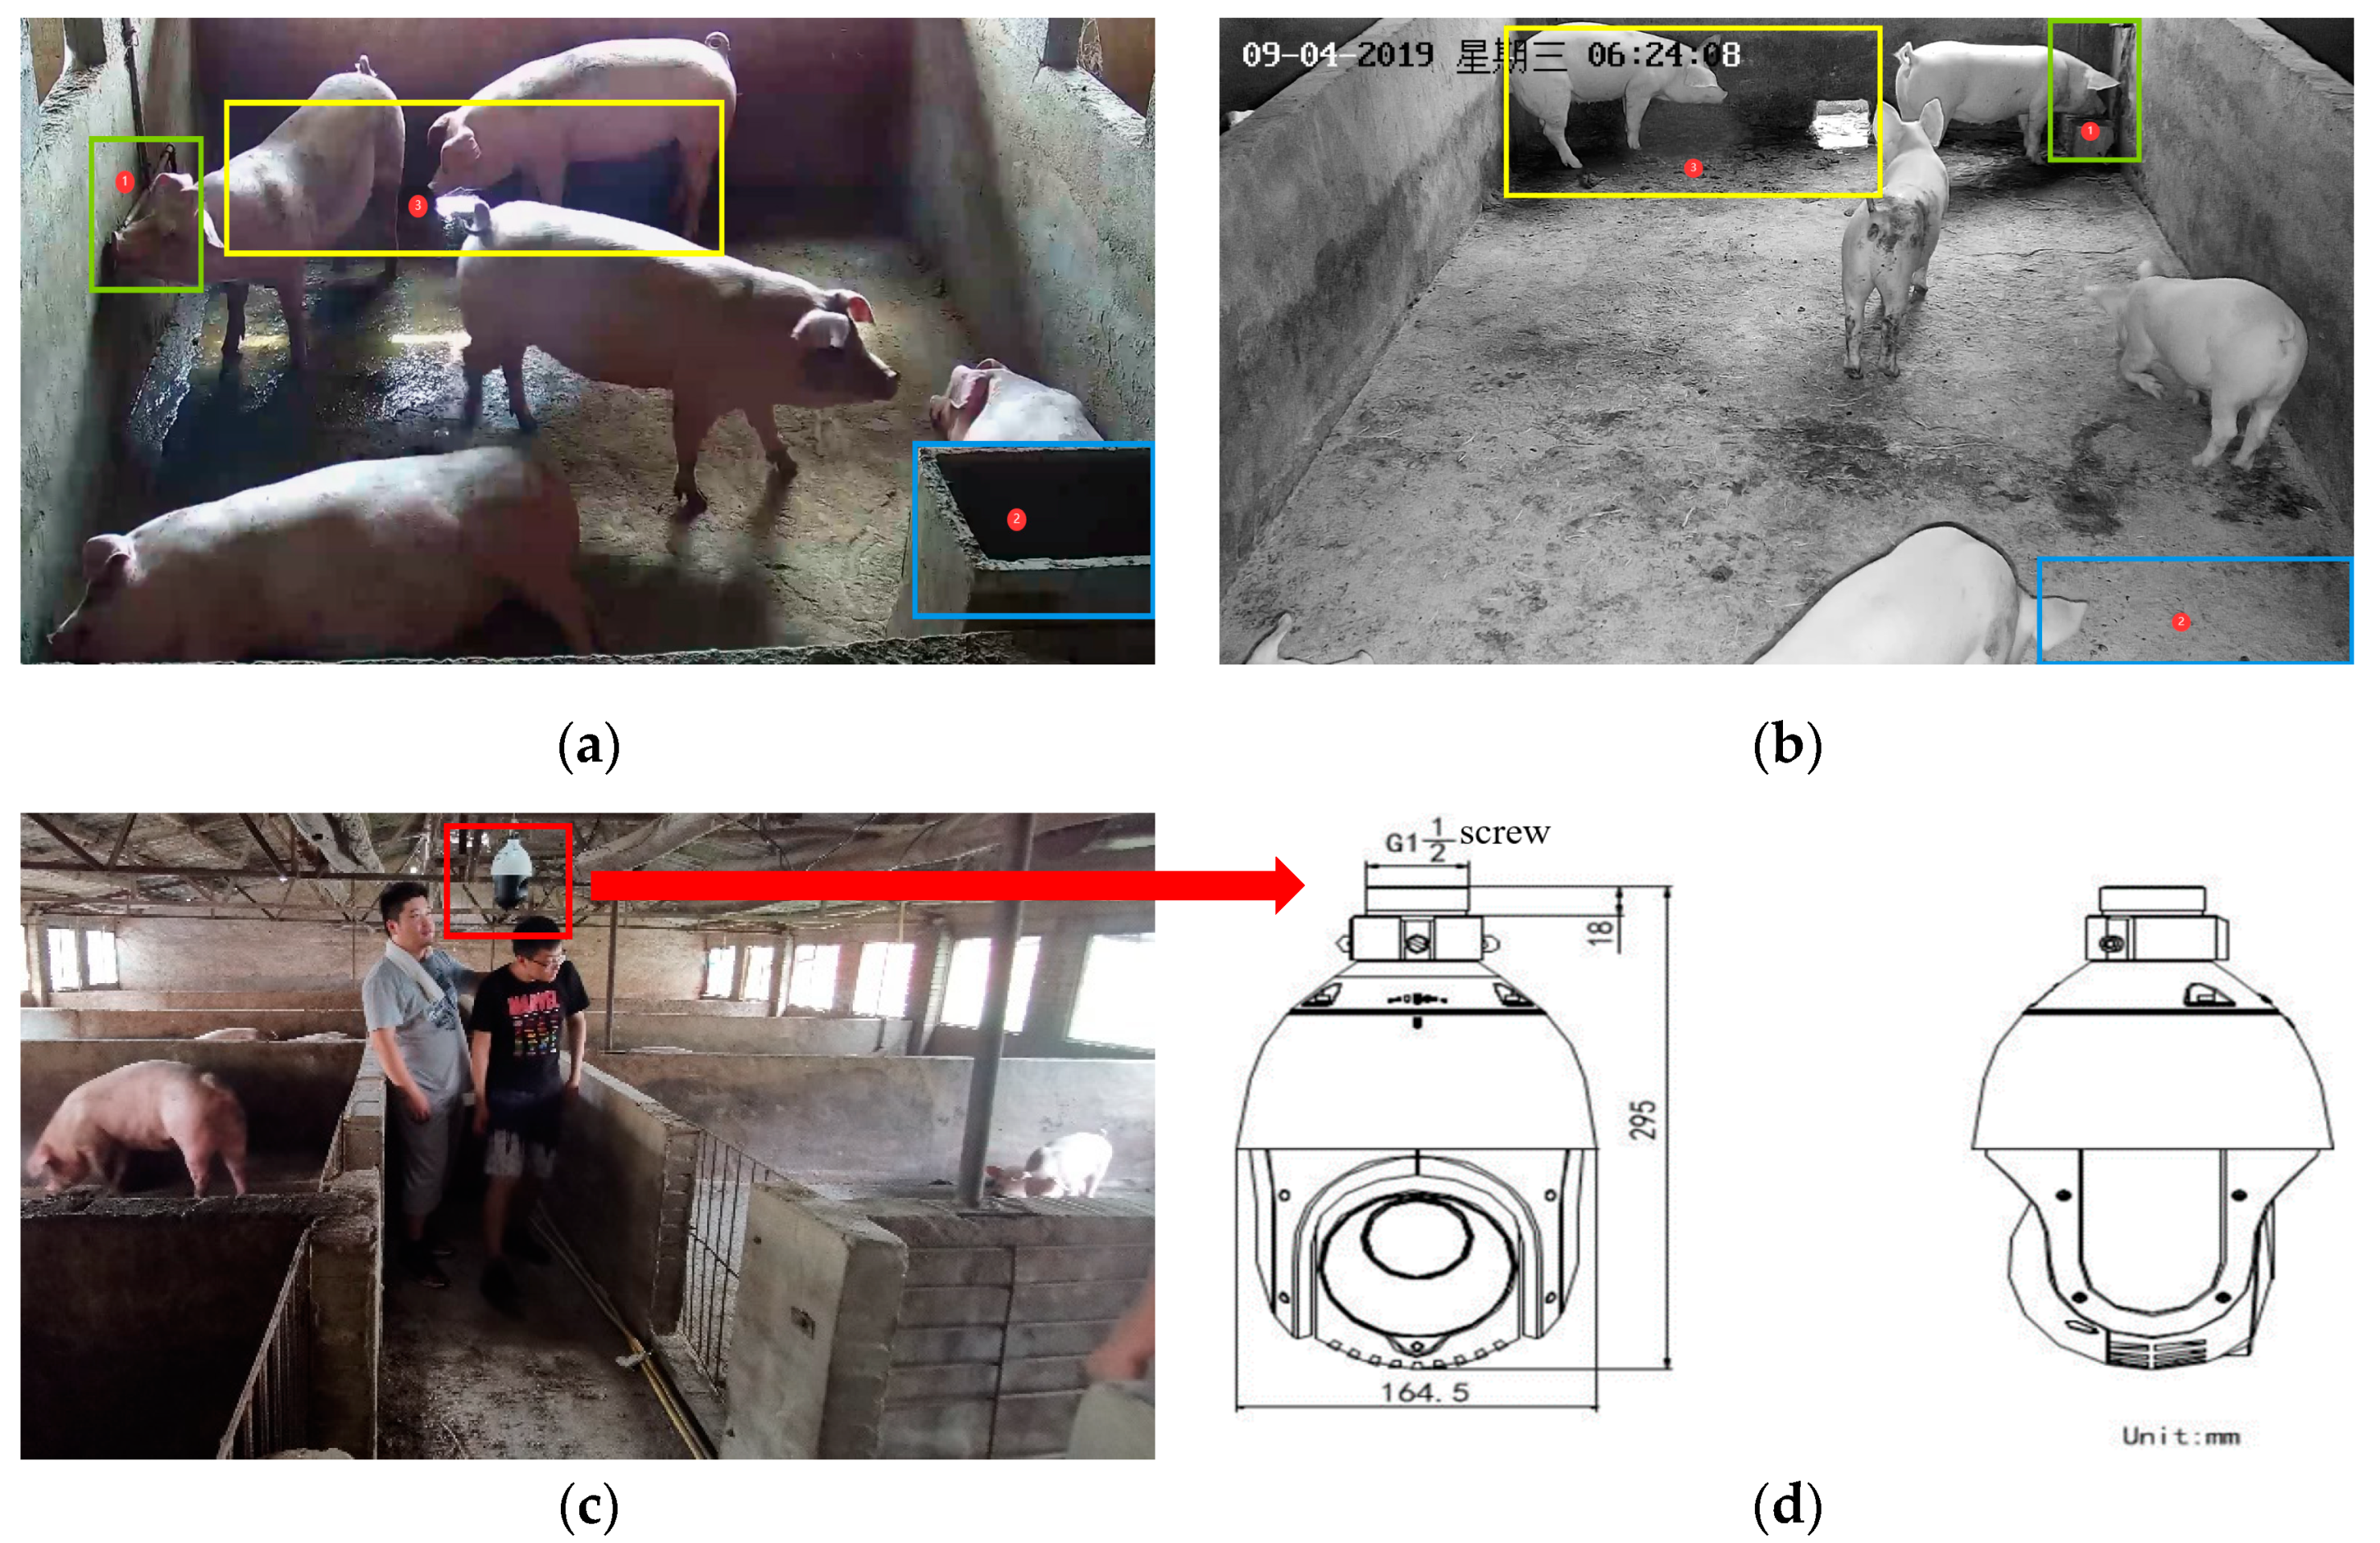
The video collection date was from May 2019 to November 2019. The collection location included large-scale farms in Qingdao, Shandong Province, China. In this study, 200 sets of videos (10 min for each episode) were selected from all-weather scenes for data research. The piglets could eat and defecate at will, which ensured the adaptability of the algorithm to the real environment. In this work, OpenCV3.4.9 (Platform for Visual Studio 2015) and PyCharm were selected as programming tools to realize the video tracking experiment of behavior. The desktop computer was configured as Intel(R) Core (TM) i7-7700 CPU @3.60 GHz *8, 16 GiB DDR, Ubuntu18.04.2 (64 bit). The pigs were 80-day weaned Yorkshire piglets. The video scene is shown in . a is that for piglets in group (80-day weaned) in the pen (4 m × 4 m) during the day, which was divided into drinking area, eating area, excretion area and other areas. b is that for piglets in group (80-day weaned) in the pen (4 m × 4 m) at night, which were laid out differently. As we see, (1) is the drinker, (2) is the feeder, and (3) is the excretion area. We selected lateral shoot in c to collect data on the pigpen environment and all the features of piglets clearly. In d, a Hikvision smart ball camera (DS-2DE4320IW-DEDS-2DE4320IW-D) was made in Hangzhou, China, which had 3 million pixels and 20 × optical zoom. Its infrared radiation at night could reach 100 m.
Figure 2.
Video capture scene. (a) Piggery during the day; (b) another piggery at night; (c) camera position; (d) camera parameters.
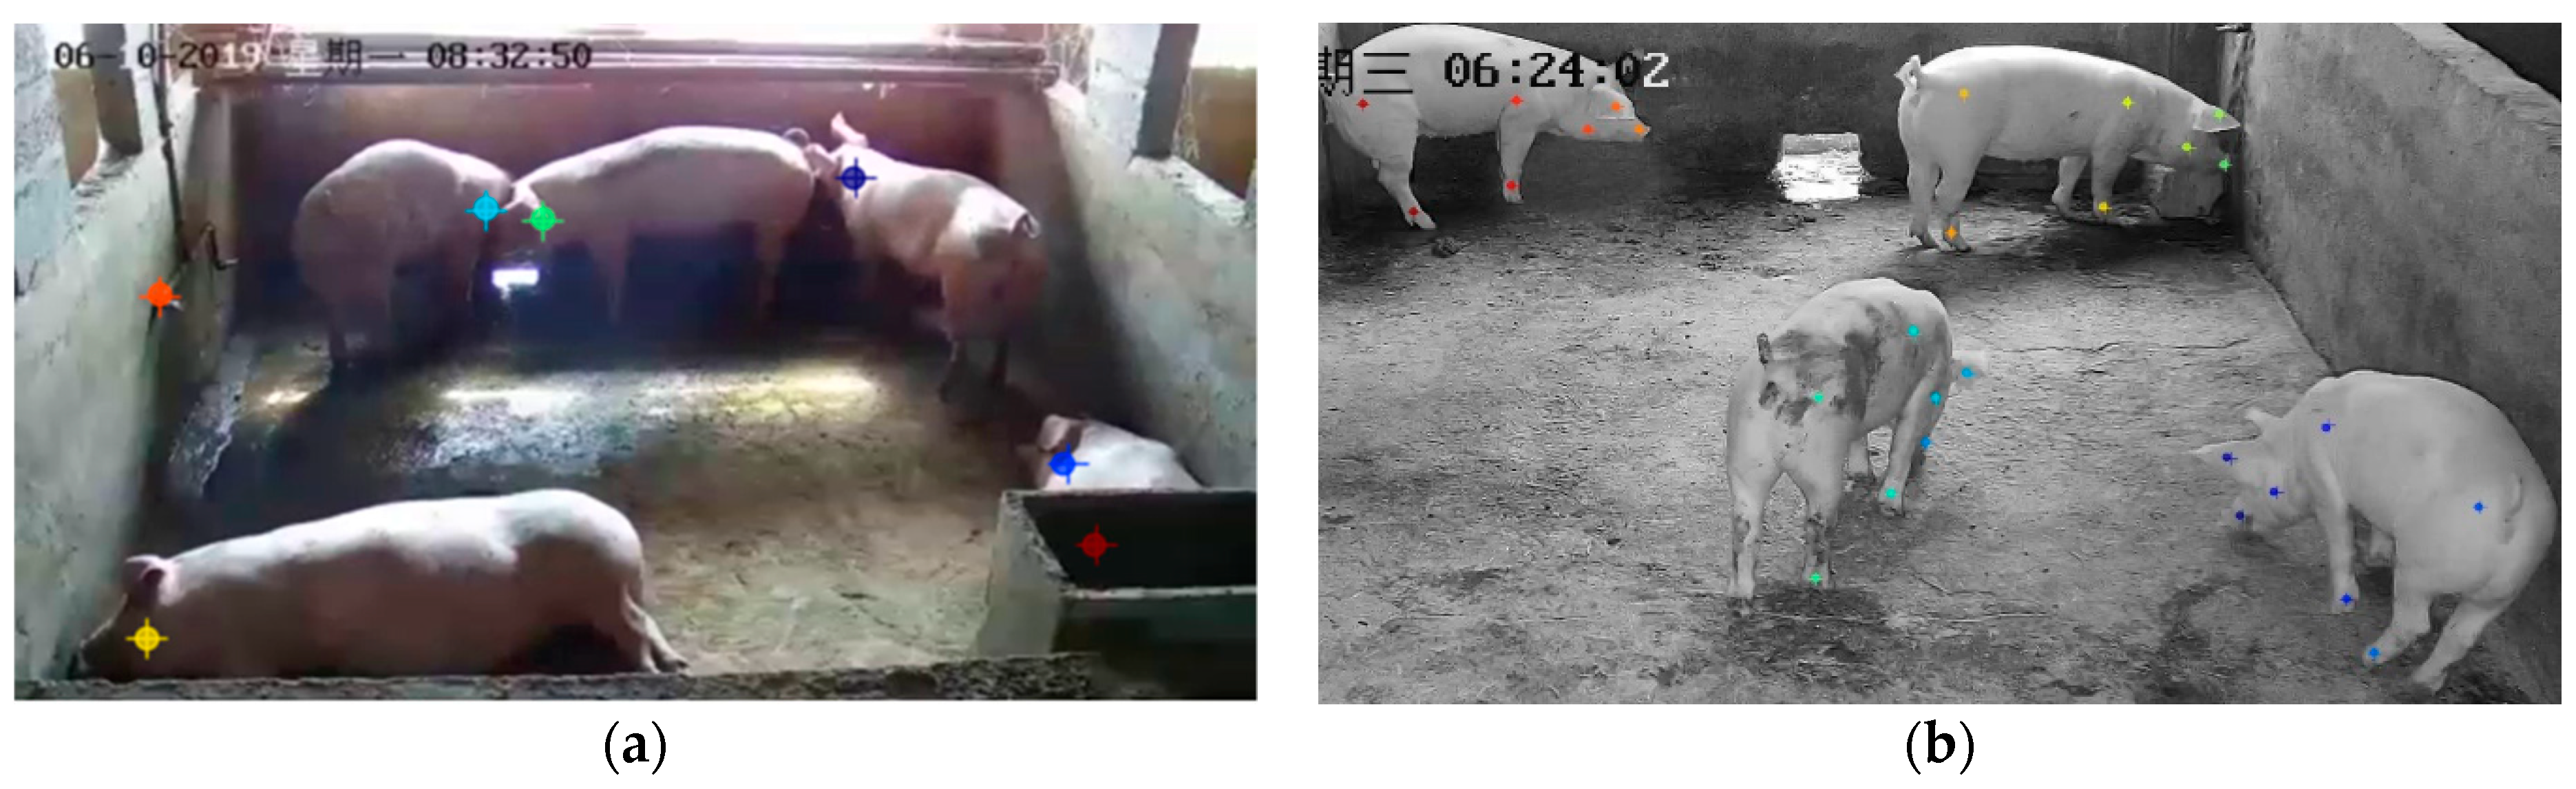
In this paper, SIFT (Scale Invariant Feature Transform) feature descriptors were used to analyze the features of video images, and the results are shown in . The environment of the piggery is a complex background with light-dark effects and dry-wet ground, which led to obvious noise and redundancy information in the video data, as shown in a. In addition, the behavior trajectories of piglets in the day are complex and varied, with serious interaction scenes such as occlusion and ghosting, as shown in b.
Figure 3.
Video feature analysis based on Scale Invariant Feature Transform. (a) Feature extraction; (b) image analysis.
In the current study, 5000 videos of pigs were collected. We intercepted the key videos to reduce the amount of data training, and 800 sets (1000–5000 frames per set) were selected as the training set. A total of 200 sets were selected as the verification set, which had different interference factors, such as occlusion, darkness, and blur, for analyzing the robustness of a model. The data sets presented in this paper were representative, which covered multi-target piglets during the day and at night.
2.2. Behavior Trajectory Tracking Model Based on DLC
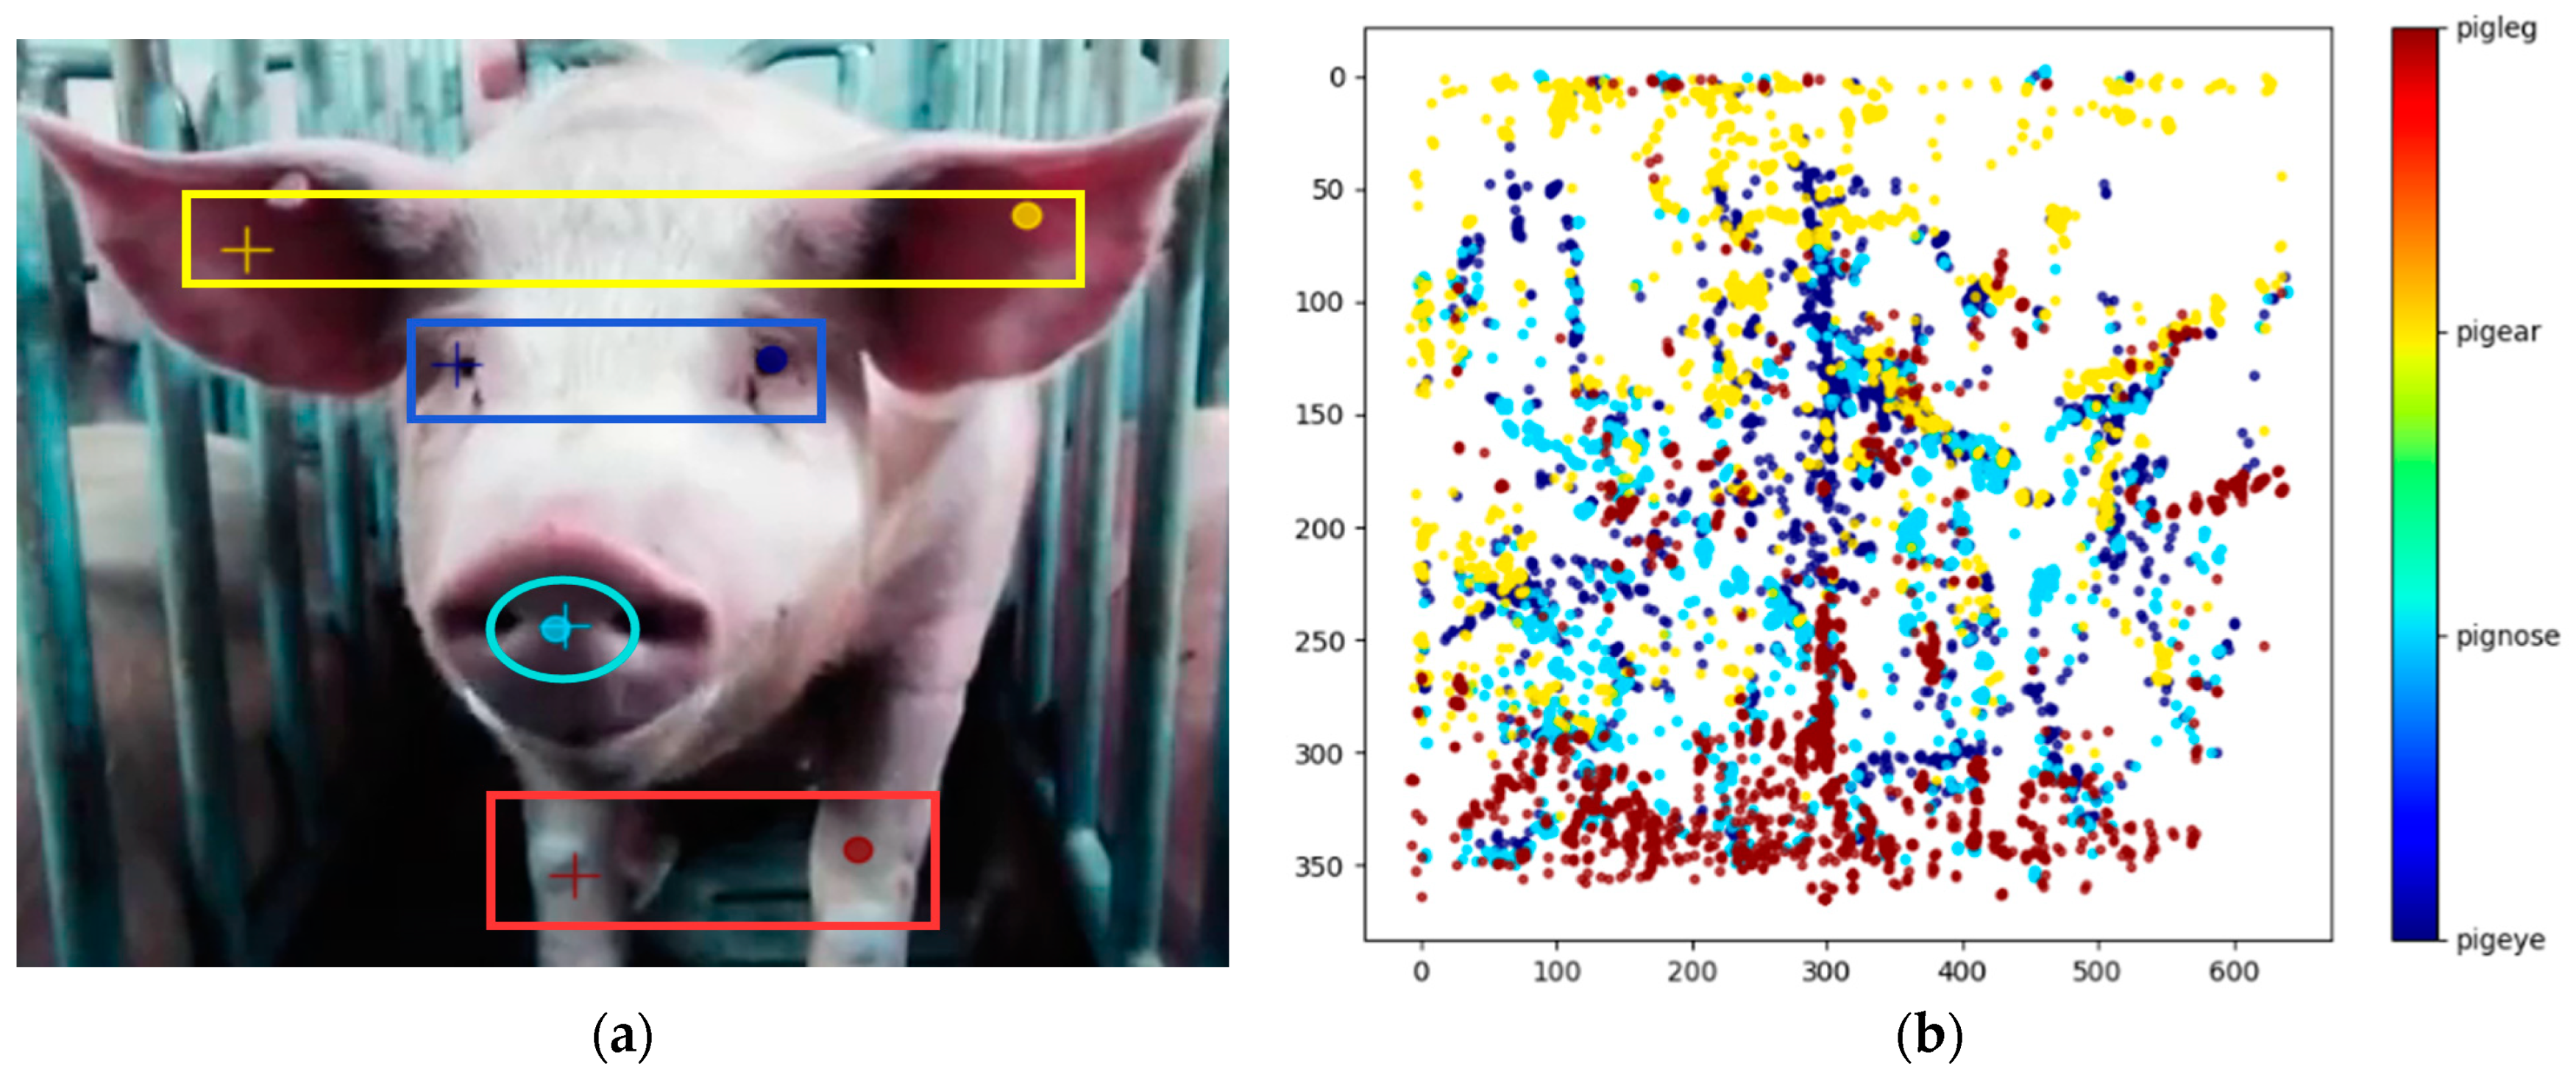
The neural network used in DLC is very good at multi-target tracking, but the application scenarios are still relatively simple. At present, the movement of high-definition animals in the laboratory environment is mostly captured, which has a poor effect on complex scenes such as occlusion and blur. It also still requires the manual marking of hundreds or dozens of frames and takes a long time to train the model. Thus, it still needs to be optimized to solve the problem in this study. In the tracking of pig’s body, this algorithm still has problems such as tracking drift and loss, especially in the cognition of different parts of the same pig. Although the training and learning effect has been optimized, the key points such as ears, feet, and mouth are often confused, as shown in a. Problems such as breakpoint, loss, and drift also occur in the trajectory route, and the similarity correlation is low, as shown in b. Therefore, the algorithm was improved in this study to improve the robustness in piglets’ behavior trajectory tracking for achieving minimum frame marking and maximum tracking efficiency.
Figure 4.
Trajectory tracking error of DLC. (
a) is marked “

” to identify the main parts of the piglet, such as its eye, snout, ear, and leg, and the tracking results are marked as “

”; (
b) represents the video trajectory tracking results.
First, the labeling information should be enriched to improve the accuracy of the training model for reducing the number of manually labeled samples. In this study, only 5 frames of 5000 frames of video were manually marked as training samples. The labeled samples were preprocessed by matrix transformation including image flip, image rotation, and brightness enhancement. The number of tags was enlarged to the same as the traditional algorithm, which avoided the problem of poor representation of a small number of frames and reduced the dependency of manual tags. Accordingly, the accuracy of the model was improved, and the over-fitting was decreased. Sample pretreatment results are shown in .
Figure 5.
Sample preprocessing. (a) The labeled image; (b) image flip; (c) image rotation.
Second, this study conducted compression processing on labeled samples 1–2 times given the redundancy of high-definition video image information, and the labeled area was expanded, as shown in . This way not only ensured the invariance of scene semantics but also enriched the positive correlation information of training samples. The expansion of sampling points was helpful in reducing the drift displacement of the trajectory and assimilating abnormal trajectories.
Figure 6.
Sampling point modification. (a) The modified sample during the day; (b) the modified sample at night.
Third, the hard sample mining strategy was adopted to filter the easily classified samples, reduce the gap between similar samples, and increase the differences among various types of samples. The classification effect of the classifier would be improved. This study normalized the video size from 1920 × 1080 px to 480 × 270 px to improve efficiency and accuracy. The structure of the Resnet50 neural network is shown in .
Figure 7.
ResNet50 structure.
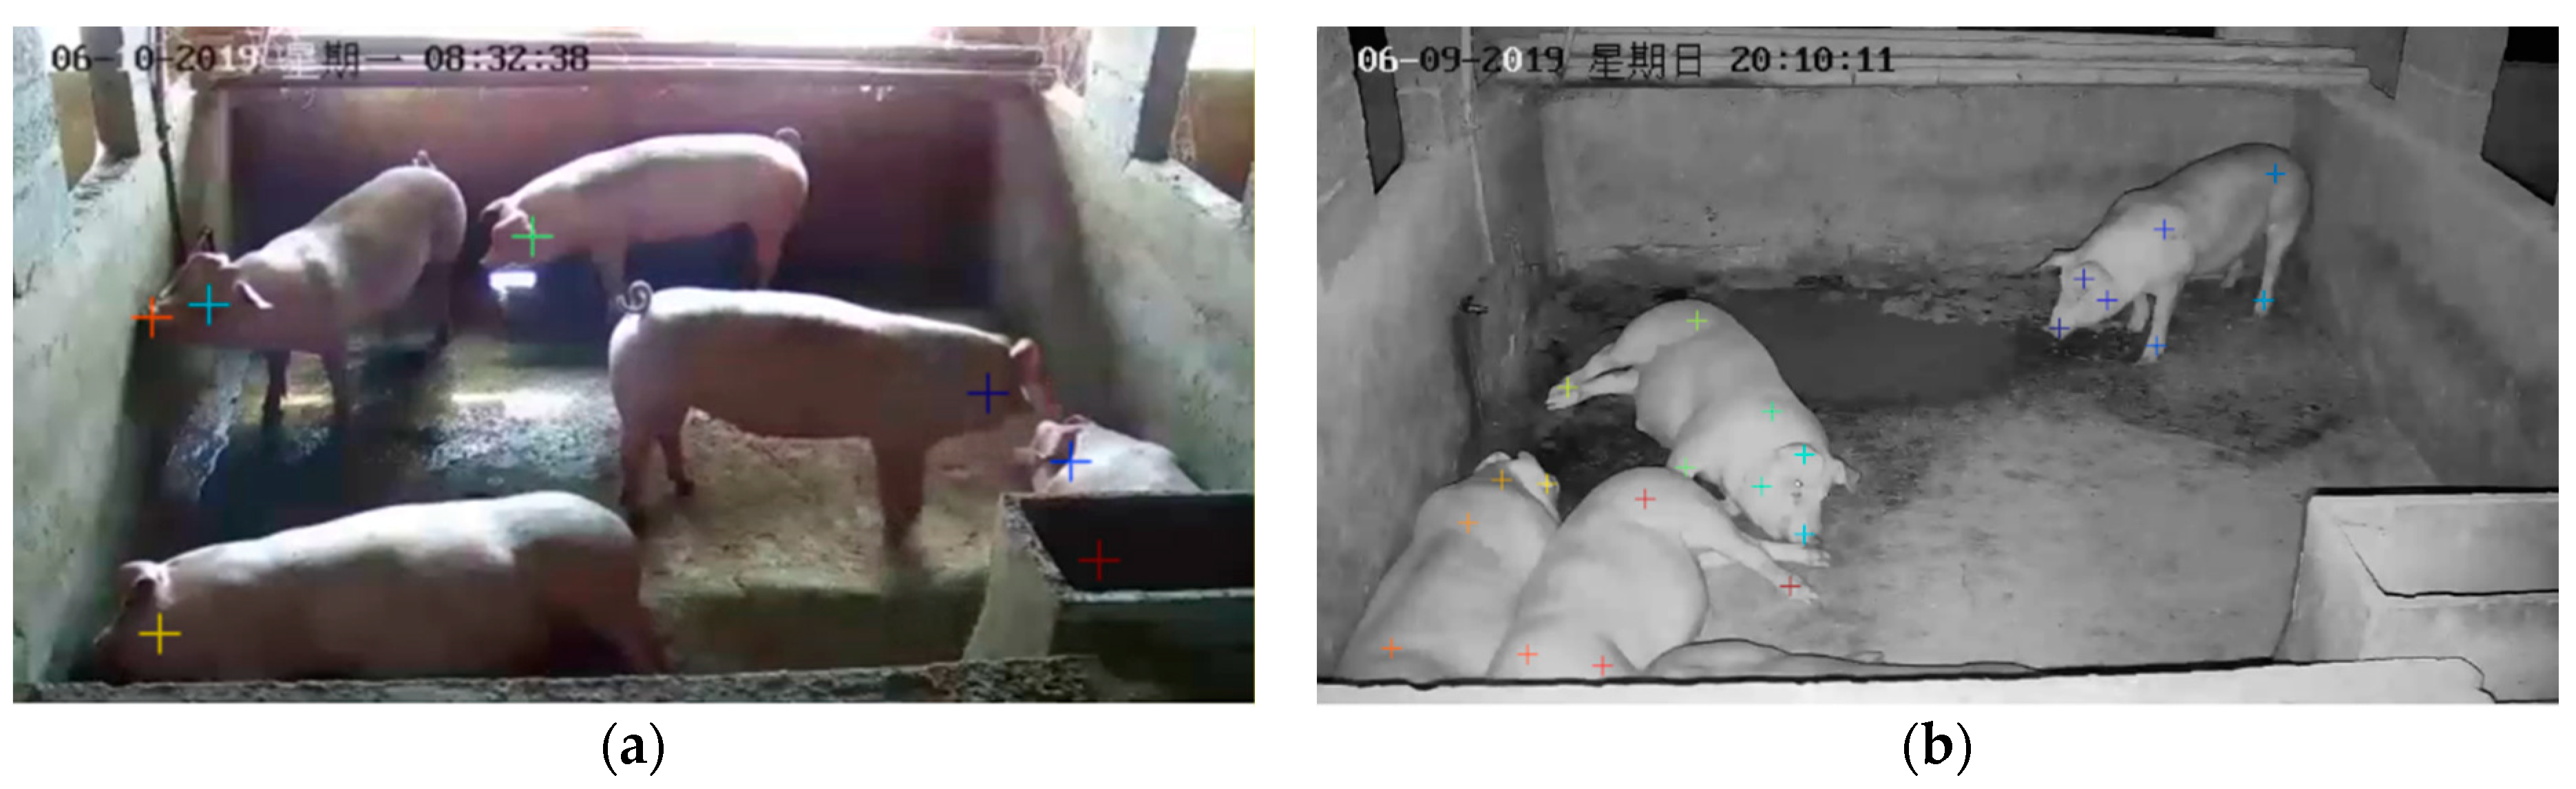
Finally, the model generalization training was conducted, and different parameters, such as batch size, shuffle, training rate, and stride, were set to optimize the convolution layer. The stochastic gradient descent method was used as the model optimization strategy. In addition, the entire network used ReLU as the default activation function. The processing results of video generalization training in different scenes include standing, drinking, eating, lying down, and defecating, as shown in . The model training results realized the accurate positioning of up to 35 targets, which made the traditional target tracking mode of piglets expand from the whole to specific parts, which was conducive to the study of specific details of pig behavior.
Figure 8.
Results of generalization training. “

” is a manual marker, and “

” represents the tracking results after training. (
a) Tracking results of 7 targets; (
b) tracking results of 28 targets.
2.3. Behavior Trajectory Correcting Model Based on KPCA
2.3.1. Linear Trajectory Correction Strategy
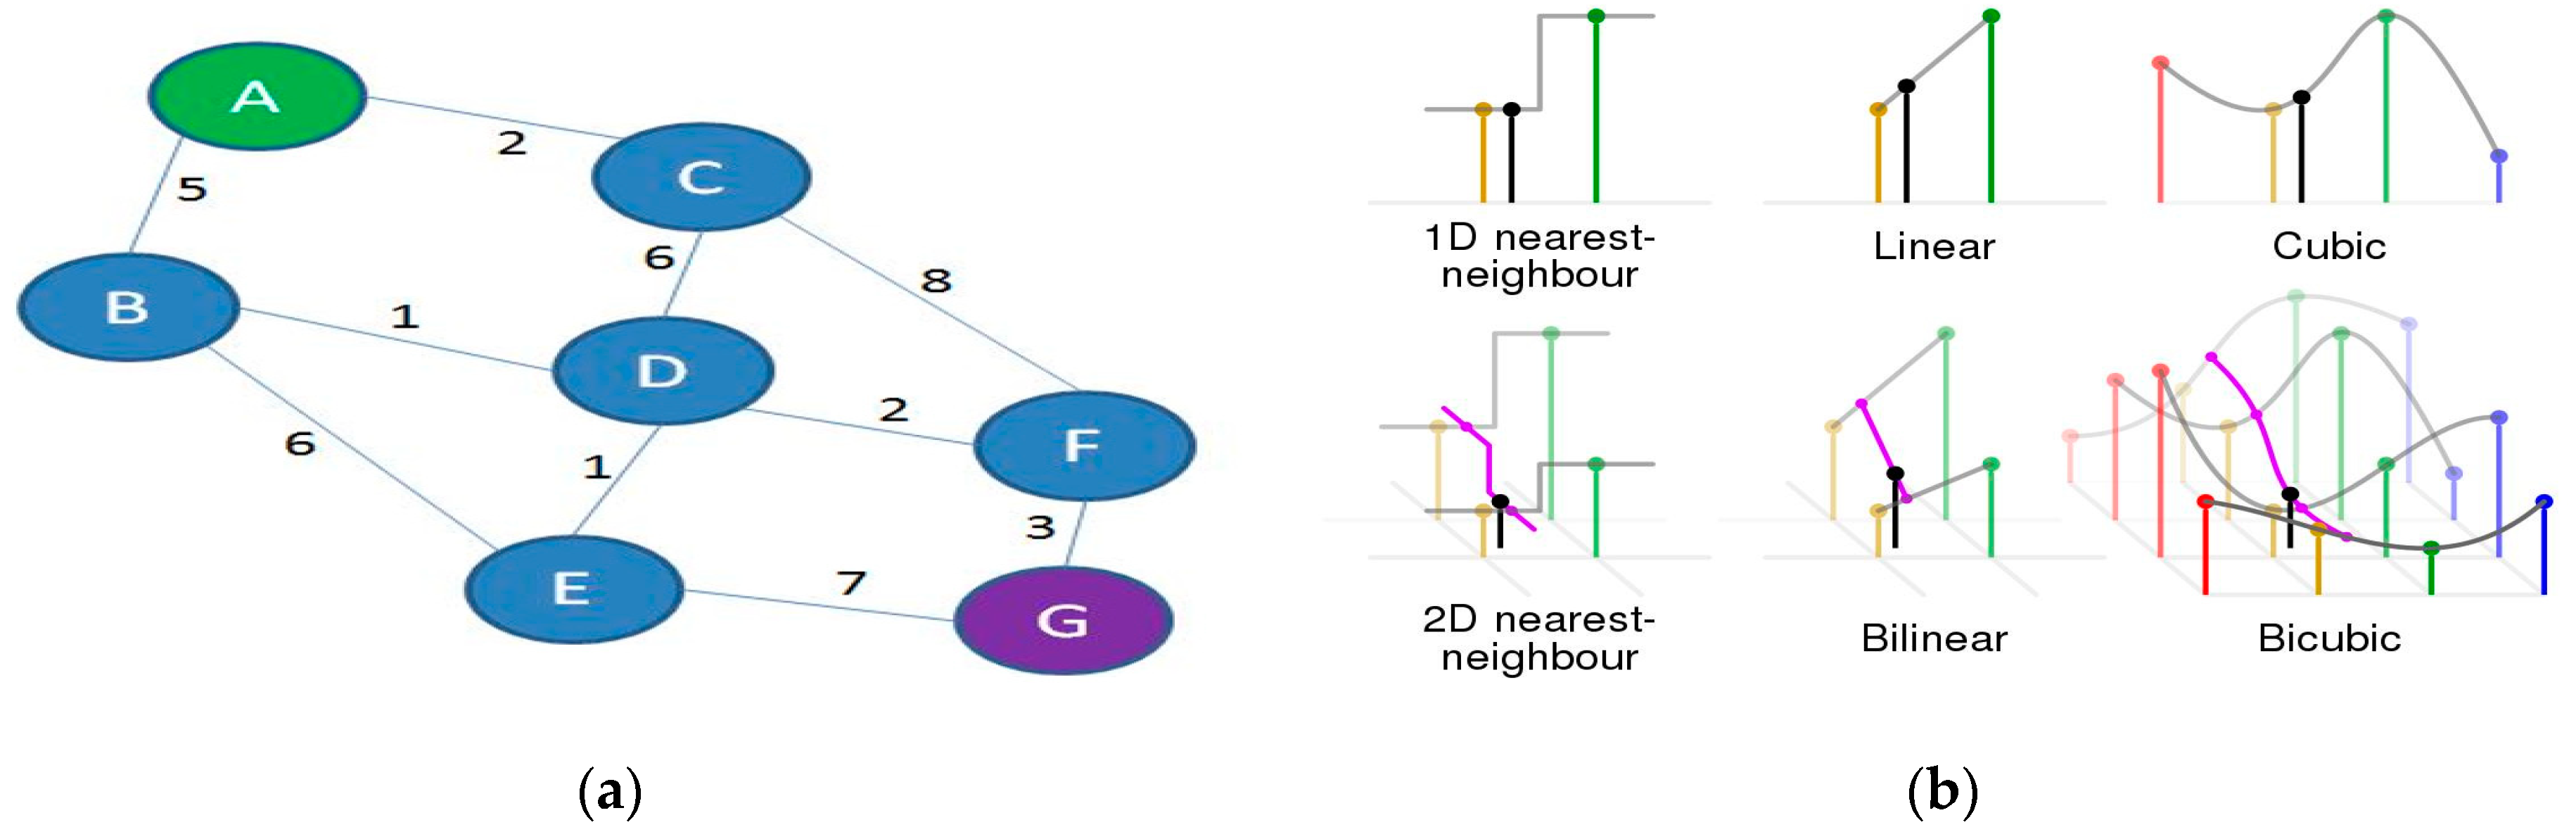
The highly purposeful walking behaviors of piglets, such as drinking water, feeding, and excretion, all contained linear trajectory clustering, which was characterized by strong linear correlation of trajectories in direction. Unlike the linear characteristics of UAV equipment and ship trajectory, the autonomous behavior of pigs increased the uncertainty and repeatability of the trajectory route. Typical linear behavior trajectory clustering of piglets is shown in . The trajectory of piglets ranged from X0 to Xi, mainly including circuits S1, S2, S3, S4, S5, S6, S7, and S8.
Figure 9.
Linear trajectory correction strategy.
First, the angle θ1 between two points of the pig’s behavior trajectory would not be greater than 90° under normal circumstances, unless the stagnation and repetition of the current trajectory were shown in the orange part. According to the trajectory angle strategy, X5, X6, and X7 could be removed as redundant trajectories, and the corresponding routes S5, S6, and S7 could be optimized and eliminated.
Second, a turning point appeared in the route of X2-X3-X4 in the blue region. X3 could be removed according to the path optimization strategy to ensure the maximum linear description. As a result, S3 and S4 were replaced by New S3. The path optimization strategy is shown in a.
Figure 10.
Path optimization and interpolation. (a) Path optimization; (b) different interpolations.
Third, when the initial trajectory displacement of X4-X9 in the orange region was too large, new trajectory points X8 could be added according to the linear interpolation strategy. Accordingly, route S8 became New S4 and New S5. The linear interpolation strategy is shown in b.
The final modified linear trajectory clustering was X0-X1-X2-X4-X8-X9, and the main routes were S1, S2, New S3, New S4, and New S5. The redundant and nonlinear trajectories were removed, and interpolation trajectory was supplemented to optimize the linear trajectory clustering.
2.3.2. Nonlinear Trajectory Correction Strategy
In addition to the trajectories with obvious linear behaviors, many nonlinear trajectories would be generated in the rest, feeding, drinking, and excretion areas due to the immobility of pigs, and the trajectories were intricate. According to the spatiotemporal characteristics of the trajectory (displacement, velocity, time series, and semantics), different trajectory clusters were modified in this study. The typical nonlinear trajectories of piglets’ behavior are shown in , among which X0–X3, X4–X8, X9–X16, and X17–X21 were classified according to cluster strategy, time correlation, displacement correlation, and speed correlation, respectively. Scattered internal and external trajectories such as X22–X25 were also observed, and they needed to be distinguished by semantic strategies. However, some trajectories might be at critical values, such as X9, X17, and X21, which needed to be distinguished according to the clustering optimization strategy.
Figure 11.
Nonlinear trajectory correction strategy.
2.3.3. Trajectory Correction Model
The model modification steps were as follows:
(1) Trajectory segmentation: According to the behavior trajectory of piglets, the trajectory could be preliminarily divided into linear and nonlinear trajectories. The data between each two inflection points after processing were taken as a trajectory processing unit, and the local autocorrelation coefficient was detected for each data unit to determine the existence of redundant and drift trajectories.
(2) Trajectory determination: The feature matrix was constructed according to the spatial and temporal characteristics. The velocity, displacement, and angle of each position were calculated.
If the velocity variance (б) of this point was more than 3б and the velocity (V) was greater than expected value of 20 px/frame, then the point was judged as a drift point. If the displacement (D) between two points was greater than the threshold value of 50 px, then the point was judged as a missing point. If the angle (θ1) between two points was greater than the threshold value of 90°, then the point was judged as a redundant point. With the assumption of the original trajectories T = (P1, P2, …, Pn) and according to the attribute of coordinate points (latitude, longitude), the angle between two edges formed by three points was calculated by the law of cosines:
The angle between each of the three points was calculated by performing the angle calculation in point order. The linear behavior trajectory was mainly straight line. Thus, if the sum of the angles of continuous change exceeded a certain value, then the point could be judged as an outlier. The threshold value was set as 160°.
(3) Trajectory correction: The first three points of drift points were selected as reference points for linear interpolation calculation, and the modified results were used to replace the original drift points. The maximum correlation point of the redundant points was selected as the key point. According to the angle judgment and path optimization of the key points, the redundant points were removed and the key trajectory was retained. As a result, a new trajectory cluster T1 = (K1, K2, …, Kn) was obtained.
(4) Construction of high-dimensional space–time matrix: Based on the nonlinear mapping function Φ in KPCA, the trajectory cluster T1 = (K1, K2, …, Kn) was mapped to a high-dimensional space–time eigenmatrix D.
where X and Y are coordinate point properties (latitude, longitude), V is the instantaneous velocity of the trajectory, D is two-point displacement, and θ is the angle of the trajectory point.
(5) Trajectory sparsity: The covariance matrix of D was calculated, and the eigenvalue and eigenvector of the covariance matrix were obtained. The obtained eigenvalues were sorted from the largest to the smallest, and the eigenvectors corresponding to the largest k eigenvalues were selected. The original data were projected into the low-dimensional space composed of the selected feature vectors and transformed into new trajectory samples to complete trajectory dimensionality reduction.
3. Results
3.1. Behavior Trajectory Tracking Results
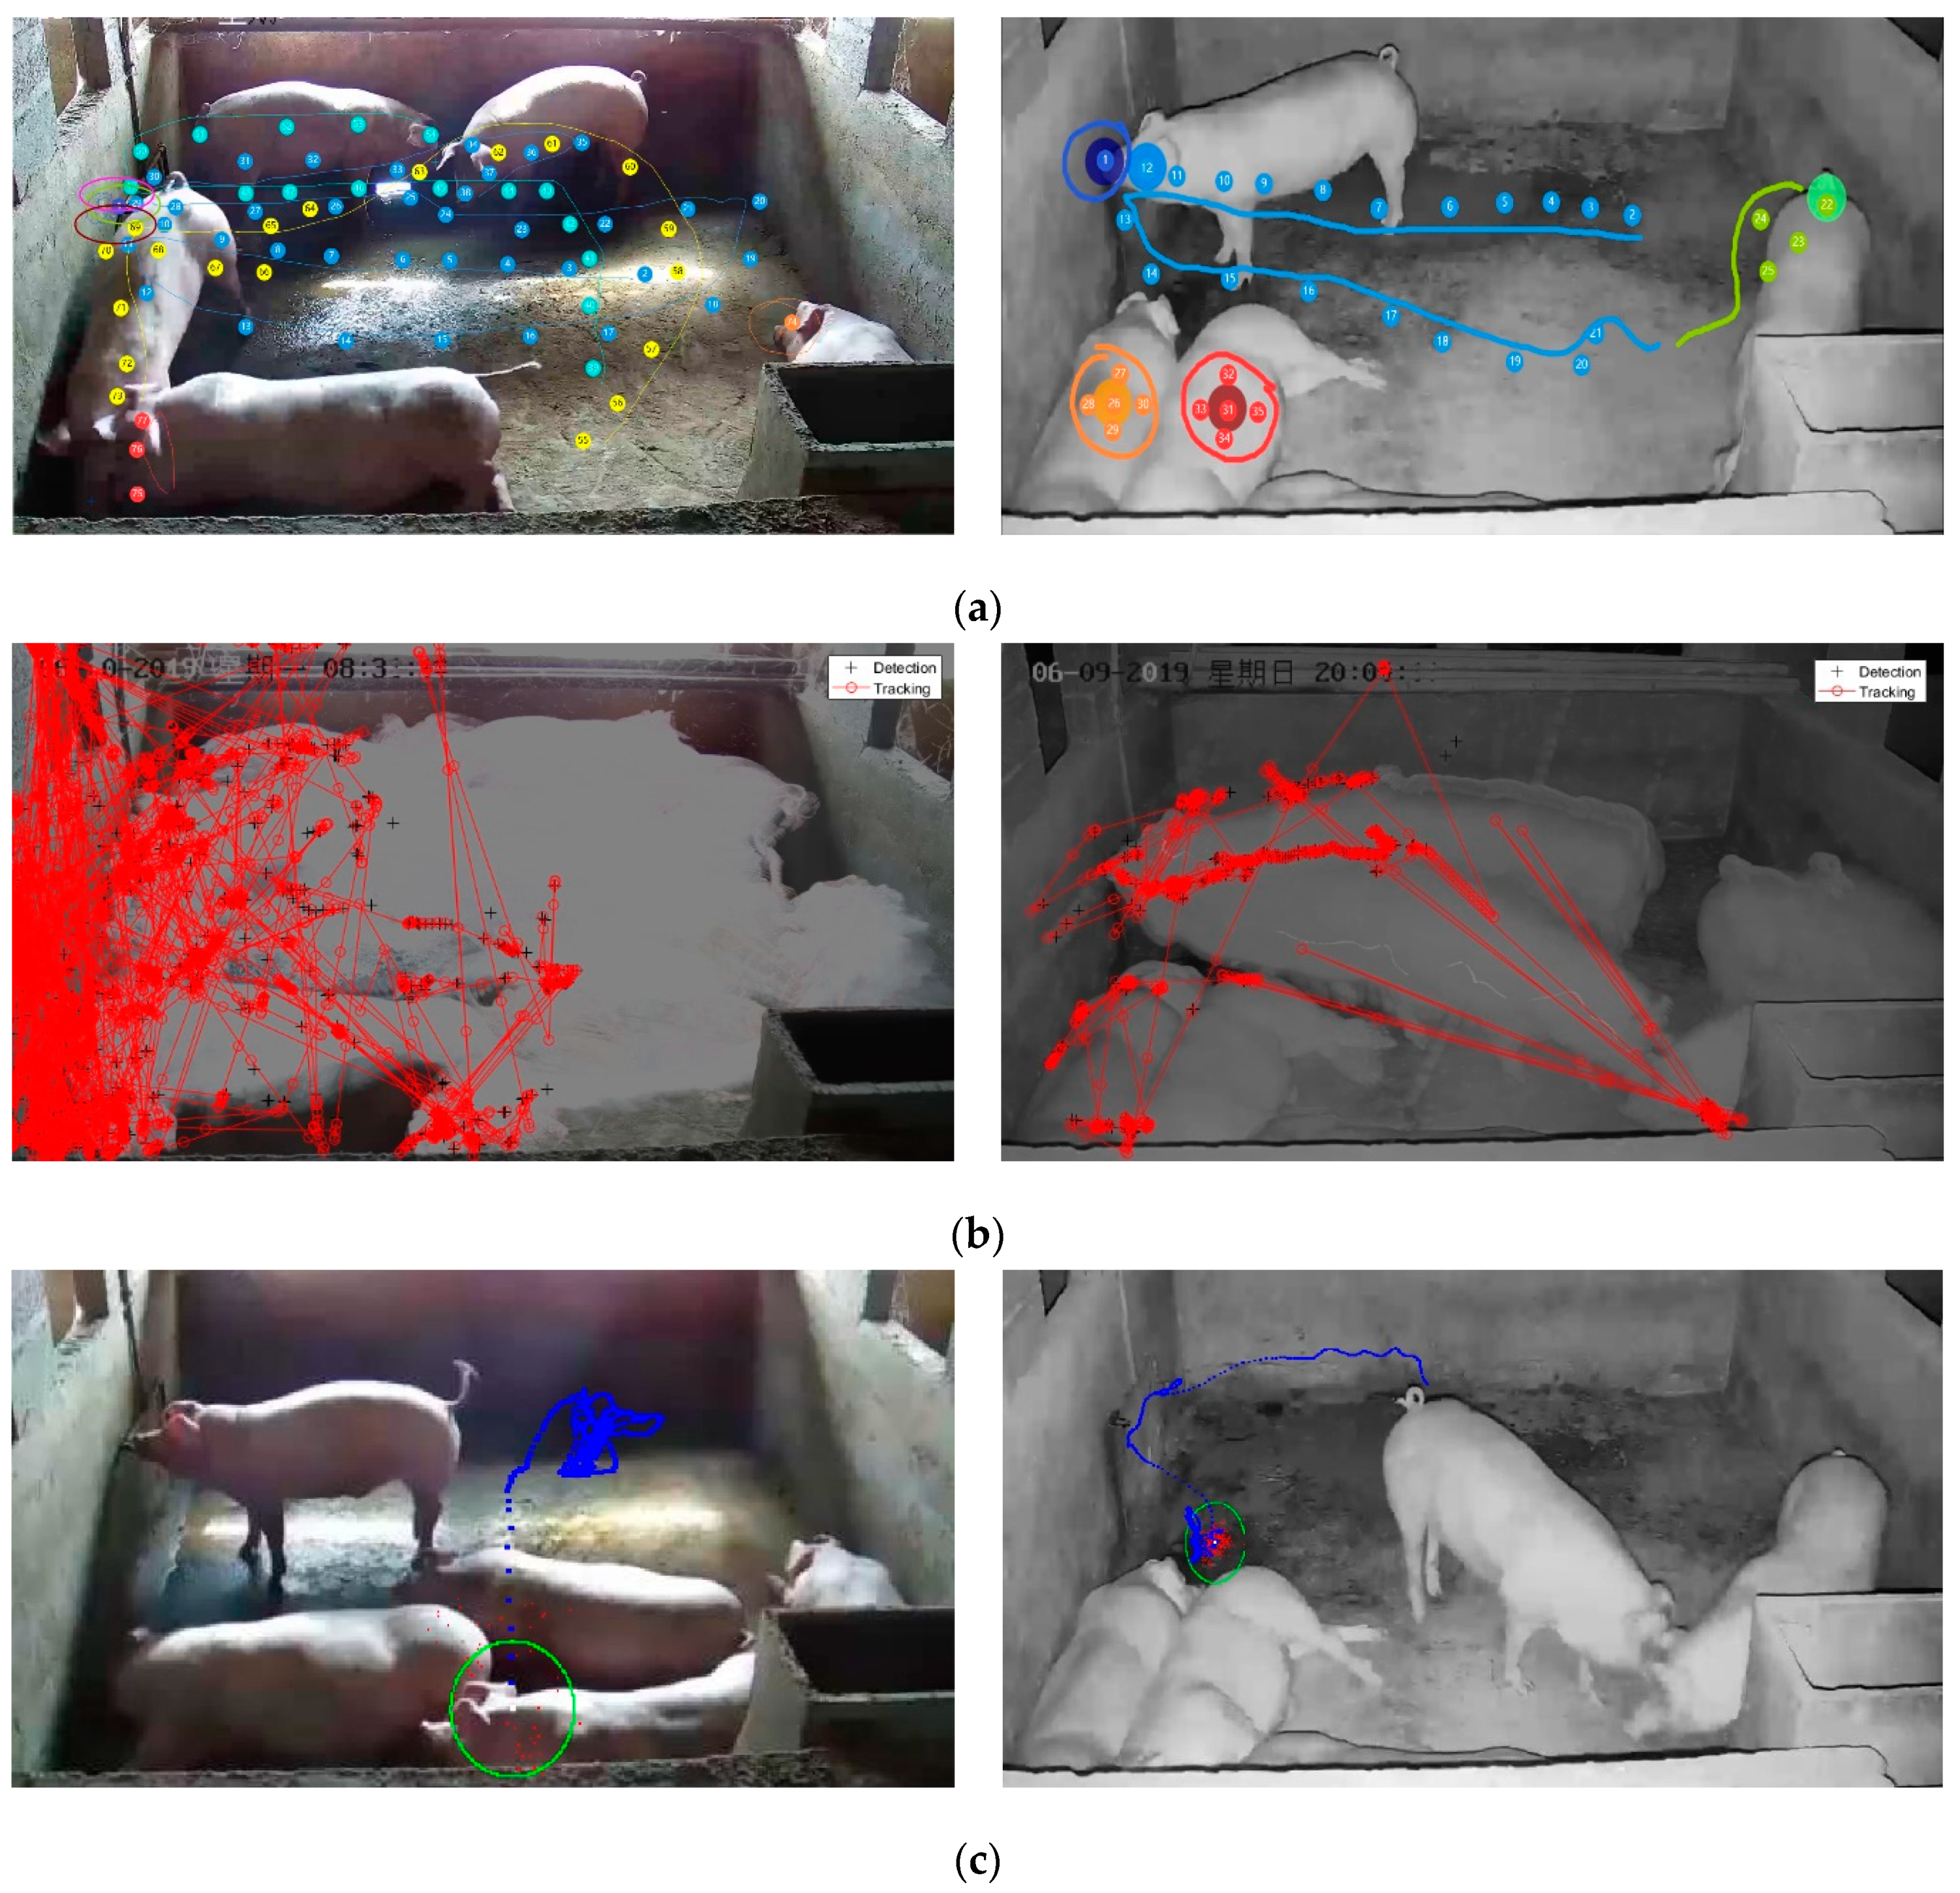
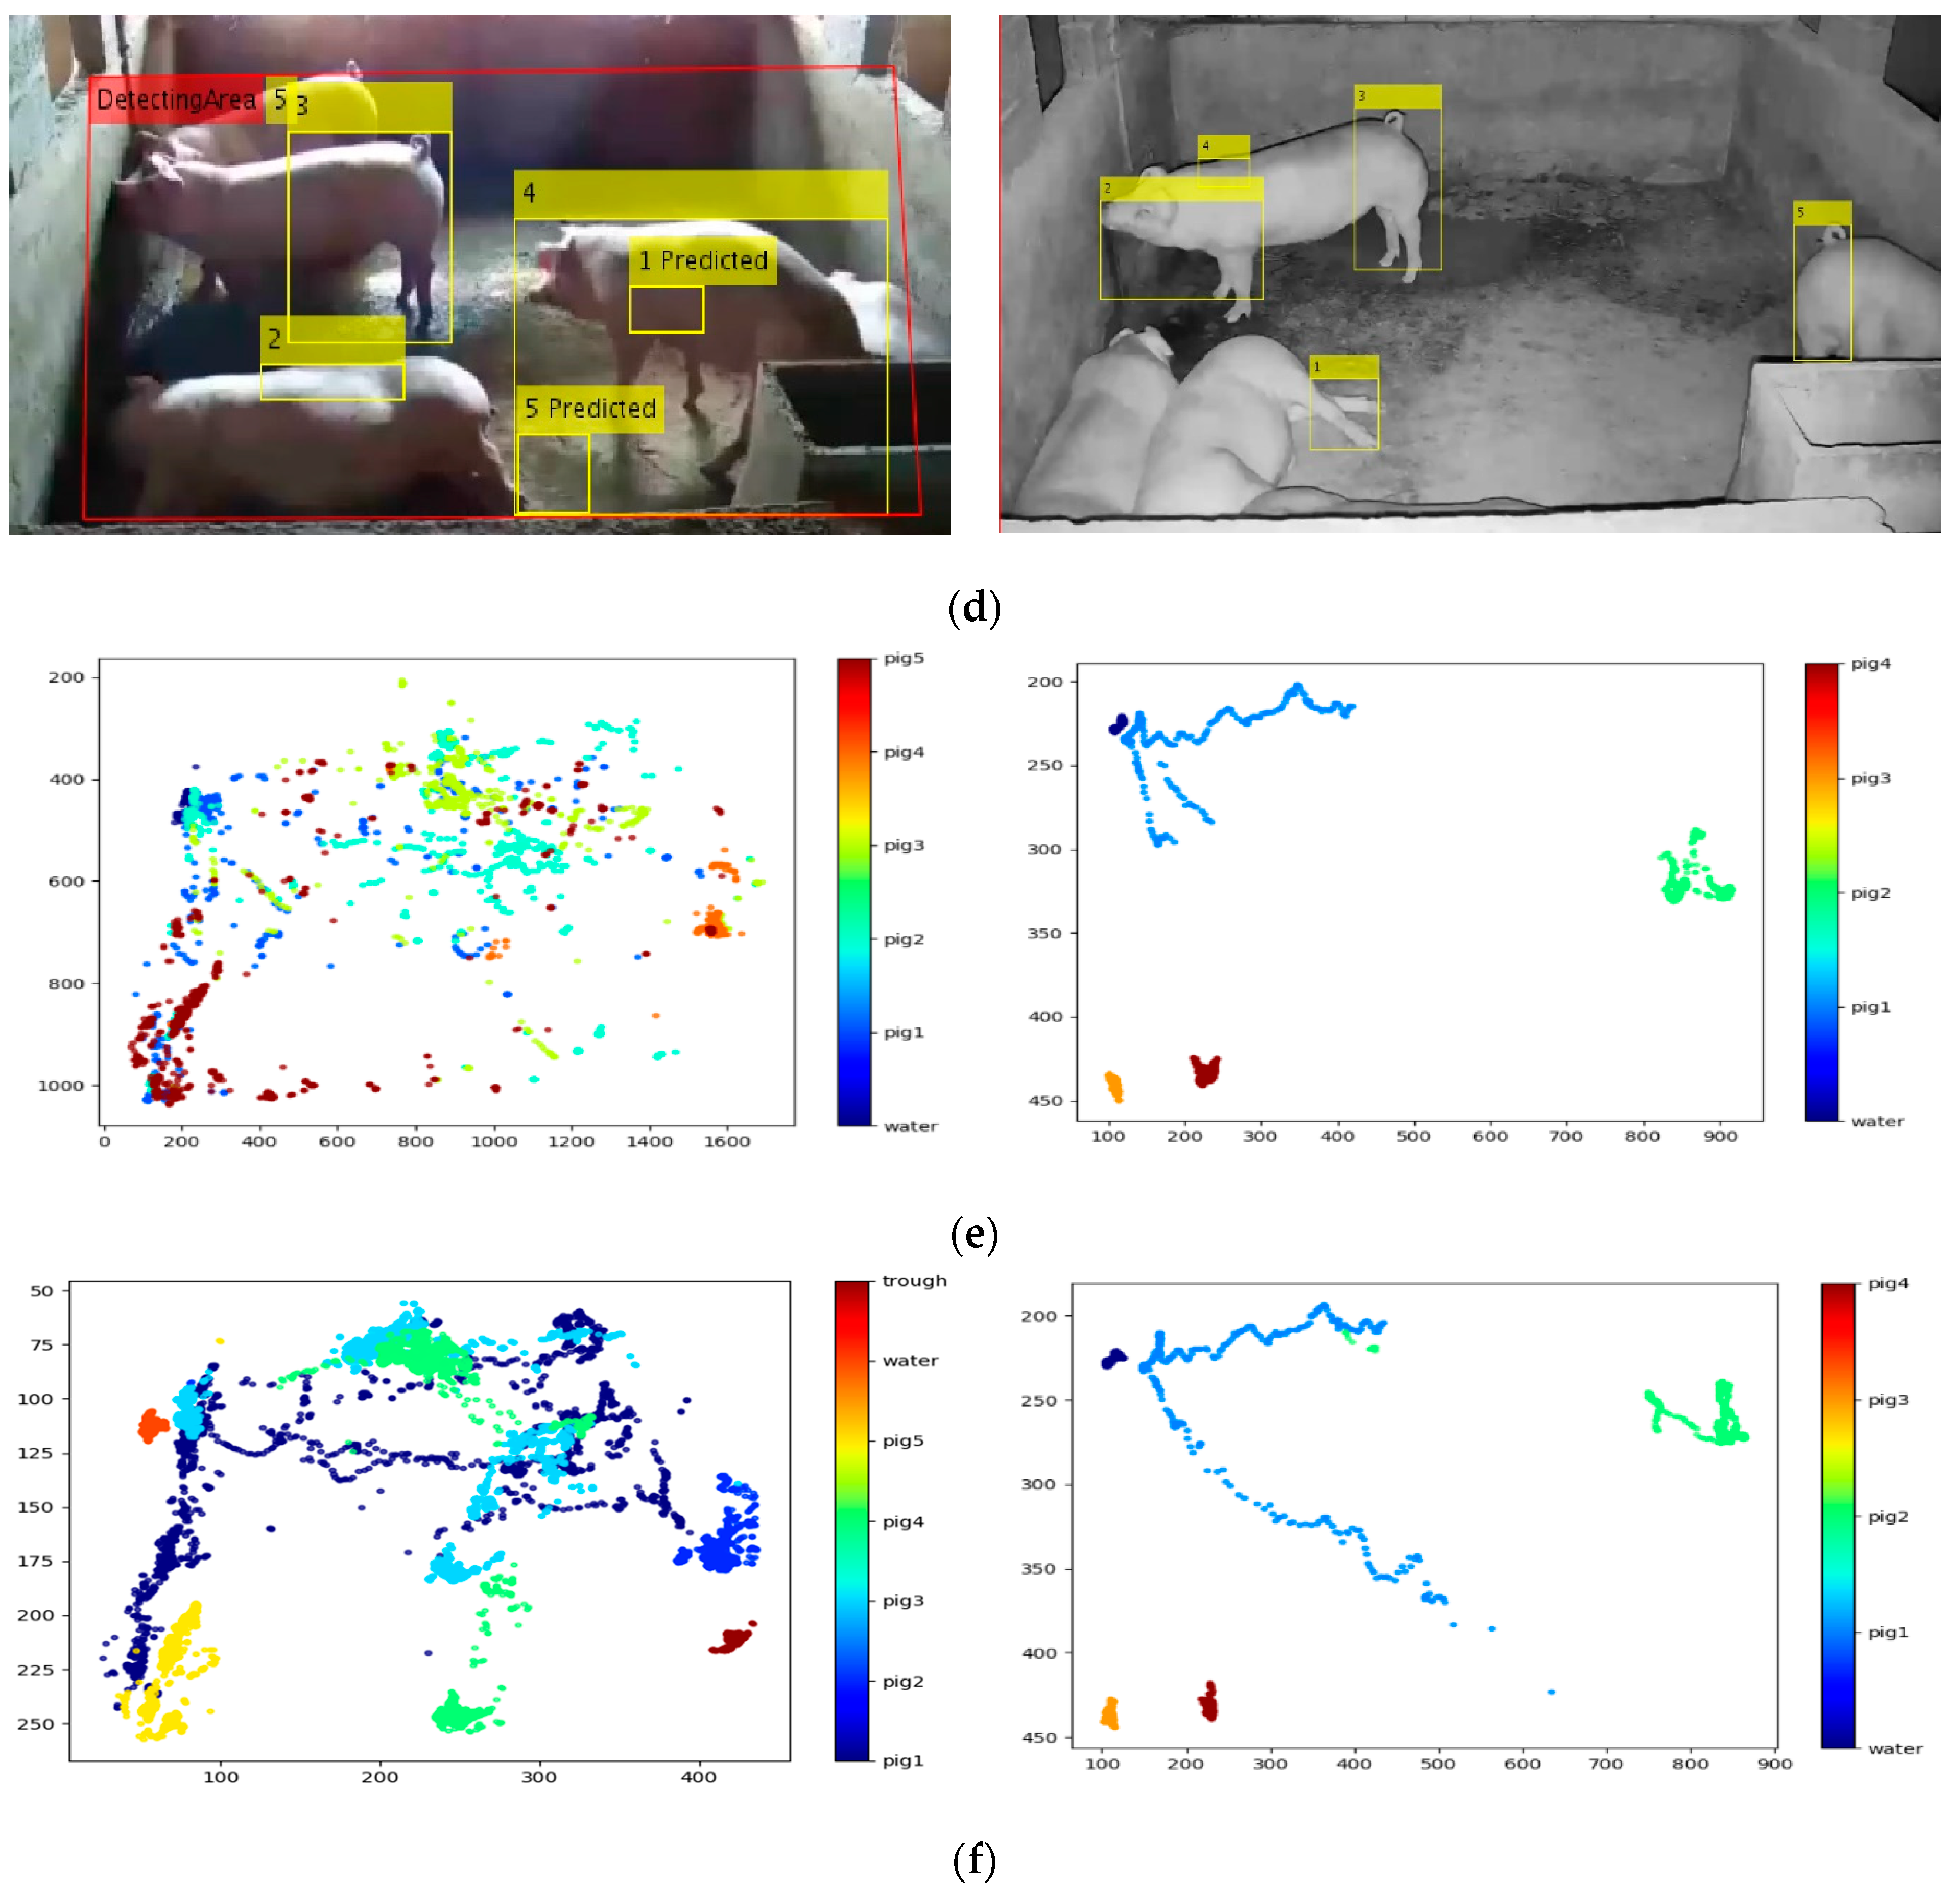
The improved DLC algorithm was used to obtain the behavior trajectory of piglets in this study. Obtaining effective behavior trajectory from the incorrect information was difficult due to the serious drift, loss, and overlap of trajectories in the traditional algorithm. The algorithm comparison results are shown in , and a is the manually labeled sample. b is the behavior trajectory obtained by the Kalman filter, in which the trajectory points between frames drifted and were discontinuous. The sampling particle filter had a good effect on the trajectory of individual piglets, but typical trajectory loss problems were observed, as shown in c. d is motion-based multi-target tracking, which aimed to achieve multi-target tracking, but the target detection was inaccurate. e is the traditional DLC algorithm, which required a large number of manual labeling of training samples and realized the whole-process tracking of piglets, but the problems of trajectory loss and drift still existed. f is the training result of the improved model in this study, which optimized the problems of trajectory redundancy, trajectory loss, and trajectory drift. It also realized the trajectory clustering analysis of multi-target behavior.
Figure 12.
Trajectory collection based on different methods. (a) Manually fitting the trajectory route; (b) kalman filter; (c) sampling particle filter; (d) motion-based multi-target tracking; (e) traditional DeepLabCut; (f) improved DeepLabCut.
3.2. Behavior Trajectory Classification Results
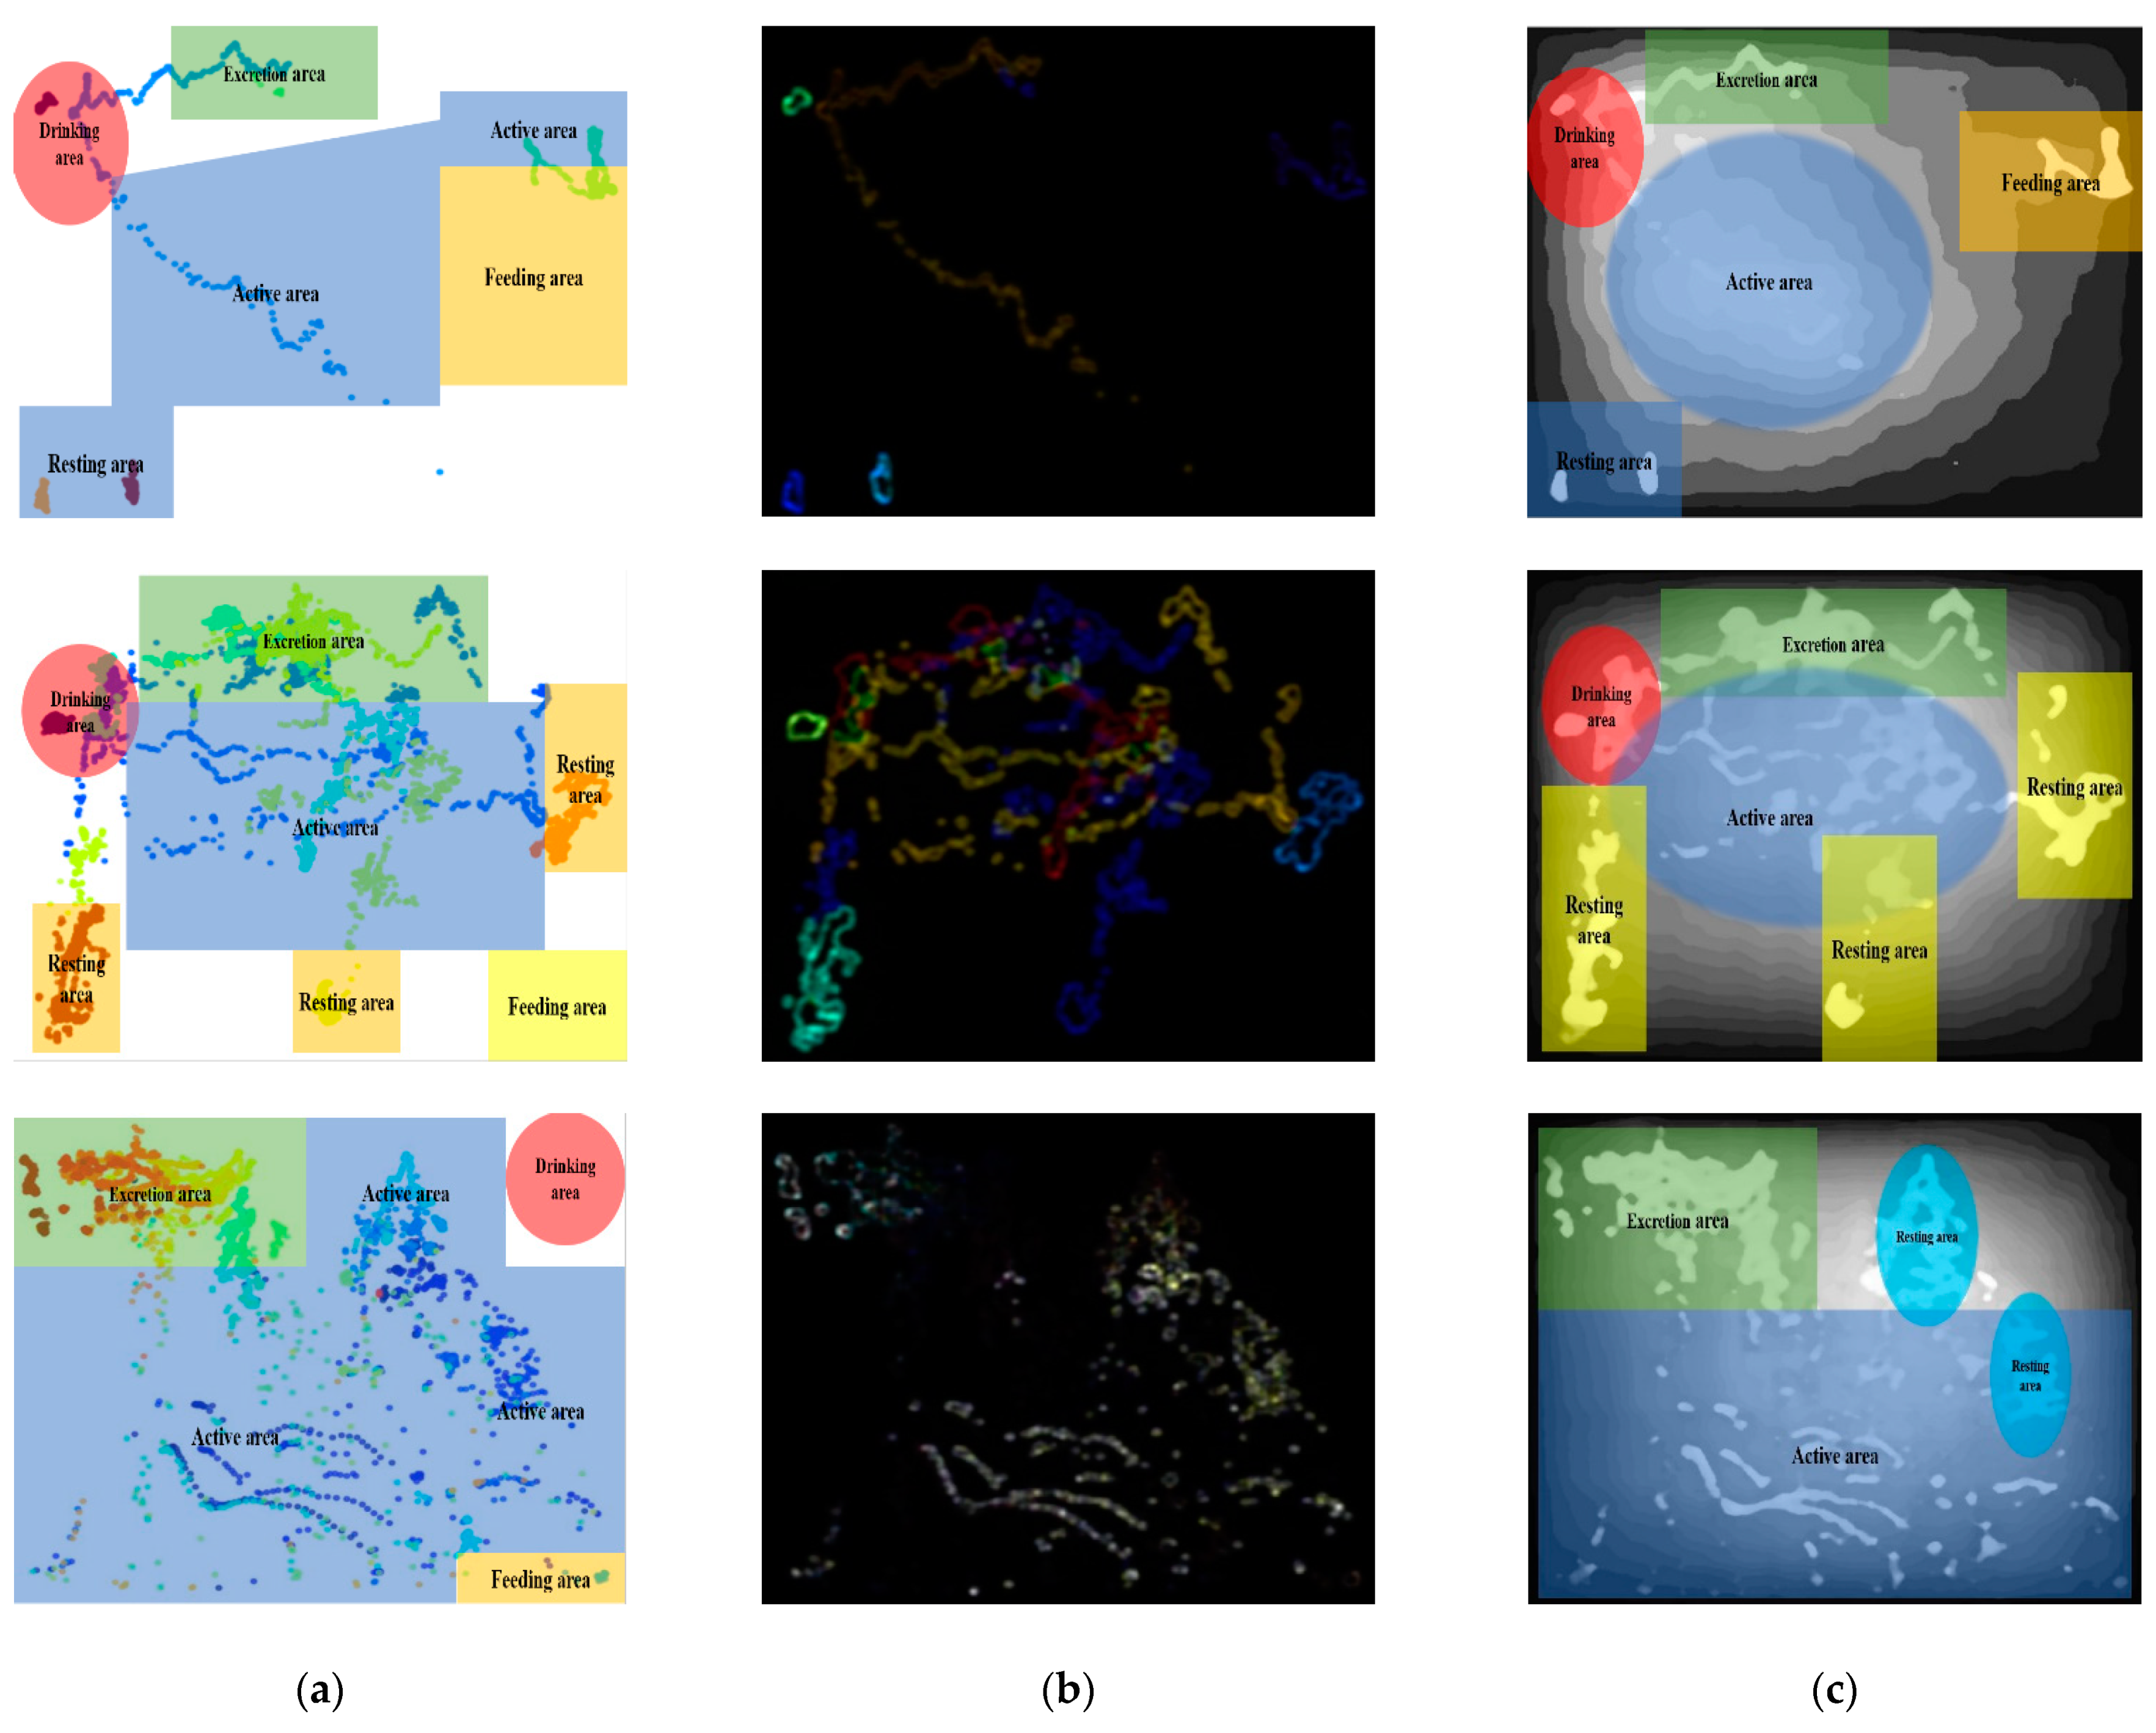
The obtained high-dimensional space–time eigenvector was used to correct the abnormal trajectory. The weight value in KPCA was adjusted to analyze its principal component characteristic information, and the drift, redundant, and edge trajectories were eliminated. The remaining scattered trajectories were classified by clustering, and the position of the offset center point was corrected. The most important thing was to fit the nonlinear spatial trajectories and form a linear trajectory class with obvious velocity, direction, and time series. The modified nonlinear behavior trajectory classes, linear behavior trajectory class, and other edge reserved trajectory classes in each region are shown in . Among them (a), the characteristics of the drinking water trajectory class were that the drinking water trajectory of piglets contained the linear regular trajectory and the nonlinear clustering trajectory with the drinking water area as the center point, and the individual piglet had a distinct mapping relationship with the target of the water fountain. (b) The excretion trajectory class was characterized by a small number of regular linear trajectories, a large number of nonlinear trajectories, and other edge trajectories. (c) The characteristics of feeding trajectories were mainly clustering of linear moving and feeding trajectories. (d) The remaining trajectory class was characterized by nonlinear trajectory clustering, and the target trajectory should ideally be a dense point with minimal displacement drift. (e) Active trajectories were mainly divided into stationary region clustering and linear regular moving trajectories. Notably, the trajectory classification effect was significantly improved after the correction.
Figure 13.
Different clusters of behavior trajectories. (a) Drinking trajectory; (b) excretion trajectory; (c) feeding trajectory; (d) resting trajectory; (e) standing trajectory.
3.3. Activity Area Analysis
A significance analysis of the active areas was conducted. As shown in , the visualization results showed that the four active areas of piglets (drinking, feeding, excretion, and active areas) could be clearly identified according to the significance gradient. After significance processing, the active areas identified by track clustering features were more refined. The results showed that the loss and drift of piglets’ behavior trajectory often occurred in the coexisting regions of nonlinear and linear trajectories with multiple interactions, such as the active, drinking, and excretion areas. The main characteristics of trajectories could be divided into scattered and overlapping internal trajectories and sporadic abnormal trajectories near the surrounding area. In this scenario, the activities of piglets in the activity, feeding, drinking, and excretion areas could be tracked, which was helpful for the scientific management and welfare feeding of the pig farm.
Figure 14.
Active area analysis. (a) Active areas; (b) random center surrounding saliency; (c) dual-channel map.
4. Discussion
4.1. Abnormal Trajectory Detection Based on Spatiotemporal Characteristics
The drift trajectories were replaced by linear interpolation based on five spatiotemporal feature vectors: velocity, displacement, angle, time series, and semantics. The key point angle judgment and path optimization planning were conducted to remove the redundant points. The threshold value (3б) of velocity variance, displacement threshold (d > 50 px), two-point angle threshold (θ1 > 90°), and the sum (θ2 > 160°) of continuous rotation angle were judged for removing abnormal trajectories. Thus, the linear and nonlinear trajectories could be effectively modified.
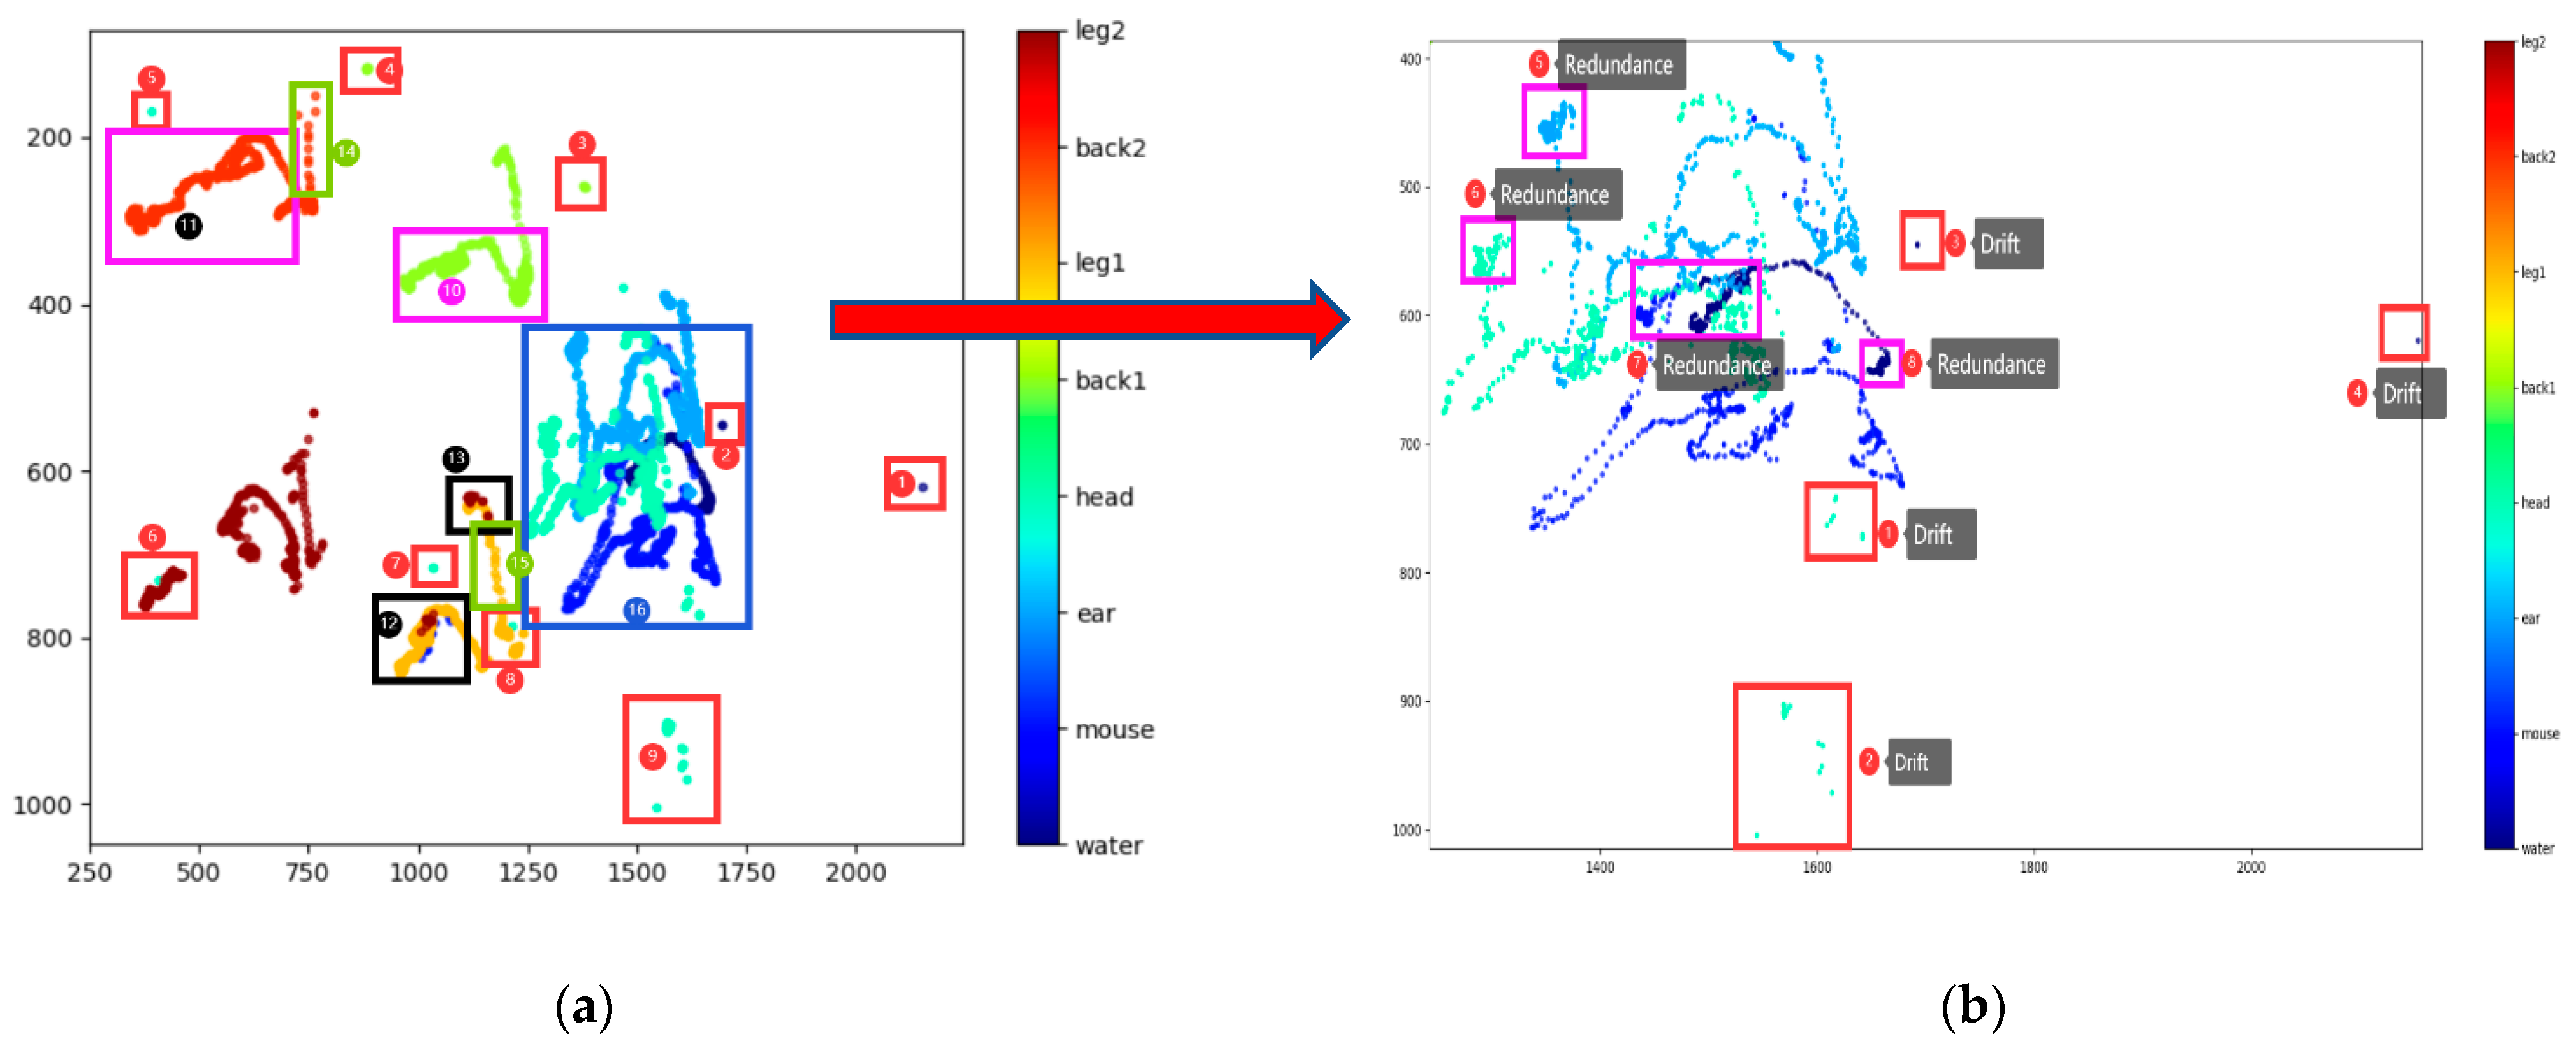
The abnormal trajectory analysis based on spatiotemporal characteristics is presented in . a is the overall anomaly trajectory diagram analysis, in which the red, purple, black, green, and blue frames are drift, redundant, lost, normal standard, and complex overlapping trajectories, respectively. b is the further analysis of complex overlapping trajectories of blue frames, which are mainly drift and redundant trajectories.
Figure 15.
Abnormal trajectory analysis. (a) Overall abnormal trajectory; (b) local abnormal trajectory.
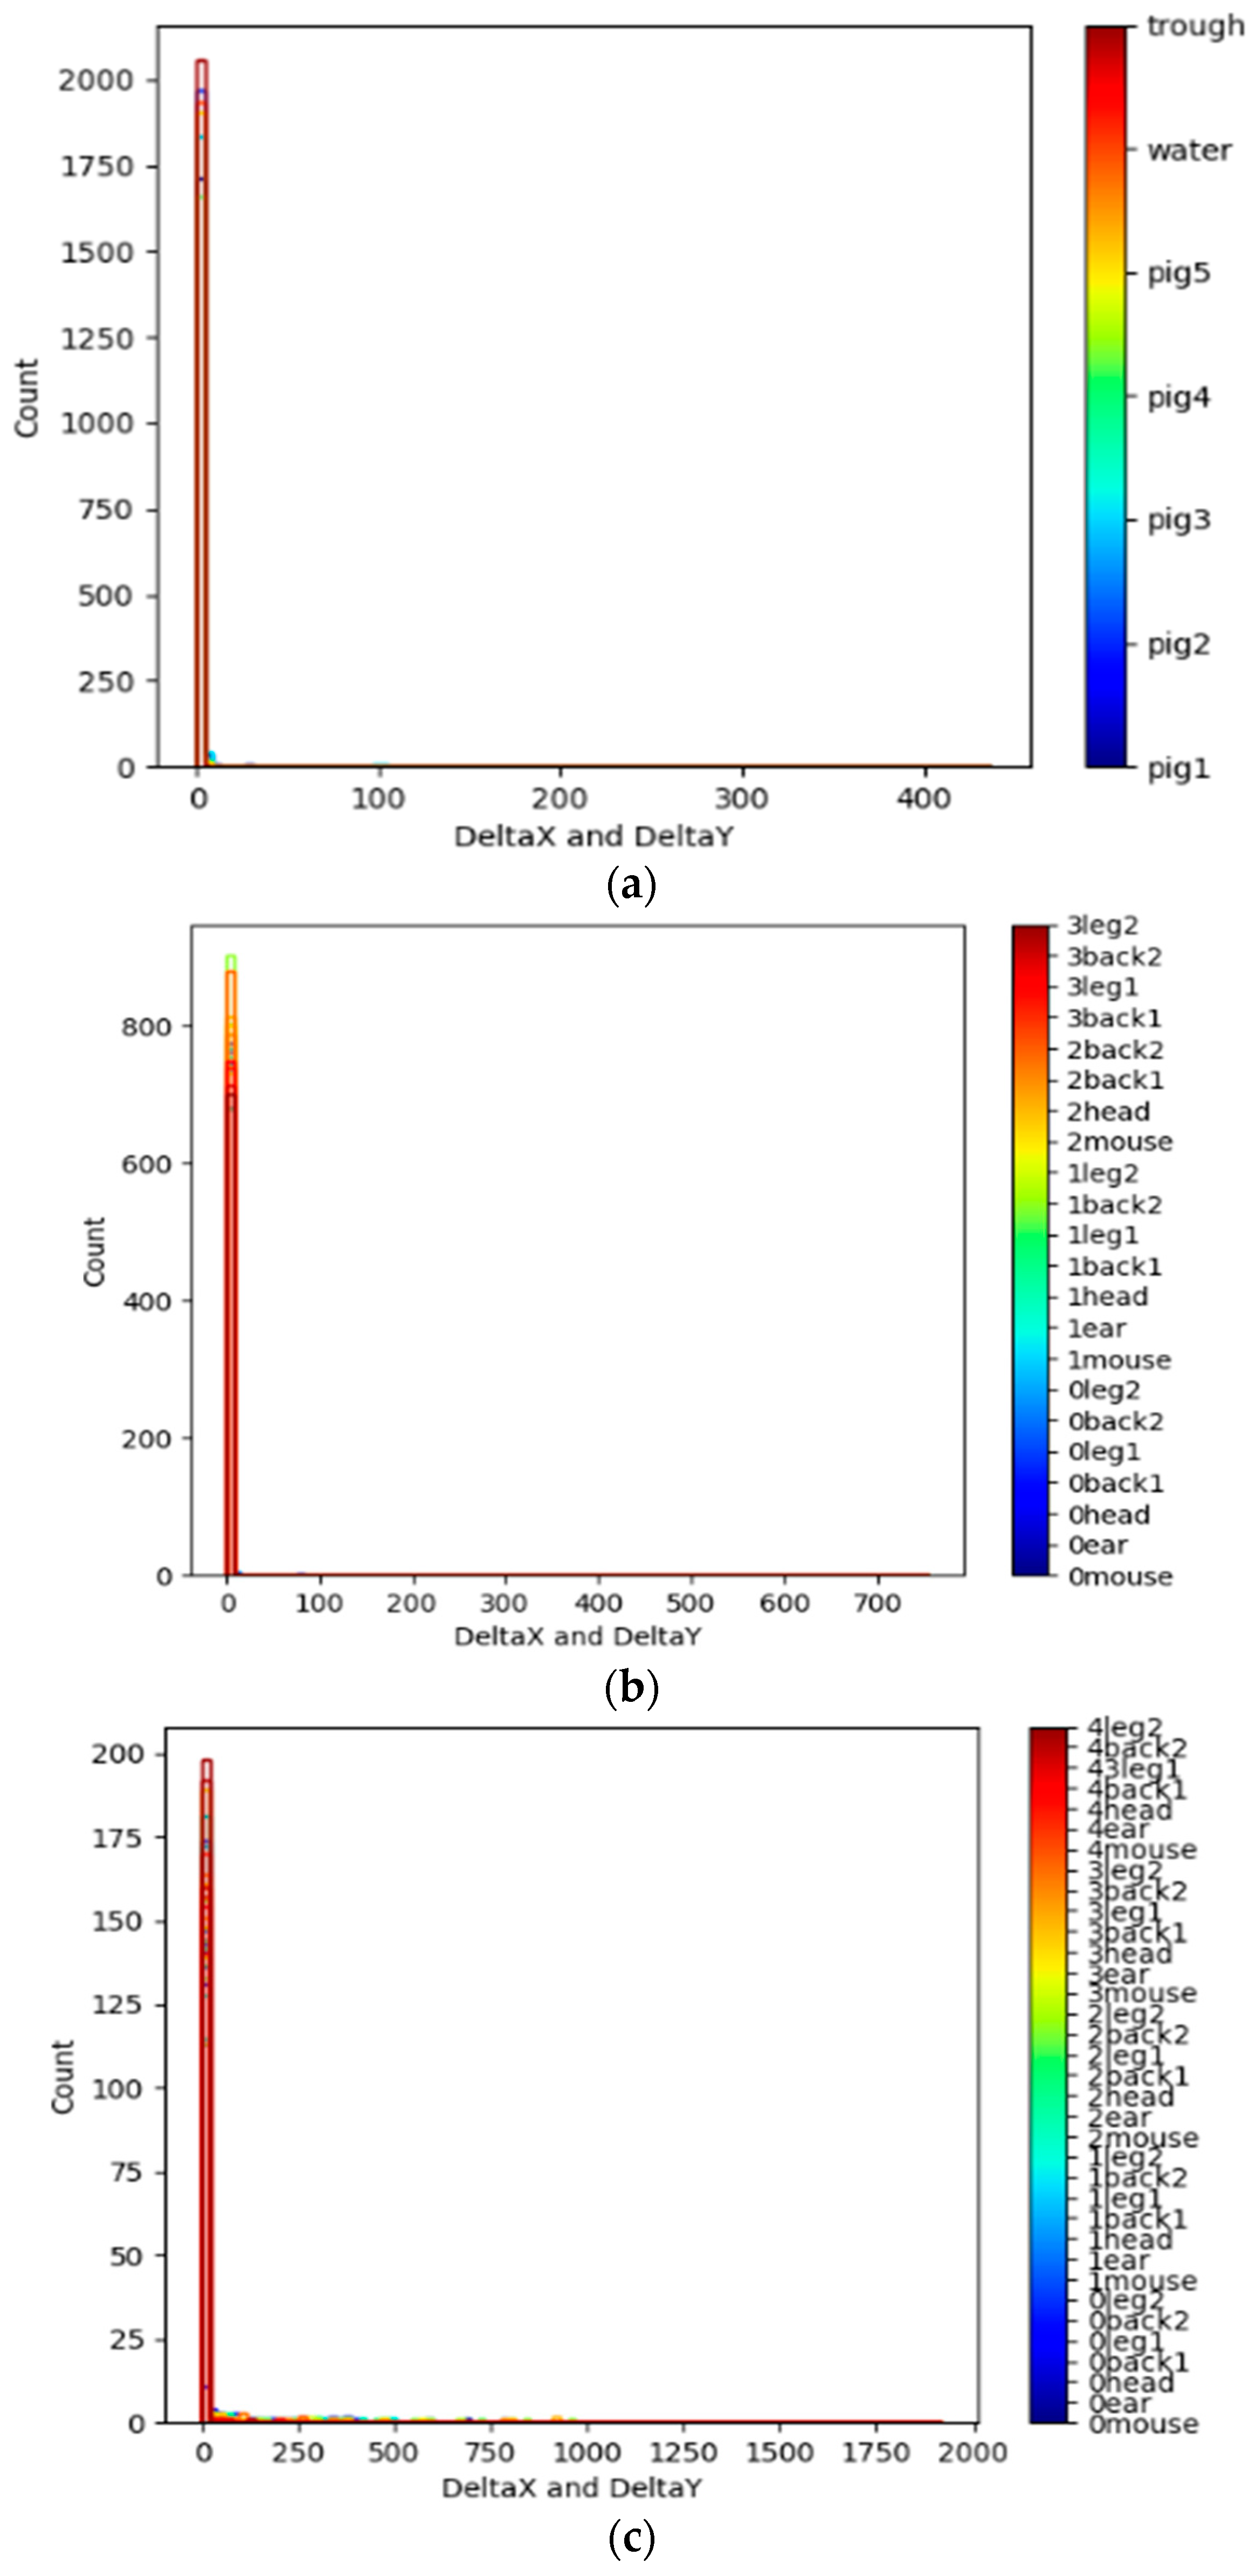
The displacement statistics of trajectories in each frame are shown in . The overall trajectory displacement could be maintained at 20 px per frame, with few drifting. There is an exception, as shown in c. It showed that the average detection times of normal trajectories with displacements within 20 px were up to 200, and a small number of drift trajectories with displacement distances higher than 50 px threshold or even up to 1000 px were observed. The results showed that the outliers were not only limited to the edge of the data set but also located in the interior of the data set. The method in this study was good at correcting the trajectory with abnormal performance in speed, space, and direction.
Figure 16.
Trajectory displacement statistics. (a) The statistics of 7 targets; (b) the statistics of 21 targets; (c) the statistics of 35 targets.
4.2. Sparse Representation and Correction of Trajectory Based on KPCA
The trajectory data were analyzed by KPCA to optimize the trajectory clustering model. The model mainly had three parameters that needed to be set and adjusted: p, ω, and v. p represents the extraction rate set in the feature space mapping, ω represents the width of the Gaussian kernel function adopted, and v represents the asymptotic upper limit of the proportion of abnormal trajectories in the trajectory set.
As shown in , a positive correlation existed between the extraction rate p and the number of the extracted principal components. The extraction rate increased from 0.7 to 0.95 with an increase of 0.05, and the number of the extracted principal components also increased slowly.
Table 1.
Experimental result of extraction rate p (ω = 8, v = 0.06).
As shown in , the parameter ω greatly influenced the number of extracted principal components. When the parameter ω slowly increased at a small range, the number of principal components decreased sharply, which indicated that the parameter ω had a direct control effect on the dimension reduction of trajectory features.
Table 2.
Experimental result of parameter ω (p = 0.9, v = 0.06).
As shown in , the value of the parameter v was constantly increasing, and the number of detected abnormal trajectories was also increasing correspondingly. The proportion of abnormal trajectories was very close to parameter v, which indicated that parameter v had a good control effect on the proportion of abnormal trajectories.
Table 3.
Experimental result of parameter v (p = 0.9, ω = 8).
By comparing and analyzing the experimental results based on the original trajectory data and the high-dimensional characteristic data, the optimal experimental parameter settings (ω = 8, p = 0.9, v = 0.06) were obtained. The trajectory dimension reduction was also realized effectively.
The feature model based on KPCA algorithm was established, and the dimensionality reduction of features based on nonlinear trajectory was realized. The optimal model parameter setting (ω = 8, p = 0.9, v = 0.06) was obtained through the analysis of experimental results in this study. p and ω greatly influenced the number of principal components. ω had a direct control effect on the dimension reduction of trajectory characteristics, while v had a good control effect on the proportion of the number of abnormal trajectories.
4.3. Performance Analysis of Improved DLC
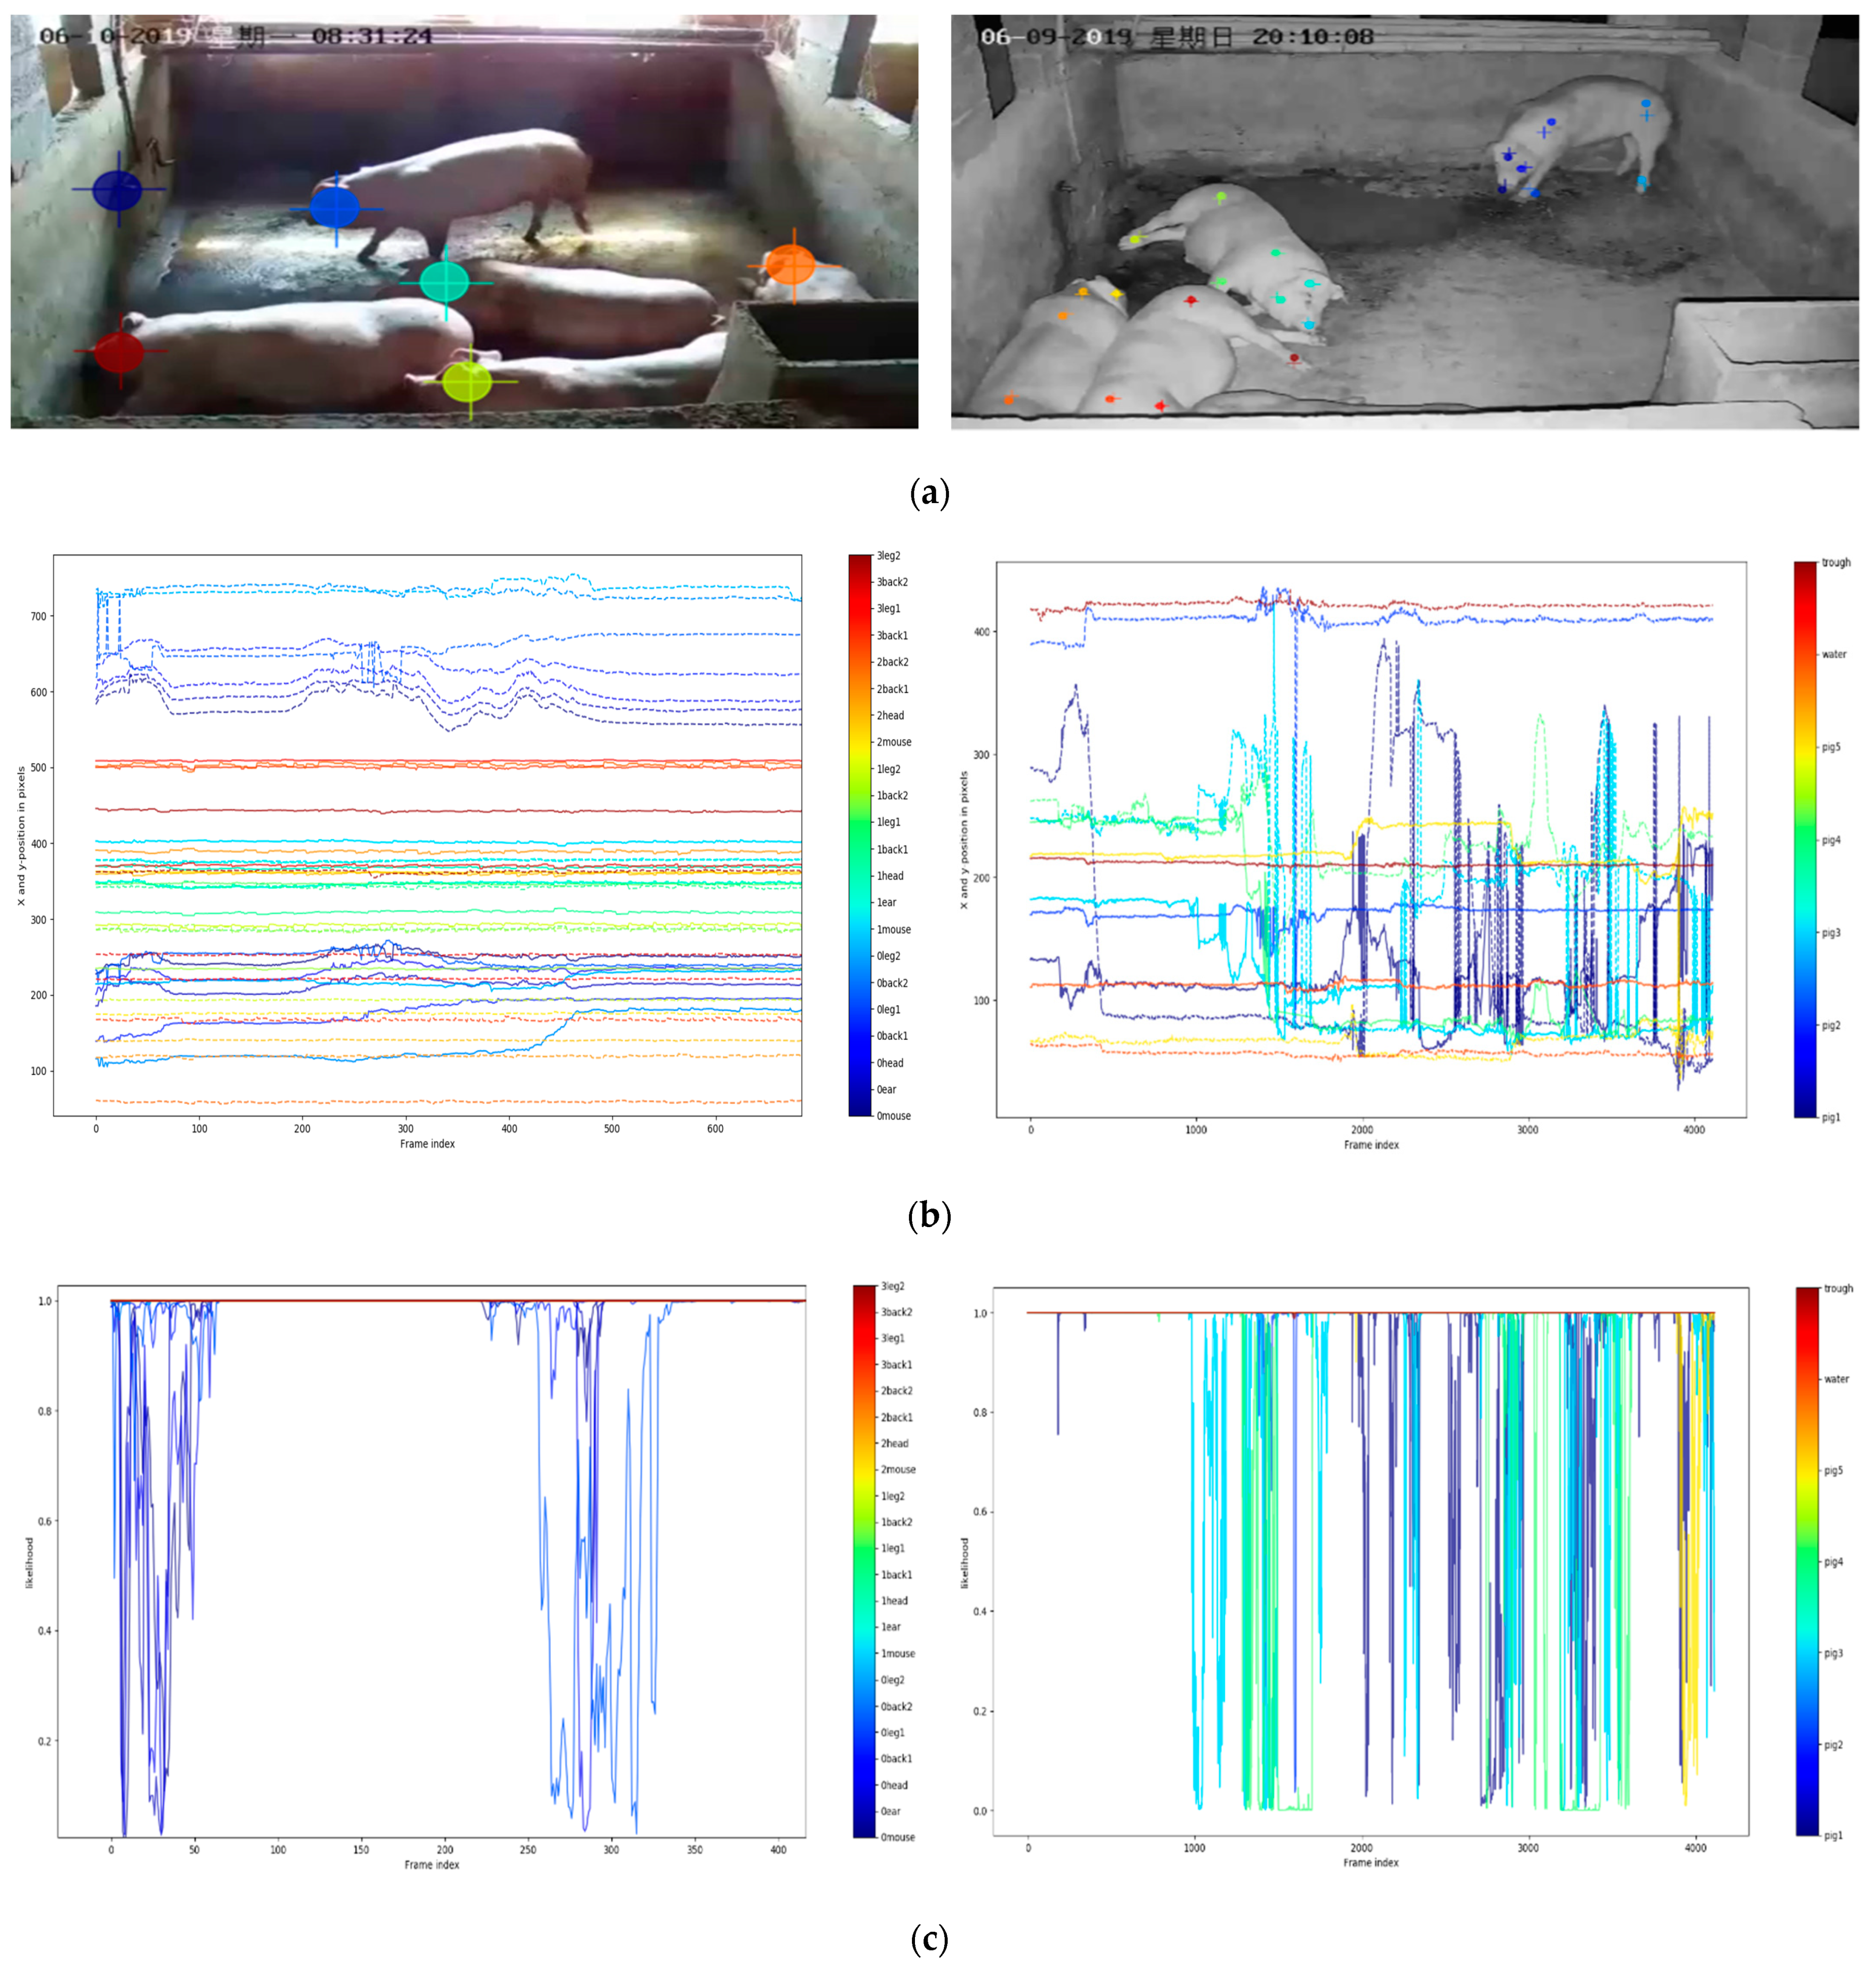
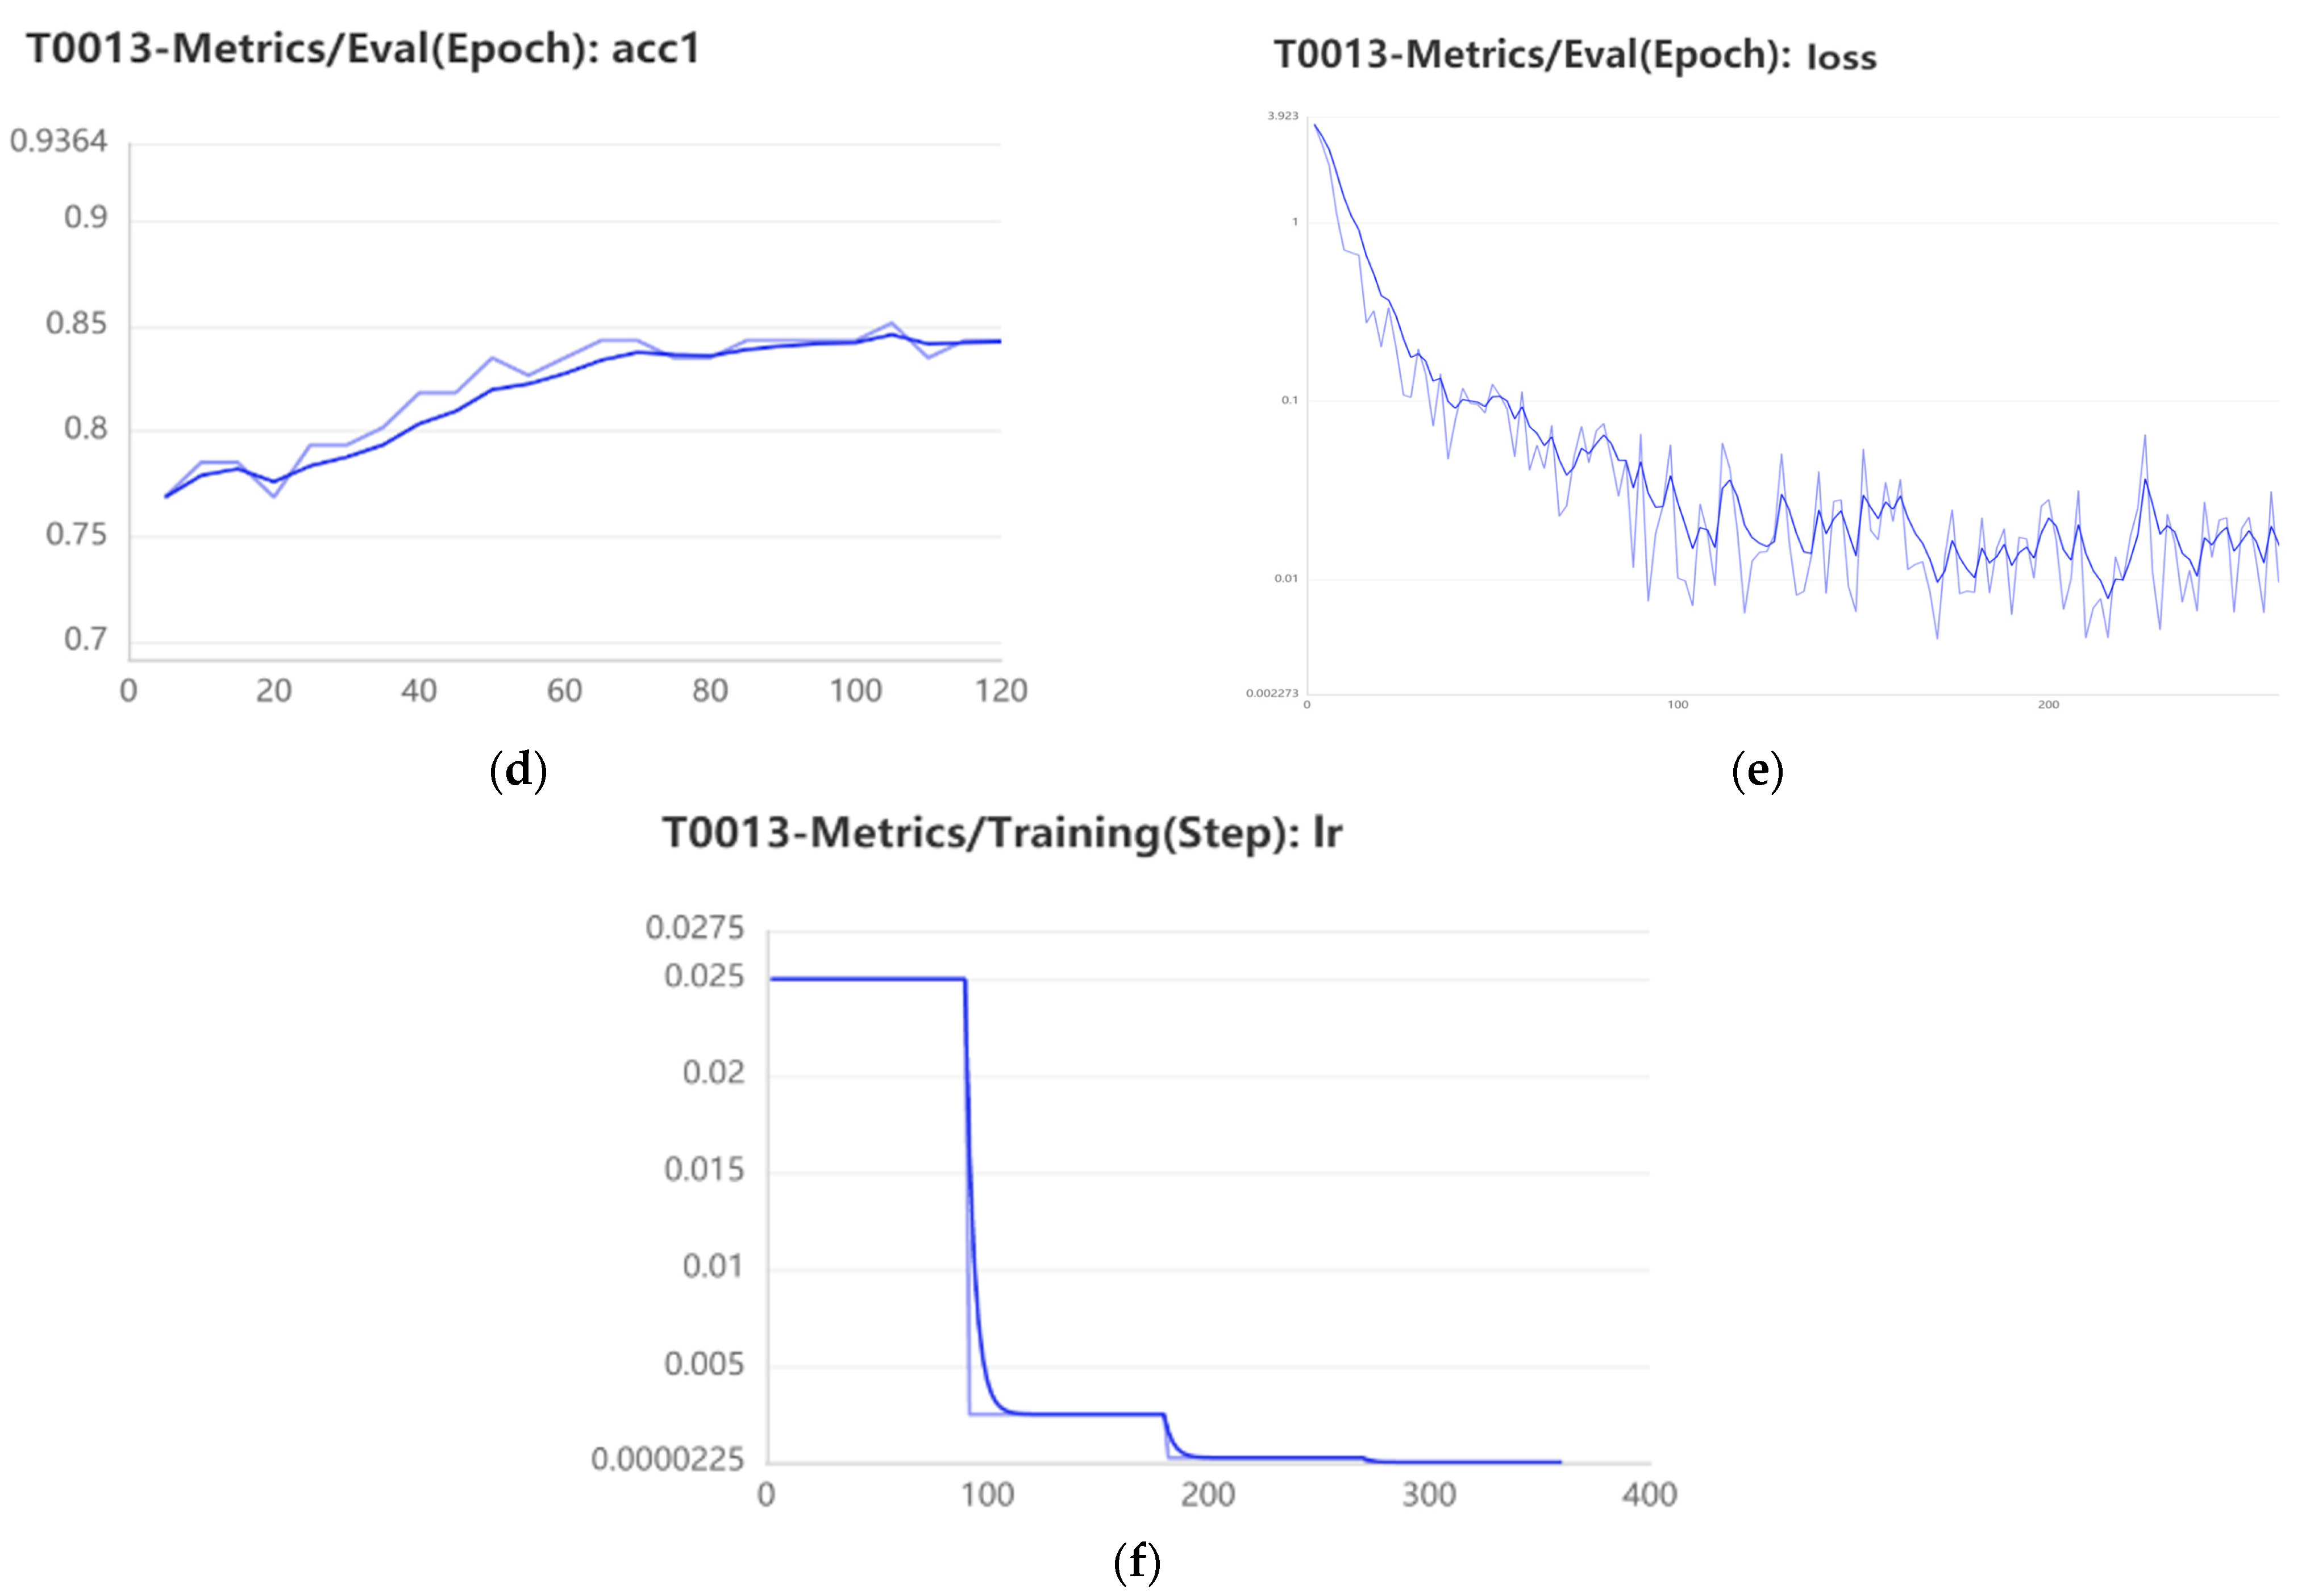
This study abandoned the high-definition scene in the laboratory based on the traditional DLC. Aiming at the problems of trajectory tracking accuracy and efficiency of piglets’ behavior, it preprocessed the original video to expand the number of tags, reduced the number of manual tags for model training to less than 10, and realized the training of small samples to solve the problems of trajectory tracking accuracy and efficiency of piglets’ behavior. The tracking accuracy and similarity analysis of the algorithm are shown in , where a is the comparison between the training marking results and the test results; b is the coordinate position of the trajectories in each frame, and the track was continuous without major drift loss; and c is the likelihood result with an average value of 97%, which was better for scenarios with less activity at night. As shown in d, the training accuracy reached 99.8%, and the test accuracy was 96.88%. As shown in e, the loss value was 0.002. As shown in f, the learning rate was 0.002.
Figure 17.
Results of the improved DLC. (a) Training and test results; (b) X and Y positions in pixels; (c) likelihood; (d) accuracy of our method; (e) loss; (f) learning rate.
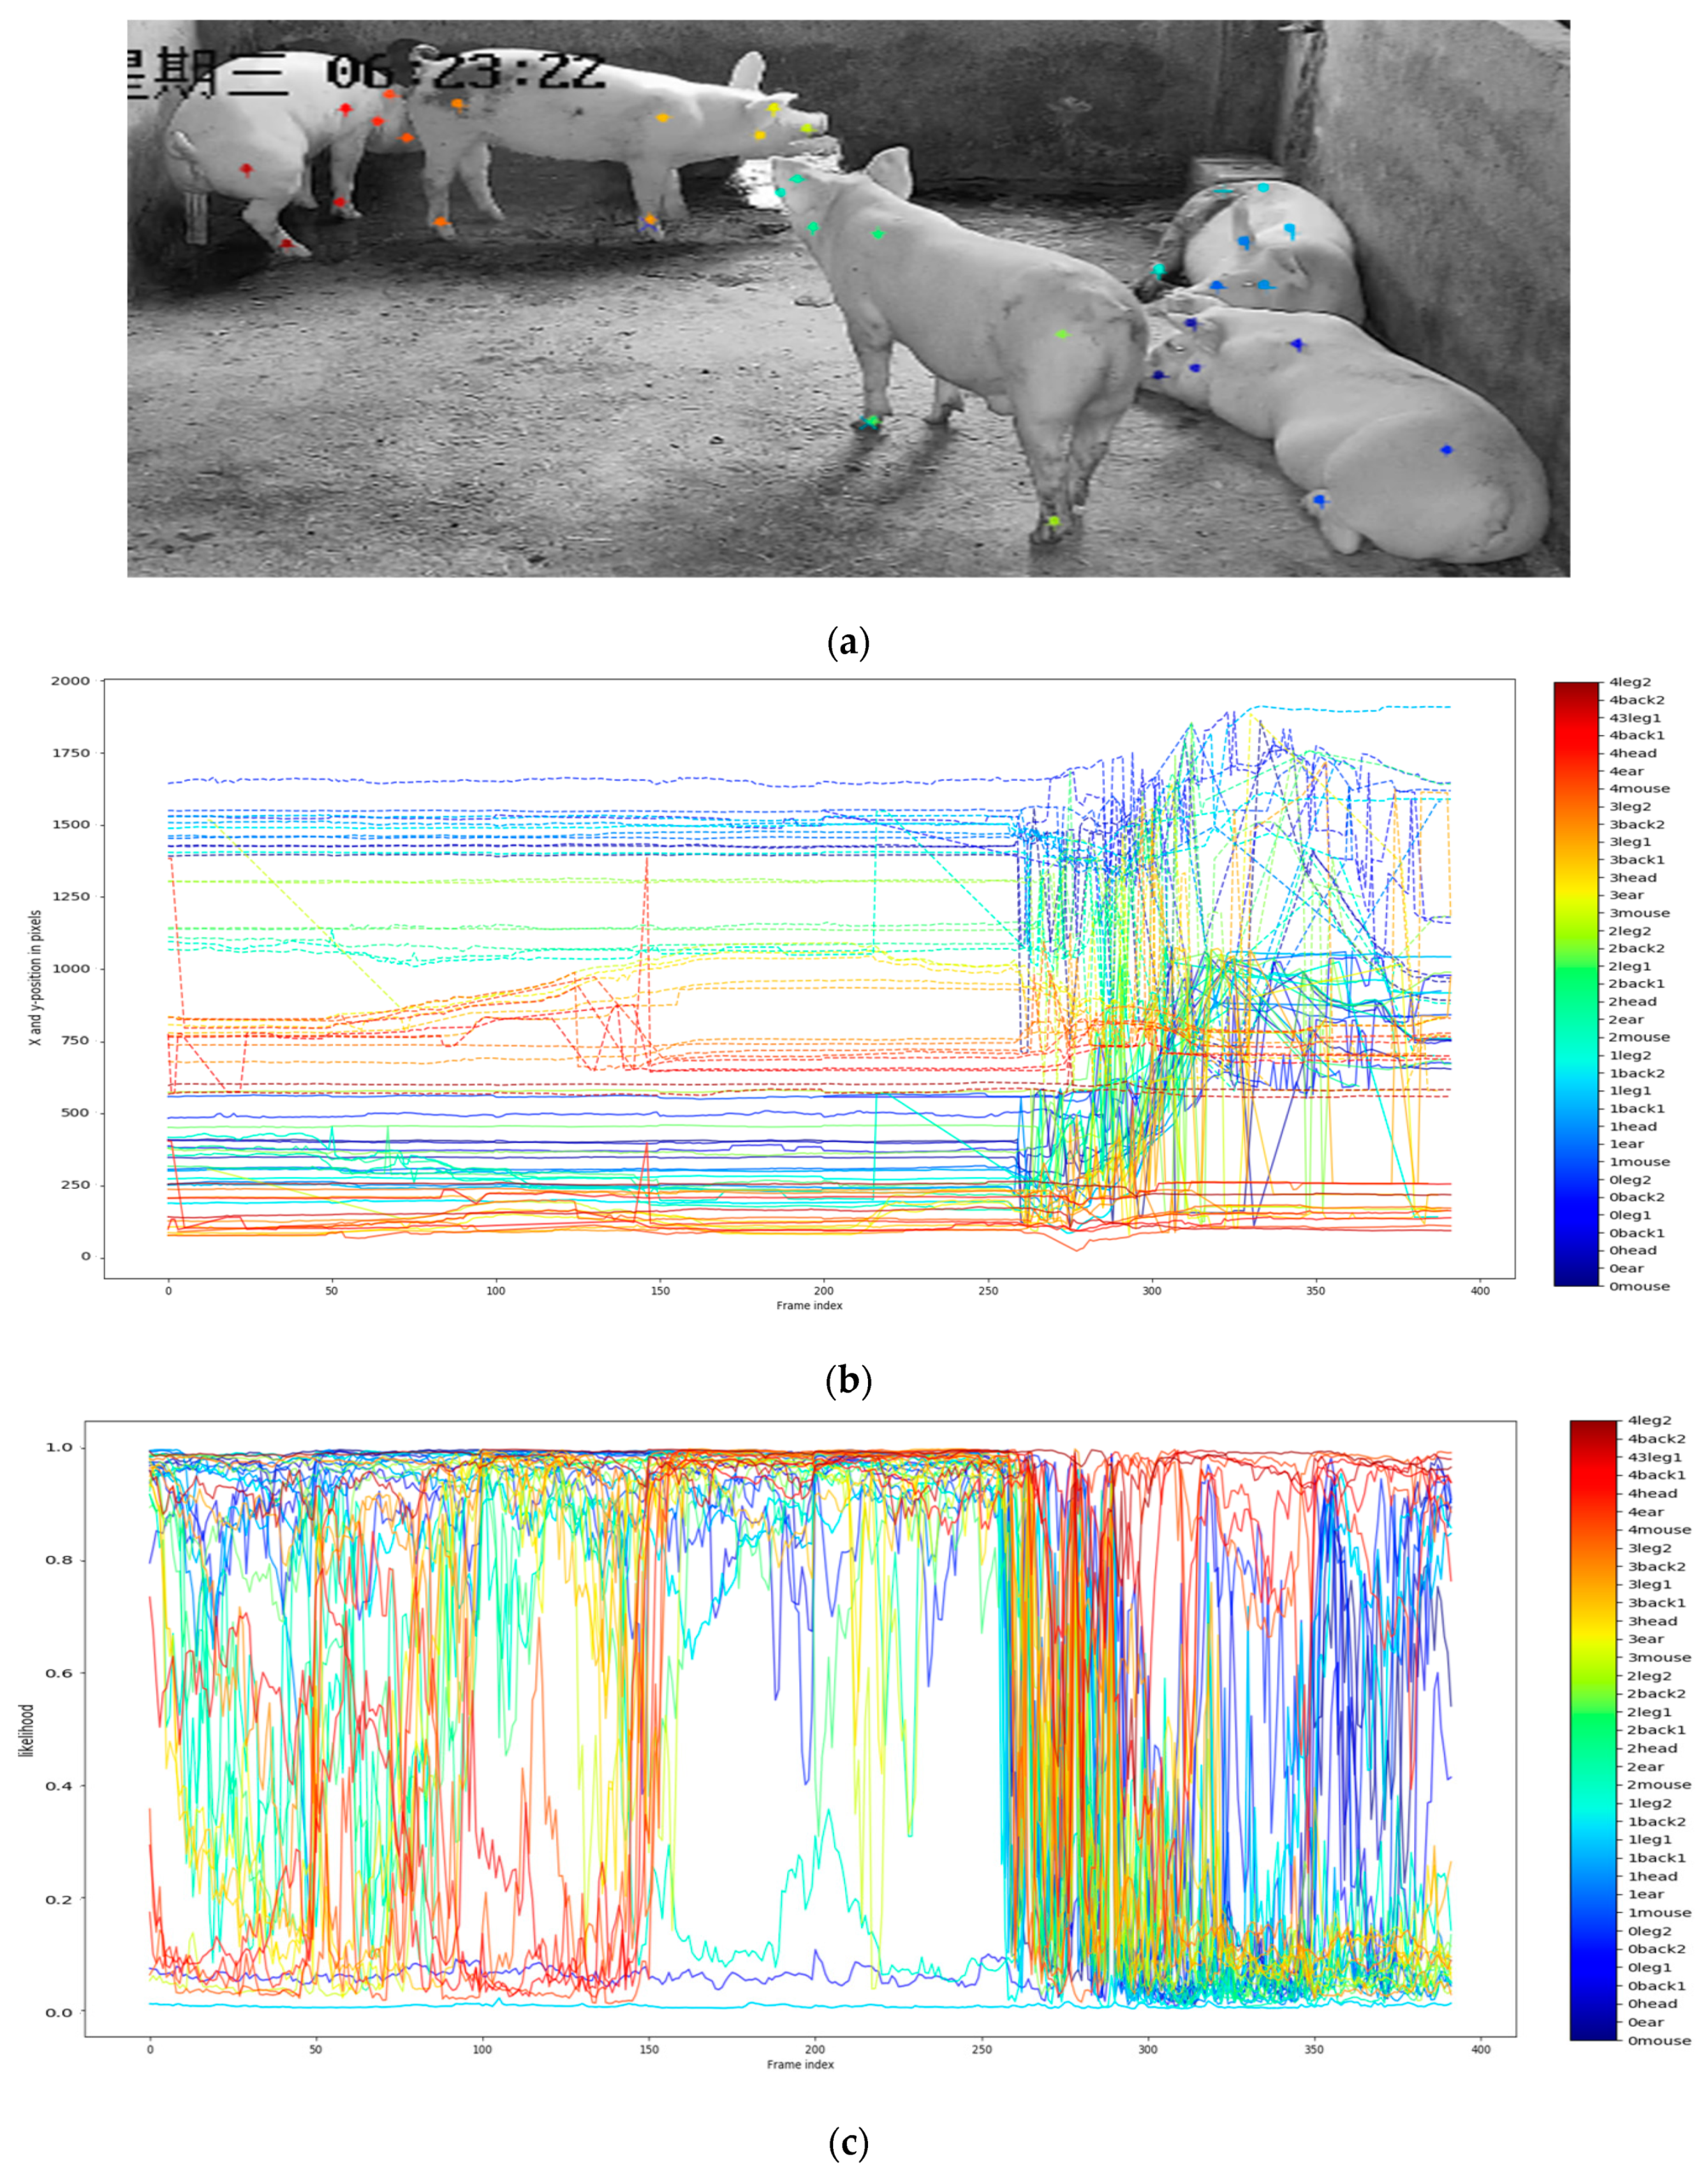
The algorithm in this study was suitable for lighting, ghosting, and fast moving of piggery scenes. It also had good robustness for multi-piglet behavior trajectory tracking. Compared with other video tracking algorithms, it realized not only the effective tracking of 5–6 pigs but also the synchronous tracking of 35 key parts of 5 pigs at the maximum in the stress test, as shown in . This set of test videos was a separate set of videos different from the model training and verification data, which were characterized by including the typical behaviors of different piglets such as excreting, sleeping, drinking and walking.
Figure 18.
Results of the stress test. (a) Training and test results; (b) X and Y positions in pixels; (c) likelihood.
According to the above results, this paper compared the number and amplitude of abnormal trajectory drift between the improved DLC-KPCA algorithm and the traditional DLC algorithm.
As shown in , the optimal experimental parameter settings (ω = 8, p = 0.9, v = 0.06) were selected to obtain the statistical data of the frequency and amplitude of the abnormal trajectory drift. Among them, in the case of the same number of tracks, the number of trajectory drift of the improved algorithm was reduced to an average of 78, and the frequency of trajectory drift was reduced to 0.78%, while the traditional DLC algorithm was 2.2 times that of the algorithm in this paper. In addition, the average amplitude of the drift trajectory of the improved algorithm was 15 px, while the traditional DLC algorithm was 3.3 times that of this paper.
Table 4.
Comparative statistics of the frequency and amplitude of abnormal trajectory drift.
For both quantitative statistical results and qualitative analysis results, the algorithm in this paper is superior to other comparison algorithms, and the trajectory correction efficiency is very good.
5. Conclusions
In this study, we proposed a novel method for tracking behavior trajectory and correcting outliers of piglets. First, the improved DLC method based on small samples ensured that the scene parsing remained unchanged. Thus, it achieved tag dependency minimization and tracking efficiency maximization. The synchronization and correlation of tracking improved with the effective behavior trajectory data. Second, the KPCA-based sparse expression method of trajectory features, which was combined with the space–time dimension anomaly correction method, mapped the nonlinear trajectory to the high-dimensional feature. This way could effectively solve the problem of internal feature mapping and realize trajectory correction. Finally, the significance identification and analysis of the four active areas of the piggery were realized.
The method could adapt to the day and night, individual piglet and piglets in group, and smudgy complex scenarios through the model generalization training. It could also achieve the effective correction of the unpredictable trajectory and had a strong nonlinear characteristic description ability. The proposed method can be used for further research in animal abnormal behavior recognition and disease warning.


