Article

Low Soil Phosphorus Availability Increases Acid Phosphatases Activities and Affects P Partitioning in Nodules, Seeds and Rhizosphere of Phaseolus vulgaris

1
Team of Plant Biotechnology and Agrophysiology of Symbiosis, Faculty of Sciences and Techniques, PO Box 549, Marrakech 40000, Morocco
2
National Institute for Agronomical Research, UMR Functional Ecology, Soils Biogeochemistry & Agroecosystems, 2 Place Viala, Montpellier F34060, France
3
Grains Legumes Program, Field Corps Laboratory, National Institute for Agronomical Research of Tunisia, rue Hédi Karray, Ariana 2080, Tunisia
4
Regional Office of Agricultural Development of Haouz, Avenue Hassan II GUELIZ 2411, Marrakech 40000, Morocco
*
Authors to whom correspondence should be addressed.
Agriculture 2012, 2(2), 139-153; https://doi.org/10.3390/agriculture2020139
Submission received: 9 April 2012 / Revised: 5 June 2012 / Accepted: 6 June 2012 / Published: 13 June 2012
(This article belongs to the Special Issue Soil Biology and Its Importance in Soil Fertility)

Abstract

:
The effect of phosphorus (P) deficiency on phosphatases activities in N2-fixing legumes has been widely studied in hydroponic culture. However, the response of acid phosphatase (APase) and phytase in rhizosphere, nodules and seeds of Phaseolus vulgaris to low soil’s P-availability is not yet fully understood. In this study, six genotypes of N2-fixing P. vulgaris were grown under contrasting soil P-availabilities; i.e., low (4.3 mg P kg−1) and sufficient (16.7 mg P kg−1) in the Haouz region of Morocco. At flowering and maturity stages, plants were harvested and analyzed for their phosphatases activities, growth and P content. Results show that, low P decreased nodulation, growth, P uptake and N accumulation in all the genotypes, but to a greater extent in the sensitive recombinant inbreed line 147. In addition, while seed P content was slightly reduced under low P soil; a higher P was noticed in the Flamingo and Contender large seeded-beans (6.15 to 7.11 mg g−1). In these latter genotypes, high APase and phytase activities in seeds and nodules were associated with a significant decline in rhizosphere’s available P. APase activity was mainly stimulated in nodules, whereas phytase activity was highly induced in seeds (77%). In conclusion, the variations of APase and phytase activities in nodules and seeds depend on genotype and can greatly influence the internal utilization of P, which might result in low P soil tolerance in N2-fixing legumes.

1. Introduction

Legumes are the most important source of proteins for direct human consumption with common bean (Phaseolus vulgaris) comprising 50% of the grain legumes consumed worldwide [1,2]. These leguminous crops are commonly considered efficient restorative agents for soil fertility. However, several environmental factors, such as acid soil conditions, salinity, low soil nitrogen (N) or phosphorus (P) levels are important constraints worldwide for leguminous crops and particularly for common bean production in most farms where this crop is grown [2]. The soil P deficiency is one of the most significant abiotic factors, along with N, limiting crop productivity. Overall, it is reported that 40% of crop production in the world’s arable land is limited by P availability [3], and sub-optimal levels of P can result in 5 to 15% yield losses [4].
The symbiotic association between common bean roots and rhizobia bacteria leads to formation of root nodules, where symbiotic nitrogen fixation (SNF) takes place. Estimates for field grown legumes revealed that up to 80% of the plant nitrogen demand is met by N2 fixation in these species [5]. However, under limiting P conditions, legumes may lose the distinct advantage of an unlimited source of symbiotic N2, decreases in N2 fixation leading to decreases in plant growth and nodulation [6]. However, the mechanism of P limitation’s effect on the N2 fixation process is not fully understood [3,7]. Under limited conditions of P, the optimum symbiotic interaction between the host plant and rhizobia would depend on efficient allocation and use of available P [8]. Improving P nutrition to legumes under P-deficient conditions has generally involved two major mechanisms: (i) increasing P acquisition (root morphology, root exudation and P uptake mechanisms); and (ii) enhancing P utilization by internal mechanisms associated with conservable use of absorbed P at the cellular level [3,9].
Some enzymes secreted by plant roots, such as phosphatases, are relatively non- specific enzymes that can hydrolyze soil P mono-esters releasing Pi and thus improving plant P acquisition [10]. Several types of phosphatases, including phytase are actually known and are normally present in soils where they originate from both micro-organisms and plant roots [11,12]. A strong relationship between phytase activity and depletion of soil organic P has been shown and a large variation was found in phytase activity of different plant rhizosphere [13], including common bean cultivars adapting their strongly impaired nodulation to P deficiency by increasing their nodule phosphatases activities to maintain relatively high P concentrations within nodules [14]. The ability of acid phosphatases and phytase activities to hydrolyze a variety of organic P is an alternative way to improve P acquisition from the soil for its subsequent utilization in plant growth [10]. The aim of this study is to compare several common bean genotypes including two recombinant inbred lines (RIL) for some physiological responses, as well as plant P nutrition and acid phosphatases activities from two contrasting soils in the Moroccan Haouz semi arid region.

2. Results

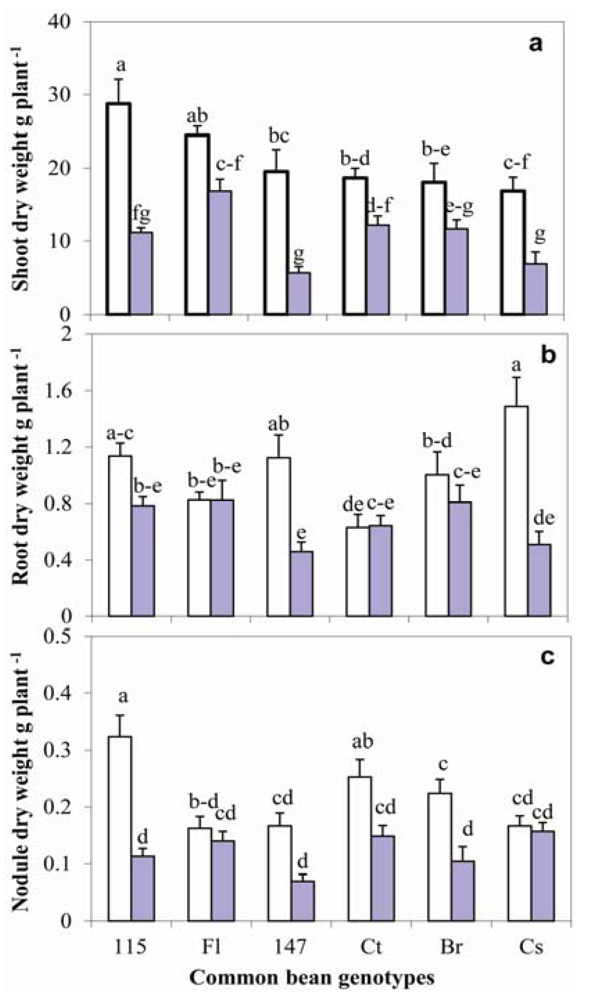
2.1. Growth and Nodulation

A significant decrease in growth was found for shoots, roots and nodules under low P soil as compared to sufficient P soil (Figure 1). Shoot growth decreased significantly (P < 0.001) under low P soil for all of the tested common bean genotypes, though, particularly for RIL 115, RIL 147 and Cs, strong decreases of 61, 70 and 58%, respectively, were recorded (Figure 1a). Moreover, under low P soil conditions, root biomass of the two last genotypes decreased significantly (P < 0.01) by 60 and 65%, respectively (Figure 1b). In contrast, the genotypes Fl, Ct and Br did not show any significant reduction of root biomass regardless of the soil P level.
Figure 1. Shoot (a); root (b) and nodule (c) biomass of six common bean genotypes grown under sufficient phosphorus (P) (empty bar) versus low P (filled bar) soil. Data are means ± se of eighteen replicates harvested at flowering stage.
Agriculture 02 00139 g001
Nodulation was suppressed in the low P soil and varied widely among genotypes, with the nodule biomass of the RIL 115, RIL 147, Br and Ct exhibiting the greatest reduction (P < 0.01) of 65, 58, 53 and 41%, respectively (Figure 1c). However, at both soil P levels, nodule biomass of the genotypes Fl and Cs did not show any significant difference.

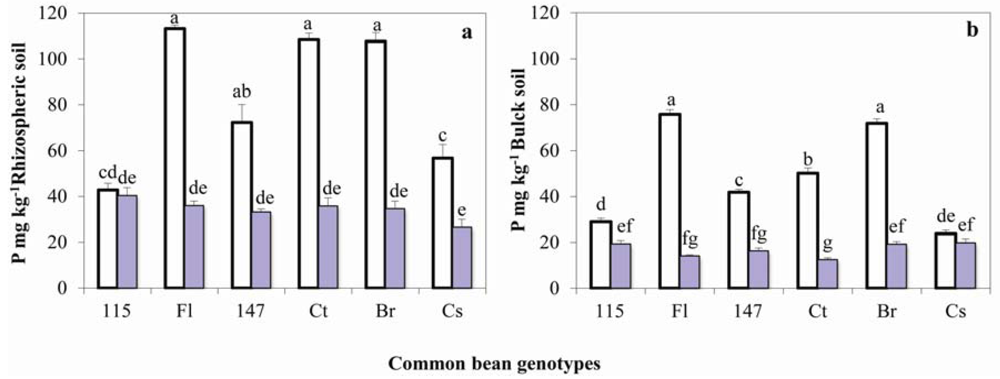
2.2. Soil Available P

Overall, Olsen P in the rhizospheric soil of all the tested genotypes was significantly higher (P < 0.001) in sufficient P than in low P soils (Figure 2a). In the sufficient P soil, Fl, Ct and Br reached the highest P values ranging between 107 and 113 mg P kg−1 soil whereas the rhizospheric soil of Concesa exhibited the lowest value of Olsen P. At low P soil, Olsen P was decreased as much as 67% in the rhizospheric soil of Fl, RIL 147, Ct, Br and Cs, whereas it was only decreased by 5.6% in RIL 115. Moreover, results showed that Olsen P was almost two folds higher in the rhizospheric soil than in the bulk soil (Figure 2b). Considering both P levels of soil, Olsen P varied from 36 to 89 mg P kg−1 soil in the rhizospheric soil and from 16 to 54 mg P kg−1 soil in the bulk soil.
Figure 2. Olsen P in the rhizospheric (a) and bulk (b) soil of six common bean genotypes grown under sufficient P (empty bar) versus low P (filled bar) soil. Data are means ± se of six replicates harvested at flowering stage.
Agriculture 02 00139 g002

2.3. Acid Phosphatase and Phytase Activities in Rhizospheric Soils

The APase activity in the rhizospheric soil significantly (P < 0.01) increased for RIL 115 (43%) in the low P than in sufficient P soil (Figure 3a). However, Cs had the highest APase activity in all soils studied. The remaining genotypes did not show any significant variation of APase activity regardless of the soil conditions.
In low P soil, although phytase activity decreased in the rhizospheric soil of Ct, Fl and Cs, differences were not significant (Figure 3b). However, the RIL 115 exhibited the highest rhizosphere phytase activity under both soil P levels.
Figure 3. Enzyme activities of APase (a) and phytase (b) in rhizospheric soil of six common bean genotypes grown under sufficient P (empty bar) versus low P (filled bar) soil. Data are means ± se of six replicates harvested at flowering stage.
Agriculture 02 00139 g003

2.4. Acid Phosphatase and Phytase Activities in Nodules and Seeds

Although nodule APase activity decreased in low P soil for RILs L115 and L147, differences were not significant (Figure 4a). By contrast, this parameter significantly increased (P < 0.01) for Ct, and particularly for Fl, APase activity was the highest at 240 mU mg−1 protein. In addition, while the cotyledon APase activity significantly increased (P < 0.01) by 44 and 70% for RIL 115 and Ct in low P soil respectively (Figure 4b), this enzyme activity did not show any significant difference in cotyledons of the remaining genotypes.
Figure 4. APase and phytase activities in nodules (a and c) and cotyledons (b and d) of six common bean genotypes grown under sufficient P (empty bar) versus low P (filled bar) soil. Data are means ± se of six replicates harvested at flowering stage.
Agriculture 02 00139 g004
In low P soil, nodule phytase activity significantly increased (P < 0.001) by 38% only in RIL 115 (Figure 4c). Meanwhile, phytase activity significantly increased (P < 0.001) in cotyledons of Fl (9.8 mU mg−1 protein), Ct (14.2 mU mg−1 protein) and Br (11.5 mU mg−1 protein).

2.5. Phosphorus and Phytate Distribution in Nodules and Seeds

Phosphorus and phytate contents in both nodules and seeds showed significant differences depending upon soil conditions, the genotypes and the P soil by genotype interaction effect (Table 1). The P content in nodules significantly increased in low P soil exclusively for RIL 115, whereas it declined for the remaining genotypes with a significant decrease (P < 0.001) for Fl only (33%). Similarly, the P content in seeds significantly decreased (P < 0.001) in low P soil for RIL 115 and Br only.
Table 1. Phosphorus (P) and phytate (Phy) contents in nodules and seeds of six common bean genotypes grown under sufficient P (S1) versus low P (S2) soil. Data are means ± se of six replicates.
GenotypesNodule P (mg g−1)Seed P (mg g−1)Nodule Phy (mg g−1)Seed Phy (mg g−1)
S1S2S1S2S1S2S1S2
L1154.95 ± 0.5e7.8 ± 0.9a–d9.5 ± 0.64a5.9 ± 0.25ef4.8 ± 0.1cd5.9 ± 0.6bc6.2 ± 0.2ab4.9 ± 0.1c–f
Fl9.3 ± 0.1a–c5.96 ± 1.3de6.2 ± 0.3d–f6.3 ± 0.3d–f6.3 ± 0.16b4.42 ± 0.3d5.7 ± 0.3a–d4.7 ± 0.2ef
L1479.6 ± 0.3ab7.8 ± 0.2a–d8.2 ± 0.6b7.24 ± 0.3ab6 ± 0.6bc5.9 ± 0.3bc5.8 ± 0.2a–c4.9 ± 0.2c–f
Ct10.45 ± 0.55a9.2 ± 0.27a–c7.1 ± 0.2cd7.1 ± 0.3cd9.3 ± 0.4a6.4 ± 0.7b6.2 ± 0.3ab4.5 ± 0.3ef
Br6.23 ± 1.4c–e5.91 ± 0.53de7.1 ± 0.2c–e5.51 ± 0.4f5.7 ± 0.2b–d4.8 ± 0.3cd6.6 ± 0.3a5.4 ± 0.3b–e
Cs6.4 ± 1.1b–e5.96 ± 1.3de5.96 ± 0.2ef5.35 ± 0.3f6 ± 0.3bc5.4 ± 0.3b–d4.2 ± 0.1f4.9 ± 0.3d–f
Mean values followed by the same letter are not significantly different at P < 0.01.
The nodule phytate content was significantly (P < 0.001) higher for Fl and Ct than for the remaining genotypes grown in the sufficient P soil. However, this parameter significantly decreased in low P soil. In addition, in low P soil, a large decrease was observed in seed phytate content for all genotypes except for RIL 147 and Cs.

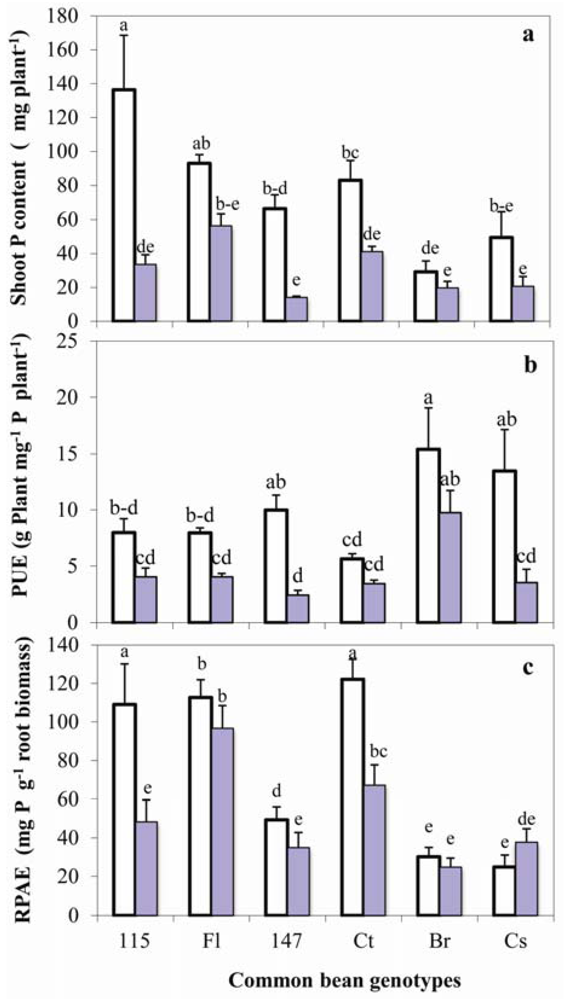
2.6. P Uptake, Use Efficiency and Absorption Efficiency by Root

In sufficient P soil, the RIL 115 exhibited the highest shoot P content (136 mg P plant−1). However, in low P soil, a significant reduction (P < 0.01) of this parameter was observed for RIL 115 (75%), L147 (79%) and Ct (50%) (Figure 5a) with the lowest value (13 and 20.9 mg P plant−1) recorded for RIL 147 and Br. Overall, under sufficient P soil, P use efficiency (PUE) was almost twice as high as that under low P soil (Figure 5b). Although PUE declined for all the genotypes, decreases were significant (P < 0.01) only for RIL 147 and Cs.
Figure 5. Shoot P content (a); P use efficiency (PUE) (b) and P absorption efficiency by root (RPAE) (c) of six common bean genotypes grown under sufficient P (empty bar) versus low P (filled bar) soil. Data are means ± se of six replicates harvested at flowering stage.
Agriculture 02 00139 g005
The P absorption efficiency by root (RPAE) was high for Ct (122 mg P g−1 root biomass), Fl (112 mg P g−1 root biomass) and RIL 115 (109 mg P g−1 root biomass) in high P soil (Figure 5c). However, this parameter significantly reduced (P < 0.001) in RIL 115 (55%) and Ct (45%) under low P soil conditions, whereas RPAE was not different for the remaining genotypes exhibiting a similar tendency as the soil P level.

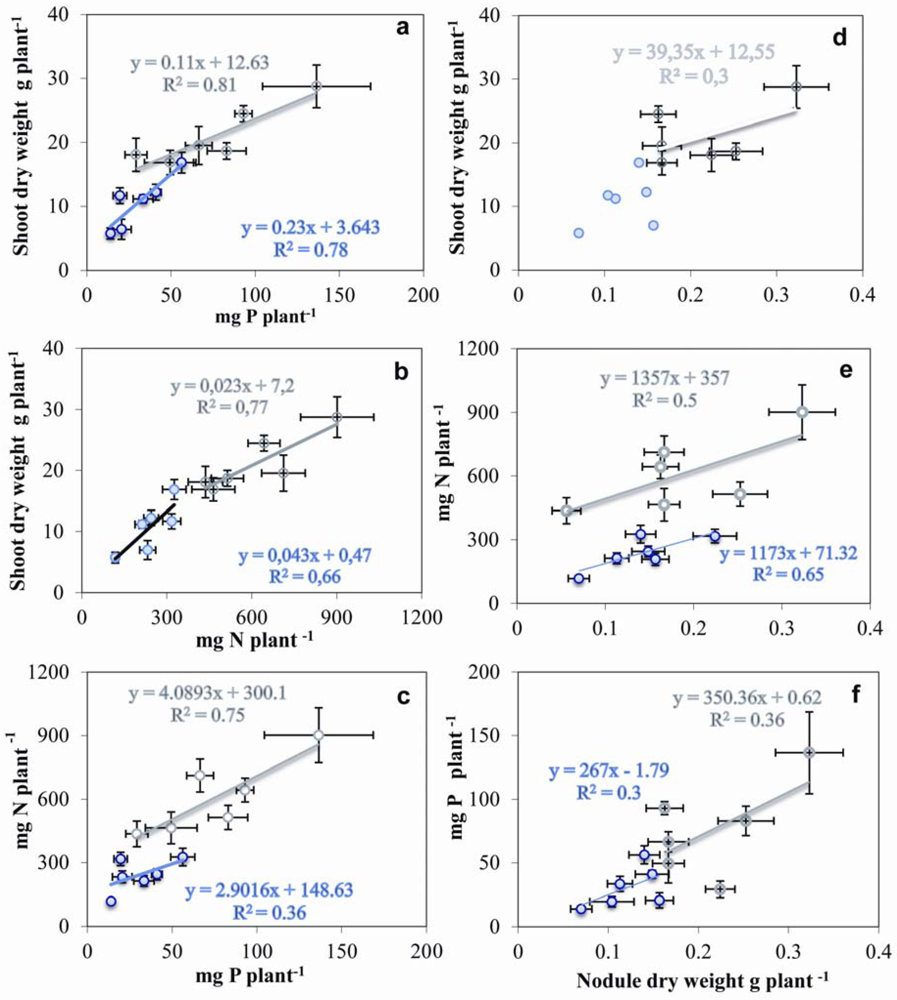
2.7. Relationship between Nodulation, Shoot Growth, P and N Contents

Considering the two soil P levels, shoot biomass was positively correlated with both P and N contents of the shoot (Figure 6a,b). Likewise, a positive correlation was observed between P and N contents of shoot, though, to a more extent in high P soil (r2 = 0.75) as compared to low P soil (r2 = 0.36) (Figure 6c). Additionally, shoot biomass (Figure 6d) and shoot N content (Figure 6e) were positively correlated with nodule biomass particularly in high P soil (r2 = 0.77) for the former one and in low P soil for the latest one (r2 = 0.65). Nevertheless, nodule biomass and plant P content were the less correlated regardless of the soil P level (Figure 6f).
Figure 6. Interactive influence of P, N and nodulation on shoot growth of six common bean genotypes grown under sufficient P (empty square) versus low P (filled square) soil. Data are means ± se of six replicates harvested at flowering stage.
Agriculture 02 00139 g006

3. Discussion

The effect of low P conditions on N2-dependent growth, acid phosphatases and P partitioning of nodulated common bean have shown several genotypic variations among the tested common bean symbioses. The increases in low P soil of APase and phytase activities both in nodules and seeds (Figure 4) were accompanied with an increase in their P content (Figure 5a). Moreover, preferential allocation of APase in nodules and phytase in seeds, most particularly, in the large seeded genotypes Fl and Ct (Figure 4 and Table 1) was accompanied with an increase in RPAE (Figure 5c). Such a relationship suggests that P translocation into seeds could be highly associated with both P absorption and utilization by common bean plants as attested by the positive correlation found between P uptake and plants growth (Figure 6b) but also to the variations of rhizospheric APase and phytase activities that were associated with significant decline of Olsen P in low P soil (Figure 2a). Accordingly, previous findings have described that efficiency in use of P may vary with the source of P, legume species and soil characteristics such as with rhizophere acidification and higher APases activities [15]. Furthermore, the high Olsen P in the rhizospheric than in the bulk soils of the tested bean genotypes may be attributed to composite (plant, nodule and rhizosphere microbe) phosphatases activities that should correspond with P stress. Several studies have suggested that high APases in the rhizosphere, compared to the bulk soil, can induce significant depletion of organic P forms in the rhizosphere [16]. Furthermore, increase of the APase, phytase and phosphoenol pyruvate phosphatase activities in nodules may constitute an adaptive mechanism for N2-fixing legumes to tolerate P deficiency [14,17,18].
These variations in rhizospheric soil could be a sink of variation in APase and phytase activities of all plant parts such as nodules and particularly seeds in which phosphatases activities could contribute to influence the internal P mobilization in the whole plant. These genotypic variations of seed parameters could be due to the efficiency in acquisition of P from the rhizosphere, PUE (Figure 5b,c) as well as the internal mobilization of P in all parts of plant. Such variations could be explained mainly by the diversity of the common bean genotypes that is highly influenced by the environmental conditions as it is reported to be a major source of variation among feed stuff [19]. Also, organic compounds secreted by plant roots would stimulate microbial activity in the rhizosphere, which might also influence the P availability [20]. In addition, the high level of P in nodules and seeds may constitute an adaptive mechanism for P deficiency tolerance since high nodule P content induces an increase in nodule conductance to the O2 diffusion [18,21] which is described as the main regulator for N2 fixation [22]. Our findings agree with many studies reporting that a large amount of plant P was essentially used in seed development of common beans [23] and nodules are a strong P sink in N2-fixing legumes [22].
Under low P soil conditions, the reduced growth and nodulation (Figure 1) emphasized with significant variations in N content, PUE and RPAE that had approximately the same trend of variation regardless of the genotypes and soils. As reported in hydroaeroponic culture under P deficiency [20], the positive correlation (r2 = 0.65) between nodule biomass and shoot N content (Figure 6e) denotes a synergetic effect between these parameters for N2 fixation in low P under field conditions. This result may reflect a tight regulation that keeps the growth of nodule mass compatible with growth in the plant shoot [24] and the relationship between P uptake (up to r2 = 0.78) and growth. These variations are tightly linked to higher P content and APase in seeds which can affect plant performance under low P soil as shown in large seeded-bean genotypes Fl and Ct. Seeds with large size and high P can contribute to a high P efficiency, and therefore, should be considered in evaluation of genotypes for P efficiency [23]. Also, Tong et al. [25] demonstrated that shoot P content correlated tightly with PUE and could be used as an important index for assessing P efficiency of soybean under low P red soil. Hence, this is in agreement with the positive correlations relating shoot biomass, N and P contents (Figure 6a,b) which showed also a positive correlation between P and N contents of the shoot (r2 = 0.75) more particularly in sufficient P soil. According to these results, the genotypes Fl, RIL 115, and Ct may be classified as the most tolerant genotypes in comparison to RIL 147 being the most sensitive one due to its severe responses to low P soil conditions. Furthermore, these former genotypes had high APase and phytase activities, high P uptake, better RPAE and also high nodule and seed P contents. They may absorb P efficiently and produce more biomass under P-deficient conditions as previously described for wheat [26] and maize inbred lines [27].

4. Experimental Section

4.1. Plant Material and Field Conditions

Six common bean (Phaseolus vulgaris L.) genotypes RIL115, RIL147, Flamingo (Fl), Bronco (Br), Contender (Ct) and Concesa (Cs) were used in the present study. The RILs 115 and 147 have been characterized, under glass house conditions, as P-efficient and P-inefficient genotypes, respectively [28]. Fl and Br were selected to their tolerance to salinity and high nodulation, respectively. Ct is an early common bean variety which tolerates cold, high temperatures and Bean Common Mosaic Virus. Whereas Cs variety is frequently cultivated in Morocco fields, known to be resistant to rust and providing green bean with high quality. Seeds were grown in two small farmer’s fields in a semi arid zone of Haouz area at the region of Marrakesh (sub-centre of Morocco). Field trials were conducted in late April and harvested in late June during two successive years (2009 and 2010). The Experiment sites are at an altitude of 466 m above mean sea level. Climate is semiarid with mean annual temperature across the sites ranged between 25 and 38 °C, and mean annual rainfall ranged between 250 and 300 mm with maximum rainfall in the period between November and February. All genotypes were grown in adjacent subplots in the same field, and each genotype (subplot) was grown into 2 m long row with four replicates. Plants were 0.2 m spaced within the adjacent 0.5 m spaced rows. The experimental design was a split plot with three repetitions. The plants were irrigated once a week using a gravity irrigation system, the trial’s management was the same as applied locally and plants were grown under SNF without fertilizers application.

4.2. Soils Analyses

Physicochemical properties of the two soils were different (Table 2) and presented, among several variables, two available P levels; low (4.3 mg P kg−1) and sufficient (16.7 mg P kg−1). The dried soil samples were passed through a 2 mm sieve. Soil pH was measured after shaking a subsample of dry soil in distilled water for 4 h at a soil: water ratio of 1 versus 5. The soil available P (Olsen P) to plants was determined after extraction in 0.5 M NaHCO3 [29]. Total P was determined after igniting air dried soil samples at 550 °C for 4 h and dissolving the ashed samples in concentrated HCl. Available and total P were analyzed by the molybdate blue method by reading the absorbance at 820 nm after color development at 100 °C for 10 min [30]. Total organic C content was estimated by oxidation with potassium dichromate and sulfuric acid and total organic N content was estimated by the Kjeldahl method.
Table 2. Chemical and physical properties of the soils used in the study.
CharacteristicsS1S2
Clay (%)18.9317.32
Sand (%)49.8666.22
Silt (%)33.7515.75
pH8.28.09
Organic matter (%)1.611.39
CaCO3 total (%)1516.3
CaCO3 active (%)2133
Ptotal (g Kg−1)1.60.54
Polsen (g Kg−1)0.01670.0043
Nitrogen (g Kg−1)1.211.09
K+ (g Kg−1)0.290.149

4.3. Harvest and Measurement of Plant, Nodule and Yield Components

At late flowering (R7) stage, plants were sampled from the two inner rows of each subplot and separated to shoots and nodulated roots. Roots and nodules were carefully separated from rhizospheric soil, washed through a sieve and then the nodules were detached. This allows to retrieve as maximum as possible nodules and roots biomass from the detached rhizospheric soil. Shoots, roots and nodules were dried at 70 °C for 3 days to determine their dry weights and thereafter dry samples were ground to enable determination of P, N and Phytate contents.

4.4. APase and Phytase Activities Assays in Rhizosphere Soils

The nodulated roots were dug to 20 cm depth and the adhered soil layers (~2 mm) were collected and designated as rhizosphere soil. All the soil samples were first sieved (<2 mm) and immediately stored at 4 °C until further analyses for activities of APase and phytase and soil bicarbonate-extractable Pi.
Soil APase activity was determined using pNPP as an orthophosphate monoester analogue substrate [31]. Briefly, 125 mg of each soil sample was placed in a 1.5 mL Eppendorf flask, 500 µL of 0.2 M sodium acetate buffer pH 5.6 and 125 µL of 10 mM pNPP, were added and the flask was swirled for a few seconds. After 30 min of incubation at 30 °C, 125 µL of 0.5 M CaCl2 and 500 µL of 1M NaOH were added, and swirled the flask to stop the reaction. The soil suspension was centrifuged for 10 min at 5000 g to avoid the interference of possible precipitates and absorbance was measured at 405 nm against the reagent blank and p-nitrophenol content determined by reference to a standard curve.
Phytase activity in the soil samples was assayed by measuring the Pi hydrolysed from sodium phytate in 0.2 M sodium acetate buffer (pH 5.6) incubated at 37 °C for 90 min. 125 mg of each soil sample were put in a 1.5 mL Eppendorf flask and added with 500 µL of 0.2 M sodium acetate buffer pH 5.6 and 125 µL of 10 mM sodium phytate prepared in the same buffer and swirled for a few seconds to mix the contents. After 90 min of incubation at 37 °C, the soil suspension was centrifuged for 15 min at 5000 g and the reaction was stopped by the addition of 500 µL 10% TCA and 125 µL 0.5 mM CaCl2 to 650 µL of the supernatant. Soil APase and phytase activities were calculated as mU per mg protein, where 1 unit (U) is defined as the activity that hydrolyses 1 µmol of pNPP or releases 1 μmol Pi per min, respectively. The protein concentrations were determined by Bradford method using the bovine serum albumin as a standard.

4.5. APase and Phytase Activities Assays in Nodules and Seeds

100 mg fresh weight of nodules (3–5 mm diameter) of each plant was carefully detached at late flowering stage and immediately frozen at −20 °C whereas seed samples were 24 h waterlogged and separated to cotyledon and embryonic axis. Each sample of nodule and cotyledon was ground; APase and phytase were extracted and assayed accordingly to the method of [14]. Enzymes activities were expressed as indicated for the soil enzymes activities.

4.6. Determination of P, N, Phytate and Statistical Analyses

Shoots, nodules and seeds P contents were determined using the molybdate blue method [30]. The ashed dried subsamples at 550 °C were dissolved in 3 mL of concentrated HCl and absorbance was measured at 820 nm. For shoot N determination, 0.5 g of subsamples were used and analyzed by the Kjeldahl method. P use efficiency (PUE) defined as the ratio of plant biomass: plant P content was determined accordingly to Ozturk et al. [32]. The P absorption efficiency by root (RPAE), which reflects the capacity of roots to absorb P from soil, was calculated as the ratio of plant P content: root dry weight [33].
Phytate in seeds and nodules was extracted by 0.2 M HCl and measured accordingly to a colorimetric method in which the wade reagent (1 mL, 0.03% FeCl3, 6H2O and 0.3% sulfosalicylic acid in distilled water) was added into the extract [34]. After vortexing the mixture, absorbance of the supernatant was measured at 500 nm against a standard curve that was established with solutions of phytic acid dodecasodium salt from corn (P-8810, Sigma).
Data were statistically analyzed by ANOVA (Statistica software) and subsequent comparison of means was performed using a post hoc LSD test. The growth values were means of eighteen replicates per soil per genotype. Values of shoot P and N contents; nodules and seeds parameters were means of six individual replicates per plant per genotype.

5. Conclusions

We conclude that Phaseolus vulgaris-rhizobia symbiosis exhibited different levels of adaptability under soil conditions of a semi arid region of Haouz, Morocco, which is mainly affected by low P availability. Improvement of nodulated legumes P nutrition is related to the influx of available P from rhizospheric soil to the roots and, therefore, its allocation into the nodules and seeds. Variation of nodules and seeds APase and phytase activities could highly affect the internal utilization of P. Interestingly; the increase of P in the large seeded genotypes may be due to a higher phytase activity in rhizospheric soil and seeds at least in high P soil. Furthermore, besides the role that acid phosphatases play within nodule for N2 fixation process, it is still not fully understood how these enzyme activities could affect the allocation of P into the shoot and seeds.

Acknowledgements

This work was financially supported by a Moroccan ministerial fellowship (2009-2011) of CNRST and partly by the Moroccan-Tunisian bilateral cooperation (26/MT/08).

References

  1. Broughton, W.J.; Hernander, G.; Blair, B.; Beebe, S.; Gepts, P.; Vanderleyden, J. Beans (Phaseolus spp.)–model food legumes. Plant Soil 2003, 252, 55–128. [Google Scholar] [CrossRef]
  2. Graham, P.H.; Vance, C.P. Legumes: Importance and constraints to greater use. Plant Physiol. 2003, 3, 872–877. [Google Scholar] [CrossRef]
  3. Vance, C.P. Symbiotic nitrogen fixation and phosphorus acquisition. Plant nutrition in a world of declining renewable resources. Plant Physiol. 2001, 127, 390–397. [Google Scholar] [CrossRef]
  4. Shenoy, V.V.; Kalagudi, G.M. Enhancing plant phosphorus use efficiency for sustainable cropping. Biotechnol. Adv. 2005, 23, 501–513. [Google Scholar] [CrossRef]
  5. Larue, T.A.; Patterson, R. How much nitrogen do legumes fix? Adv. Agron. 1981, 34, 15–38. [Google Scholar] [CrossRef]
  6. Hartwig, U.A.; Nosberger, J. What triggers the regulation of nitrogenase activity in forage legume nodules after defoliation? Plant Soil 1994, 161, 109–114. [Google Scholar] [CrossRef]
  7. Hellsten, A.; Huss-Danell, K. Interaction effects on nitrogen and phosphorus on nodulation in red clover (Trifolium patens L.). Acta Agric. Scand. 2001, 50, 135–142. [Google Scholar]
  8. Al-Niemi, T.S.; Kahn, M.L.; Mc Dermott, T.R. P metabolism in the bean Rhizobium tropici symbiosis. Plant Physiol. 1997, 113, 1233–1242. [Google Scholar]
  9. Raghothama, K.G. Phosphate acquisition. Annu. Rev. Plant Physiol. Plant Mol. Biol. 1999, 50, 665–693. [Google Scholar] [CrossRef]
  10. Duff, S.M.G.; Sarath, G.; Plaxton, W.C. The role of acid phosphatases in plant phosphorus metabolism. Physiol. Plant. 1994, 90, 791–800. [Google Scholar] [CrossRef]
  11. Richardson, A.E.; Hadobas, P.A.; Hayes, J.E. Extracellular secretion of Aspergillus phytase from Arabidopsis roots enables plants to obtain phosphorus from phytate. Plant J. 2001, 25, 641–649. [Google Scholar]
  12. Tarafdar, J.C.; Yadav, R.S.; Niwas, R.J. Relative efficiency of fungal intra- and extracellular phosphatases and phytase. Plant Nutr. Soil Sci. 2002, 165, 17–19. [Google Scholar] [CrossRef]
  13. Yadav, B.K.; Tarafdar, J.C. Phytase activity in the rhizosphere of crops, trees and grasses under arid environment. J. Arid Environ. 2004, 58, 285–293. [Google Scholar] [CrossRef]
  14. Araújo, A.P.; Plassard, C.; Drevon, J.J. Phosphatase and phytase activities in nodules of common bean genotypes at different levels of phosphorus supply. Plant Soil 2008, 312, 129–138. [Google Scholar] [CrossRef]
  15. Li, L.; Tang, C.; rengel, Z.; Zhang, F. Chickpea facilitates phosphorus uptake by intercropped wheat by an organic phosphorus source. Plant Soil 2003, 248, 297–303. [Google Scholar] [CrossRef]
  16. Radersma, S.; Grierson, P.F. Phosphorus mobilization in agroforestry: Organic anions, phosphatase activity and phosphorus fractions in the rhizosphere. Plant Soil 2004, 259, 209–219. [Google Scholar] [CrossRef]
  17. Kouas, S.; Alkama, N.; Abdelly, C.; Drevon, J.J. Proton release by nodulated roots varies among common bean genotypes (Phaseolus vulgaris) under phosphorus deficiency. Plant Nutr. Soil Sci. 2008, 171, 242–248. [Google Scholar] [CrossRef]
  18. Bargaz, A.; Ghoulam, C.; Amenc, L.; Lazali, M.; Faghire, M.; Abadie, J.; Drevon, J.-J. A phosphoenol pyruvate phosphatase gene transcript is induced in the root nodule cortex of Phaseolus vulgaris under P deficiency. J. Exp. Bot. 2012, in press.. [Google Scholar]
  19. Li, Y.-F.; Luo, A.-C.; Wei, X.-H.; Yao, X.-G. Changes in phosphorus fractions, pH and phosphatase activity in rhizosphere of two rice genotypes. Pedosphere 2008, 18, 785–794. [Google Scholar] [CrossRef]
  20. Bowen, G.D.; Rovira, A.D. The rhizosphere and its management to improve plant growth. Adv. Agron. 1999, 66, 1–102. [Google Scholar] [CrossRef]
  21. Bargaz, A.; Ghoulam, C.; Faghire, M.; Aslan Attar, H.; Drevon, J.J. The nodule conductance to the O2 diffusion increases with high phosphorus content in the Phaseolus vulgaris-rhizobia symbiosis. Symbiosis 2011, 53, 157–164. [Google Scholar] [CrossRef]
  22. Schulze, J.; Drevon, J.J. P-deficiency increases the O2 uptake per N2 reduced in alfalfa. J. Exp. Bot. 2005, 56, 1779–1784. [Google Scholar] [CrossRef]
  23. Yan, X.; Lynch, J.P.; Beebe, S.E. Genetic variation for phosphorus efficiency of common bean in contrasting soil types: II. Yield response. Crop Sci. 1995, 35, 1094–1099. [Google Scholar] [CrossRef]
  24. Rotaru, V.; Sinclair, T.R. Interactive influence of phosphorus and iron on nitrogen fixation by soybean. Environ. Exp. Bot. 2009, 66, 94–99. [Google Scholar] [CrossRef]
  25. Tong, X.J.; Lu, Y.G.; Yan, X. Studies on the characteristics of phosphorus efficiency of native soybean (Glycine Max L. Merr.) germplasm: Differences in characteristics of phosphorus efficiency of shoot and root among soybean genotypes and correlation analysis. Chin. J. Oil Crop Sci. 2000, 22, 48–53. [Google Scholar]
  26. Ortiz-Monasterio, R.J.I.; Sayre, K.D.; Rajaram, S.; Mc Mahon, M. Genetic progress in wheat yield and nitrogen use efficiency under four nitrogen rates. Crop Sci. 1997, 37, 898–904. [Google Scholar] [CrossRef]
  27. Zhang, J.H.; Zhang, J.Y.; Yang, X.H.; Jin, H.A. Study on genetic relationship of main maize inbred lines in Yunnan by SSR markers. J. Maize Sci. 2007, 15, 30–35. [Google Scholar]
  28. Drevon, J.J.; Alkama, N.; Araujo, A.; Beebe, B.; Aslan Attar, H.; Benoit, J.; Lopez, A.; Martinez-Romero, E.; Rodino, P.; Tajini, F.; Zaman-Allah, M. Nodular diagnosis for ecological engineering of the symbiotic nitrogen fixation with legumes. Proc. Environ. Sci. 2010, 9, 40–46. [Google Scholar]
  29. Olsen, S.R.; Cole, C.V.; Watanabe, F.S.; Dean, L.A. Estimation of Available Phosphorus in Soil by Extraction with Sodium Bicarbonate; Circular 939; USDA: Washington, DC, USA, 1954; p. 19. [Google Scholar]
  30. Murphy, J.; Riley, J.P. A modified single solution method for the determination of phosphate in natural waters. Acta Anal. Chim. 1962, 27, 31–36. [Google Scholar] [CrossRef]
  31. Tabatabai, M.A. Soil enzymes. In Methods of Soil Analysis, Part 2, Microbiological and Biochemical Properties; Soil Science Society of America: Madison, WI, USA, 1994; pp. 775–833. [Google Scholar]
  32. Ozturk, L.; Eker, S.; Bulent, T.; Cakmak, I. Variation in P efficiency among 73 bread and durum wheat genotypes grown in a P-deficient calcareous soil. Plant Soil 2005, 269, 69–80. [Google Scholar] [CrossRef]
  33. Pan, X.-W.; Li, W.-B.; Zhang, Q.-Y.; Li, Y.-H.; Liu, M.-S. Assessment on phosphorus efficiency characteristics of soybean genotypes in phosphorus-deficient Soils. Agric. Sci. 2008, 7, 958–969. [Google Scholar]
  34. Vaintraub, I.A.; Lapteva, N.A. Colorimetric determination of phytate in unpurified extracts of seeds and the products of their processing. Ann. Biochem. 1988, 175, 227–230. [Google Scholar]

