Article

Assessing the Potential for Ion Selective Electrodes and Dual Wavelength UV Spectroscopy as a Rapid on-Farm Measurement of Soil Nitrate Concentration

1
School of Environment, Natural Resources and Geography, Bangor University, Gwynedd, LL57 2UW, UK
2
John Innes Centre, Norwich Research Park, Norwich, NR4 7UH, UK
*
Author to whom correspondence should be addressed.
Agriculture 2013, 3(3), 327-341; https://doi.org/10.3390/agriculture3030327
Submission received: 16 May 2013 / Revised: 21 June 2013 / Accepted: 24 June 2013 / Published: 2 July 2013

Abstract

:
Current fertiliser recommendations for nitrogen are limited in their accuracy and may be improved by the use of simple on-farm soil rapid tests. This paper investigates the potential for using nitrate (NO3) ion selective electrodes (ISEs) and dual wavelength UV spectroscopy as part of a rapid soil NO3 diagnostic test. Three soil types, representing the major soil types for agriculture in the western UK, were tested. For the three soils, the ISE rapid test procedure gave a near 1:1 response (r2 = 0.978, 0.968, 0.989) compared to the internationally-approved standard laboratory method. However, the accuracy of the ISE rapid test was reduced at low soil NO3 concentrations (<10 mg NO3 L−1). We also show that NO3 analysis of H2O soil extracts by dual wavelength UV spectroscopy was also highly correlated (r2 = 0.978, 0.983, 0.991) to the standard laboratory method. We conclude that both ISE and dual wavelength UV spectroscopy have clear potential to be used for the rapid on-farm determination of soil NO3 concentration. Barriers to use of these field-based assessment tools include, farmer perception of cost-benefit, general attitude to new technologies and the ability to generate useful fertiliser use strategies from soil NO3 measurements.

1. Introduction

Improving nitrogen use efficiency (NUE) is a major goal within agricultural systems [1] and is key to the success of sustainable intensification [2]. Use of nitrogen (N) fertilisers represents the major N input in most farming systems and both under- and over-use of N fertilisers can represent an economic loss for the farmer, while over-use may cause significant environmental pollution [3,4,5,6]. In a purely economic sense, an optimum N fertiliser strategy can be defined as the point at which the cost of an additional unit of N is no longer covered by the resulting increase in crop yield. Defining an environmental optimum rate of N addition, however, is much more problematic. Calculating an optimum N fertilisation strategy is extremely desirable, but very difficult to achieve due to the inherent complexity of the soil-plant system, temporal and spatial variability and the importance of uncontrolled variables such as weather [5]. One theoretical method for improving NUE is to ensure synchronicity of supply and demand, both spatially and temporally, by maintaining the pool of plant available N in the soil at the minimum size required to meet crop demand [7,8]. NO3 is typically the most important crop-available form of N in most temperate climate, near neutral pH soils, although in some grassland soils ammonium (NH4+) may dominate. The mobility of NO3 within soil makes it easy for plants to uptake, but this property also makes it prone to being leached from the soil profile when field capacity is reached, with resulting water pollution issues. Regular testing of soil NO3 concentration, over the course of the growing season, may help farmers improve their nutrient management strategy by better matching supply and demand.
Current methods of calculating the N requirement of the crop over the growing season, and hence fertiliser N additions, require a prediction of the crop yield, based on soil type, climatic zone, topography and other variables. The amount of crop-available N that can be supplied by the soil in its pre-fertilised state over the growing season is then measured or estimated; this is known as the soil nitrogen supply (SNS). The difference between crop requirement and the SNS can then be made up for by addition of N fertiliser [5]. A variation of this method is widely used in the UK and is prescribed by The Fertiliser Manual RB209 [9]. A key component of the SNS is the concentration of soil mineral nitrogen (SMN), which consists of NH4+ and NO3. RB209 provides tables to allow estimation of a field’s SNS depending upon its soil type and previous management. This estimation can also be supplemented by measuring the SMN of the pre-fertilised soil.
Traditionally, laboratory analysis has been used for soil testing. However, it is expensive and time-consuming and therefore not suitable as a method of regular and frequent testing. There are also other problems with laboratory analysis. Unwanted mineralisation and nitrification/denitrification of the samples may occur during transport and storage prior to analysis. Significant changes to the intrinsic soil NO3 status may also occur, due to changes in the prevailing weather (e.g., during the delay between sampling and receiving the results). Farmer-operated rapid diagnostic testing potentially offer a cheap and instantaneous determination of soil NO3 status where the results can be used to directly inform nutrient management strategies, benefiting both the farmer and the environment. Previous work on rapid soil tests have largely been based on colorimetric strips combined with a handheld reflectometer [10,11,12,13] and ion selective electrodes (ISEs) [12,14], which have been described as semi-quantitative [15]. New, more quantitative methods are therefore required.
This study aimed to evaluate two contrasting rapid test methods for evaluating soil NO3 concentration. Firstly, we compared a rapid extraction method, which could be used in-field for the extraction of soil NO3, coupled with NO3 determination using an ISE, to the standard laboratory determination of soil NO3. Secondly, we evaluated the use of UV spectroscopy for NO3 determination in soil extracts in comparison to the ISE approach. The results were used to evaluate the potential of the two approaches for the on-farm measurement of soil NO3 status.

2. Materials and Methods

2.1. Soil Type and Sampling

Three contrasting soils were collected from Henfaes Research Station, Abergwyngregyn, UK (53°14′ N, 4°01′ W). Soil 1 is a lowland, clay loam textured Eutric Cambisol collected from an area of no vegetation cover, which had been used for potato production the previous season. Soil 2 is a lowland, silty loam textured Dystric Gleysol collected from a poorly draining area of an intensively sheep grazed field (ca. >10 ewe ha−1) receiving regular fertiliser inputs (120 kg N ha−1 yr−1) and dominated by Lolium perenne L. Soil 3 is a sandy loam textured Haplic Podzol collected from an upland, extensively grazed (<0.1 ewe ha−1) unimproved acid grassland (Pteridium aquilinum L. Kuhn. and Festuca ovina L.). Prior to sampling, the overlying vegetation cover was removed and the soil sampled from a depth of 3–15 cm. After collection, the soil was stored in gas permeable polyethylene bags for immediate transport to the laboratory. The soil was refrigerated at <5 °C until it was needed for the experimental procedure. Immediately prior to use, the soil was sieved to 8 mm to remove large stones, roots, vegetation and earthworms and then thoroughly mixed.

2.2. Background Soil Analysis

Soil pH and electrical conductivity were determined in a 1:2 (w:v) soil:water mix using standard electrodes. Moisture content was determined by drying for 24 h at 105 °C. Organic matter content was determined by loss-on-ignition at 450 °C for 12 h. Total C and N were determined with a CHN2000 analyser (Leco Corp., St Joseph, MI, USA). Results for background soil analysis can be found in Table 1.
Table 1. Background characteristics of the three soils used in the experiments.
Soil pHEC (µS cm−1)Moisture content (g g−1)Total C (%)Total N (%)
Eutric Cambisol6.5359.40.253.50.29
Dystric Gleysol6.5359.40.281.10.10
Haplic Podzol5.3412.90.706.10.57

2.3. Ion Selective Electrode (ISE)

A commercially available NO3 ISE (ELIT 8021) with a solid state PVC polymer matrix membrane was used in conjunction with a double junction lithium acetate reference electrode (RE) (ELIT 003n), supplied by Electro Analytical Instruments (EAI) (Wembley, UK). The NO3 ISE is reported to have an operational concentration range from 0.3–6300 mg NO3 L−1, a response time of <10 s, working pH range of pH 2–11, operational temperature range from 0–50 °C and an electrode slope of 54 ± 5 mV decade−1 at 25 °C. The ISE and RE were coupled with a multi-channel analyser (6+6-Channel Ion/pH/ORP/Tmp.Monitor MCC-SYSti-6+6b) and corresponding PC software (MCC-MON-6+6c, Version 2.1.1) supplied by Electro Analytical Instruments (EAI) (Wembley, UK). Prior to initial use, the ISE was pre-conditioned in a 1000 mg L−1 NO3 solution for 4 h. The calibration is calculated and stored by the software using a semi-logarithmic interpolation method.

2.4. NO3 Determination Using Ion Selective Electrode Rapid Test Method

Before each set of measurements, the ISE was calibrated using a range of NO3 solutions (1000, 100, 10, 1, 0.5 mg NO3 L−1). The temperature of the calibrating solutions differed from the experimental measurements by a maximum of ±2 °C. 10 g soil (n = 3 for each soil type) was placed in a 50 cm3 polypropylene tube and spiked with 1 mL of NO3 solution (2000, 1800, 1600, 1400, 1200, 1000, 800, 600, 400, 200, 100 or 0 mg L−1 (in addition the Eutric Cambisol was spiked with 20 and 10 mg L−1)) to achieve a range of intrinsic NO3 concentrations reflective of those that might occur in the field. Extraction was then performed by the addition of 20 mL of double distilled (DD) H2O followed immediately by manual shaking by hand for 2 min. This extraction procedure is referred to as the rapid extraction method. The ISE was placed into the resulting soil slurry and a reading taken after 3 min. Between each measurement, the electrodes were rinsed with DD H2O and dried with paper tissue. The soil slurry was subsequently centrifuged (20 min at 4000 rev min−1 followed by 20 min at 14,000 rev min−1) and the supernatant decanted for NO3 analysis by the colorimetric Griess reaction method of Miranda et al. [16]—referred to as the standard laboratory method. This analysis reflects internationally accepted protocols for ex situ soil nitrate analysis [17].
It should be noted that ISEs respond not to the concentration but the activity of the specified ion. The activity of the ion depends upon both the concentration of the ion and the total ionic strength of the solution. There is little difference in concentration and activity at low ionic solution strength i.e. below 1 mM. However, above this they diverge leading to the potential for systematic error. In previous experiments using ISEs for determination of soil NO3 concentration, ionic strength adjustment buffers (ISAB) have been used to keep the ionic strength of the calibrating solutions equal and approximately matched to samples being tested [18]. This was not possible in this experiment as adding NO3 to the soil in varying amounts intrinsically meant that the ionic strength of the soil solution would be different between different treatments. The extracted solutions of soils amended with 1 mL of 2000 mg L−1 NO3, would not exceed an ionic strength of 3 mM, which would result in a 6% difference between concentration and activity for monovalent ions. Whilst this has the potential to cause systematic error, this is partially offset by the fact that the ISEs were calibrated for concentration without ISAB. For the soils which were not spiked with NO3, the ionic strengths of the measured extractions did not exceed 1 mM (equivalent to an electrical conductivity of 120 µs cm−1), which would not cause a significant error.

2.5. Nitrate Extraction and Determination by the Standard Lab Method

NO3 was extracted from the soil using 1 M KCl or DD H2O (10 g soil:20 mL) by mechanical shaking at 150 rev min−1 for 30 min. The resulting mixture was then centrifuged and analysed by the colorimetric Griess reaction method of Miranda et al. [16]. This is referred to as the standard lab method with KCl/H2O extraction.

2.6. NO3 Determination by Dual Wavelength UV Spectroscopy

NO3 in the standard KCl and H2O extracts were also analysed with dual wavelength UV spectroscopy at 205 nm and 300 nm using the method described in Edwards et al. [19]. NO3 absorbs strongly at 205 nm, however, dissolved organic matter (DOM) also absorbs strongly at this wavelength. To compensate for this, the DOM can also be measured at 300 nm, where no NO3 absorption occurs, and the relationship between the DOM absorbance at 205 and 300 nm can be incorporated into a traditional NO3 calibration curve to account for the DOM present as follows:
DOM205 = (2.841 × DOM300) − 0.0126
where DOM205 = organic matter absorbance at 205 nm, DOM300 = organic matter absorbance at 300 nm. The DOM205 absorbance value is simply subtracted from the sample reading prior to calculating NO3 from the standard curve. This method was originally developed for testing natural waters and to our knowledge has not been used for NO3 determination of soil extracts.

2.7. Evaluation of the Methods across a Broad Range of Soils

A diverse range of different soils (n = 23) were sampled from within a 10 km2 radius of the Henfaes Research Station. The samples were analysed using the ISE rapid test method (n = 23), the standard lab method with H2O extraction (n = 23) and UV spectroscopy (n = 16) as described above. These soils were not spiked with NO3. Background analysis of these soils can be found in Table 2.
Table 2. Background soil analysis for the broad range of soil sampled from within a 10 km2 radius of the Henfaes Research Station. EC = Eutric Cambisol, DG = Dystric Gleysol, HP = Haplic Podzol.
SampleSoilpHEC (µS cm−1)Moisture content (g g−1)Organic matter (%)
1DG6.0419.30.335
2EC6.0413.90.387
3HP5.856.40.5110
4HP6.0735.10.325
5HP4.8543.20.5218
6HP5.6516.50.8117
7HP5.8984.60.369
8EC6.3820.30.197
9EC6.1913.80.175
10EC6.6555.00.178
11EC7.1434.30.186
12EC6.4843.50.297
13EC6.5147.80.3912
14EC6.6118.10.254
15EC6.2949.80.5210
16EC6.2345.70.308
17DG5.3769.70.638
18HP4.5332.60.375
19EC5.186.80.3011
20EC6.2845.70.246
21EC6.8450.00.206
22EC5.3938.60.395
23EC5.5290.20.4610

2.8. Statistical Analysis

All concentrations given in this paper are reported in mg NO3 L−1. Linear regression analysis was undertaken using SigmaPlot v12.3 (Systat Software Inc., Hounslow, UK) and paired t-tests were undertaken with SPSS v20 (IBM Ltd., Portsmouth, UK). P < 0.05 was used as the cut-off for statistical significance.

3. Results and Discussion

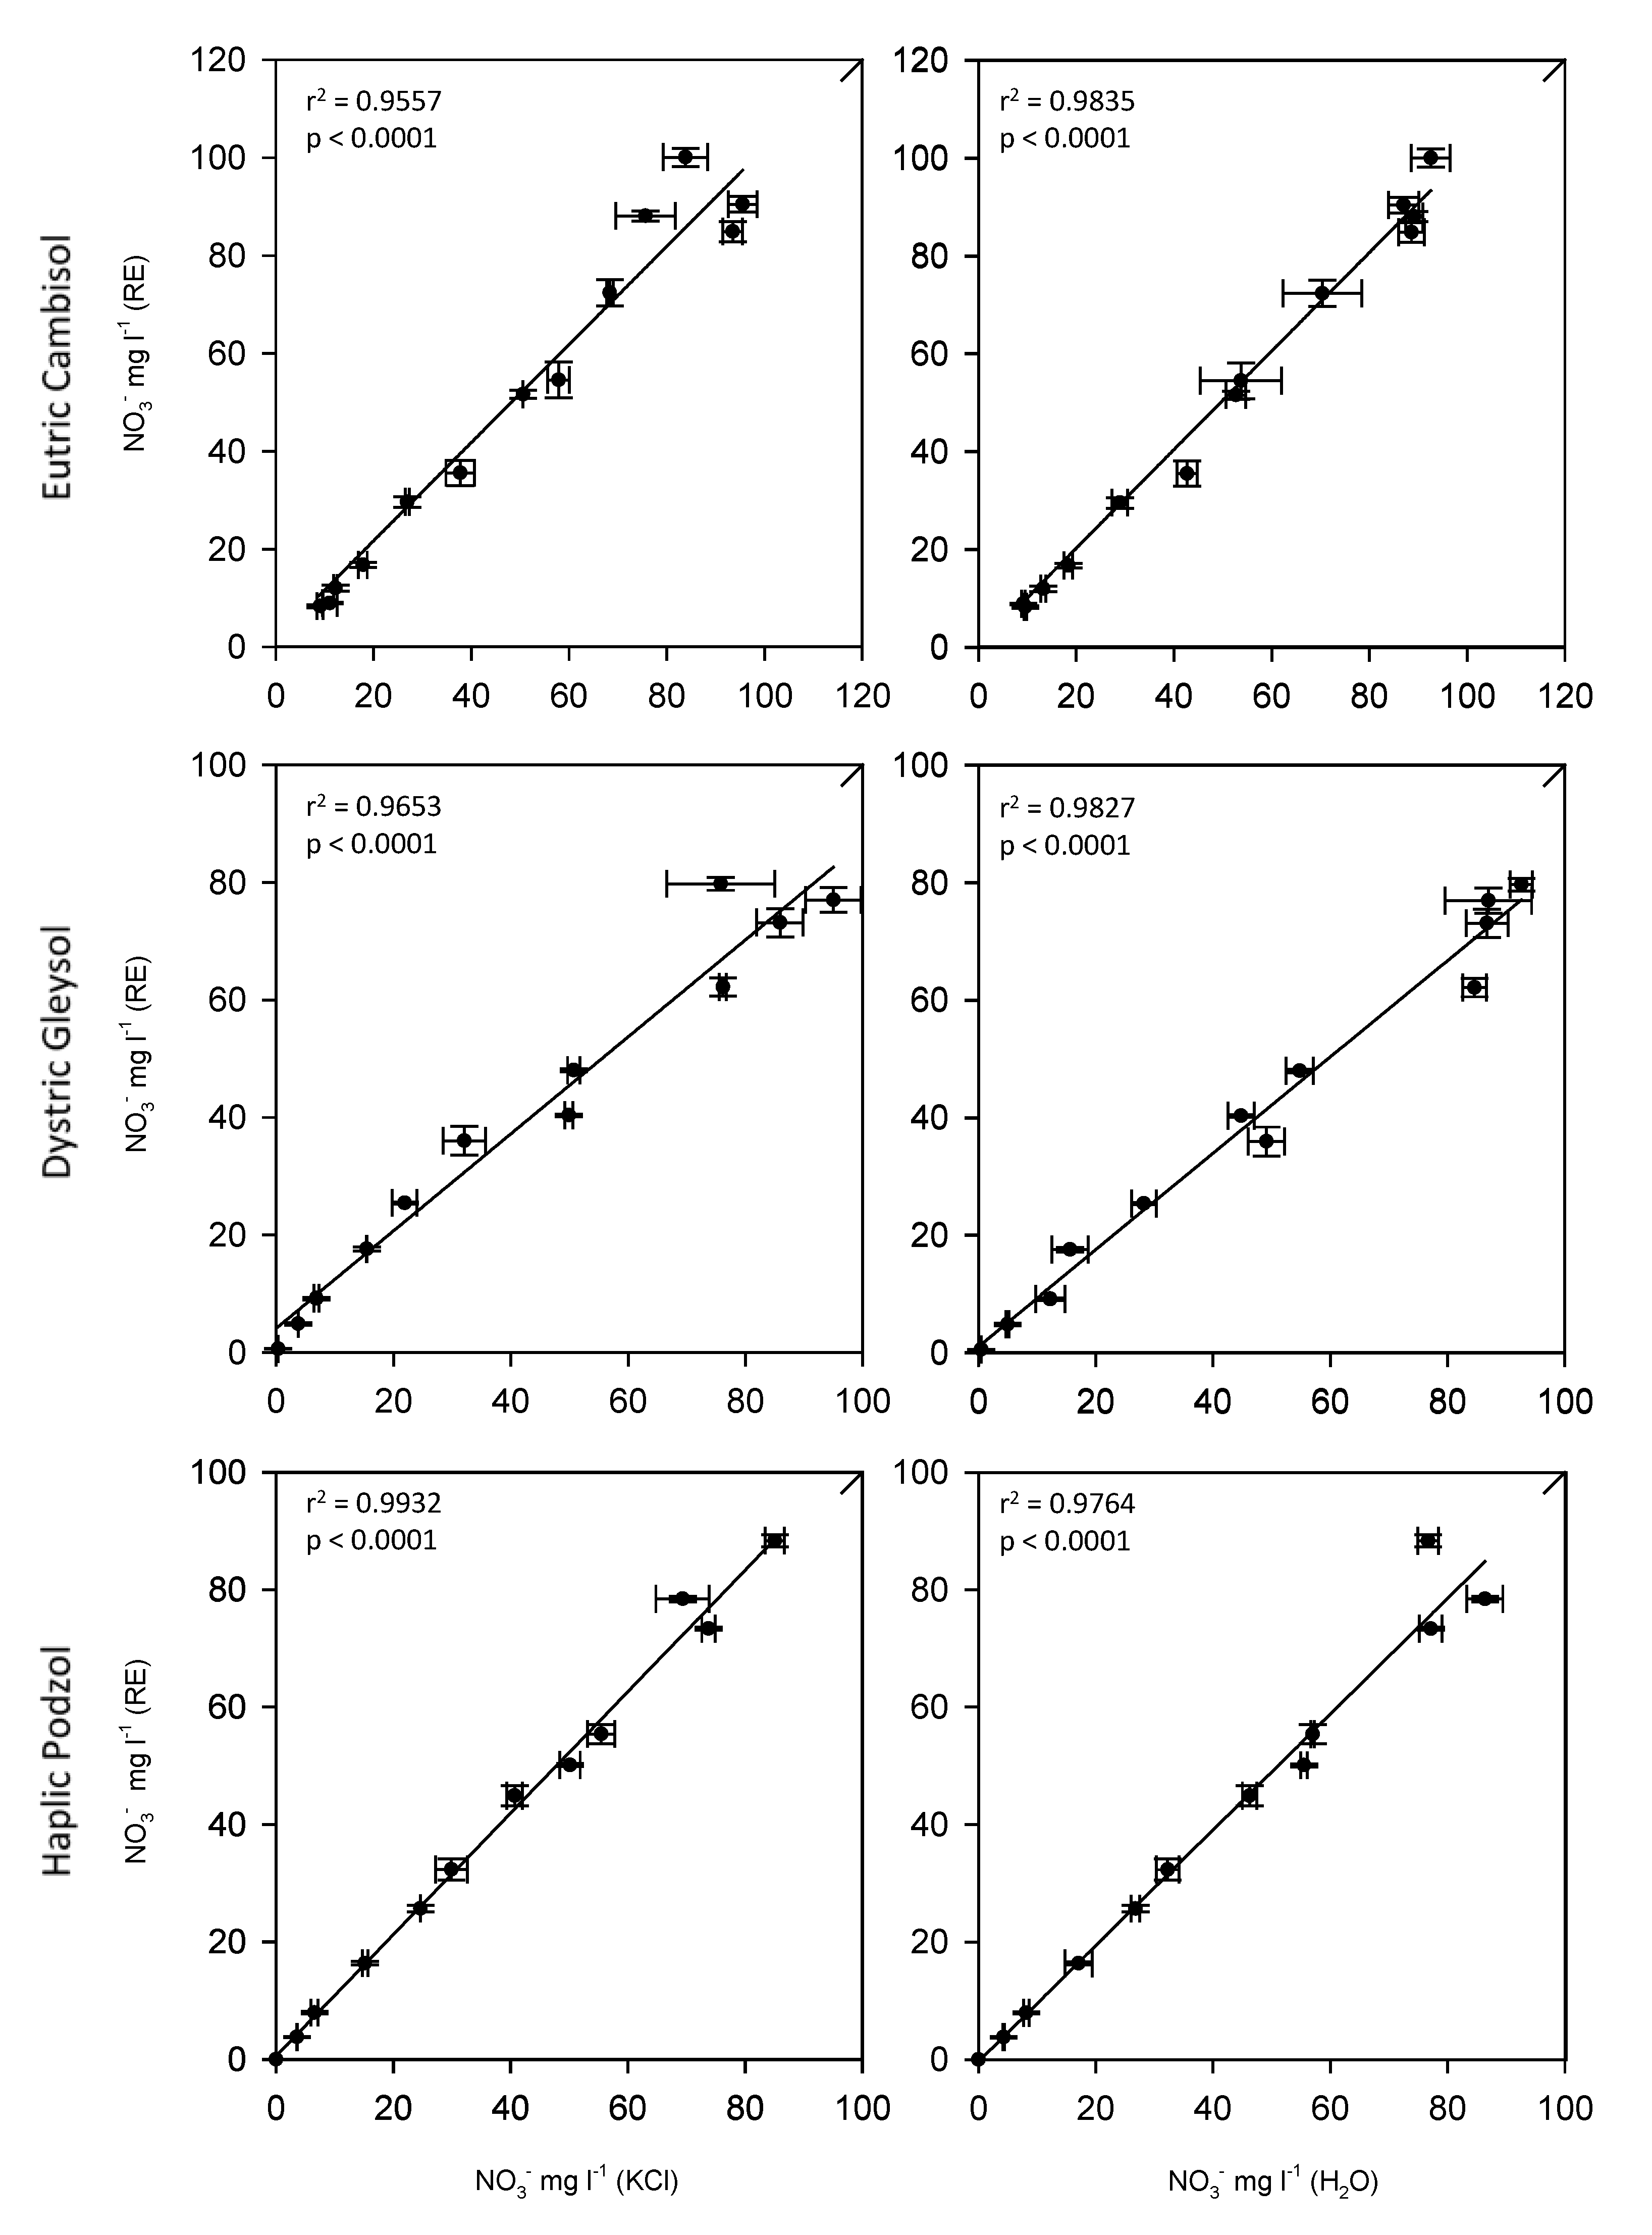
3.1. Efficiency of the Rapid Extraction Method

The efficiency of soil nitrate extraction from the three soil types using the rapid extraction method was tested by comparing it to standard soil extractions with 1 M KCl or H2O. The standard lab method was used for the subsequent NO3 determination of all the extracts. Figure 1 shows an excellent correlation and a near 1:1 relationship between the rapid extraction method and the KCl or H2O standard extraction method for the Eutric Cambisol and the Haplic Podzol, with no significant differences observed. In addition, there were no significant differences observed in NO3 extraction between the H2O standard extraction and the 1 M KCl standard extraction for all three soil types, which shows that NO3 extraction using H2O is acceptable. However, the efficiency of the rapid extraction method on the Dystric Gleysol was lower and was shown to be significantly different from the KCl standard extraction. The structure of the Dystric Gleysol was very poor so it is likely that shaking by hand for 2 min was not enough to allow complete dispersal of the soil particles. A similar problem may occur on heavy clay soils [15]. This may be rectified by increasing the shaking time of the extraction.
Figure 1. Comparison of the rapid extraction procedure (RE) with the standard 1 M KCl and H2O extracts. All extracts analysed for NO3- using the standard lab method. The dotted line represents the theoretical 1:1 line for the two methods whilst the solid line represents the linear regression line describing the actual relationship between the two methods. Values represent means ± SEM (n = 3). The r2 and p value from the regression analysis are shown for each graph.
Agriculture 03 00327 g001

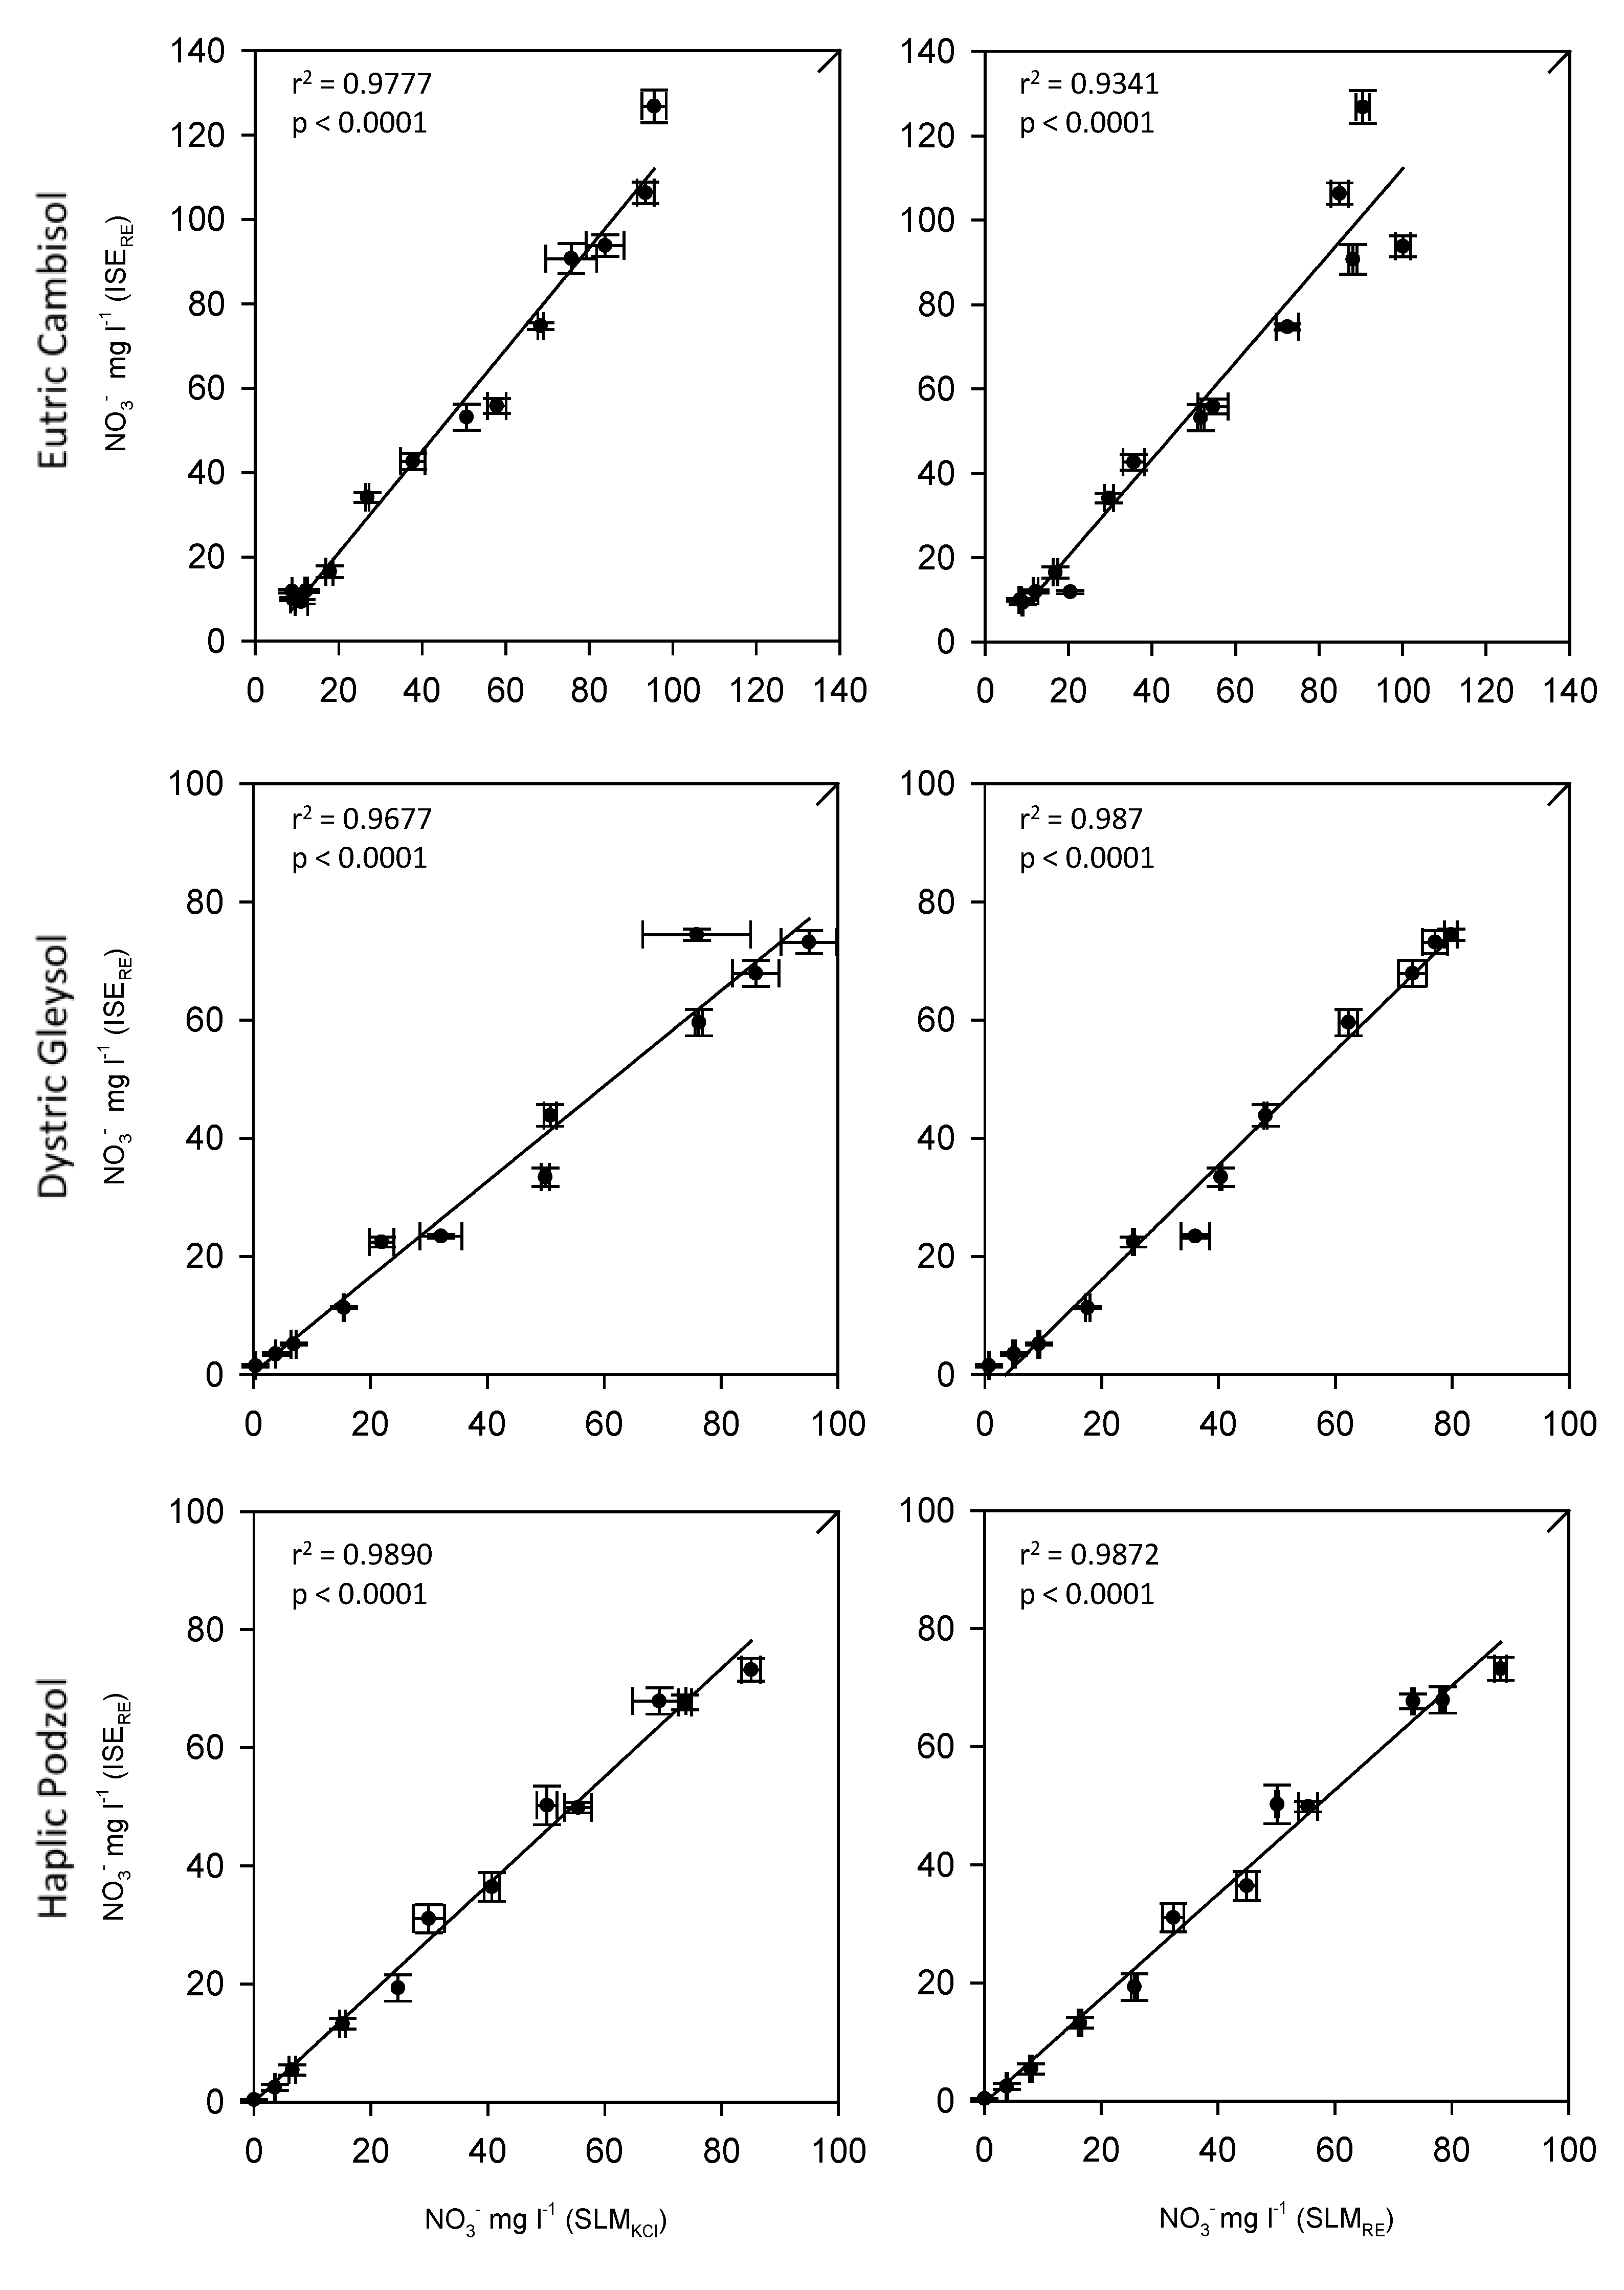
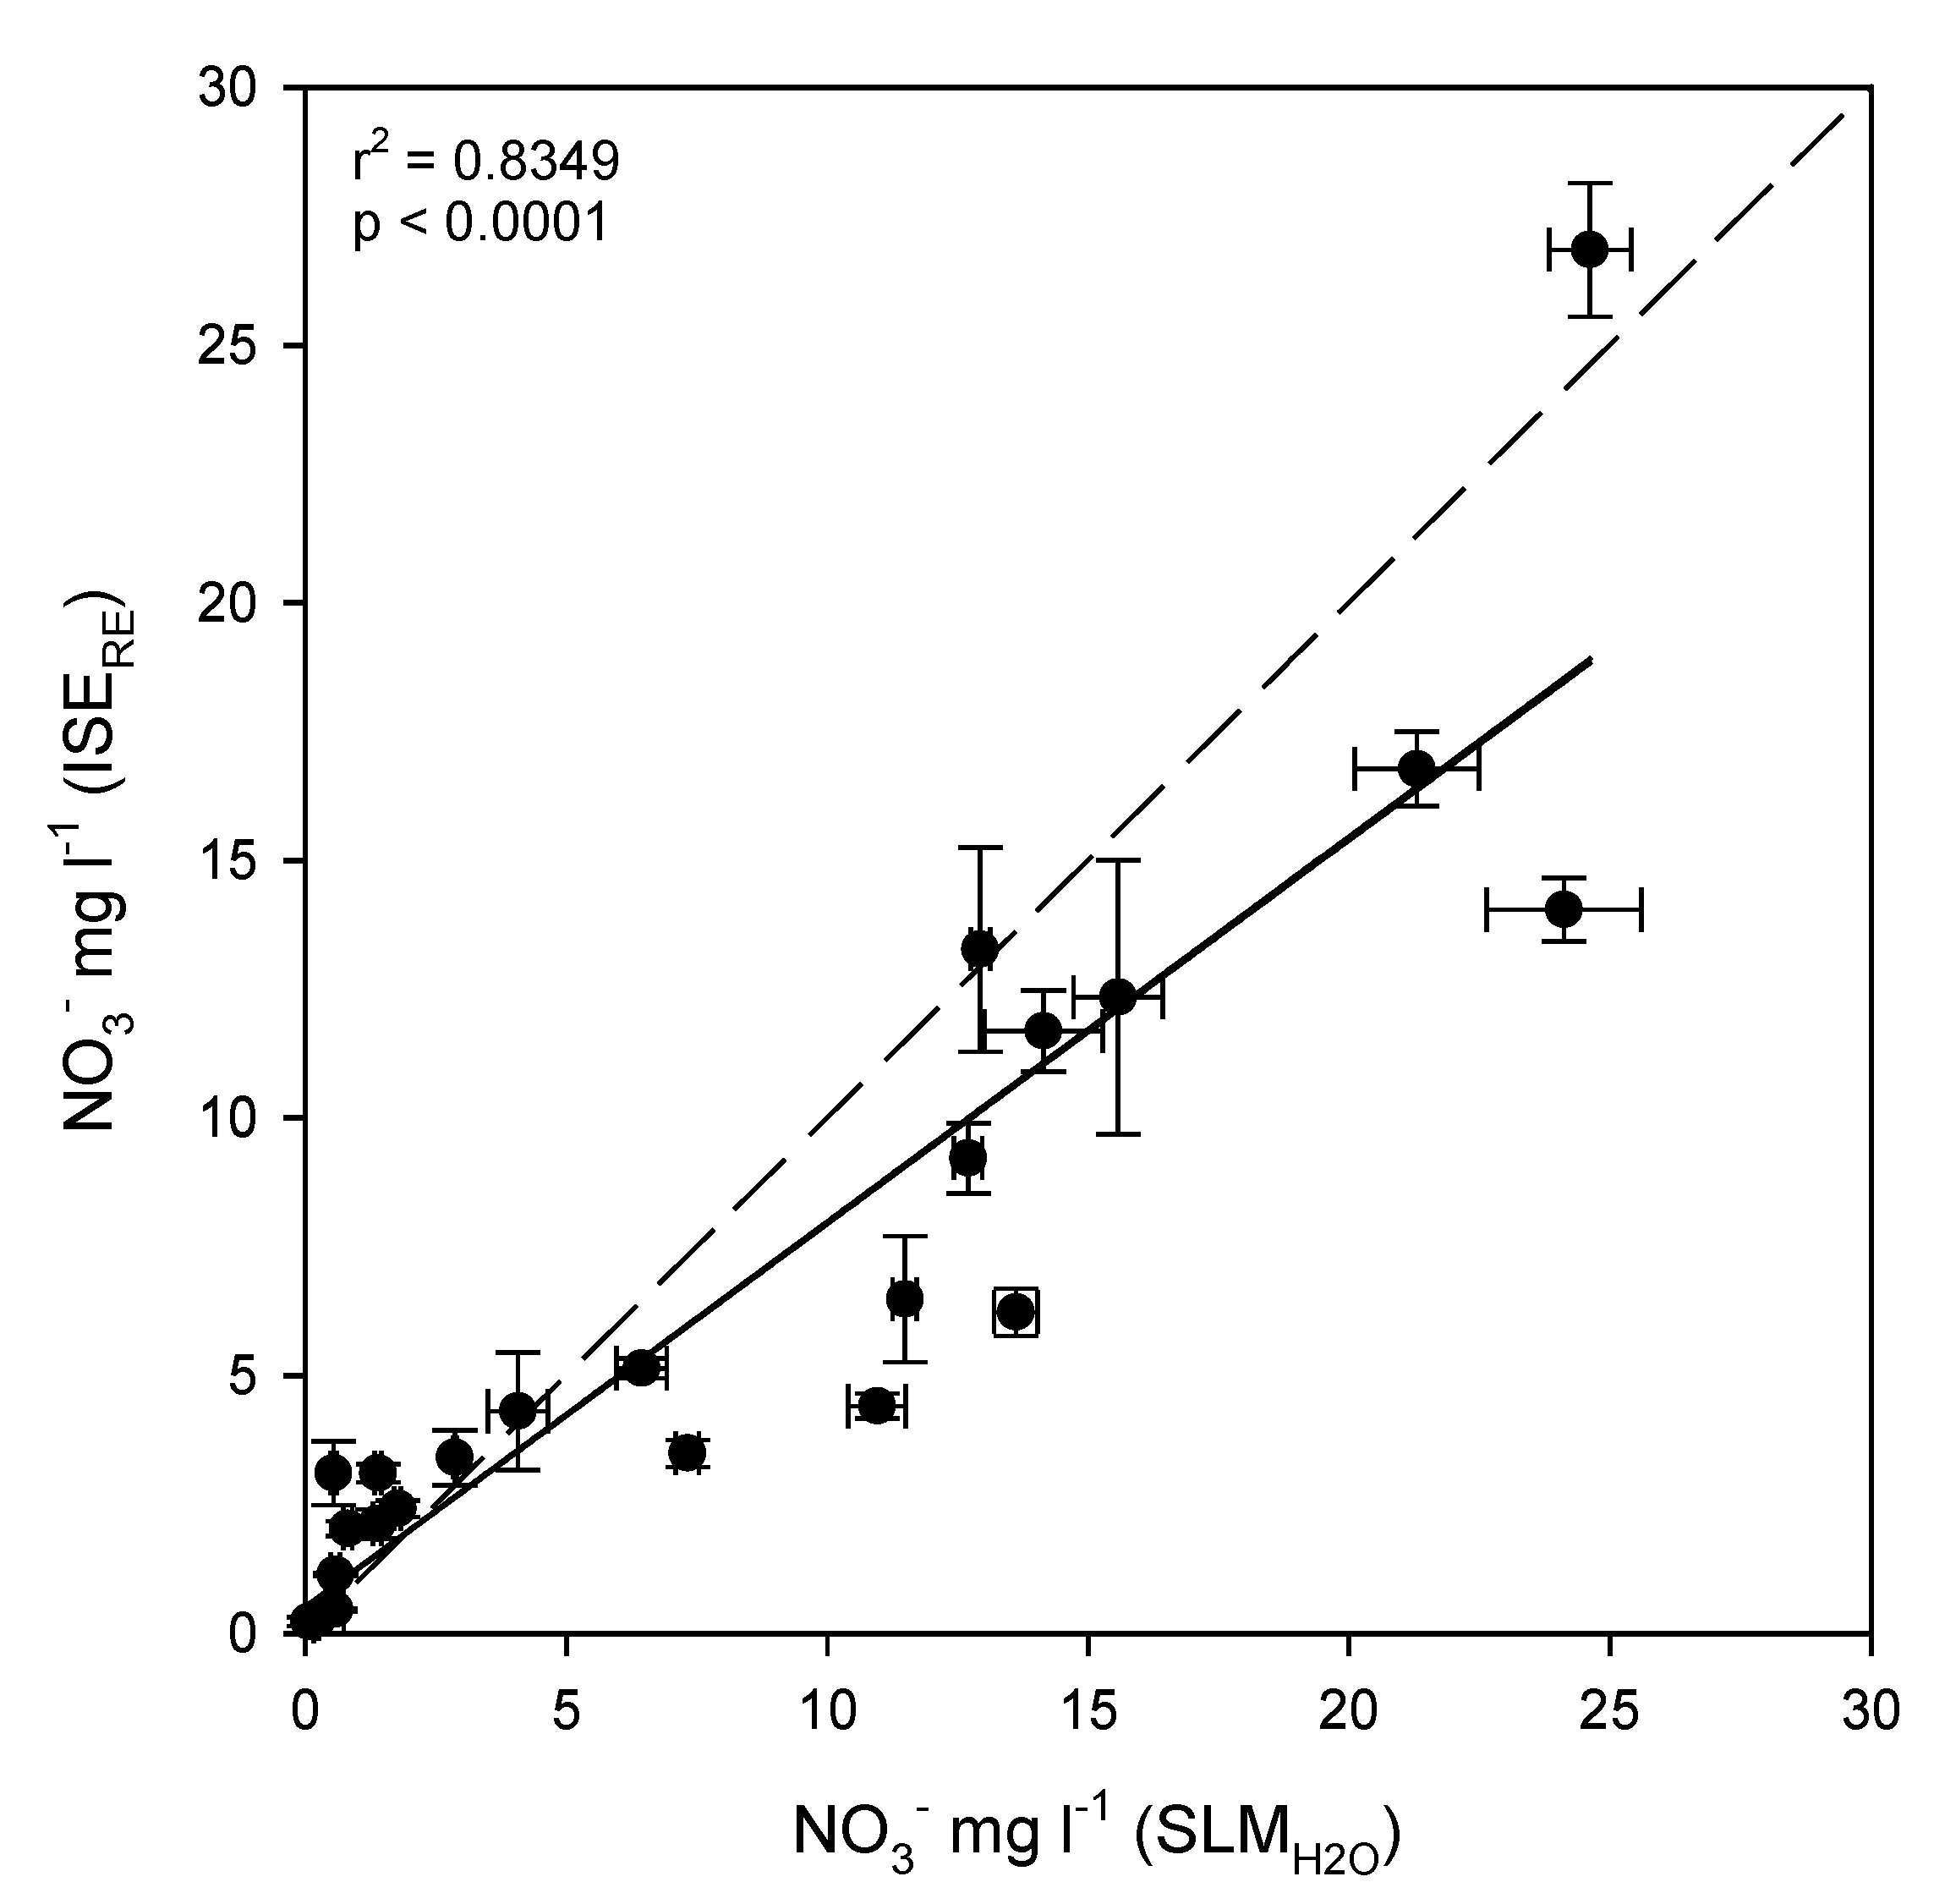
3.2. Comparison of the ISE Rapid Test with the Standard Lab Method

The ISE rapid test method was compared to the standard lab method with KCl extraction. Figure 2 shows a good correlation between the ISE rapid test and the standard lab method with KCl extraction for the determination of soil NO3 in all three soil types. However, significant differences were found between the two methods when applied to the Eutric Cambisol and Dystric Gleysol. Analysis of the rapid extraction extracts with the standard lab method for these soils showed no significant differences when compared to the ISE rapid test method. This suggests that the significant difference between the ISE rapid test method and the standard lab method with KCl extraction was due to either differences in extraction efficiency or natural soil variation, but not the performance of the ISE. We have already shown above that the efficiency of the rapid extraction method on the Dystric Gleysol is lower than for the other soil types, which would explain the reduced accuracy of the ISE rapid test for this soil.
Figure 3 shows the results of the ISE rapid test compared to the standard lab method with H2O extraction for the determination of NO3 on a range of soils, which were not spiked with NO3. At these lower NO3 concentrations, the ISE rapid test tends to underestimate the NO3 concentration, the correlation between the two methods was not quite as strong and there was a significant difference between them. In particular, below 10 mg L−1 there is a poor response of the ISE to changing concentration. The efficiency of the rapid extraction method was not ascertained for the soils used here and the low values of NO3 would exacerbate any reduction in extraction efficiency, although this is only likely to be an issue for the two Dystric Gleysols. In addition, the response of the ISE below 10 mg L−1 was non-linear and so as NO3 concentration decreased below this the resolution of the ISE was reduced. The accuracy in the non-linear phase may also be reduced by the calibration method. The software used calculates the calibration from the standards using a semi-logarithmic interpolation method. Essentially, this works by joining the calibration points with a straight line, which has obvious implications for a non-linear curve. Accuracy in the non-linear phase may therefore be increased by using more calibration points. Alternatively, a curve could be fitted to the calibration data using a simplified version of the Nicolsky–Eisenman equation [20].
Figure 2. Comparison of the ion selective electrode (ISE) rapid test (ISERE) with the standard lab method—extractions in KCl (SLMKCl) and rapid extraction procedure (SLMRE)—for NO3 determination in three soils amended with increasing amounts of NO3. The dotted line represents the theoretical 1:1 line for the two methods whilst the solid line represents the linear regression line describing the actual relationship between the two methods. Values represent means ± SEM (n = 3). The r2 and p value from the regression analysis are shown for each graph.
Agriculture 03 00327 g002
Figure 3. Comparison of the ISE rapid test with the standard lab method—extractions in H2O (SLMH2O)—for NO3 determination across a broad range of agricultural soils (n = 23). The dotted line represents the theoretical 1:1 line for the two methods whilst the solid line represents the linear regression line describing the actual relationship between the two methods. Values represent means ± SEM (n = 3). The r2 and p value from the regression analysis are shown.
Agriculture 03 00327 g003

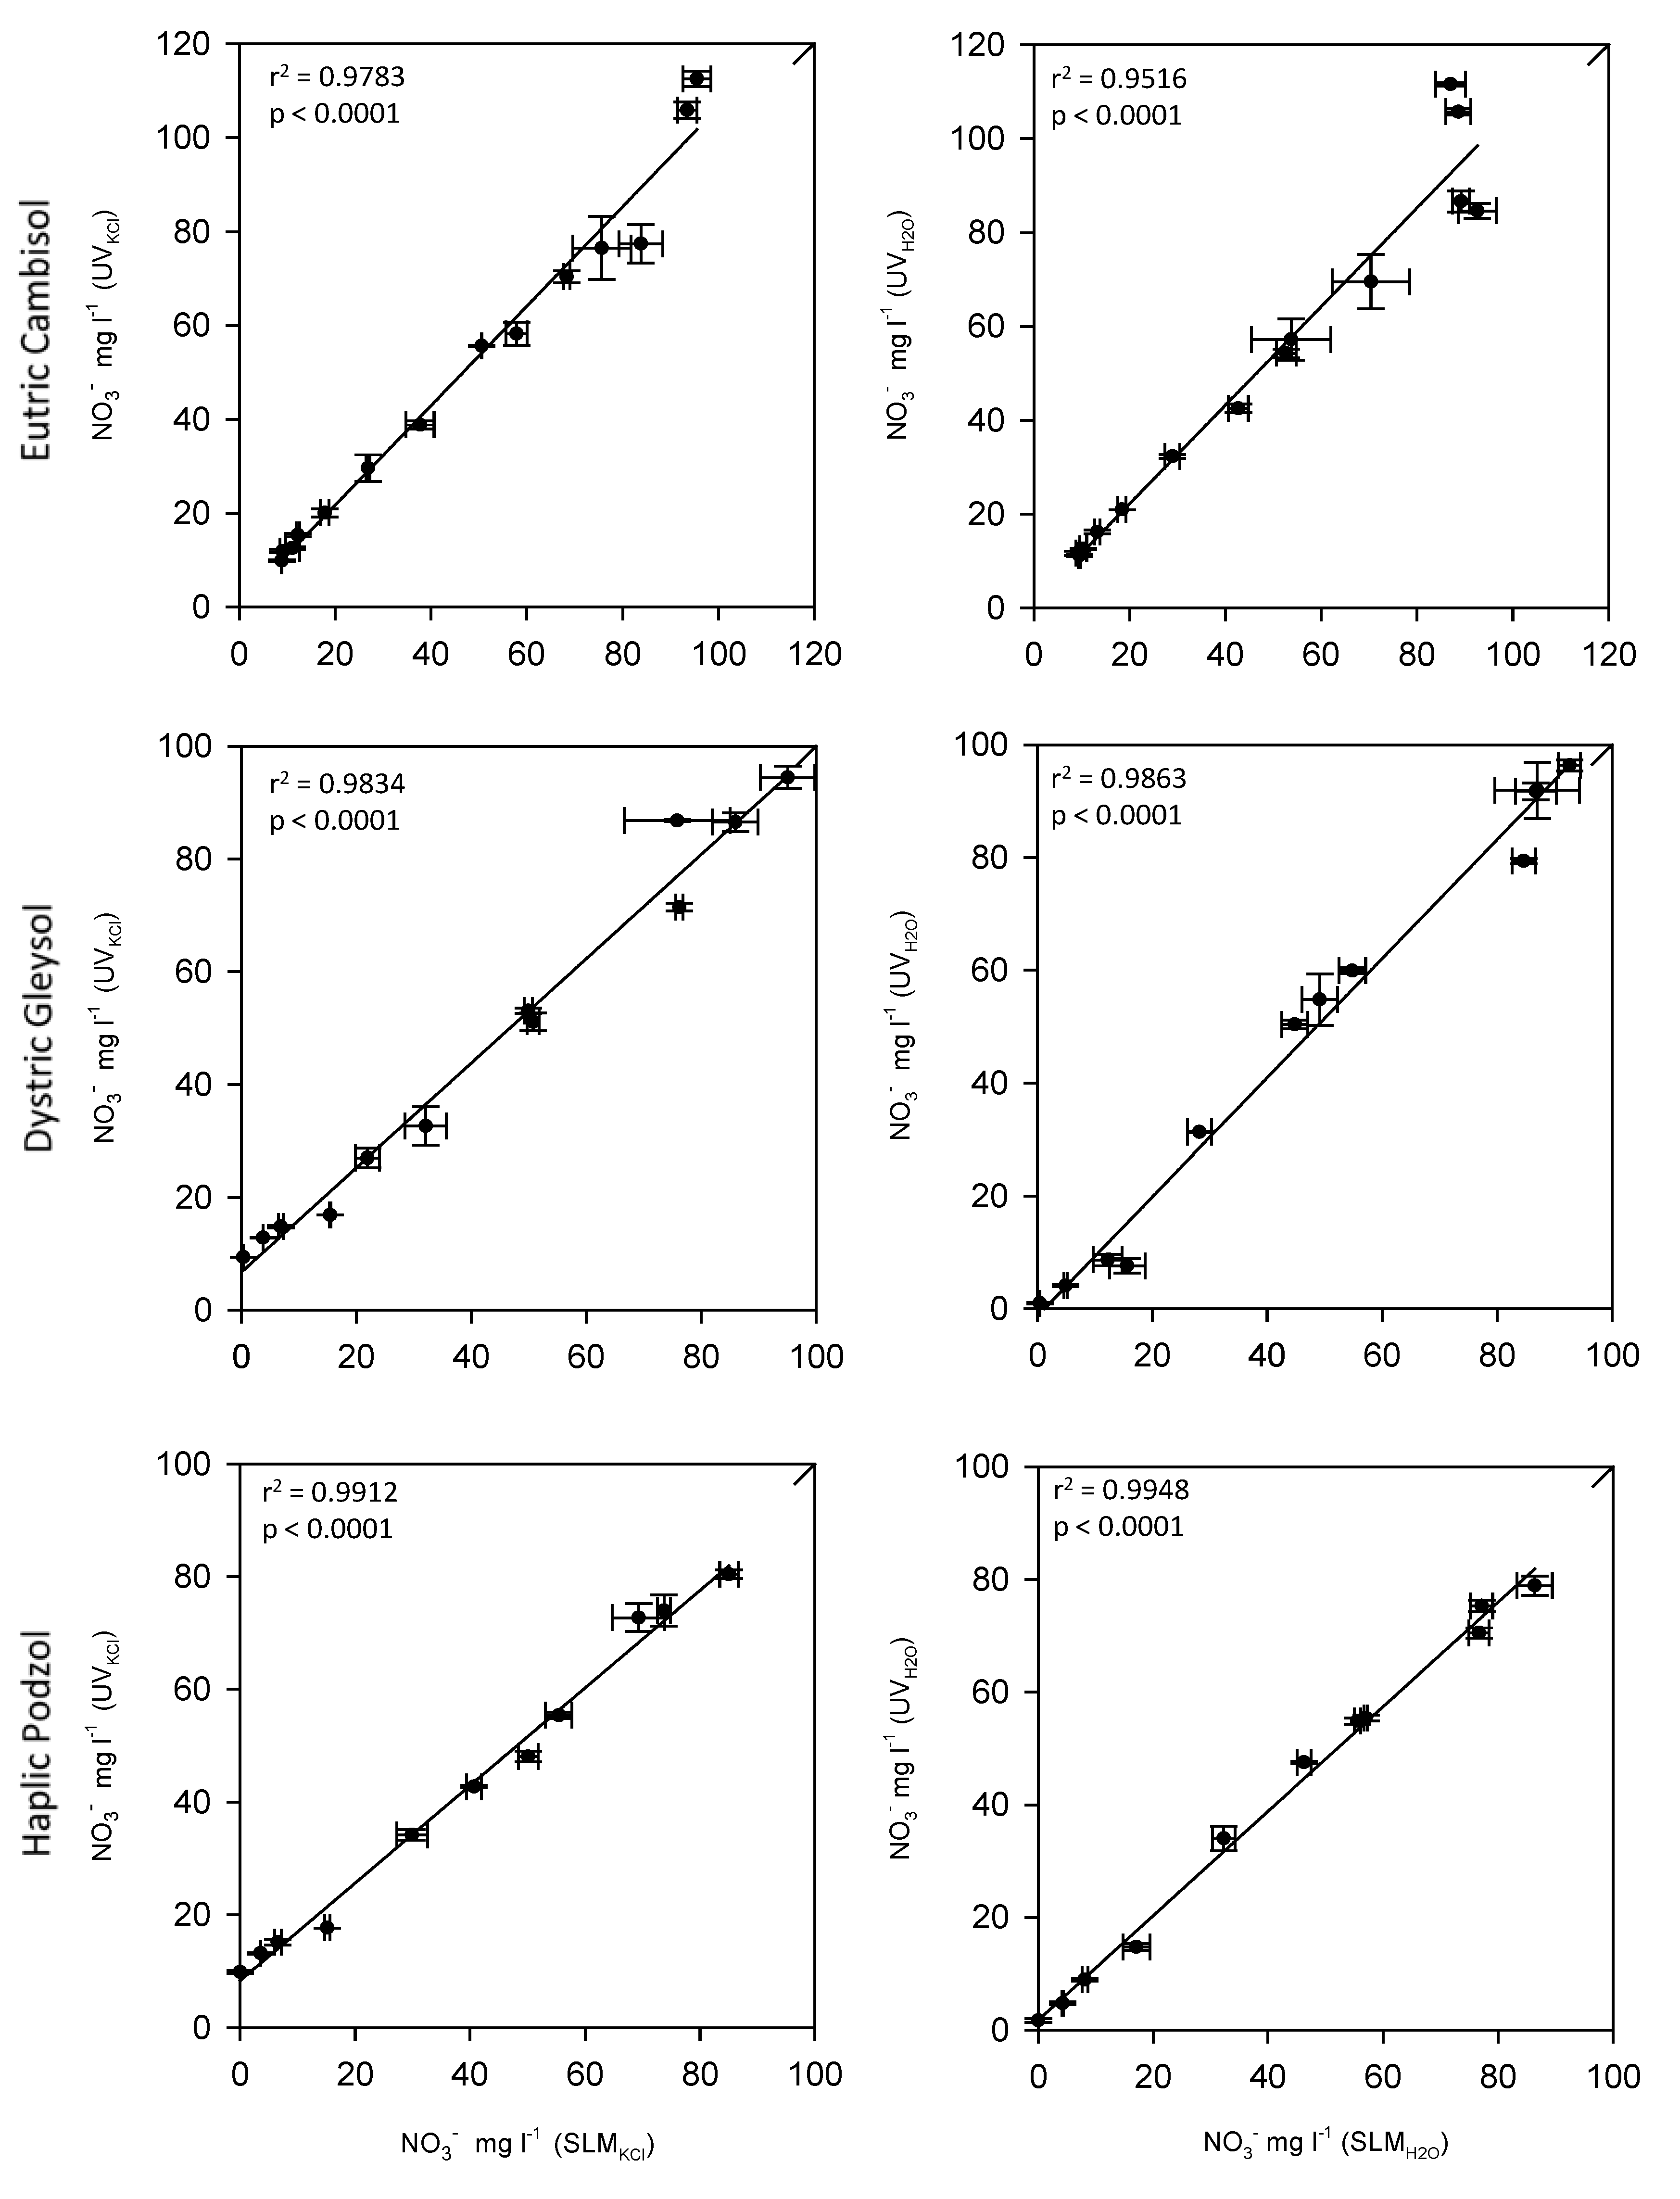
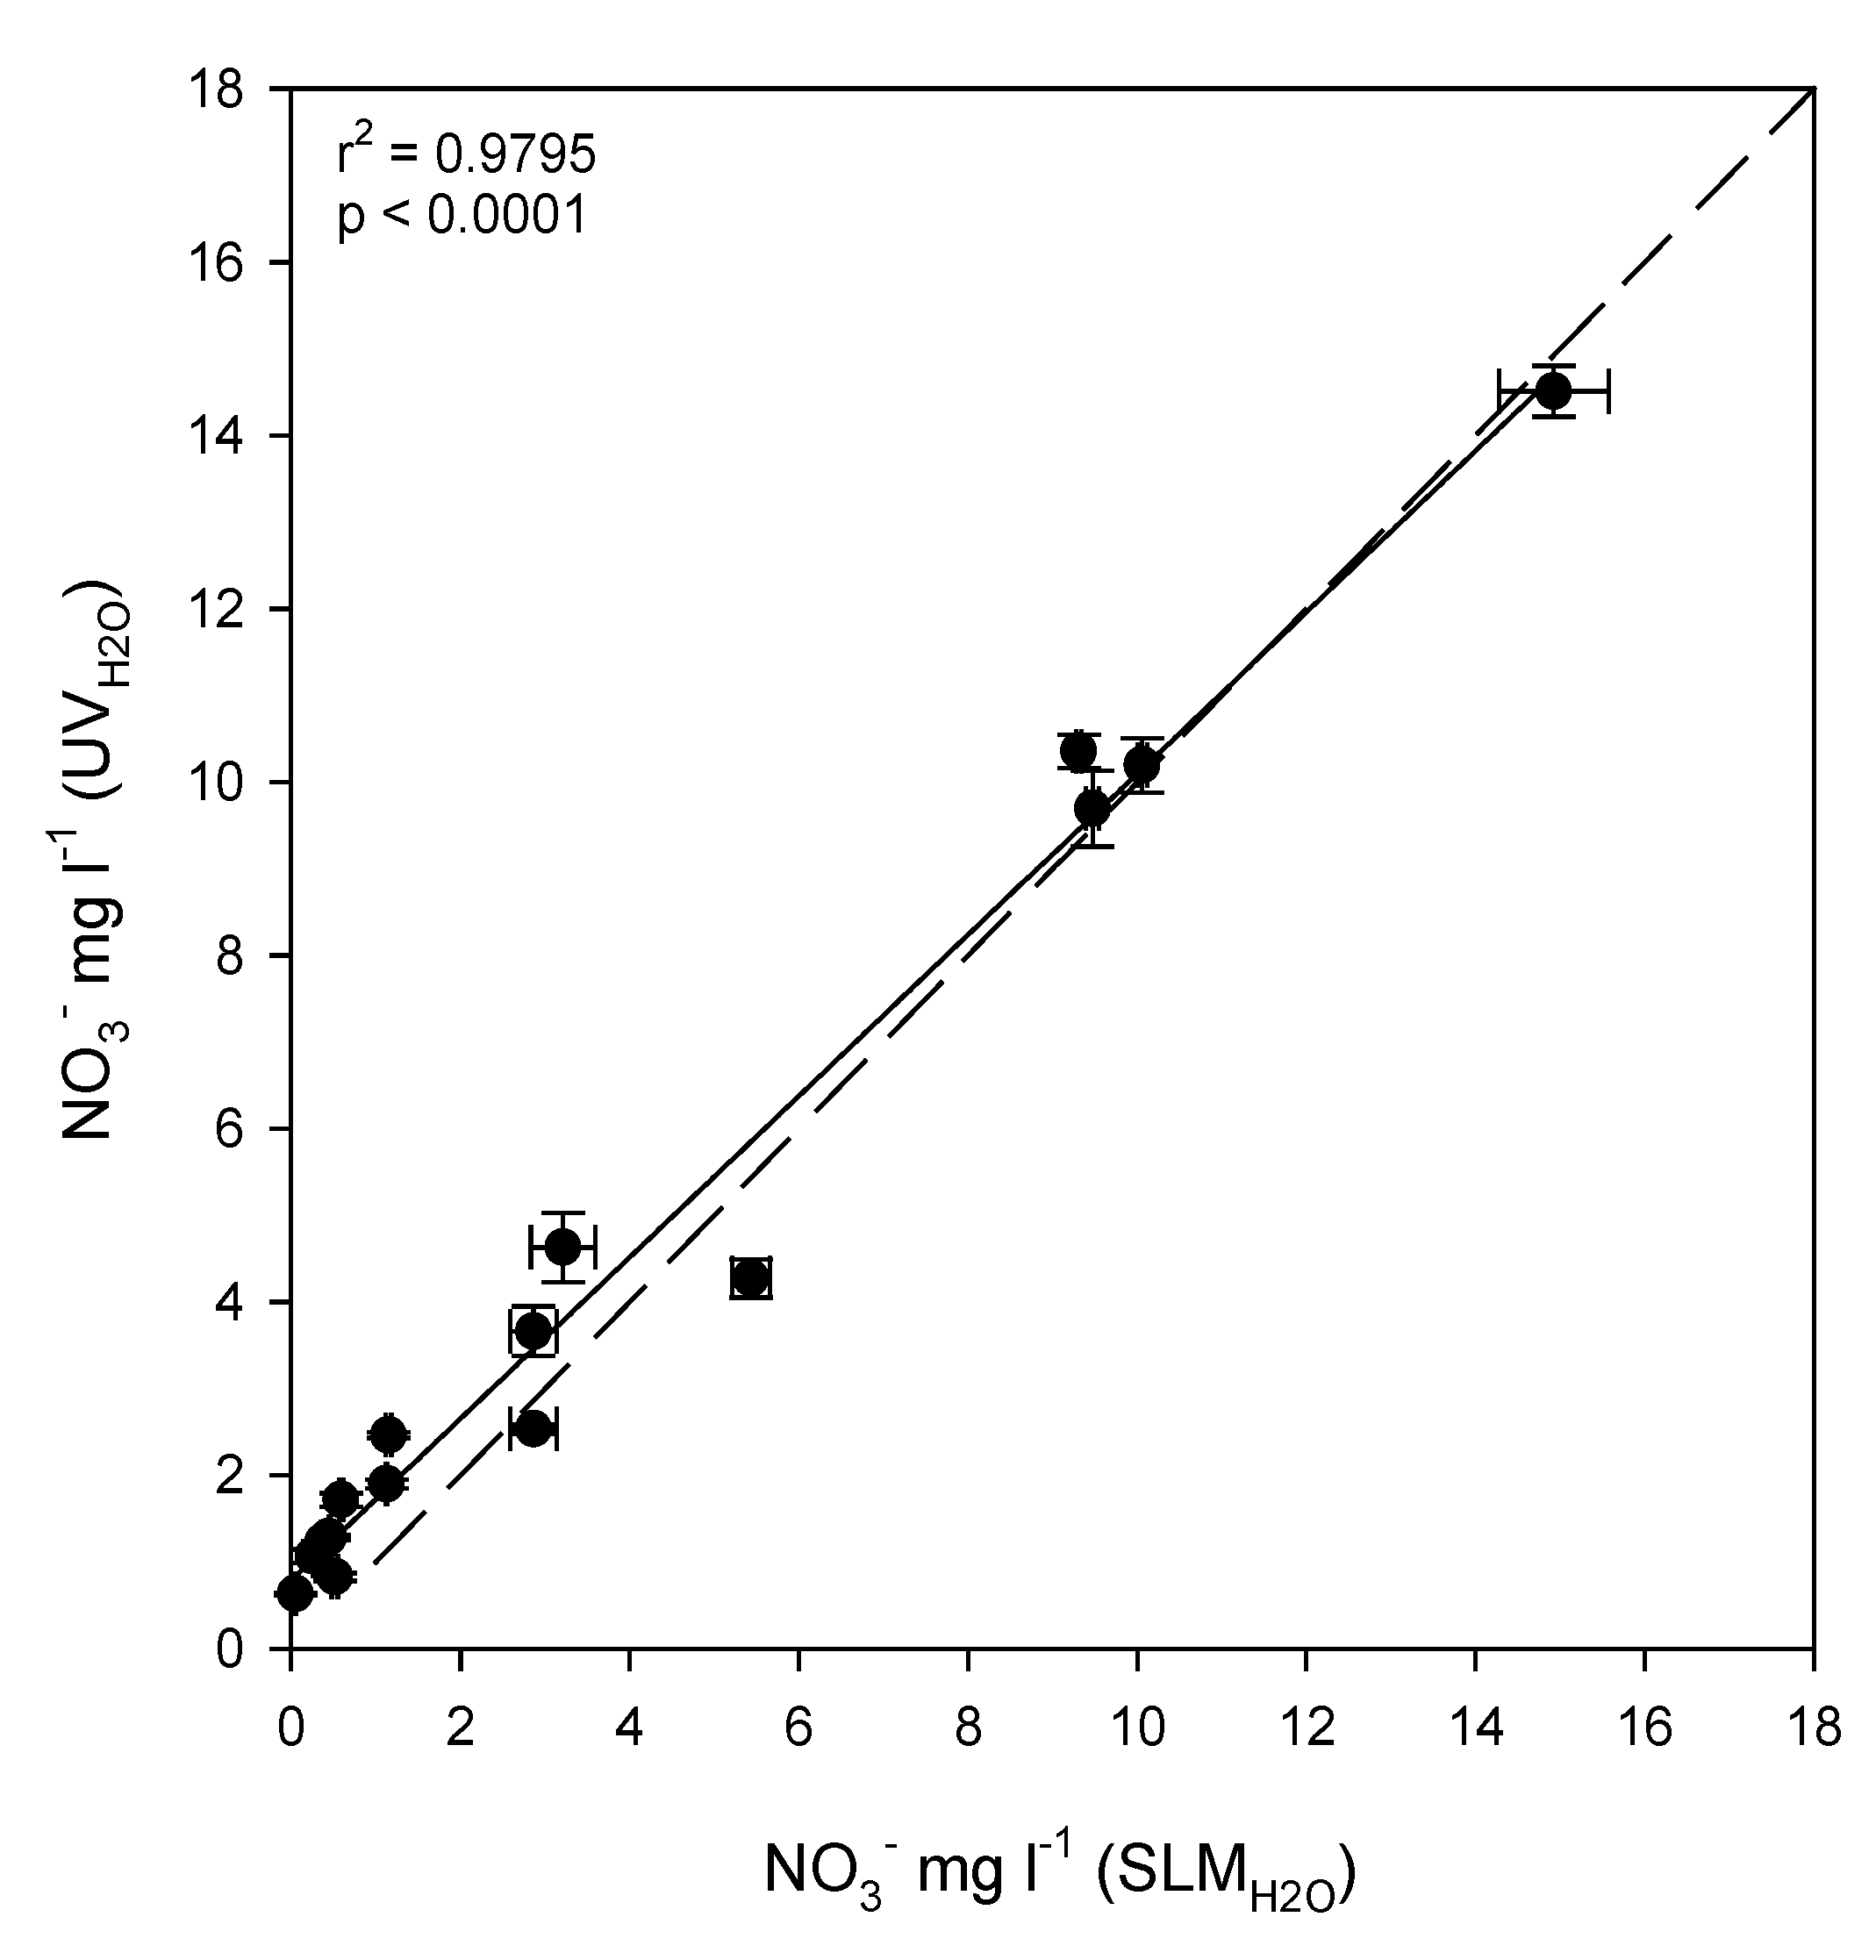
3.3. Comparison of UV Spectroscopy with the Standard Lab Method

Figure 4, Figure 5 show an excellent correlation and a near 1:1 response between the standard lab method and UV spectroscopy method for the determination of NO3 in H2O and KCl soil extracts. The response of UV spectroscopy to pure solutions of NO3 was linear from 0.05–12.5 mg L−1 (compared to 0.2–50 mg L−1 with the standard lab method). Consequently, most of the extracts required a 1:10 (v/v) dilution prior to NO3 determination. No significant differences were found between the methods using H2O extraction for all three soil types and for KCl extraction with the Haplic Podzol. However, significant differences were found between the standard lab method and the UV spectroscopy for KCl extractions from the Eutric Cambisol and Dystric Gleysol. A closer look at Figure 4 shows that it is only the three lowest concentrations that appear to deviate significantly from the 1:1 regression line. These were the only samples, extracted in 1 M KCl which were not diluted prior to UV analysis, which suggests that the error is due to interference from the 1 M KCl. Edwards et al. [19], found no interference from saline constituents although they did not use solutions as strong as 1 M. Figure 5 shows that unlike the ISE rapid test there was no loss of accuracy at low concentrations. However, here only the analytical methods are being compared and both methods are using the same extracts, whereas with the ISE rapid test different extractions are used leading to variation in both the extraction efficiency and natural soil variation.
Figure 4. Comparison of UV spectroscopy—extractions in KCl (UVKCl) and H2O (UVH2O)—with the standard lab method—extractions in KCl (SLMKCl) and H2O (SLMH2O)—for NO3 determination in three soils amended with increasing amounts of NO3. The dotted line represents the theoretical 1:1 line for the two methods whilst the solid line represents the linear regression line describing the actual relationship between the two methods. Values represent means ± SEM (n = 3). The r2 and p value from the regression analysis is shown for each graph.
Agriculture 03 00327 g004
Figure 5. Comparison of UV spectroscopy—extractions in H2O (UVH2O)—with the standard lab method—extractions in H2O (SLMH2O)—for NO3 determination across a broad range of agricultural soils (n = 16). The dotted line represents the theoretical 1:1 line for the two methods whilst the solid line represents the linear regression line describing the actual relationship between the two methods. Values represent means ± SEM (n = 3). The r2 and p value from the regression analysis is shown.
Agriculture 03 00327 g005

3.4. Evaluation of ISEs for Soil Nitrate Determination

The ISE rapid test procedure was conducted on three contrasting soil types (Eutric Cambisol, Dystric Gleysol and Haplic Podzol), which together represent the major agricultural soil types in the UK. In comparison to the internationally recognised standard laboratory method, the results clearly showed that current ISE technology combined with two min manual H2O soil extractions has the potential to be used by farmers as an on-farm rapid-diagnostic test. However, the accuracy of the rapid test procedure decreased when testing a Dystric Gleysol and at low NO3 concentrations (i.e., below 10 mg L‑1). There was also a problem with the electrode durability. During this experiment, three sets of ISEs were used. The second set was discarded when it began to show a large erratic response and a subsequent failure to stabilise. This type of malfunction is likely to be due to a failure of the electronics and can easily be spotted. The first and third set suffered from a loss of sensitivity at the lowest concentrations and the third set showed physical degradation manifest by a bulging membrane. The electrodes were discarded when they could not be calibrated correctly at the concentrations that were being determined. However, a subtle loss of sensitivity at lower concentrations or changes in the calibration parameters may not be spotted by a layman and could cause significant error if the calibration was not adjusted. A more rugged sensor housing design may improve this lack of durability alongside changes in the sensor chemistry (e.g., inclusion of protective membranes). In addition, electrodes can also be constructed incorporating the latest improvements in ion sensor membrane design [21].

3.5. Evaluation of UV Spectroscopy for Soil Nitrate Determination

The results show clearly that dual wavelength UV spectroscopy can be used to accurately determine the concentration of NO3 in extracted soil solution. When combined with the rapid extraction method it has the potential to be used as an on-farm rapid test providing a hand-held UV spectrometer is available and the extracts are filtered or centrifuged. Dual wavelength UV spectroscopy is able to determine the NO3 concentration between 0.35 and 17.7 mg L−1 [19]. This means that extractions from soils with high NO3 input may need to be diluted before measurement. This was the case in our study for the majority of the samples. The results suggest that the 1 M KCl extractant causes some interference to the measurement. Diluting KCl extractions 1:10 (v/v) appears to prevent the interference that occurs due to 1 M KCl. Extracting with H2O also solves the problem of the 1 M KCl interference and the results show there is no difference in NO3 extraction using 1 M KCl or H2O. In addition, distilled water can be readily purchased by most farmers in comparison to KCl solutions. The advantage of using an ISE over UV spectroscopy for an on-farm rapid test is that ISE’s can be used in soil slurry so no filtration or centrifugation needs to be carried out. However, UV spectroscopy offers better resolution at very low concentrations due to the linear nature of its response and is likely to be more durable. In addition, field portable UV spectrometers are now readily available. This approach, however, is readily suited to the evaluation of nitrate in agricultural drainage waters.

3.6. Implications for Fertiliser Application Guidelines

Extraction of NO3 from the soil and its subsequent determination does not provide all the information required to produce an agronomic relevant result. For the results to be meaningful for agricultural extension purposes, they must be up-scaled to units of kg ha−1. This requires determination of the bulk density and moisture content of the samples. Schmidhalter [15] developed a method of determining both parameters using a simple in-field method requiring only standard bulk density cylinders, a graduated measuring cylinder and a solar powered balance.
For farmers to implement rapid soil NO3 testing, they must be convinced of the benefit as the process requires both time and money. When soil is sampled and sent for laboratory testing it can be analysed for a range of macro- and micro- nutrients. In the UK, fertiliser additions, as prescribed by RB209, require a calculation or estimation of SMN, which includes both NH4+ and NO3. This rapid test would only determine soil NO3 concentration, and although nitrogen is fundamental to plant growth, it is not always the limiting nutrient. NO3 differs from other nutrients in that its concentration varies greatly both spatially and temporally, which is the main reason that farmer-operated NO3 rapid tests performed through the growing season may improve fertiliser management. This spatial and temporal variation does however pose a challenge as to determining the optimum sampling regime. Further, farmers need to have relevant and simple decision support systems so that collected data are interpreted correctly and can be implemented into a meaningful fertiliser strategy. Along with improving the technology, further work is therefore needed so that rapid soil NO3 can be adopted by industry as a way to optimise nutrient use efficiency.

4. Conclusions

This work shows that ISEs can offer a reasonably accurate and rapid way of determining NO3 concentration in soil slurries. This can be combined with a rapid extraction procedure using H2O where the soil is shaken by hand for 2 min. For poorly structured or heavier clay soils a longer shaking time may be required. There is the potential for ISEs to be used by farmers for an on-farm rapid test; however, practicality issues and methods for integrating the data into a management plan may reduce its uptake. UV spectroscopy offers a similarly rapid and reagentless method of NO3 determination. Compared to ISE, it offers a lower detection limit and a greater resolution at low concentration—below 10 mg L−1—but samples with a concentration greater than 18 mg L−1 will need to be diluted for accurate determination. The technology is likely to be more durable and less prone to error than ISEs. However, the cost of the technology is likely to be greater and samples will require filtering or centrifuging prior to measurement. For rapid tests to be used by the industry, farmers must be convinced of the cost-benefits and have a suitable decision support mechanism in place to turn the measurements into a fertiliser application plan.

Acknowledgments

Funding for the project was provided by the English Beef and Lamb Executive (EBLEX), Hybu Cig Cymru (HCC), Quality Meat Scotland (QMS) and DairyCo.

References

  1. Cassman, K.; Dobermann, A.; Walters, D.; Yang, H. Meeting cereal demand while protecting natural resources and improving environmental quality. Annu. Rev. Environ. Resour. 2003, 28, 315–358. [Google Scholar] [CrossRef]
  2. Tilman, D.; Balzer, C.; Hill, J.; Befort, B.L. Global food demand and the sustainable intensification of agriculture. Proc. Natl. Acad. Sci. USA. 2011, 108, 20260–20264. [Google Scholar] [CrossRef]
  3. Iversen, T.; Grant, R.; Nielsen, K. Nitrogen enrichment of European inland and marine waters with special attention to Danish policy measures. Environ. Pollut. 1998, 102, 771–780. [Google Scholar] [CrossRef]
  4. Anonymous. EEA Signals, A European Environment Agency Update on Selected Issues; European Environment Agency: Luxembourg, 2004. [Google Scholar]
  5. Olfs, H.W.; Blankenau, K.; Brentrup, F.; Jasper, J.; Link, A.; Lammel, J. Soil- and plant-based nitrogen-fertilizer recommendations in arable farming. J. Plant Nutr. Soil Sci. 2005, 168, 414–431. [Google Scholar] [CrossRef]
  6. Grizetti, B. European Nitrogen Assessment; Sutton, M.A., Howard, C.M., Erisman, J.M., Billen, G., Bleeker, A., Grennfelt, P., van Grinsven, H., Grizzetti, B., Eds.; Cambridge University Press: Cambridge, UK, 2011; Chapter 17; pp. 379–404. [Google Scholar]
  7. Cassman, K.G.; Dobermann, A.; Walters, D.T. Agroecosystems, nitrogen-use efficiency, and nitrogen management. AMBIO 2002, 31, 132–140. [Google Scholar]
  8. Robertson, G.P.; Vitousek, P.M. Nitrogen in agriculture: Balancing the cost of an essential resource. Annu. Rev. Env. Resour. 2009, 34, 97–125. [Google Scholar] [CrossRef]
  9. Anonymous. Fertiliser Manual (RB209), 8th ed.; Department of Environment, Farming and Rural Affairs (Defra), HMSO: London, UK, 2010. [Google Scholar]
  10. Jemison, J.M.; Fox, R.H. A quick-test procedure for soil and plant-tissue nitrates using test strips and a hand-held reflectometer. Commun. Soil Sci. Plant Anal. 1988, 19, 1569–1582. [Google Scholar] [CrossRef]
  11. Roth, G.W.; Beegle, D.B.; Fox, R.H.; Toth, J.D.; Piekielek, W.P. Development of a quick test kit method to measure soil nitrate. Commun. Soil Sci. Plant Anal. 1991, 22, 191–200. [Google Scholar] [CrossRef]
  12. Hartz, T.K. A quick test procedure for soil nitrate-nitrogen. Commun. Soil Sci. Plant Anal. 1994, 25, 511–515. [Google Scholar] [CrossRef]
  13. Wetselaar, R.; Smith, G.D.; Angus, J.F. Field measurement of soil nitrate concentrations. Commun. Soil Sci. Plant Anal. 1998, 29, 729–739. [Google Scholar] [CrossRef]
  14. Hartz, T.K.; Smith, R.F.; Lestrange, M.; Schulbach, K.F. On-farm monitoring of soil and crop nitrogen status by nitrate-selective electrode. Commun. Soil Sci. Plant Anal. 1993, 24, 2607–2615. [Google Scholar] [CrossRef]
  15. Schmidhalter, U. Development of a quick on-farm test to determine nitrate levels in soil. J. Plant Nutr. Soil Sc. 2005, 168, 432–438. [Google Scholar] [CrossRef]
  16. Miranda, K.M.; Espey, M.G.; Wink, D.A. A rapid, simple spectrophotometric method for simultaneous detection of nitrate and nitrite. Nitric Oxide Biol. Chem. 2001, 5, 62–71. [Google Scholar] [CrossRef]
  17. Sparks, D.L. Methods of Soil Analysis Part 3—Chemical Methods; SSSA Book series No. 5; American Society of Agronomy: Madison, WI, USA, 1996. [Google Scholar]
  18. Adamchuk, V.I.; Lund, E.D.; Sethuramasamyraja, B.; Morgan, M.T.; Dobermann, A.; Marx, D.B. Direct measurement of soil chemical properties on-the-go using ion-selective electrodes. Comput. Electron. Agric. 2005, 48, 272–294. [Google Scholar] [CrossRef]
  19. Edwards, A.C.; Hooda, P.S.; Cook, Y. Determination of nitrate in water containing dissolved organic carbon by ultraviolet spectroscopy. Int. J. Environ. Anal. Chem. 2001, 80, 49–59. [Google Scholar] [CrossRef]
  20. Miller, A.J.; Zhen, R.G. Measurement of intracellular nitrate concentrations in chara using nitrate-selective microelectrodes. Planta. 1991, 184, 47–52. [Google Scholar]
  21. Ping, J.; Wang, Y.; Wu, J.; Ying, Y.; Ji, F. A novel pH sensing membrane based on an ionic liquid-polymer composite. Microchimica Acta. 2012, 176, 229–234. [Google Scholar] [CrossRef]

