1. Introduction
If or when a notifiable swine disease breaks out in the United States (US), it will likely be necessary to humanely depopulate and dispose of infected swine within 24 h of diagnosis to reduce or eliminate viral replication and disease spread. Furthermore, susceptible swine on neighboring farms within a defined area would need to be depopulated within 48 h [
1]. Methods for depopulating individual pigs may not be rapid enough to halt the spread of disease.
The experience of disease outbreaks in other countries illustrates that the key to halting disease spread and duration (the time a country is not foot-and-mouth disease (FMD) free) is a timely and rapid killing of animals [
2]. According to the UK Department for Environment, Food and Rural Affairs (DEFRA), 4,220,000 animals were killed during the 2001–2002 UK FMD outbreak, with an average of 10,000 to 12,000 animals being killed each day of the outbreak [
3,
4]. In the US, where pig numbers and population densities can be much greater (in some regions) and since there is extensive daily swine transfer between states, the emergency situation could be much worse. For example, North Carolina has about 9,000,000 pigs currently in production; so, if a significant percentage of that population needed to be depopulated in a short time frame, the task would be massive, and methods must be in place to handle the task adequately at individual farms. This requires that protocols be in place in advance, so that humane conditions can be maintained and personnel safety ensured. Furthermore, the required materials and resources must be immediately (locally) available. Any equipment not normally stocked by local supply houses will need to be stockpiled. To minimize this, one goal is to engineer methods that do not need specialized equipment.
Depopulation is defined by the American Veterinary Medical Association (AVMA) as “methods by which large numbers of animals must be destroyed quickly and efficiently with as much consideration given to the welfare of the animals as practicable, but where the circumstances and tasks facing those doing the depopulation are understood to be extenuating” [
5]. The primary AVMA approved methods are CO
2, gunshot and captive bolt [
6]. Maintaining the required rate of mass-depopulation while providing for animal welfare can be difficult during an emergency; thus, it is important that animal welfare be engineered into proposed systems for mass depopulation.
Depopulation processes will have to take place on farm sites, since transport of infected swine off-site could further spread the disease. Our informal conversations with various swine industry contacts confirm that the slow laborious methods of handling individual pigs for captive bolt, gunshot or lethal injection are best avoided. They indicate a preference for the use of CO
2 with dump-bed trucks or trailers serving as mobile euthanasia chambers. With this approach, pigs can be handled in groups and removed quickly from the buildings using existing walkways and loading chutes. Once pigs are loaded into dump truck bodies at the existing loading chute, the load can be quickly moved away from the chute to a nearby CO
2 application station, where the CO
2 can be administered in accordance with the prescribed guidelines described below. After a suitable holding time to ensure death (about 15 min based on preliminary research [
7]), the carcasses can be transported on to a disposal site without extra handling or delay. Some of this holding period could be the time required for low speed transport to the on-farm disposal site. This process minimizes handling and labor requirements. If disposal has to take place off-site, then completely sealed transport containers and decontamination procedures would be needed. Euthanizing swine inside the production barns is not a recommended option, due to carcass removal impediments and other considerations. Of course, quickly-constructed temporary corrals outside production barns could serve as depopulation chambers, and we have tested this approach. However, carcass removal after each treatment is difficult and significantly reduces the throughput rate.
The AVMA panel recommends in their 2013 Guidelines [
6] that CO
2 be introduced at a flow rate of about 20% chamber volume per min, which gives a wash-in (the inflow of CO
2 that purges the air) time constant of 5 min. As detailed in a previous pilot study by Meyer and Morrow [
4], this CO
2 injection rate results in an average CO
2 volume fraction of 63.5% in the chamber after 5 min of wash-in. They successfully demonstrated the feasibility of CO
2 for on-farm depopulation of adult pigs. The work reported here focuses on the CO
2 gas behavior as it is injected and mixed with the air and pigs in whatever type of chamber is used. The objective is to further develop and evaluate the details of the methods for the repetitive application of CO
2 to large groups of swine in such a manner as to rapidly euthanize the animals. This paper discusses the use of computational fluid dynamics (CFD) and experimental methods to further evaluate CO
2 wash-in, the distribution of CO
2 within the chambers, whether plenums were needed, the need for proper chamber sealing and the desirable enhancement of CO
2 stratification in the chambers. The methods for CO
2 gas generation and the means for buffering the gas temperature will be addressed in a subsequent paper.
Safe, humane and practical methods for mass depopulation of diseased swine are important for the livestock industry, livestock personnel and the surrounding communities. The methods for using CO
2 seem to offer the potential for meeting these overall requirements. For example, use of CO
2 does not require the constraint of individual pigs or the application of mechanical means that would be hazardous and very stressful for personnel, considering the potential high number of animals. As has been said, the application of CO
2 requires fewer workers, since pigs are treated in groups rather than individually. Minimizing the number of workers simplifies the training of personnel for the emergency task. It is well-established that the use of CO
2 results in rapid depressant, analgesic and anesthetic effects. Unlike N
2 and argon, which must be held within a very tight range of concentration to produce oxygen (O
2) levels below 2% for effective killing, CO
2 can render pigs unconscious and kill over a wide range of concentrations, even when O
2 is greater than 2% [
8]. Meyer and Morrow [
4] also point out that the other advantages of CO
2 as a euthanasia agent include: (1) its ready availability and relatively low cost; (2) its nonflammable and non-explosive properties; (3) the toxic effects due to accidental exposure of personnel to CO
2 can be readily reversed by prompt removal from the area (unlike other gases, such as CO); and (4) CO
2 poses minimal hazard when used with properly designed equipment.
3. Materials and Methods
3.1. The Chamber Used for CO2 and O2 Testing Comprising a Dumpster Mock-Up
A temporary test chamber in the form of a dumpster was constructed on the concrete floor of a well-ventilated arena located at the North Carolina State University Lake Wheeler Road Field Laboratory. The walls of the simulated dumpster were constructed of 19/3-inch (15 mm) oriented strand board (OSB) to duplicate the approximate inside dimensions of a standard 30 cubic yard (21 meters3) dumpster: 7 feet (2.13 m) wide by 5 feet (1.52 m) high by 21.5 feet long (6.55 m). The bottom edges of the plywood walls sat on standard pipe insulation (split foam tube), which sealed them to the concrete floor. This chamber could also be considered representative of a truck dump body.
The top of the test chamber was covered with clear 6 mm-thick polyethylene plastic, so that the edges draped the outside walls down to about 50 cm, where it was secured to the walls at about 1-m intervals. A wash-out vent was cut in the center of the top cover. This cut was on three sides of a square about 15 cm on each side. This constituted a vent flap that could be opened during CO2 wash-in to allow air to escape, then closed for retaining the gas during the remaining treatment period. (In actual applications with pigs, if this cover is in place during loading, a clear or translucent cover material is recommended, because swine do not like to enter dark areas).
3.2. Experimental Measurement of CO2 Concentrations
In order to test CO
2 volume fraction in several locations within the depopulation chamber volume, it was necessary to repeatedly sample and record the CO
2 values at several locations in quick succession during the wash-in pumping phase. The main objective was to evaluate the concentration and its uniformity. Since it was not practical to use multiple CO
2 sensors, a single CO
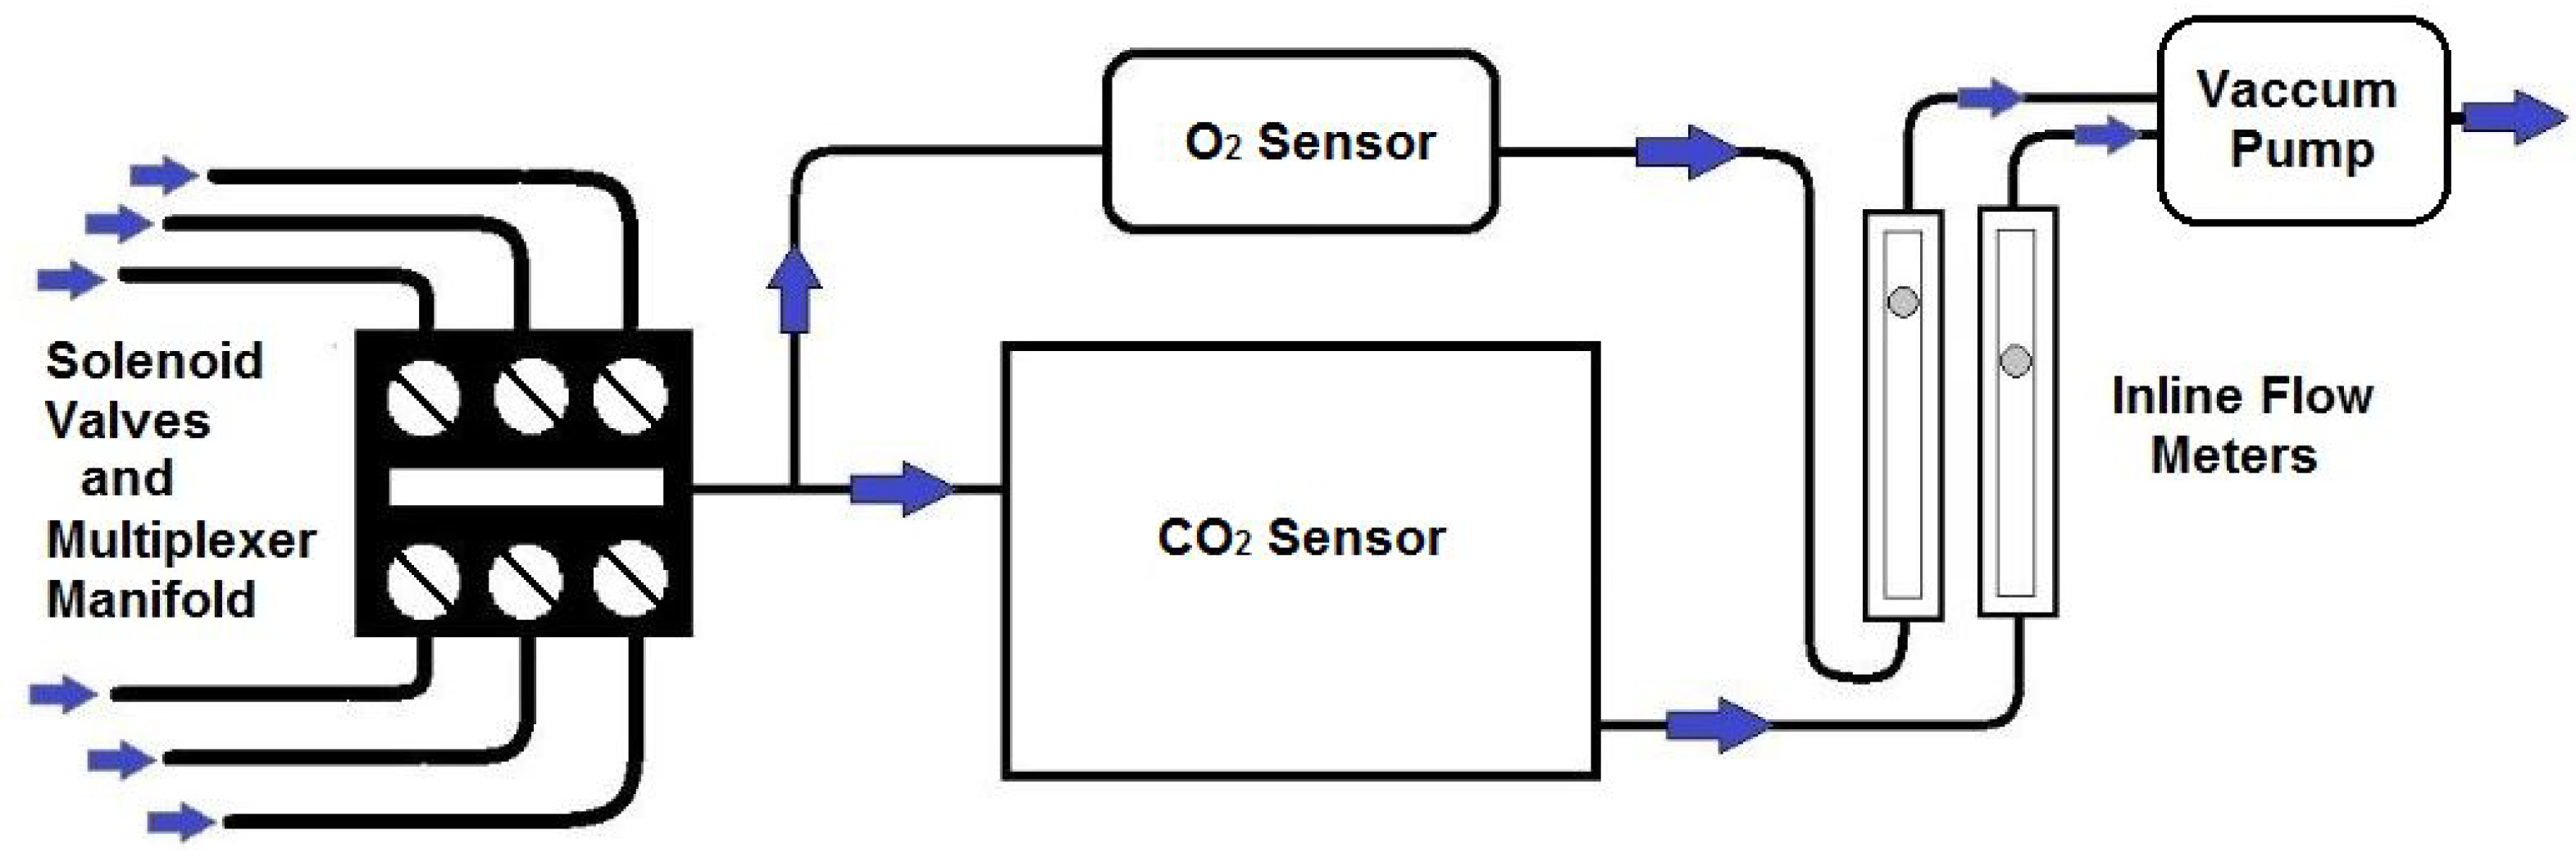
2 sensor was used with a sample tube multiplexing system feeding into it. The schematic in
Figure 8 shows the arrangement. The CO
2 infrared sensor is a Gascard NG for 0%–100% CO
2 with T
90 equal to 10 s (Edinburgh Instruments, Ltd., Livingston, West Lothian, UK). This sensor was calibrated using commercial specified gas mixtures at 0% and 100%. The manifold is equipped with solenoid valves (Cole-Parmer model # EW-98302-46) actuated by solid-state relays controlled by LabVIEW (National Instruments, Austin, TX, USA). The valves sequence through all the sample tubes, allowing time for the vacuum pump (MDL 3000/40007) to pull the total volume of the sample tube before reading the next concentration value. All sample tube (Klearon K010 3.5 mm inside diameter (ID), 6.4 mm outside diameter (OD) lengths were equal, so that the transport time delays for each sample point would be equal. The sample is captured and drawn into two proportioned flow paths, where it is simultaneously analyzed in the CO
2 sensor and O
2 sensor (Model UFO-130-2G from Teledyne Analytical Instruments, City of Industry, CA, USA). Sample CO
2 and O
2 data points were logged in LabVIEW on a laptop PC.
Figure 8.
Schematic of the CO2 and O2 gas sampling concentration analyzer.
Figure 8.
Schematic of the CO2 and O2 gas sampling concentration analyzer.
The intake ends of the sample tubes leading to the CO
2 sensor system were located as shown in
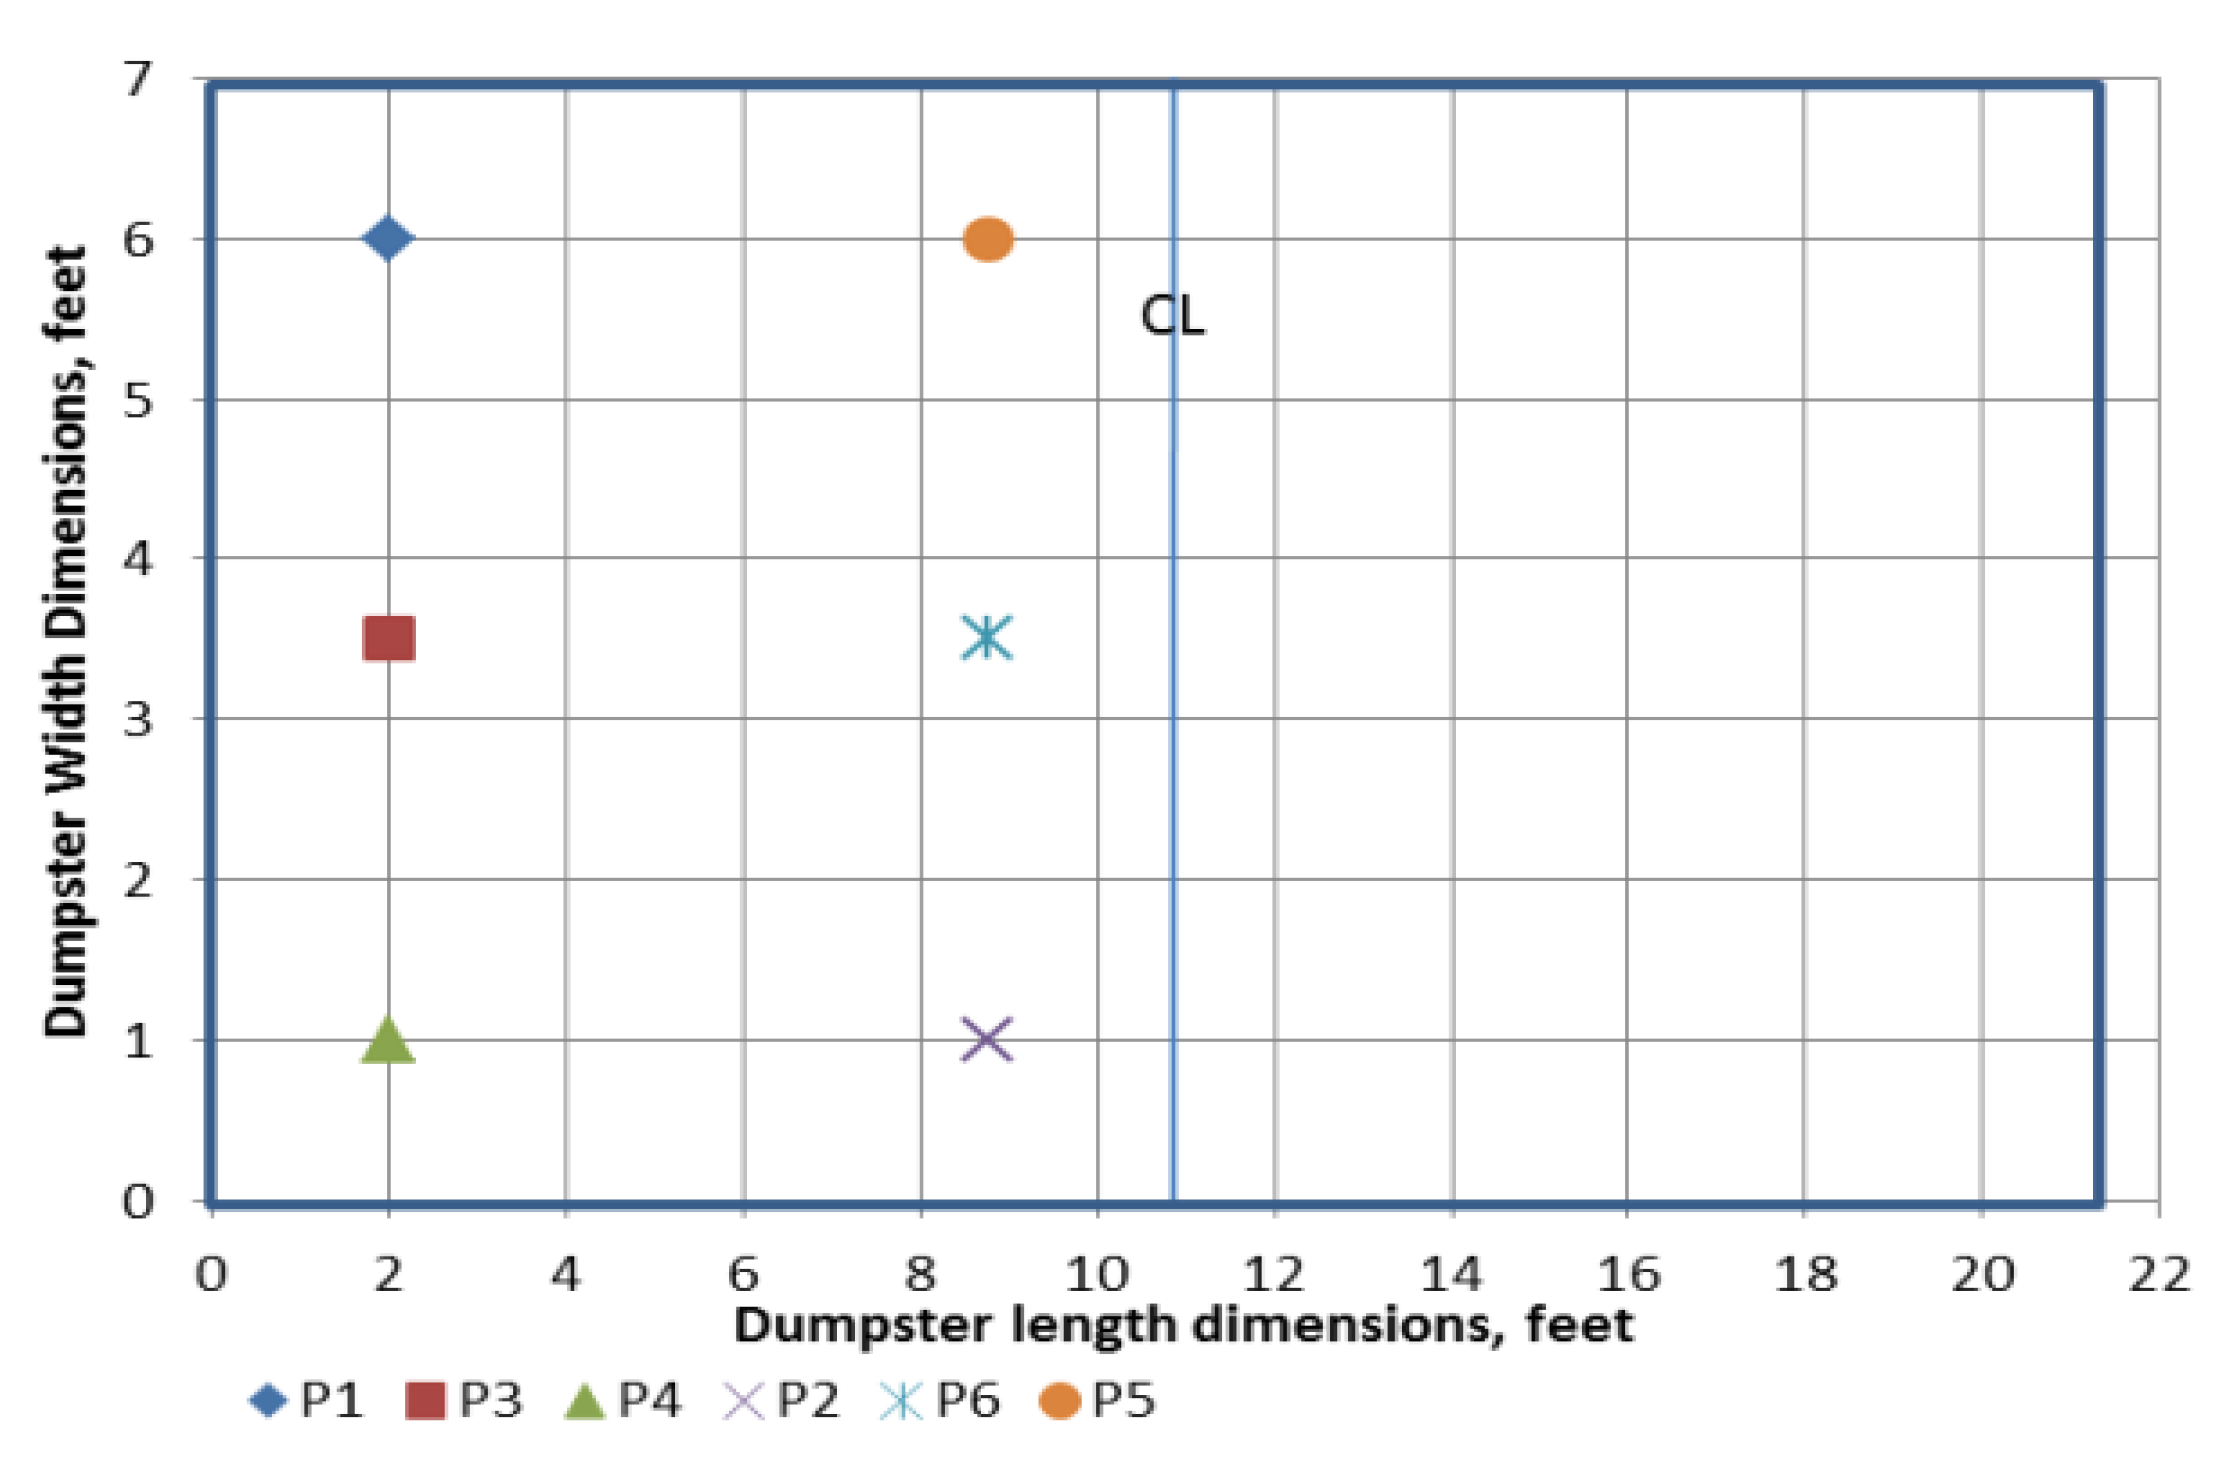
Figure 9, at 25 cm above the floor, the estimated approximate average pig nostril height. It is true that some pigs may climb or reach up for short periods, but this has not been observed in actual tests to be an important factor.
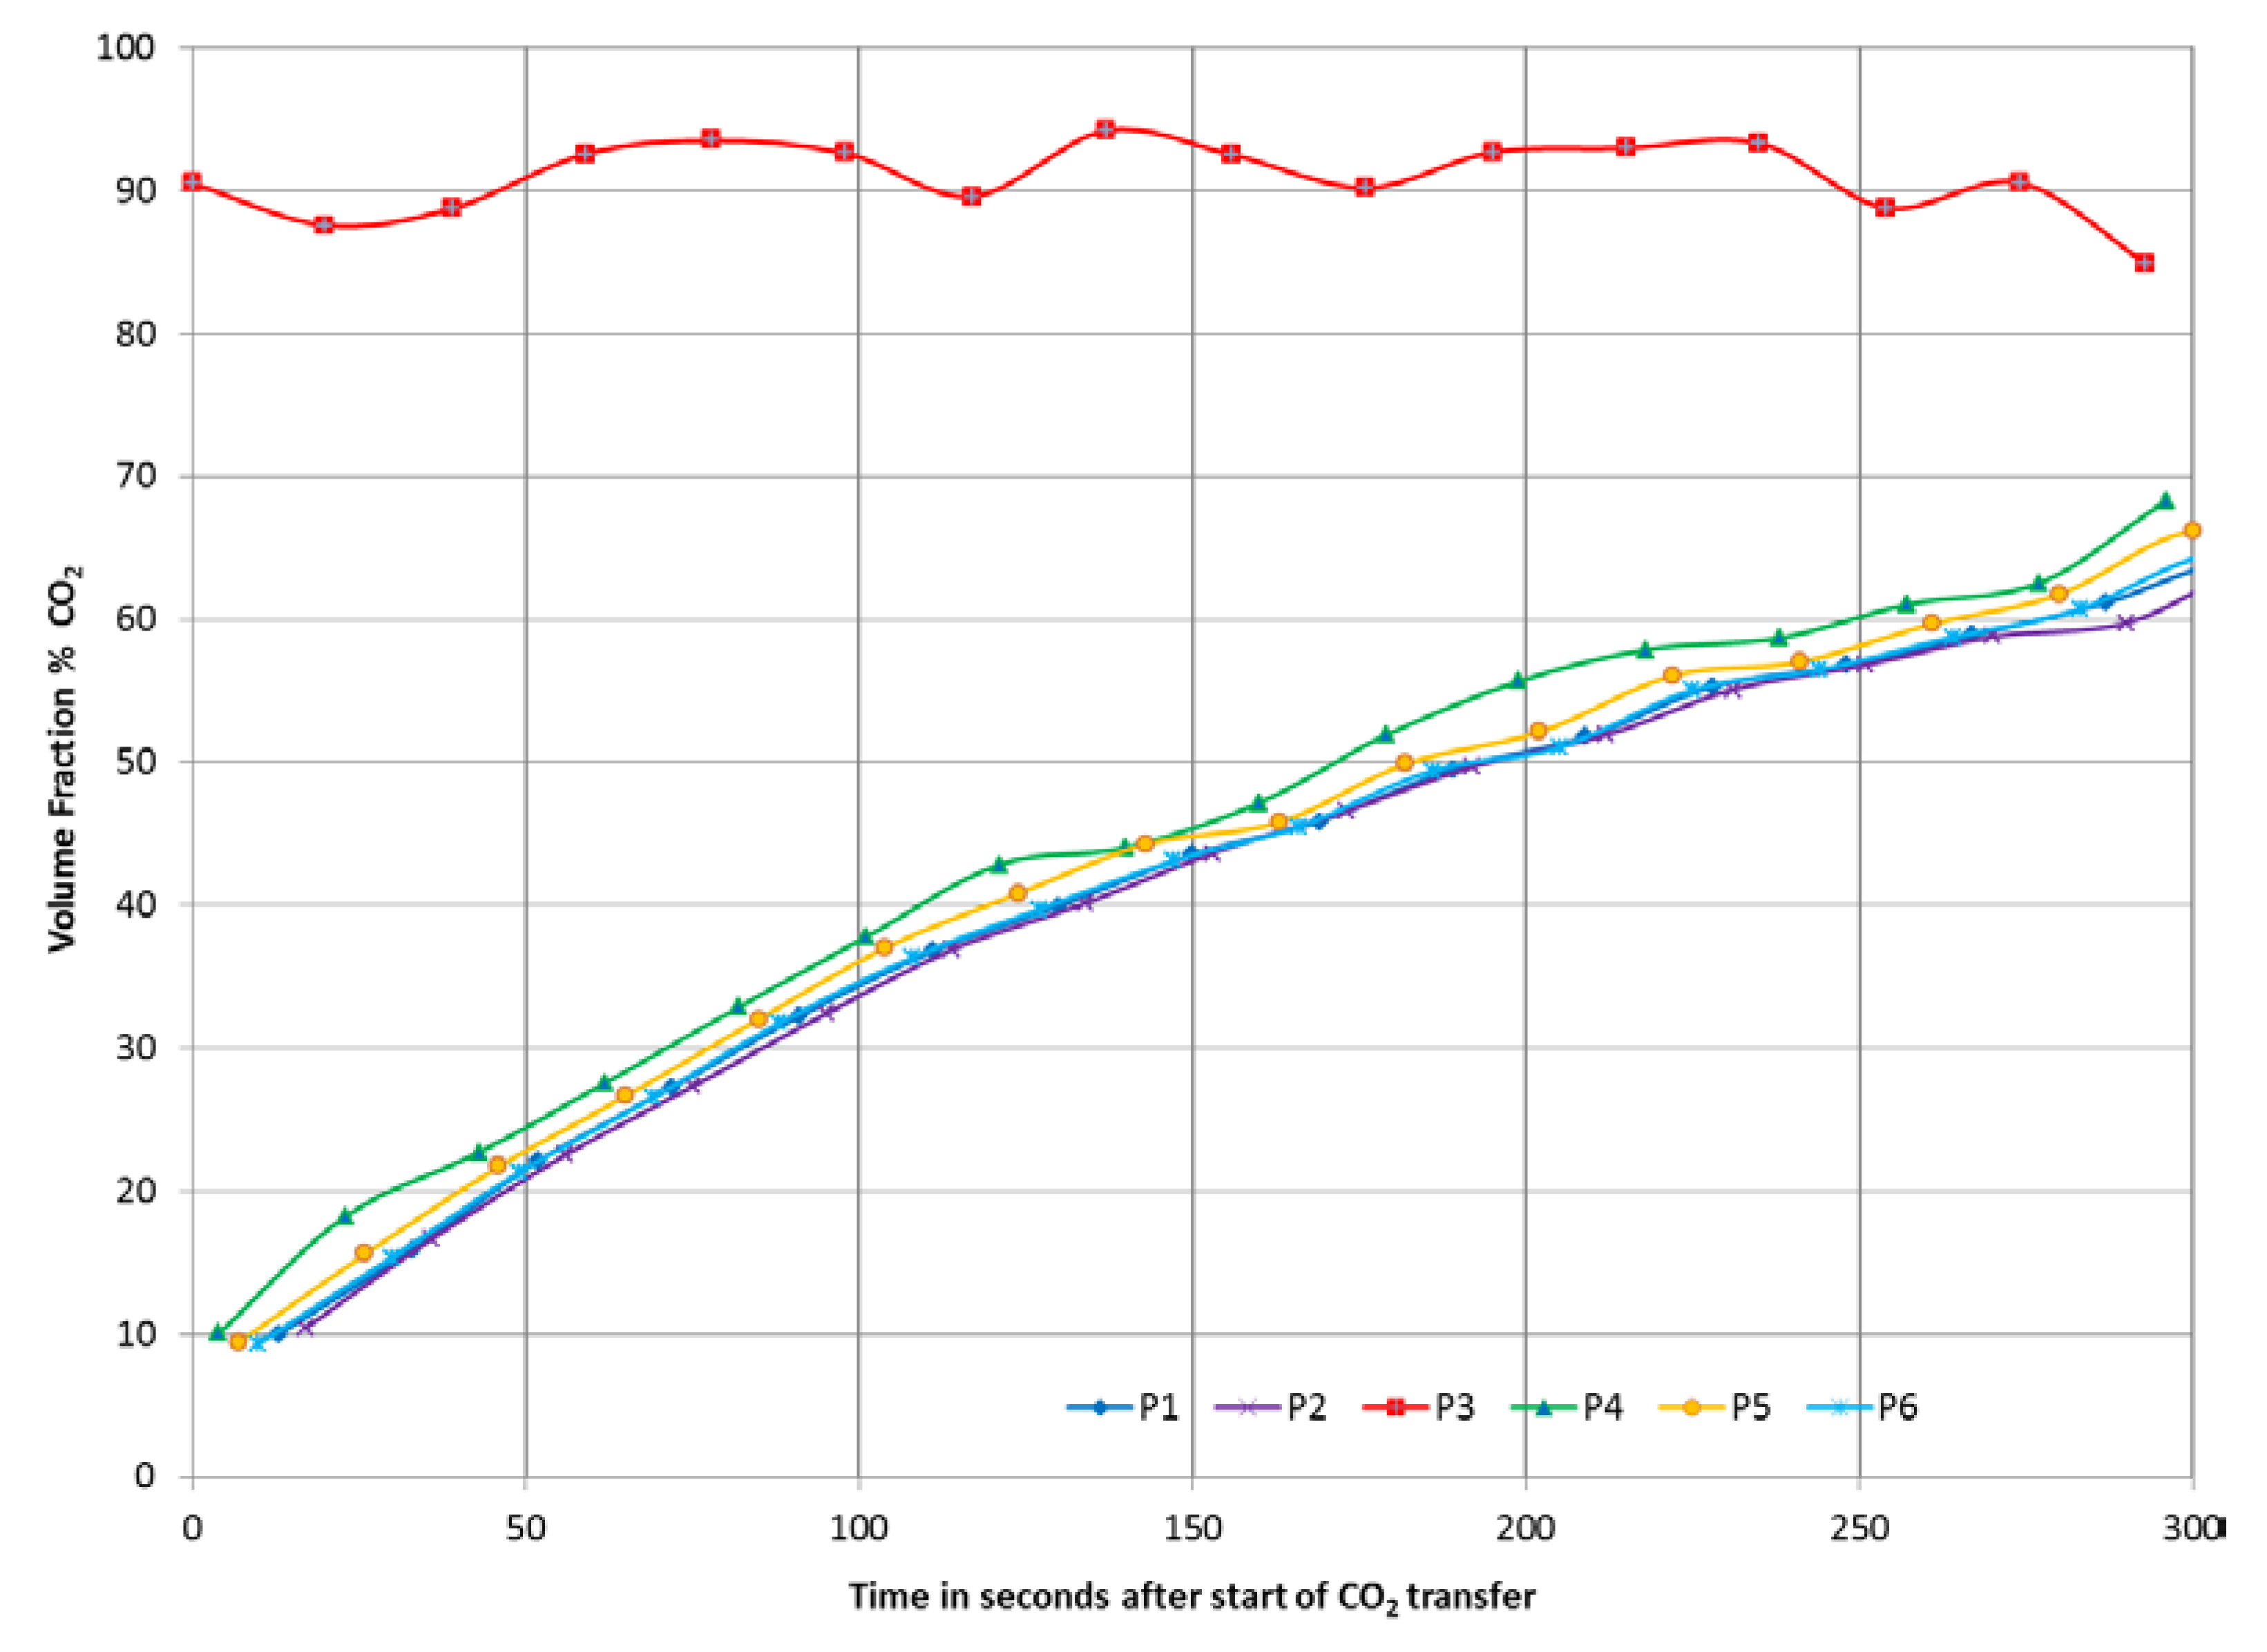
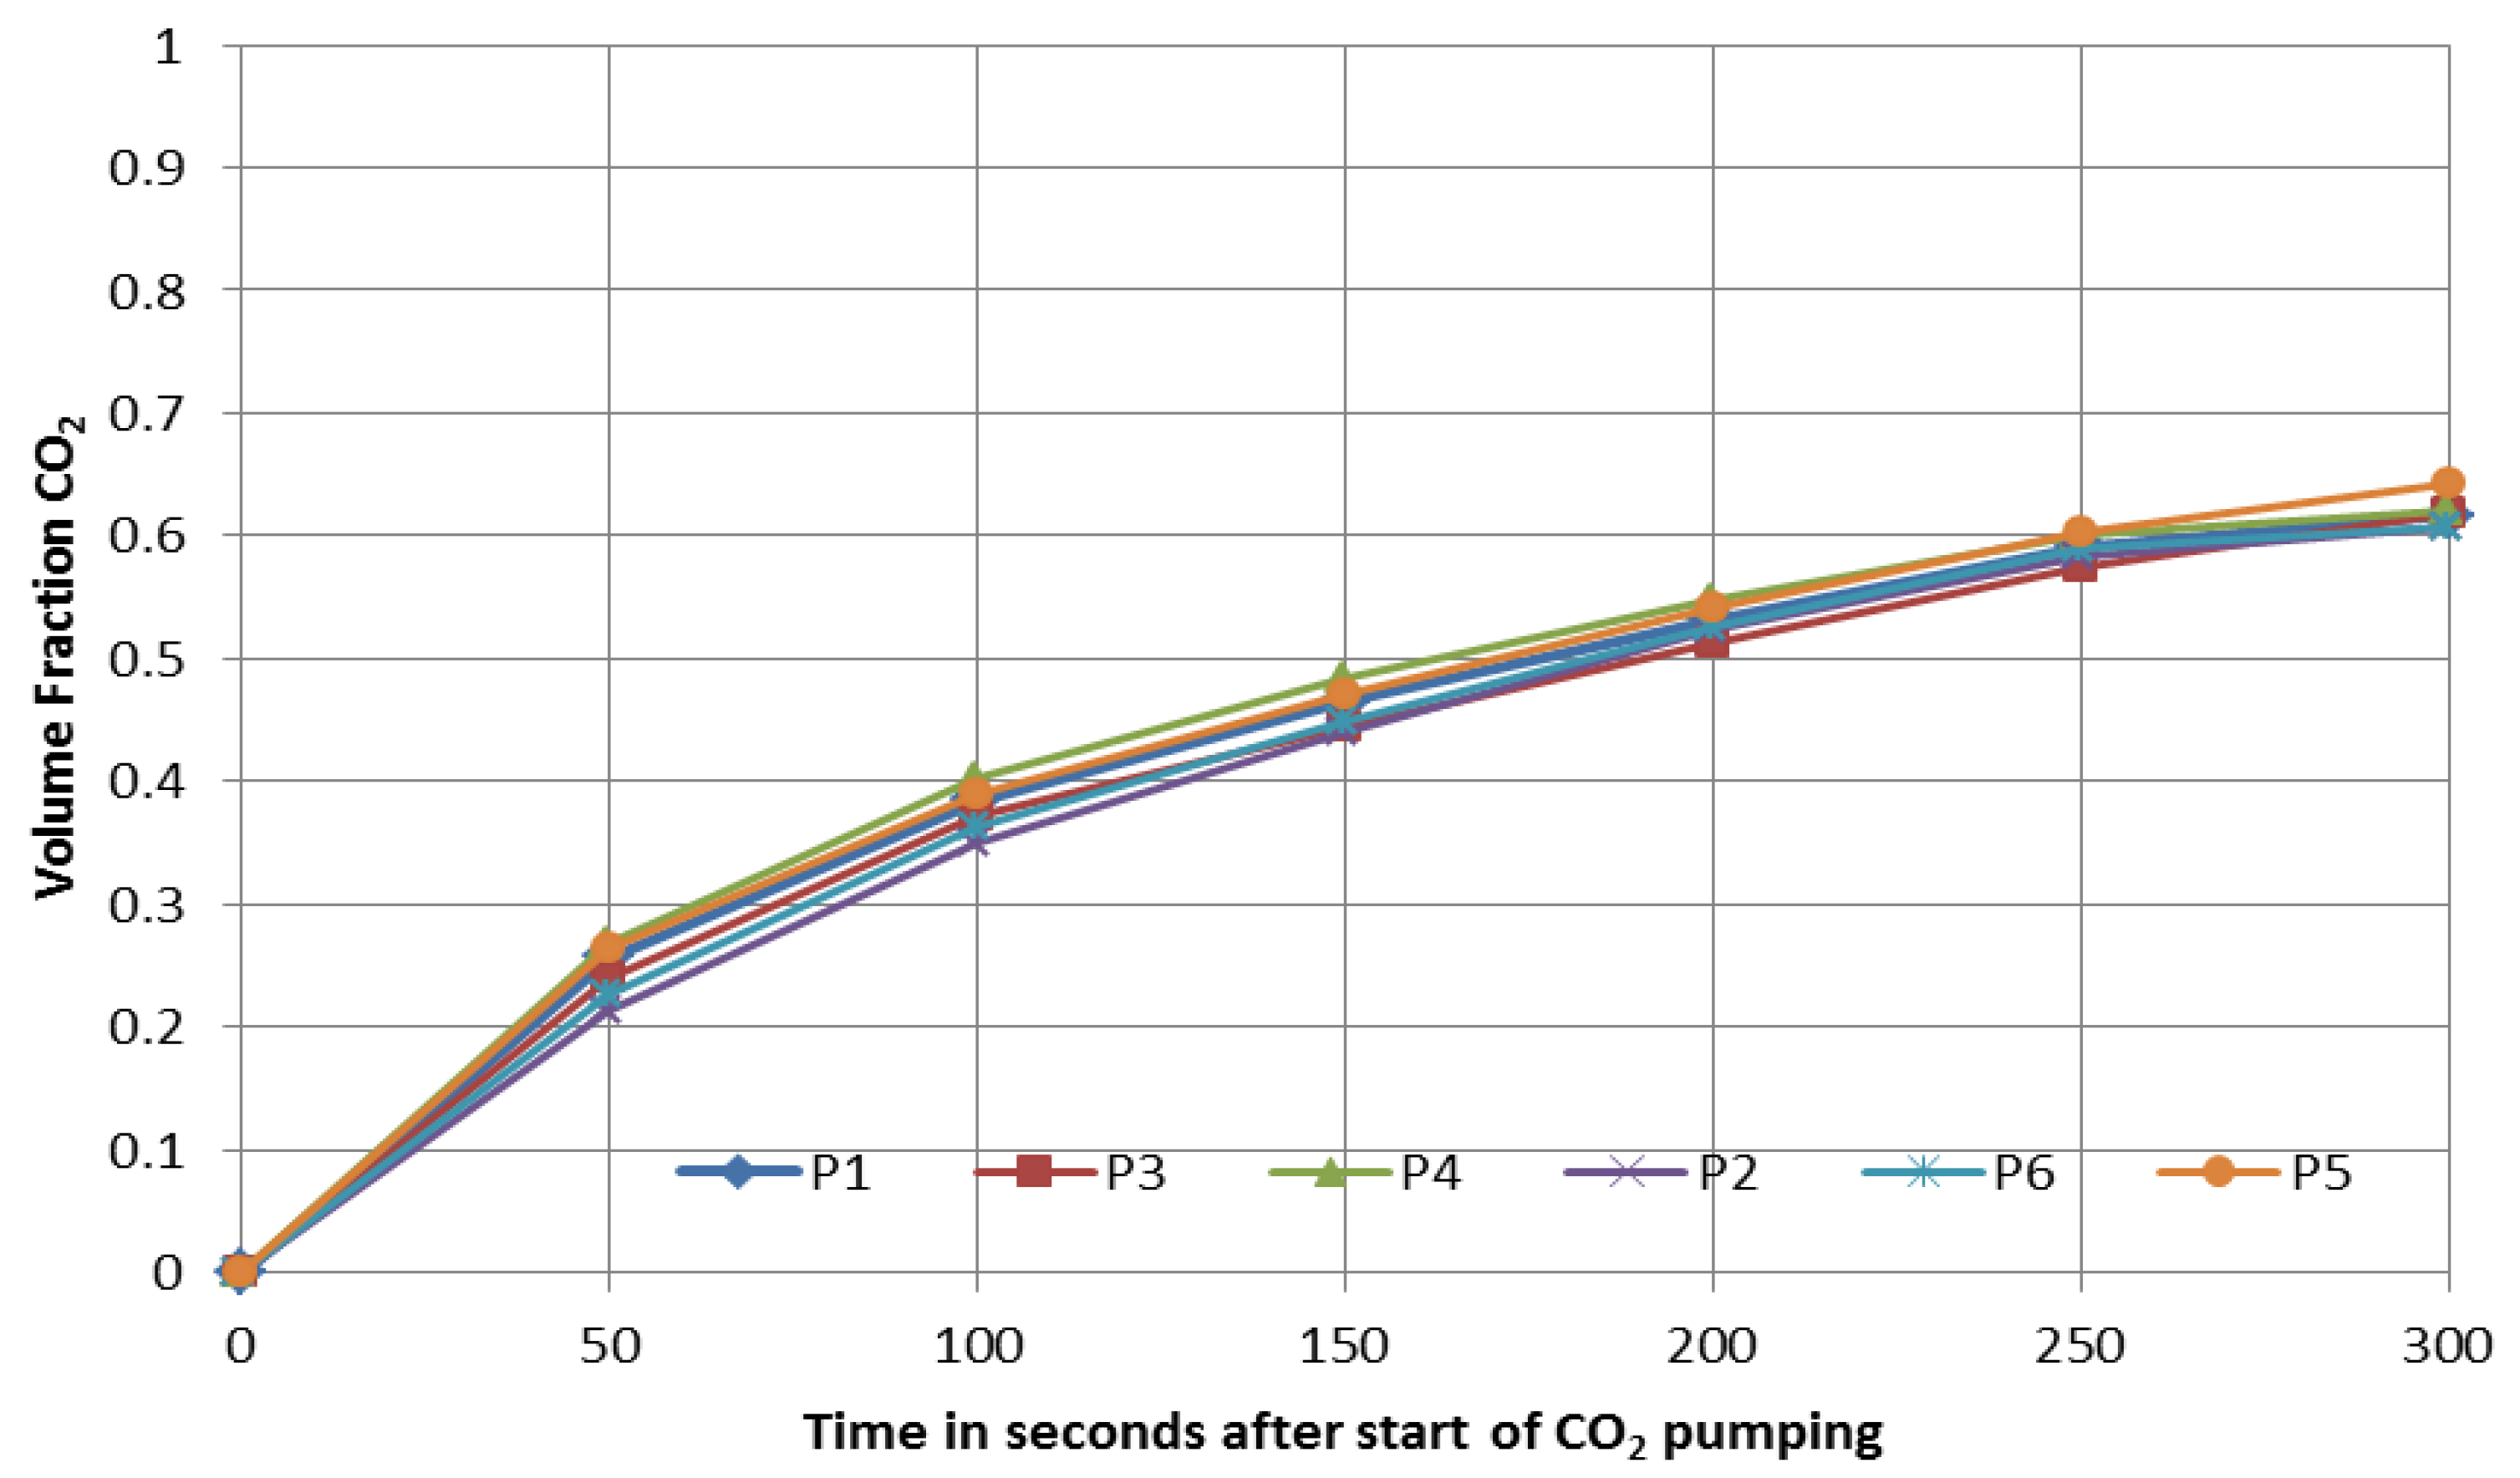
This arrangement took advantage of symmetry, with all sample points located in one half of the chamber. During the time-constant wash-in period (5 min), CO
2 concentration samples were recorded at points P1, P4, P2, P6 and P5, as shown in
Figure 9. However, the sensing tube labeled P3 was moved to the inlet pipe on the center plane of the chamber to monitor inlet CO
2 concentration, as shown in the data presented in
Figure 1.
The CO2 for the tests was produced by sublimation of dry ice. As the gas was produced by adding heat to dry ice in a closed container, it was ported into a large, initially empty, polyethylene bladder for temporary storage prior to each test. At the start of each test, the bladder was coupled to a variable speed blower with modified inlet and outlet ports, so that it could be connected with quick disconnects into the tube leading from the bladder to the test chamber. The blower fed into a custom-made Venturi/manometer calibrated as a CO2 flow rate sensor, so that the flow rate could be set to 20% chamber volume per minute (~150 ft3/min or 4.25 m3/min). The flow rate sensor fed into a 3-inch polyvinyl chloride (PVC) (7.8 cm ID) inlet pipe terminated with an elbow inside the chamber. The elbow outlet was 25 cm above the chamber floor and directed flow toward the floor. The temperature of the inlet gas was 27 °C.
Figure 9.
Plan view of the test chamber showing the location of CO2/O2 sample points at an elevation of 25 cm. All points are in one half of the chamber taking advantage of symmetry about the centerline “CL”.
Figure 9.
Plan view of the test chamber showing the location of CO2/O2 sample points at an elevation of 25 cm. All points are in one half of the chamber taking advantage of symmetry about the centerline “CL”.
Wash-in tests were 5 min (one time constant) in duration, while the CO2 and O2 concentrations were sampled and recorded. After a five min wash-in, CO2 pumping was halted, and the chamber wash-out vent was closed for about 15 more min to monitor the CO2 retained concentration. CO2 concentration must be retained during this period to assure that no pigs revive by being exposed to air too soon.
3.3. CFD Analysis Procedure
CFD software programs, such as FloEFD (Mentor Graphics, Wilsonville, OR, USA) are designed for concurrent CFD, which allows engineers to readily analyze and simulate heat transfer and the flow of fluids in almost any system that can be modeled in 3D CAD. This program can be integrated directly within CAD modeling programs and simplifies the analysis procedure by using highly sophisticated automatic adaptive meshing capabilities, which greatly reduce the complexity and time for accurate analysis [
9]. However, like all simulations, it cannot eliminate the need for experimental verification. The CFD software used in this project was FloEFD version 11.3 for Creo™ Parametric 1.0 (PTC
® Corporation, Needham, MA, USA).
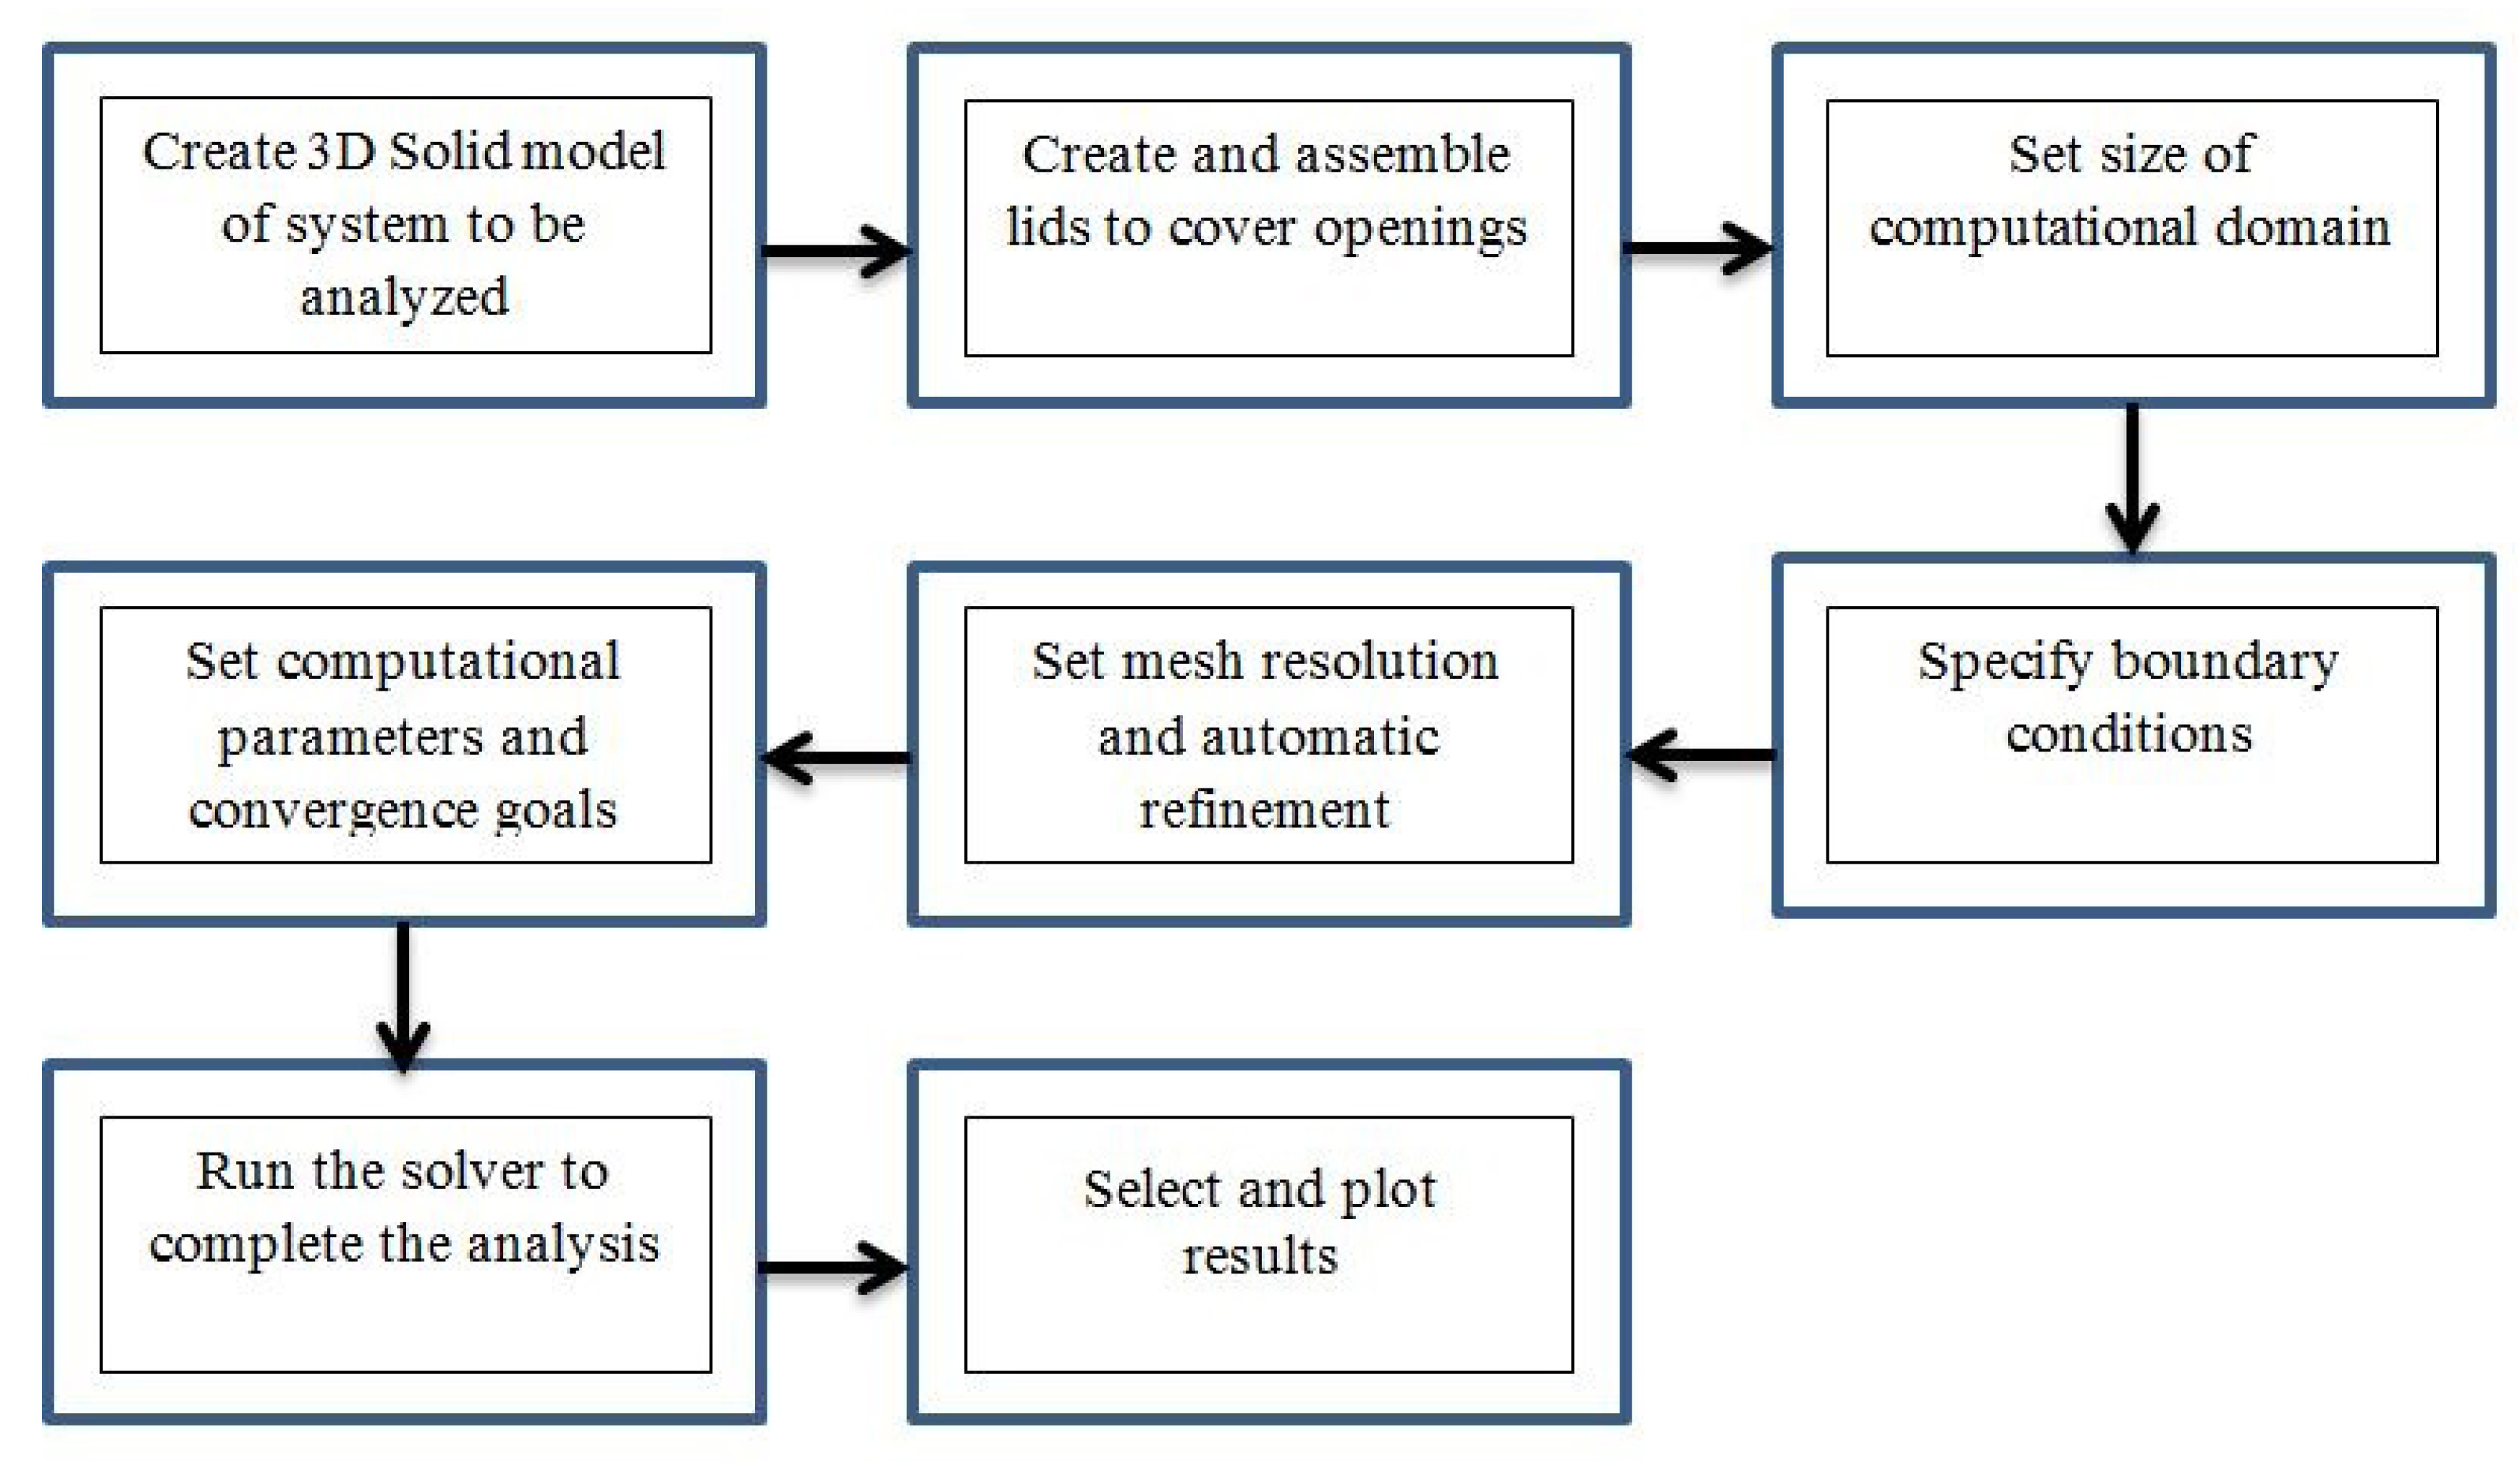
Figure 10 shows the main steps followed in the CFD modeling.
After creation of the 3D solid model of the system with all internal volumes and openings, the materials for the solid parts can be assigned. Although there is perhaps some CO2 permeability of components, such as the oriented strand board or the polyethylene cover, this was considered negligible because of the very short time periods involved. Material thermal properties need not be assigned unless a heat transfer analysis is to be performed. The “lids” that cover all inlet openings in the case of an “external” analysis are simple solid disks, which fit, for example, in the inlet pipe to allow the inlet boundary conditions, such as gas composition, gas temperature and flow rate, either volume or mass, to be specified as part of the overall boundary conditions.
Figure 10.
The primary steps in the CFD analysis procedure.
Figure 10.
The primary steps in the CFD analysis procedure.
The size of the computational domain (region to be meshed) must encompass all the fluid and solid volumes in the system unless symmetry is being specified on one of the domain boundaries. The boundary conditions include the fluid types and their concentrations, temperatures and inlet or outlet flow rates, pressures, etc. Initial temperatures can also be assigned to individual solids and fluids in the system.
This software automatically recognizes the boundaries between solids and fluids and is able to automatically mesh the computational domain appropriately and automatically refine the mesh where needed, although the user can specify basic mesh resolution and localized refinements if desired. Computational parameters, such as the physical time to be simulated, and specific goals to use for convergence testing can be set. FloEFD solves Favre-averaged Navier-Stokes equations for the fluids, handles both laminar and turbulent flows with one set of equations and allows transition from one flow type to the other. The k-ε model is used for turbulent kinetic energy and dissipation rate in the transport equations. The automatic solution time step was used, but it can be manually set if desired.
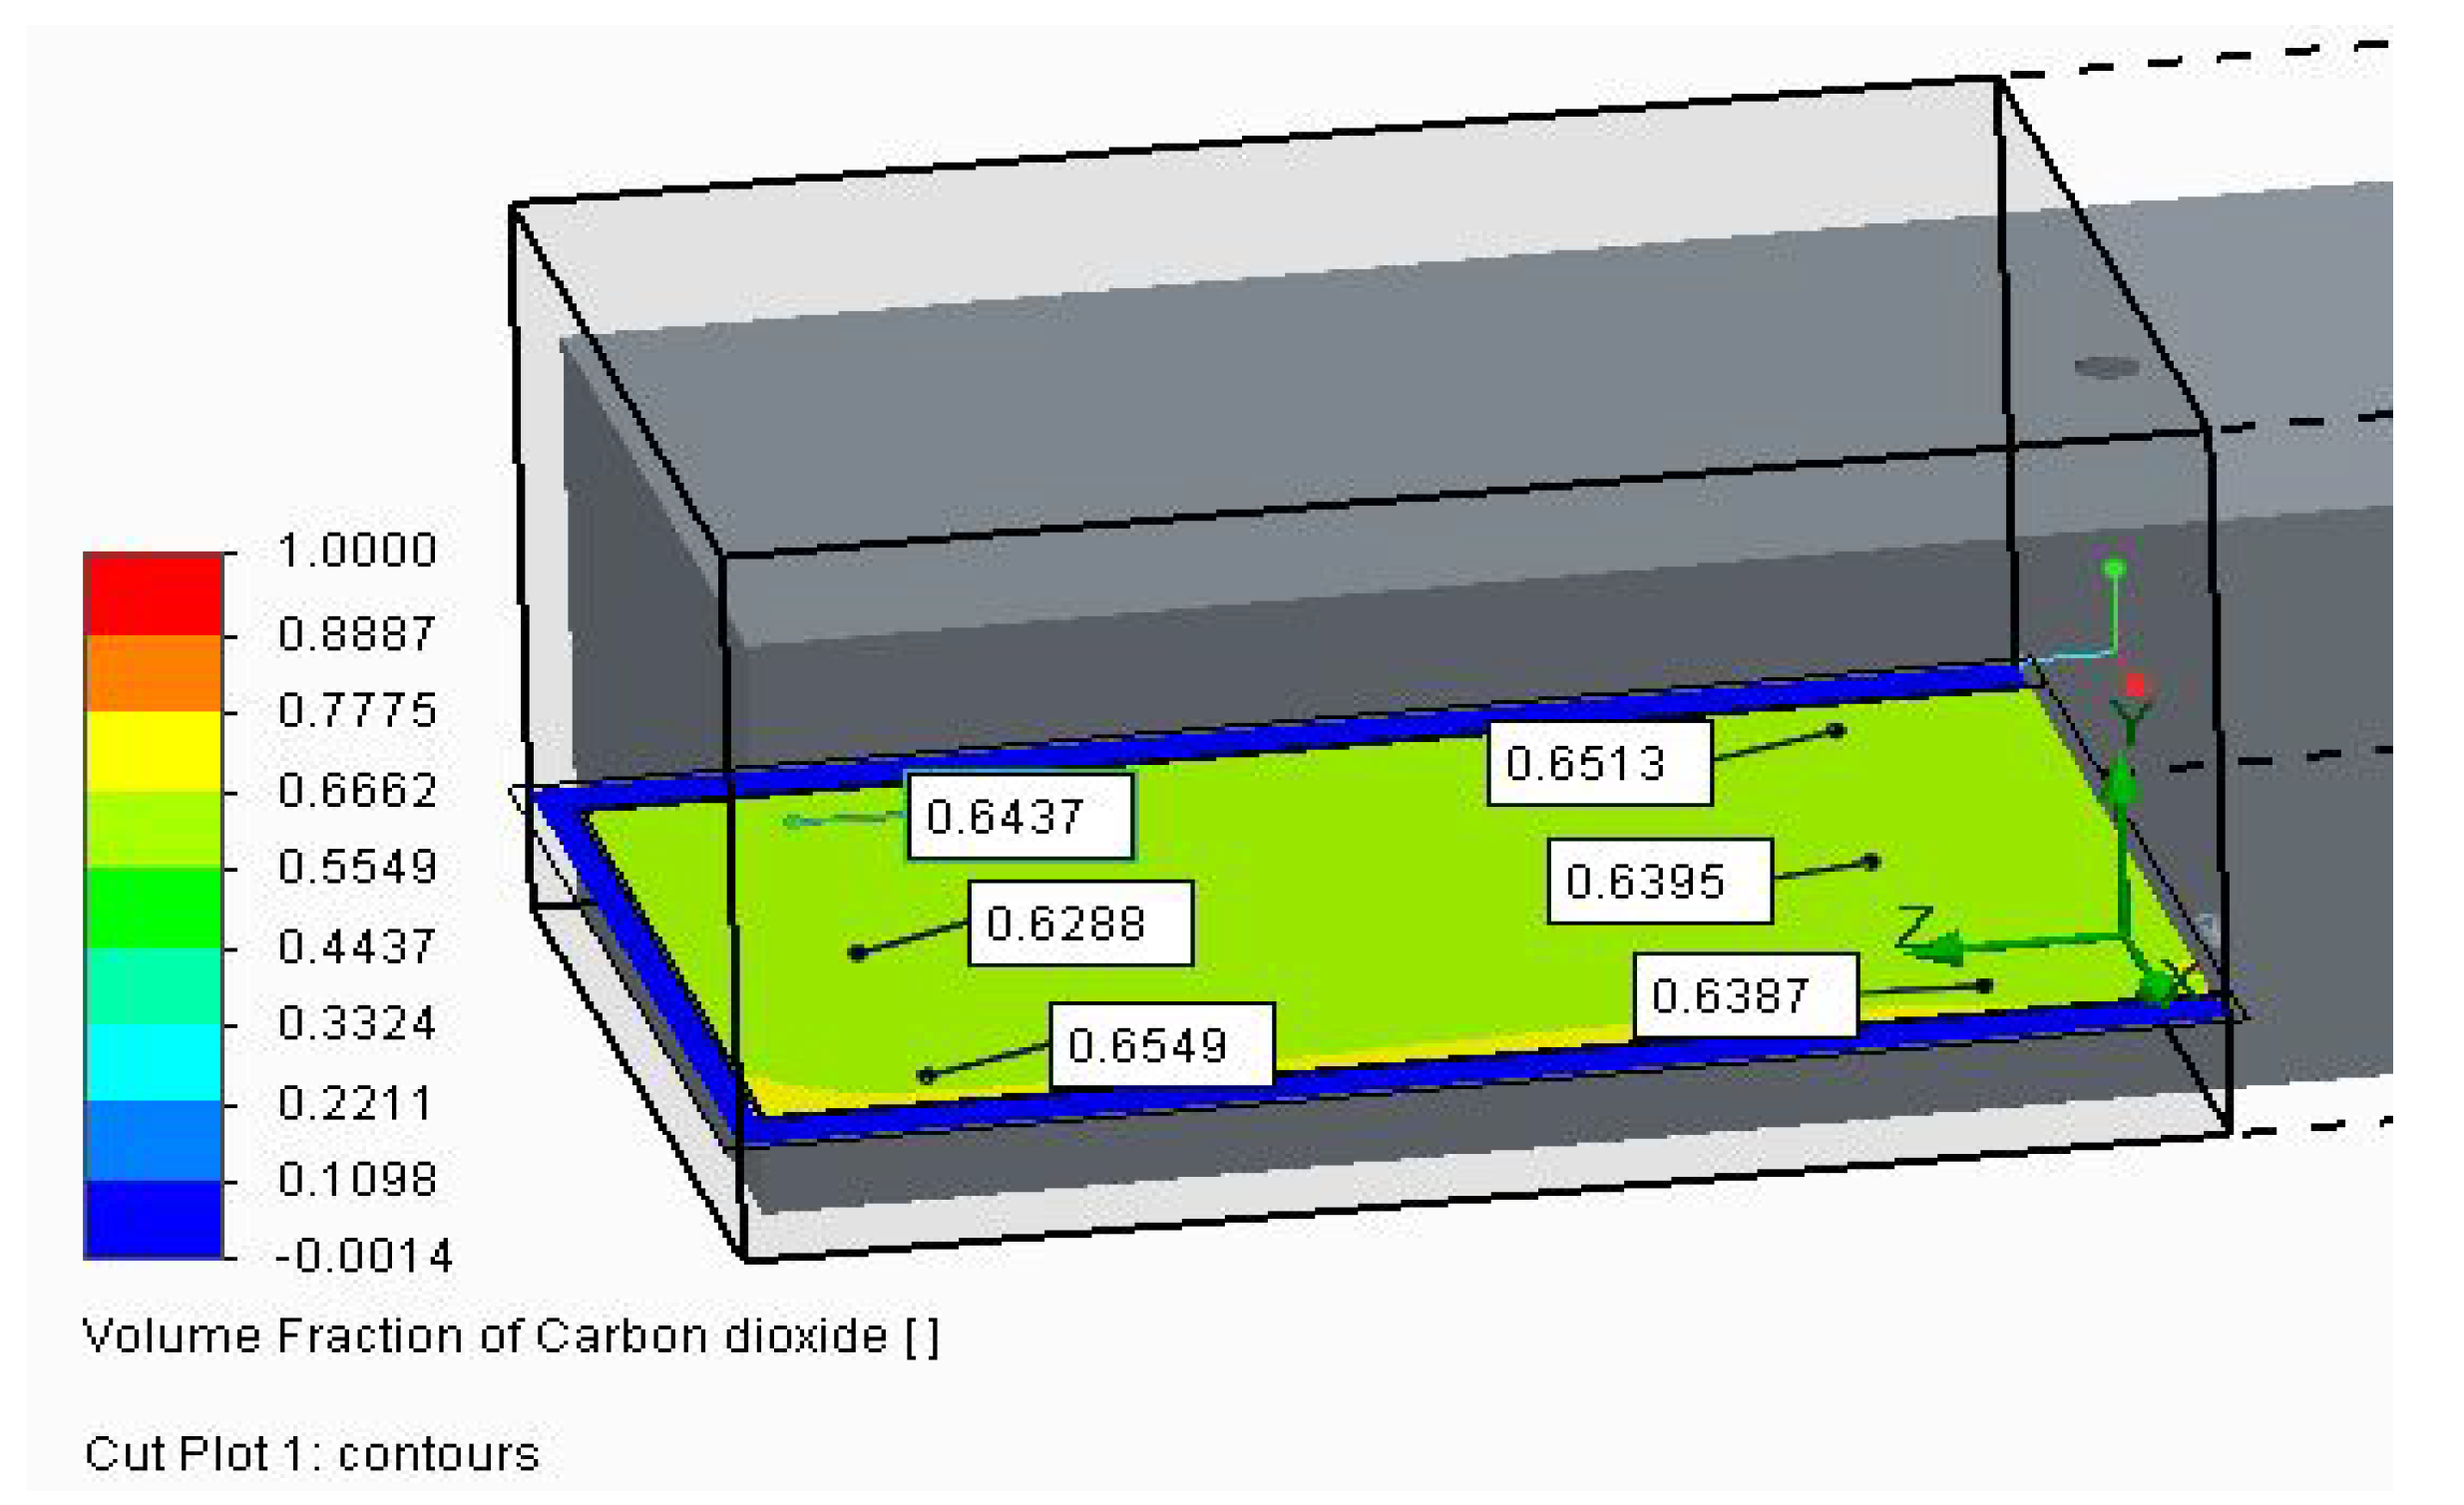
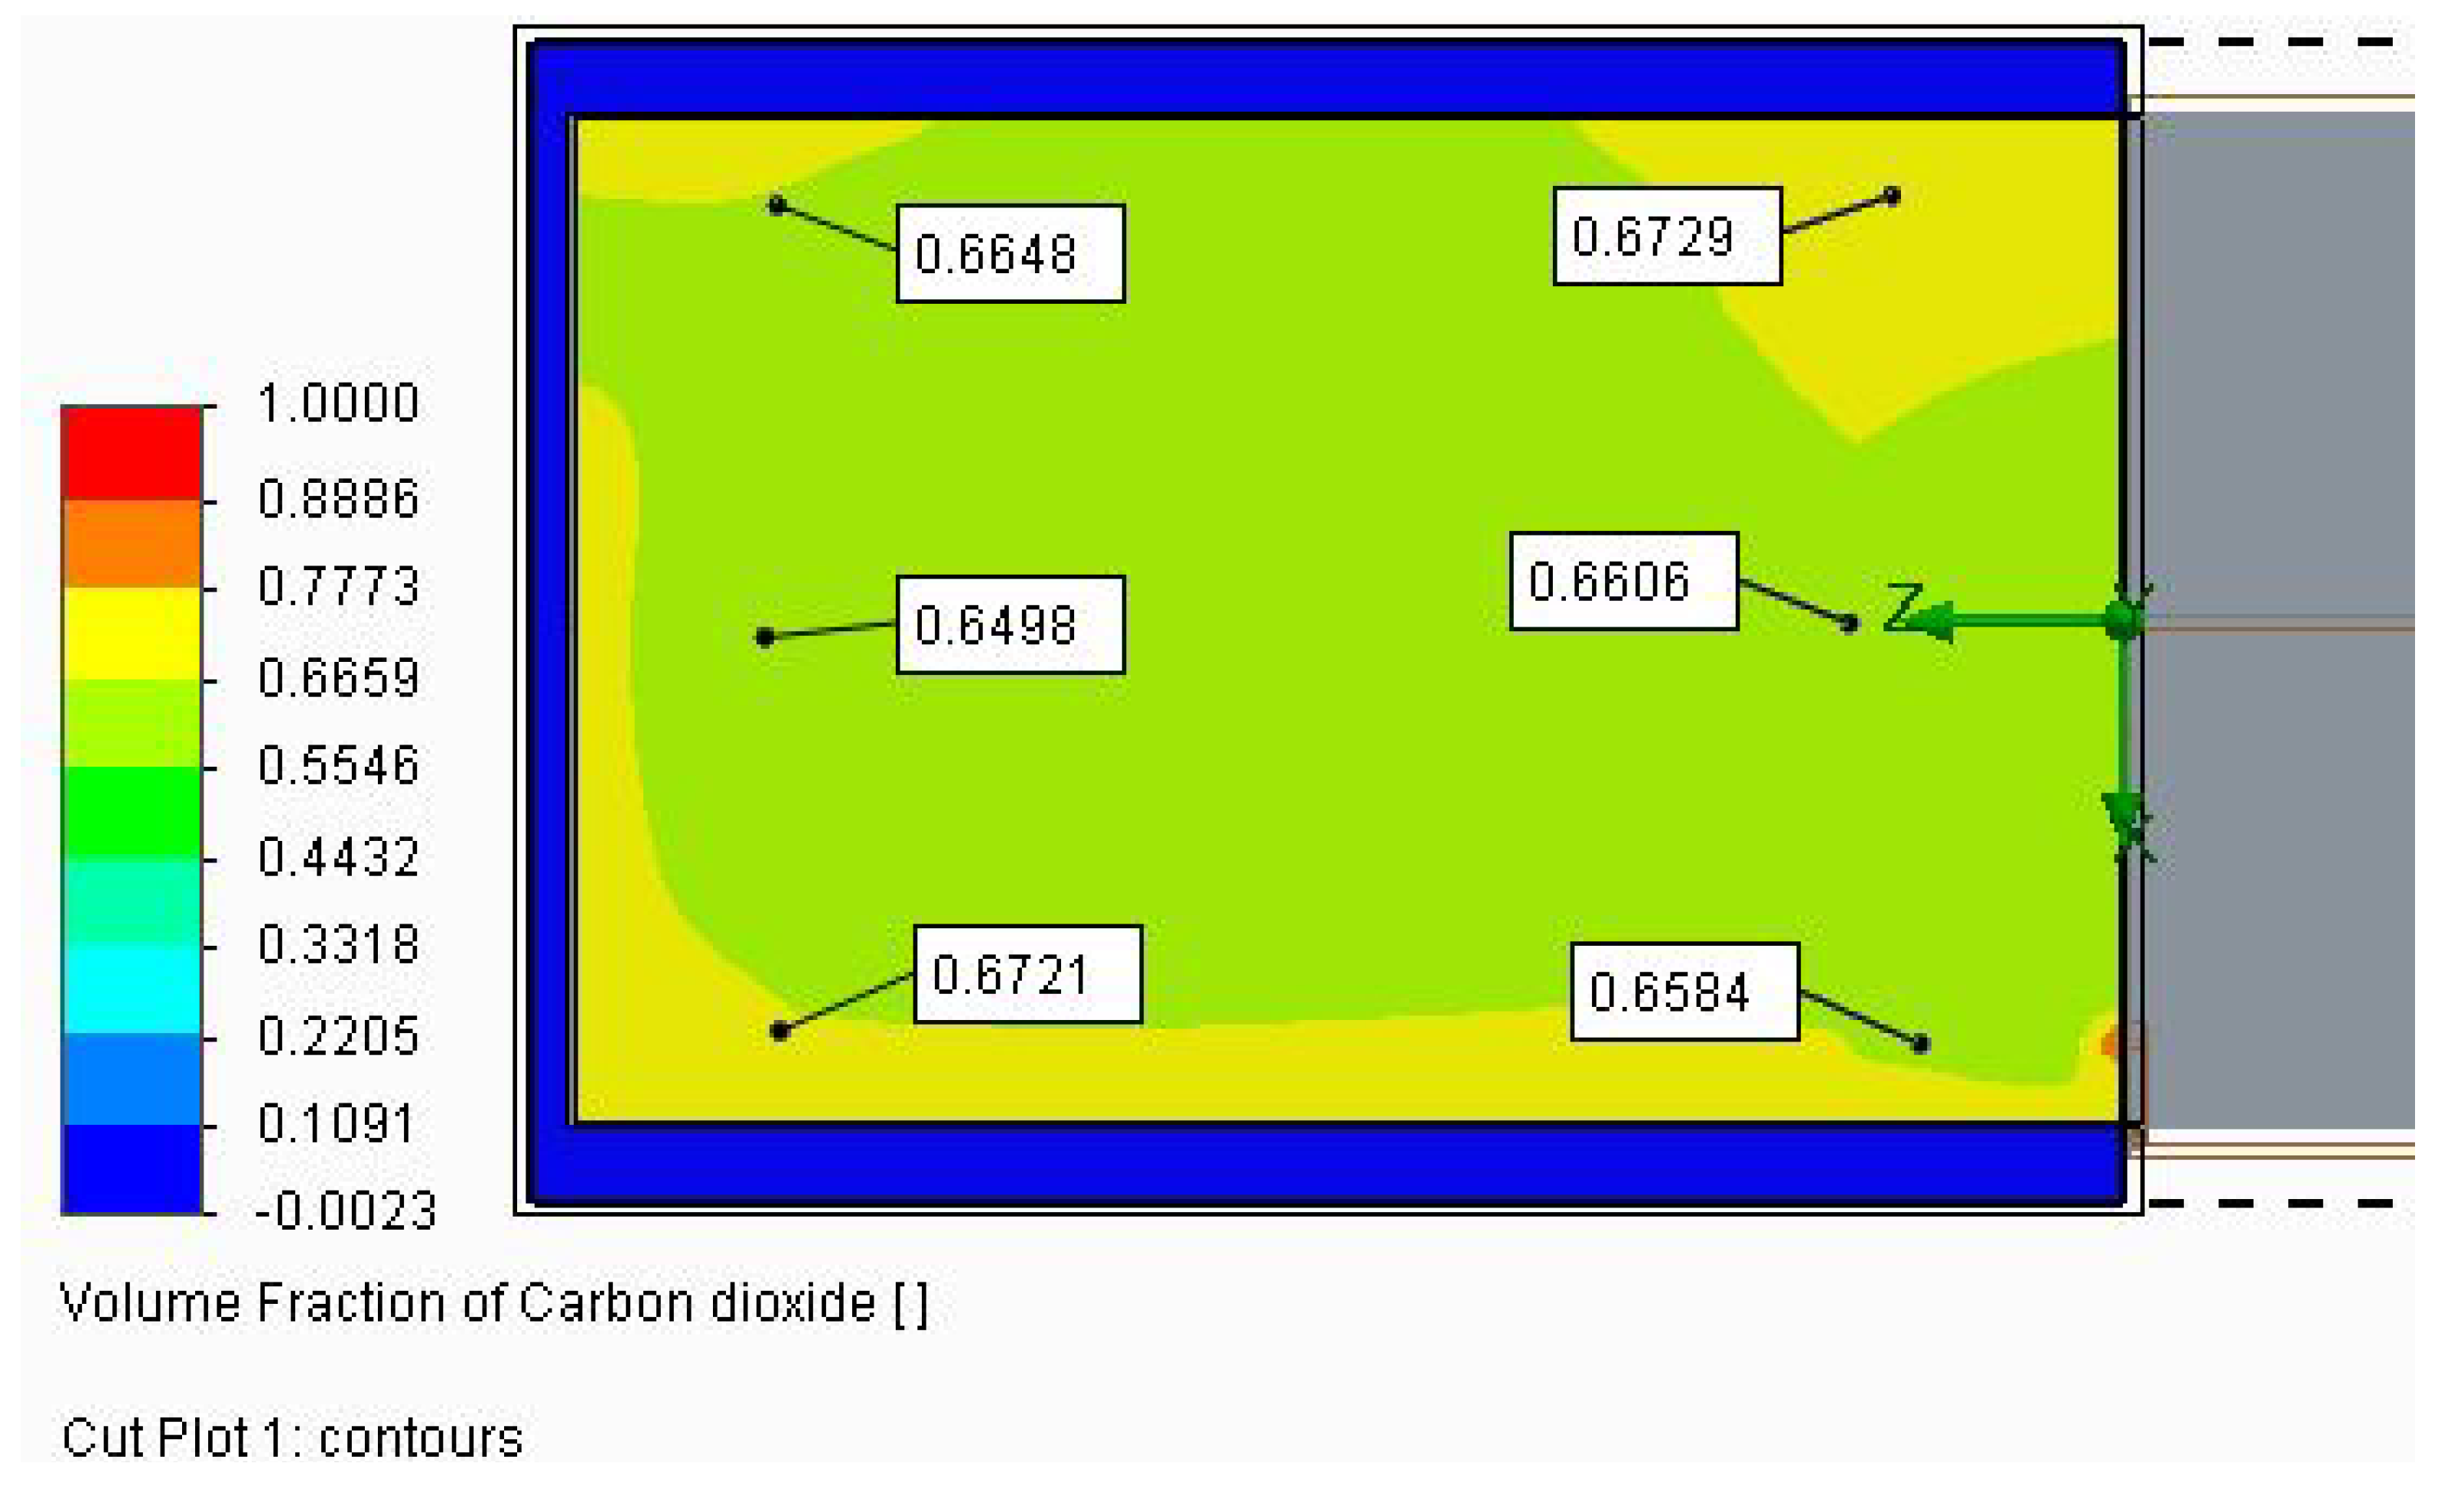
Once the analysis is run, and the solution has converged, one can select the results parameter to be displayed and the type of display desired. In our case, this was generally volume percent CO
2 at the locations within the chamber volume coinciding with the experimental sample point locations shown in
Figure 9. This was done by using cut plane displays, one horizontal at a 25 cm height above floor level and the other vertical through the mid-plane of the chamber. The results on these cut planes were then probed for the parameter values at various locations using the probe tool provided in the software. Values for the time plots were obtained by stopping and restarting the solution at each 50-s physical time interval.
3.4. Creating the CFD Chamber Model
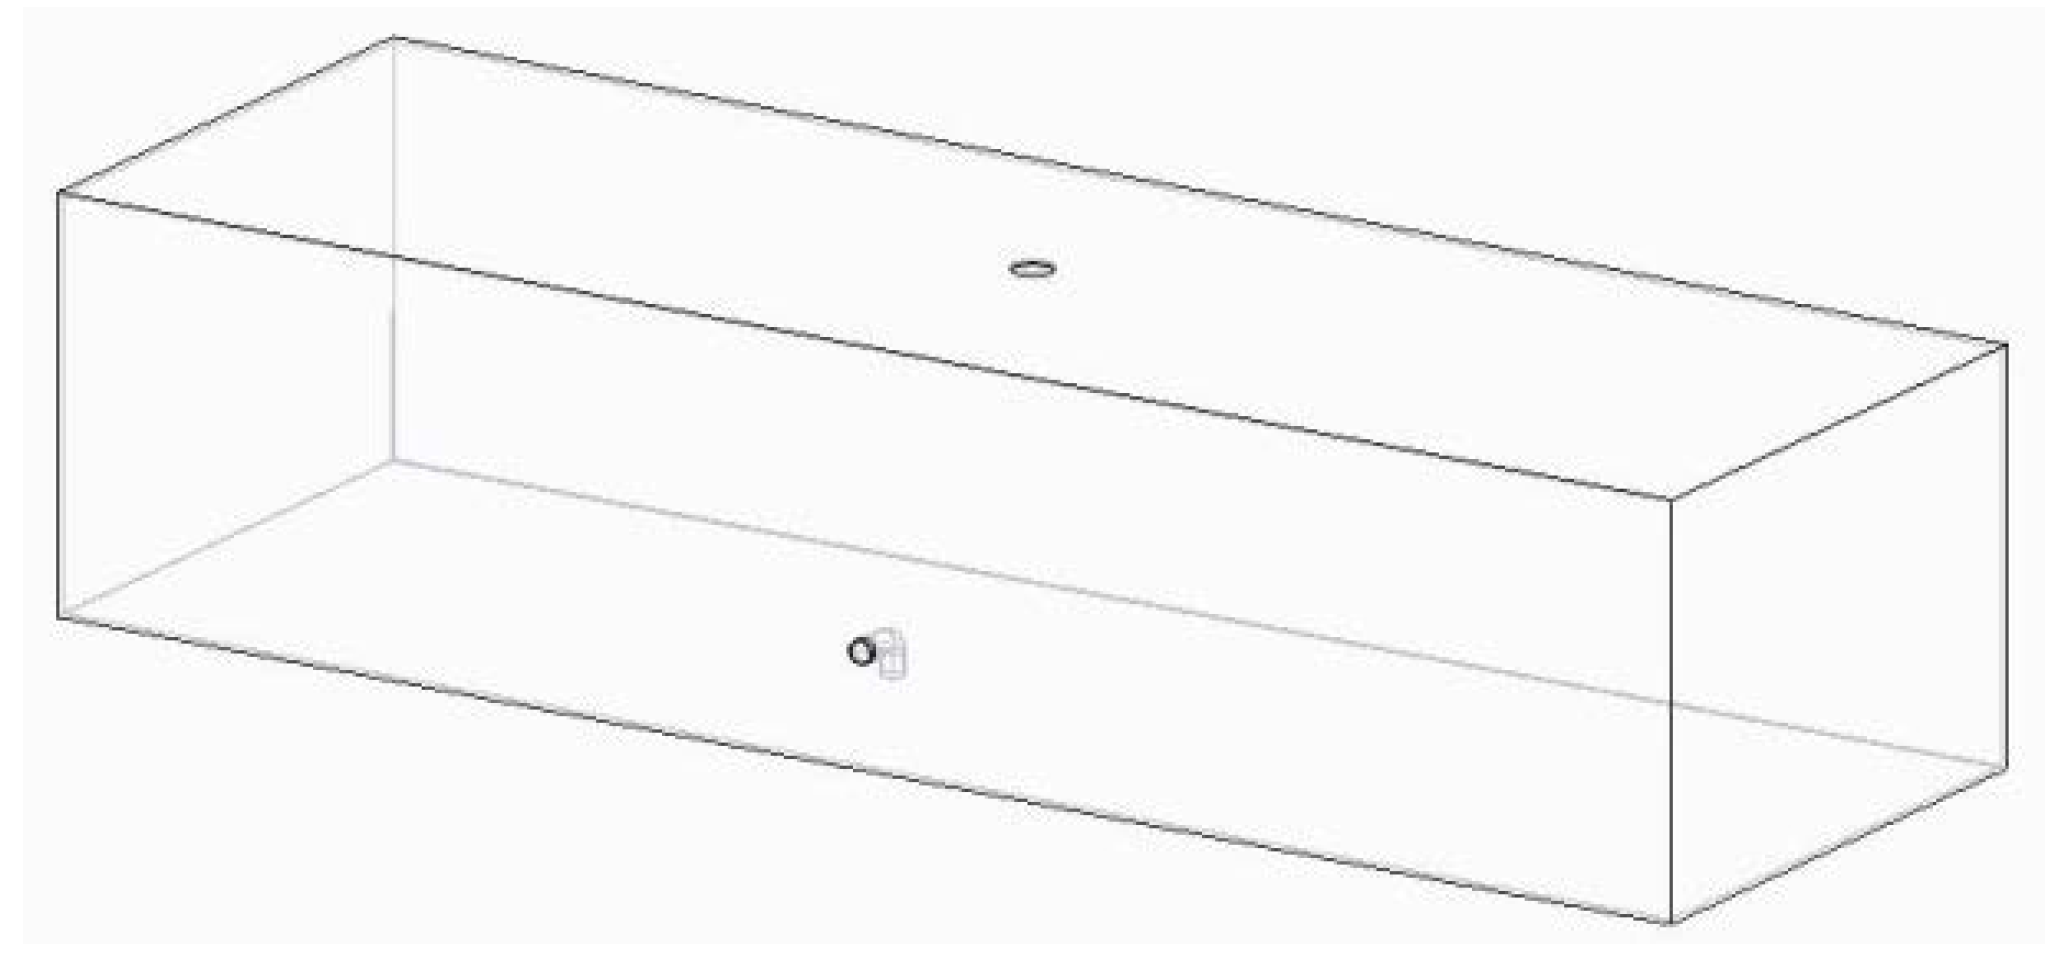
The model of the chamber volume was created as a solid extrusion, with the dimensions mentioned above representing a dumpster. The solid was then “shelled” to leave a hollow volume with thin walls. The vent hole was made by an extruded cut in the center of the top, and a hole was also cut through the sidewall. Additionally, a part model of a PVC elbow was assembled in the hole to properly represent the CO
2 inlet. This is shown in
Figure 11.
Figure 11.
The 3D solid model of the dumpster assembly showing the thin walls, the top wash-out vent hole and the inlet pipe/elbow in the sidewall. The inlet lid is a thin disc, which is assembled into the inlet pipe, so that it covers the entrance to the pipe and allows the inlet boundary conditions to be set.
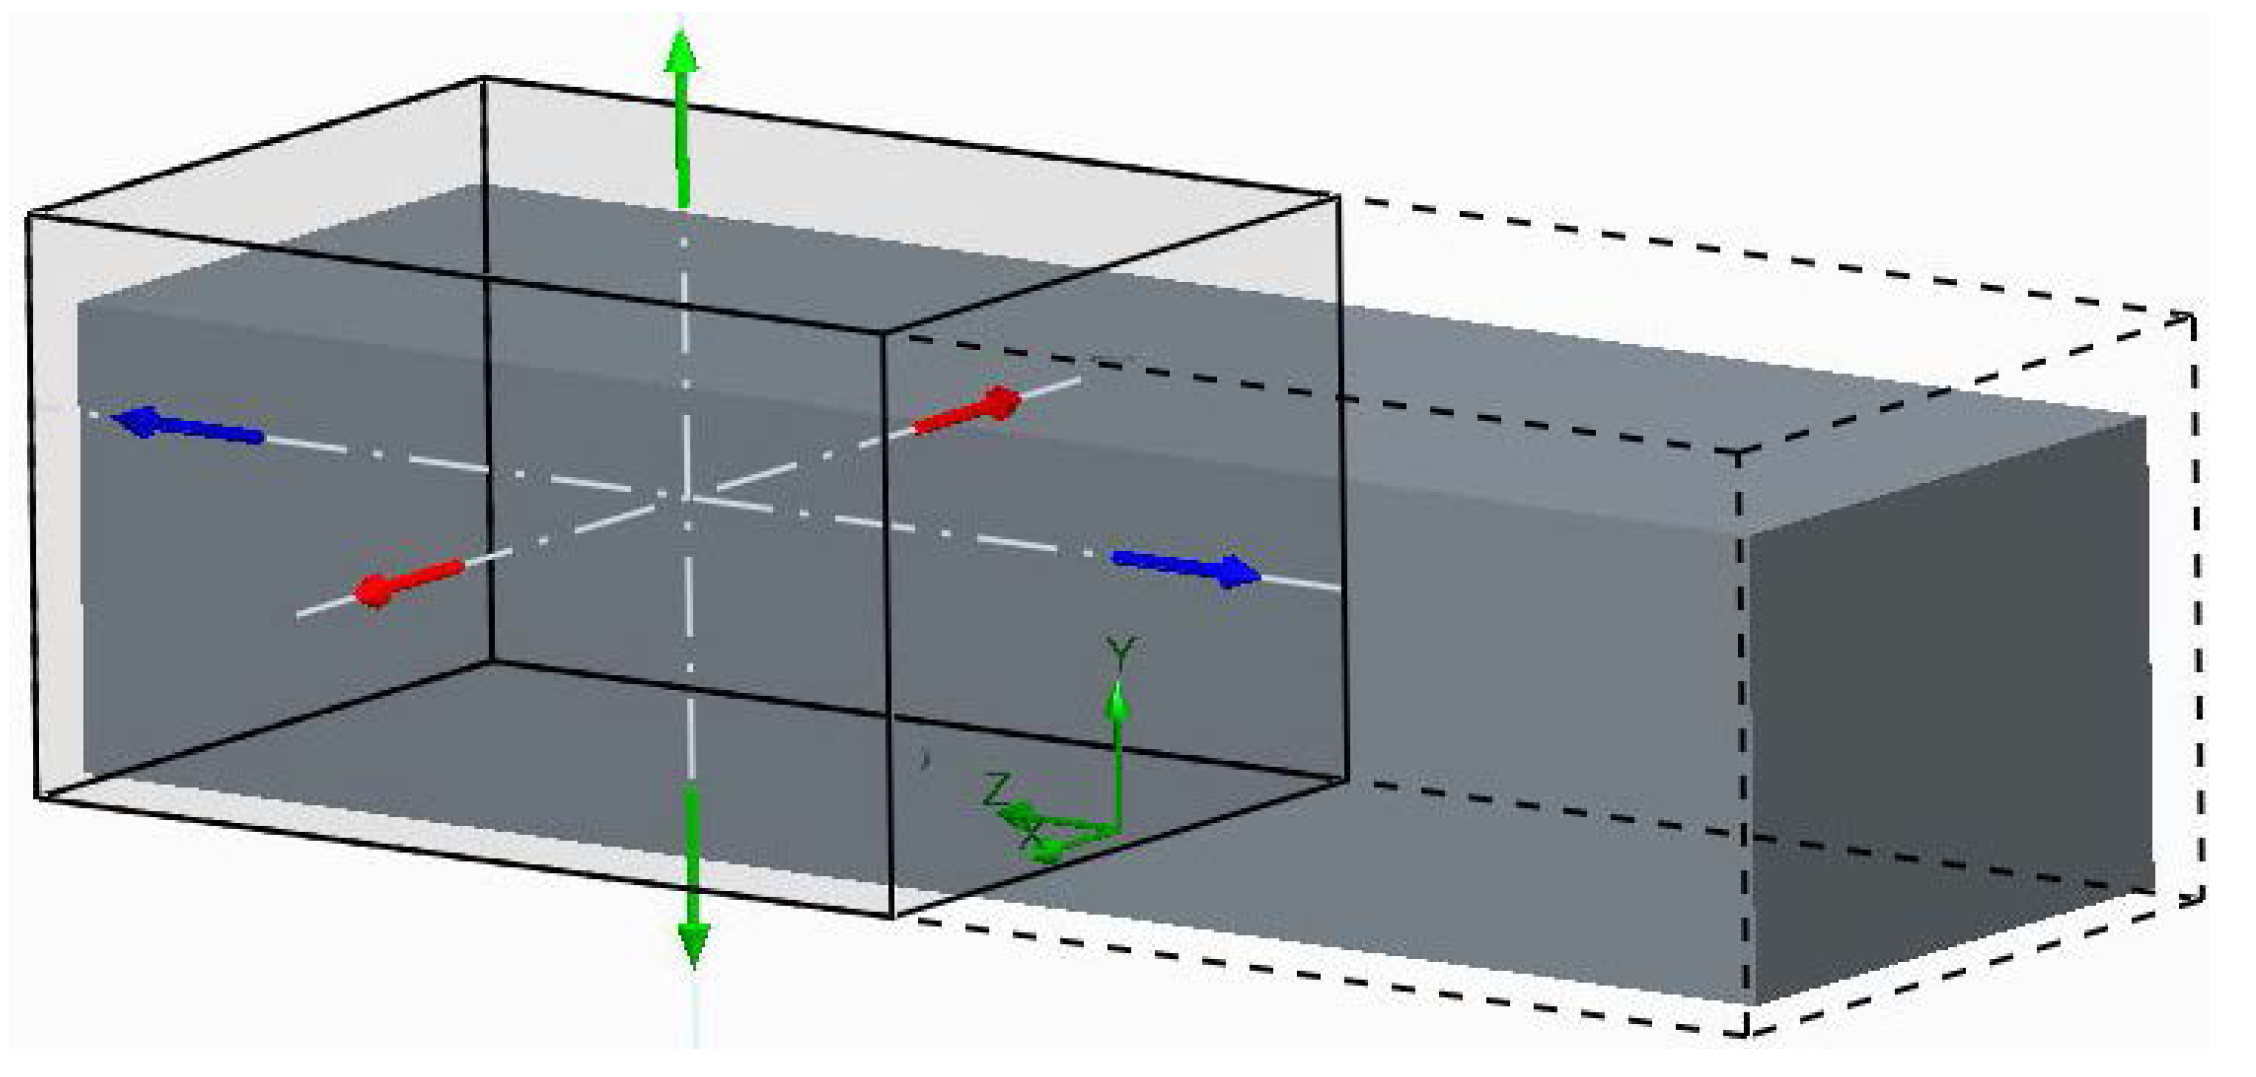
The computational domain was set to include only half of the model, so that the analysis could take advantage of symmetry, as shown in
Figure 12. This required that the X-Y plane of the domain be declared a symmetry boundary.
Figure 12.
The dumpster model in FloEFD with the computational domain (solid lines) set to encompass half the total volume. The domain boundary on the X-Y plane was designated for symmetry to reduce computation time and file sizes.
Figure 12.
The dumpster model in FloEFD with the computational domain (solid lines) set to encompass half the total volume. The domain boundary on the X-Y plane was designated for symmetry to reduce computation time and file sizes.
4. Conclusions
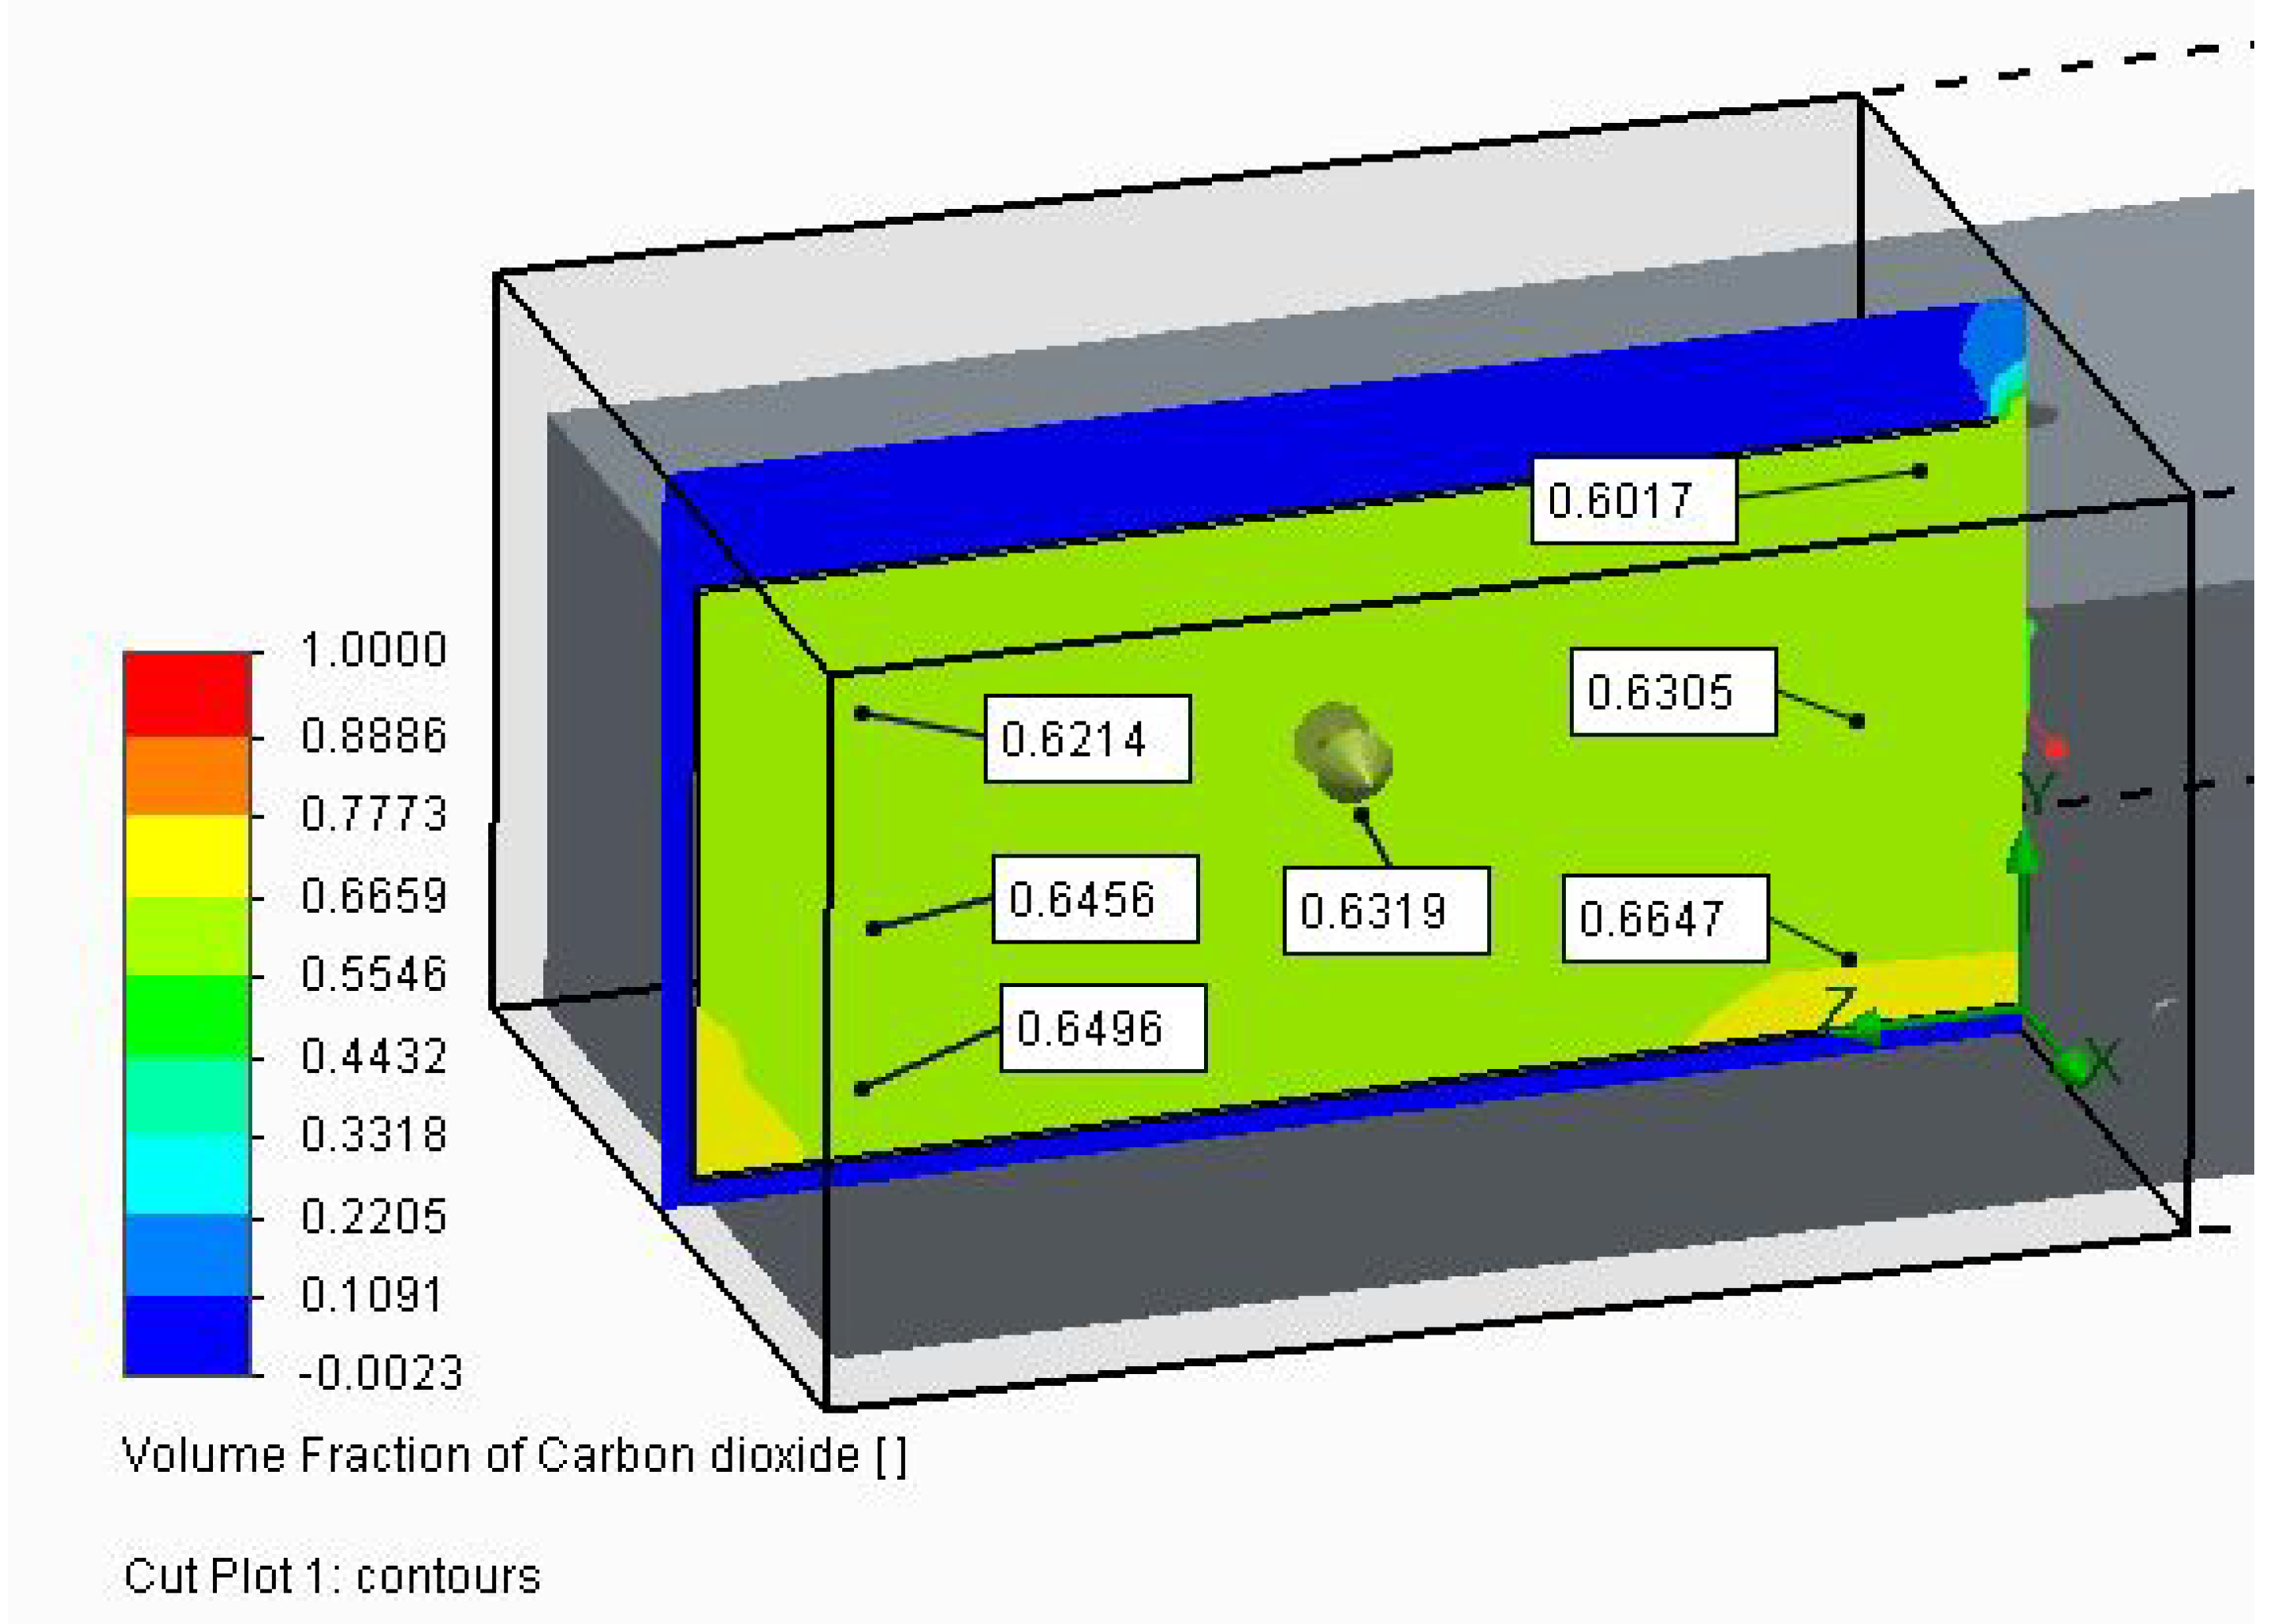
All CO
2 euthanasia chambers, whether truck bodies, dumpsters or corrals, should be sealed gas tight at the bottom, the perimeter between walls and the bottom and the sides. In addition, the top must be covered with an impermeable material, such as clear plastic polyethylene sheet, having a vent hole or a provision for some air to escape around the edges between the sides and the cover as CO
2 is pumped into the space. These results indicate that a practically uniform distribution of CO
2 gas within the chamber, particularly in the lower zone where the animal’s nostrils are likely to be, can be achieved without a plenum if the CO
2 is introduced near the floor. A large diameter inlet is preferred over a small one to minimize inlet velocity and, hence, turbulence mixing and noise. This also helps enhance stratification within the chamber, which is advantageous, since it provides for maximum gas concentration in the lower regions near the pig’s nostrils. (In a test for another study [
7], it was observed that with a rather small inlet diameter the resulting high velocities gave more mixing and, hence, less stratification). Our tests used a three-inch (7.6 cm) pipe for a CO
2 inlet volume flow rate of 150 ft
3/min (4.25 m
3/min) or an inlet velocity of about 51 ft/s (15.5 m/s).
Additionally, the flow rate demand can be minimized by using chamber dimensions with the height just great enough to allow for head room for the size of the pigs being depopulated. Excessive height results in unnecessary chamber volume and required CO2 usage. Obviously, it also results in higher CO2 flow rate demand to achieve the 20% volume flow rate/min.
If these provisions are followed, almost any type of animal containment can be used to depopulate swine efficiently, safely and humanely with CO2. Regardless of dumpster, dump truck body or temporary corral, if the above design recommendations are adhered to and the CO2 gas is pumped in near the floor at the prescribed 20% volume/min rate, the CO2 fraction will rapidly rise within 5 min to a CO2 volume fraction near 60% or greater and effectively euthanize the pigs, while providing for personnel well-being and efficiency.


