Article

Temporal Variation of SOC Enrichment from Interrill Erosion over Prolonged Rainfall Simulations

Physical Geography and Environmental Change Research Group, Department of Environmental Sciences, University of Basel, Klingelbergstrasse 27, Basel 4056, Switzerland
*
Author to whom correspondence should be addressed.
Agriculture 2013, 3(4), 726-740; https://doi.org/10.3390/agriculture3040726
Submission received: 5 July 2013 / Revised: 3 October 2013 / Accepted: 15 October 2013 / Published: 23 October 2013
(This article belongs to the Special Issue Soil Erosion: A Major Threat to Food Production and the Environment)

Abstract

:
Sediment generated by interrill erosion is commonly assumed to be enriched in soil organic carbon (SOC) compared to the source soil. However, the reported SOC enrichment ratios (ERSOC) vary widely. It is also noteworthy that most studies reported that the ERSOC is greater than unity, while conservation of mass dictates that the ERSOC of sediment must be balanced over time by a decline of SOC in the source area material. Although the effects of crusting on SOC erosion have been recognized, a systematic study on complete crust formation and interrill SOC erosion has not been conducted so far. The aim of this study was to analyze the effect of prolonged crust formation and its variability on the ERSOC of sediment. Two silty loams were simultaneously exposed to a rainfall simulation for 6 h. The ERSOC in sediment from both soils increased at first, peaked around the point when steady-state runoff was achieved and declined afterwards. The results show that crusting plays a crucial role in the ERSOC development over time and, in particular, that the conservation of mass applies to the ERSOC of sediment as a consequence of crusting. A “constant” ERSOC of sediment is therefore possibly biased, leading to an overestimation of SOC erosion. The results illustrate that the potential off-site effects of selective interrill erosion require considering the crusting effects on sediment properties in the specific context of the interaction between soil management, rainfall and erosion.

1. Introduction

Although the on-site soil loss by interrill erosion is many times smaller than that from rill erosion, it literally affects all arable land (globally, 14.2 million km2) [1]. Due to the limited raindrop kinetic energy and lack of concentrated runoff, interrill erosion is associated with selective entrainment and transport of sediment [2]. As a consequence, fine and/or light particles and associated substances (e.g., soil organic carbon, phosphorus and nitrogen) are entrained and transported away from eroding sites in greater proportions than their concentration in the source soil suggests. The eroded sediment is thus generally enriched in substances, such as soil organic carbon (SOC) [3], phosphorous [4], nitrogen [5] and clay [6], when compared to the source soil. Interrill erosion may therefore play a great role as a source of non-point pollution for rivers and lakes [7]. In addition, globally a potentially significant amount of between 0.6 to 1.3 petagram of organic carbon is affected annually by interrill erosion processes, including aggregate breakdown, crust formation, rainsplash and rainwash [1]. The susceptibility of soil organic carbon in interrill sediment to mineralization [8] also emphasizes the necessity to improve our understanding of the role of interrill erosion and the associated crust formation in interrill SOC enrichment.
The reported SOC enrichment in sediment compared to source area soil, expressed as the enrichment ratio (ERSOC), varies largely in the literature, ranging from 0.74 to 6.2 [9,10,11,12,13,14]. Discrepancies are attributed to soil properties, such as texture, aggregation, initial SOC content or initial soil moisture [15,16,17,18,19], as well as to rainfall intensities, kinetic energy, duration [20,21,22] and, finally, to diverse local micro-topography and deposition processes [9,23]. The ERSOC also varies during an erosion event as a consequence of selective erosion and crust formation [20,24,25]. While most papers report the ERSOC in sediment greater than unity, Polyakov and Lal [10], Schiettecatte et al. [12], as well as Kuhn and Armstrong [15] observed decreasing the ERSOC in sediment after certain rainfall durations. This is in accordance with the conservation of mass, which dictates that the observed enrichment of particles must be a non-steady-state phenomenon [26], particularly on the eroding site, where no repletion comes from adjunctive areas (e.g., slope shoulder). Failure to recognize this among other factors may lead to overestimating the loss of organic carbon, fine mineral particles, nutrients and other chemicals when soil is eroded by interrill processes [15,26].
The enrichment and subsequent depletion of SOC in interrill sediment is attributed to crust formation, as well as the duration of erosion [9]. Chen et al. [27] developed a three-stage conceptual model of crust formation by interrill erosion processes: at the beginning of an erosion event, the formation of a structural crust is initiated by the aggregate slaking and micro-cracking. Patches of depositional crust are formed by displaced small stable particles composed of minerals [15] or aggregates [28,29], the latter of which are often enriched in SOC. As rainfall proceeds, the loose depositional material is removed by raindrop-impacted flow, and structural crust grows, progressively covering the soil surface. Its cohesive surface reduces the erodibility of the soil surface, but also increases runoff and, thus, flow erosivity [29]. After achieving steady-state runoff, the equilibrium between crust formation and removal is achieved for the given rainfall and runoff conditions [30]. Achieving the dynamic balance between soil erodibility and runoff erosivity is thus highly likely to cause changes in the ERSOC of sediment. As long as rainfall and runoff have not produced a steady-state crust, the increasing runoff transport capacity and abundant erodible SOC-rich particles easily lead to an ERSOC of sediment greater than unity [31]. Once the crust formation has reached a steady state, the ERSOC of sediment should develop towards unity between crust and sediment, because the amount of easily erodible particles enriched in SOC has declined [15]. Apart from the few studies on declining sediment SOC cited above, the effect of crust completion on the ERSOC of sediment has not been investigated systematically. Therefore, this study aims to analyze the effect of prolonged crust formation and its variability on the ERSOC of sediment.

2. Experimental Section

2.1. Soil Samples and Preparation

Two silty loams from Möhlin (47°33’N, 7°50’E) near Basel, Switzerland, one from the conventionally managed (CS) Bäumlihof Farm and the second from the organically managed (OS) Eulenhof Farm, were used in this study. Soils of A-horizons (about 100 kg for each) from a gentle shoulder slope (<5%) were sampled in April, 2010, on each farm. Previous research conducted in the region of Möhlin showed that the silty loams used in this study have structural stability and are prone to form crusts [32]. The two soils were of almost identical texture (wet-sieving after dispersion by 1% sodium hexametaphosphate), but different in SOC content (LECO RC 612 at 550 °C), aggregate stability (method adapted from [33]) and tillage management (Table 1). In addition, SOC was not equally distributed in aggregate classes, but more concentrated in small particles (<20 μm) and macro-aggregates (>250 μm) than in other classes (Figure 1). Similar distribution, but less SOC concentration, in macro-aggregates (>250 μm) was also observed in aggregate fractions of eroded sediment [34]. Their similarity in texture, but different aggregation, was considered suitable for observing the differences in crusting and, thus, the ERSOC in eroded sediment, as well as to ensure that during the rainfall simulation, the presumed decline of the ERSOC in eroded sediment would occur. After sampling, the soils were dried at 40 °C until a constant dry weight was reached and then sieved to 1 to 8 mm. On the one hand, this resembled the seedbed conditions on the field. On the other hand, excluding over-sized clods largely reduced the variation of surface roughness, both within each flume and between replicates, ensuring the dominance of interrill erosion processes rather than the differences in initial roughness in the results.
Table 1. Texture, percentage of stable aggregates greater than 250 μm, soil organic carbon concentration (SOC) and tillage management of conventionally farmed (CS) and organically farmed (OS) silt loams. Different superscripted letters in each column indicate significant differences (t-test, p ≤ 0.05). The subscripted numbers after each average value show the standard deviation (n = 10).
Clay (%)Silt (%)Sand (%)Stable aggregates greater than 250 µm (%)SOC (mg·g−1)Tillage operationRotationFertilizer
CS16.80 a 1.3871.47 a 1.7611.50 a 1.0066.85 a 0.4710.9 a 0.05Plowing (at least once a year) and other tillage operationsMaize, rape, wheat, grassChemical fertilizer and manure
OS14.39 b 0.5275.84 b 0.569.77 b 0.3877.76 b 1.8716.9 b 0.10Non-plowing, harrowingPumpkin, carrot, salad, pea, beanSheep manure, horn shavings
Figure 1. Distribution of soil organic carbon concentration in aggregate size classes of conventionally farmed (CS) and organically farmed (OS) silt loams. Aggregates were fractionated by settling velocities following the method described in [35]. Error bars indicate the minimum and maximum values observed during three replicate measurements.
Agriculture 03 00726 g001
Dry soils were placed in a round flume (Figure 2a) with an outside diameter of 50 cm and a center opening of 10 cm (Figure 2b). These flumes were designed to limit the effect of increasing flow depth on interrill erosion, as well as to ensure a sufficiently large area to generate sediment for sampling and further analysis. To assist drainage, the floor of the flume was perforated, covered by a fine cloth and a layer of sand (~2 cm). The soils were placed on the sand and molded into a straight slope of 10% between the outer and inner rim. Preliminary tests had shown that achieving a complete crust, indicated by constant runoff rates, required more rainfall than could be feasibly applied during one day. Therefore, a 30 min rainfall corresponding in intensity to the one used for the actual test (described below) was applied one day prior to the simulation event. This short pre-wetting, on the one hand, enabled the observation of the effects of aggregate breakdown during the crusting process; on the other, an initial crusting and soil settling was induced, which facilitated faster runoff development during the actual test.
Figure 2. Conventionally-farmed soil (CS) and organically-farmed soil (OS) in round flumes were simultaneously subjected to rainfall simulation. (a) A round flume filled with soils; (b) the cross-section profile of the round flume; (c) the layout of the rainfall simulation experiment. The white containers were used to monitor the rainfall intensity.
Agriculture 03 00726 g002

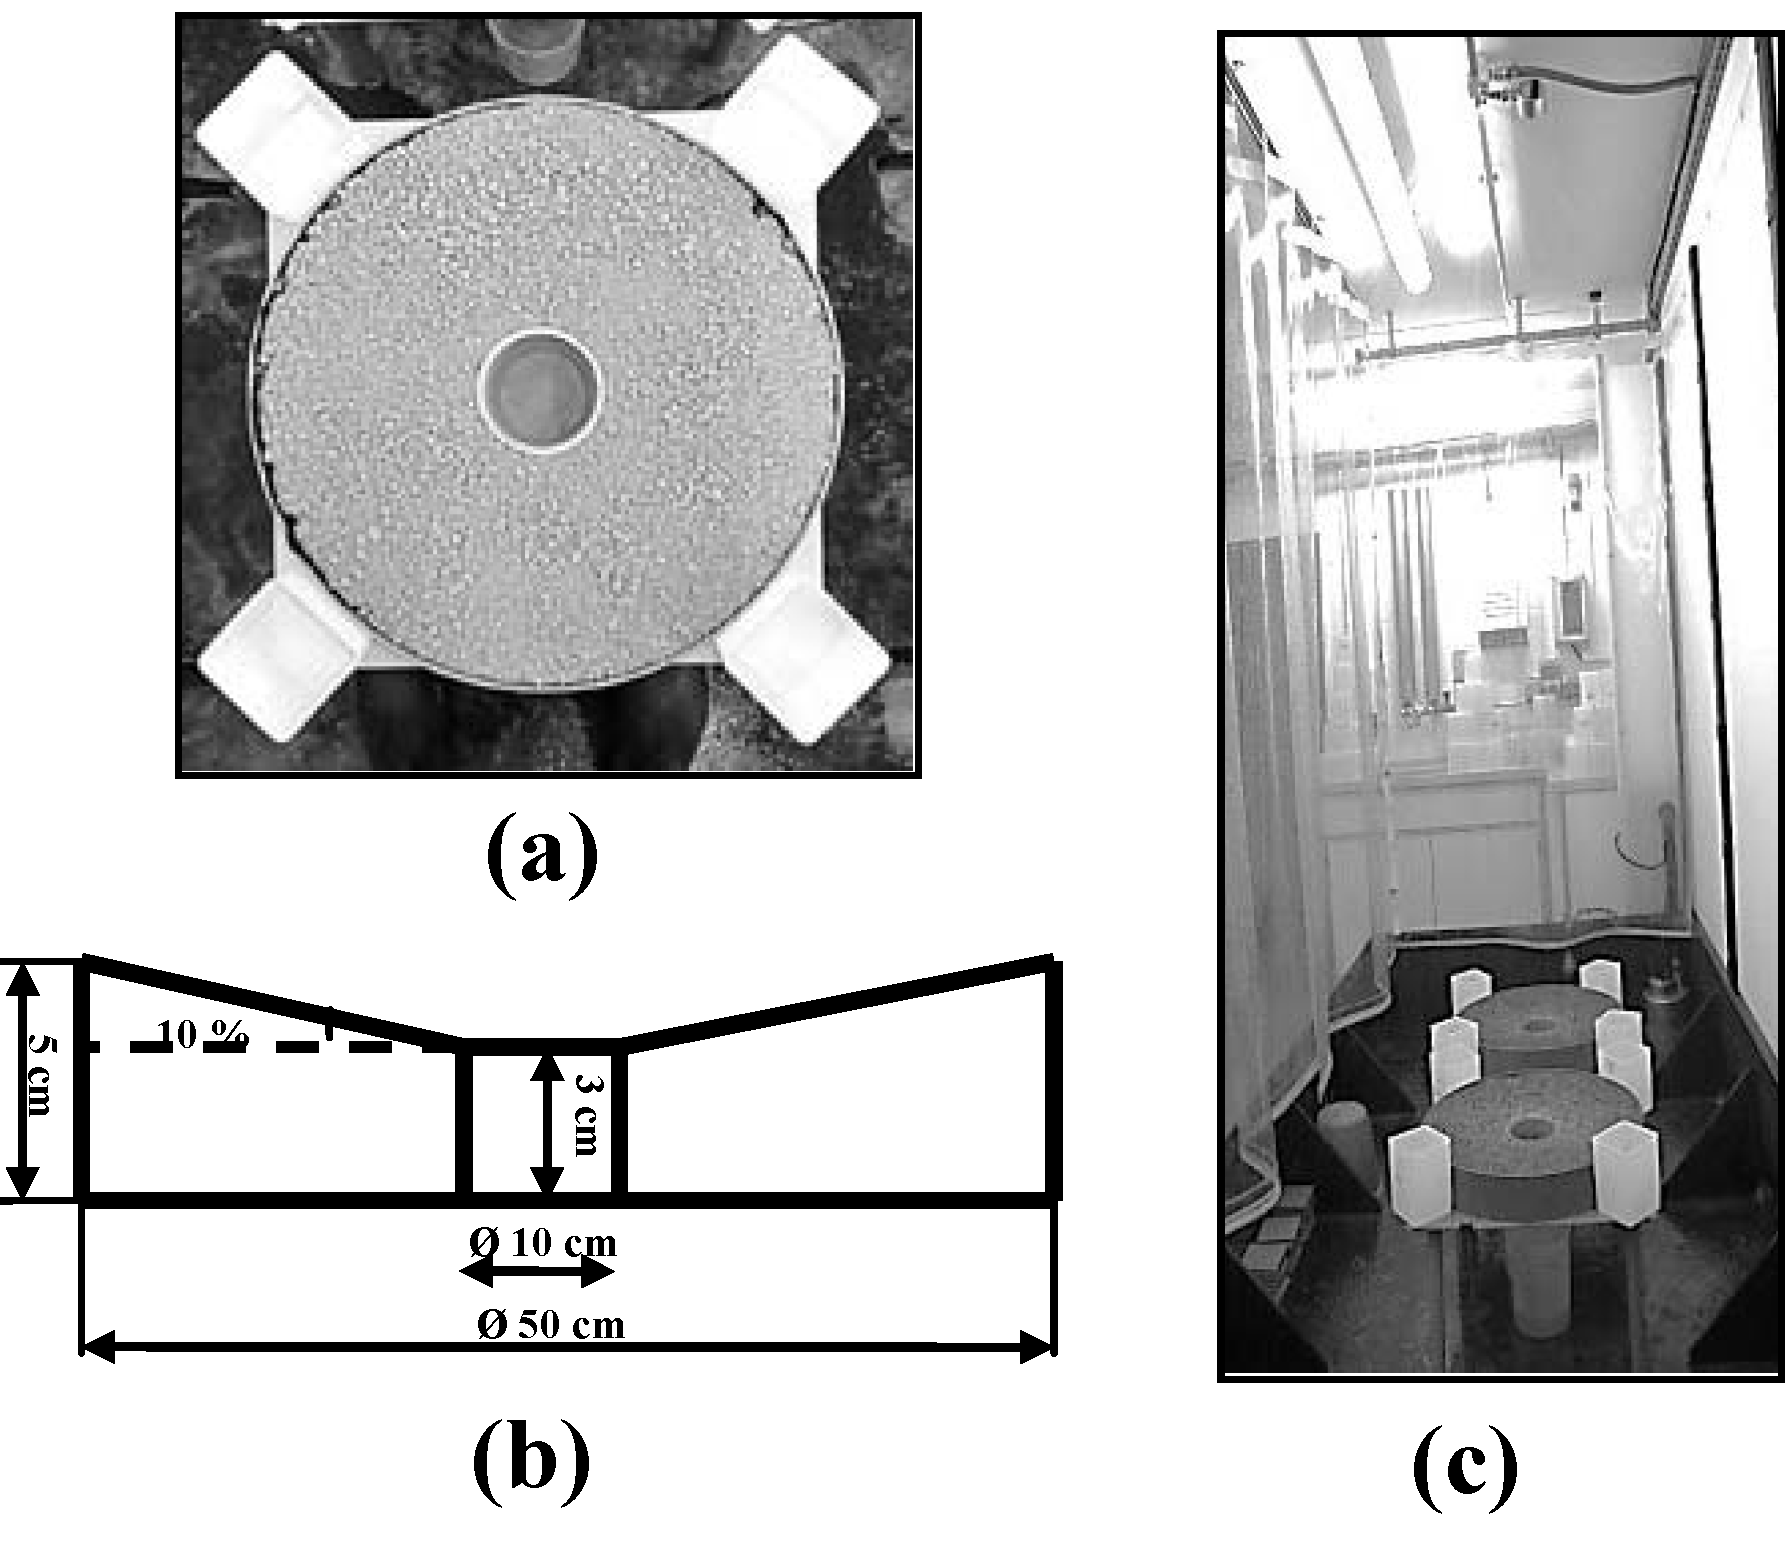
2.2. Rainfall Simulation

Two flumes, one of each filled with CS and OS, were exposed to a rainfall of 30 mm·h−1 for 6 h simultaneously (180 mm of rain in total) (Figure 2c). An event of precipitation of 180 mm is not a frequent phenomenon in the Basel region. The monthly precipitation during April, May and June (corresponding to periods with bare soil after tillage) varied widely over the past three decades, ranging from 6 to 241 mm [36]. Preliminary tests and field observations had shown that the two silty loams used in this study required between 90 and 120 mm of rainfall (i.e., 180 and 240 min) to complete crust formation, and roughly 180 mm rainfall (i.e., 360 min) to develop the presumed decreasing SOC erosion rates [32]. The return frequency of such monthly rainfall is 0.65 years for 90 mm, 1 year for 120 mm and 7 years for 180 mm. The selected rainfall therefore suited the objective of this study of observing the effect of prolonged crust formation on the ERSOC using rainfall intensity and kinetic energy, as well as an amount that can be experienced by the soil in the Basel region. This therefore leads to a quasi-natural sequence of crust formation, except for the effect of drying between rainfall events. Drying is likely to rejuvenate the granular structure of the crust [18]; however, the effects of drying on the ERSOC are unknown. Ignoring the drying effect does not limit the objective of this study, which aimed to test the sensitivity of the ERSOC to crust formation in principle.
A FullJet nozzle (¼ HH14WSQ), installed 2 m above the soil surface, was used to generate multiple-sized raindrops (D50 of 2.3 mm). The kinetic energy of the raindrops was detected by a Joss-Waldvogel-Disdrometer (average energy of 113.9 J·m−2·h−1). Tap water was used for each rainfall. The electric conductivity of the tap water was 2220 µs·cm−1, which was five times higher than the rainwater in Basel (462 µs·cm−1). In general, the increased electric conductivity of the tap water enhances dispersion during rainfall simulation tests [37]. A comparative aggregate stability test (Wet Sieving Apparatus, Eijkelkamp, Netherlands) using tap water and rainwater from Basel had shown that tap water had only a minor effect on aggregates greater than 250 µm after 20 min of continuous oscillating movement (67.24% in rainwater and 73.59% in tap water for CS, while 70.60% and 68.84% for OS). Therefore, the use of tap water was considered acceptable. During the simulation event, runoff and sediment were sampled in intervals of 30 min, and all runoff and sediment generated during the interval were collected. Sampling at intervals of 30 min produced enough runoff and sediment for further analysis and still enabled us to record the temporal changes of the erosional response. In addition, no supplement was applied to replenish the on-site soil and SOC loss, which although unlike natural conditions (i.e., with vegetation, litter input or upland deposition), served our purposes well for observing the potential of the ERSOC varying against time. The rainfall simulation tests were repeated 10 times for each soil (two pairs of flumes used 5 times) to generate a dataset that would enable the statistical analysis of the variability of the erosional response.

2.3. Soil and Sediment Analysis

The runoff samples were weighed immediately after collection to acquire the amount of discharge. Sediment transported by splash was not considered relevant in this study, since a preliminary test revealed that its effect was negligible to merit carrying out further measurements. After the simulation events, sediment in all runoff samples was allowed to settle for more than 48 h. The supernatant was then decanted off, and the sediment was dried at 40 °C and weighed. Surface roughness was used as an index of crust formation. Twenty-centimeter transects from the outside rim to the center of the flume were scanned stepwise at a 1 mm resolution by a laser scanner before and after each rainfall simulation. The scanner was controlled by the Stepper Motor Controller CSD 315 (Isel Automation, Germany) and programmed using MatLab 2007. The surface relative roughness was expressed as the standard deviation of the differences between the actual height of the individual point and its theoretical height along a straight slope. The flumes were also dried at 40 °C until constant dry weight was obtained. Loose aggregates left on the dry soil surface were swept and collected by a vacuum pump. A 1–2 mm layer of dry crust was carefully scratched off the soil surface. The thickness of the crust, as a secondary source of confirmatory information, was measured using a ruler. Soils below the crusts were also collected for each replication, for use as a reference for the original soils. The soil organic carbon concentration of the original soils, eroded sediment, loose aggregates on the surface and crusts were measured by LECO RC 612 at 550 °C. Enrichment ratios were calculated between the SOC concentration of the eroded sediment and the original soil, between the crust and the original soil and between the soils below the crust and the original soil. The grain size distributions of sediments and crusts were measured with a Mastersizer 2000 (Malvern, Germany) after dispersion with 4 mL of sodium hexametaphosphate and ultrasound at 9 J·mL−1 (i.e., energy = output power 30 W × time 300 s/suspension volume 1000 mL). Statistical analyses were calculated using Microsoft Excel 2010 and SPSS.

3. Results

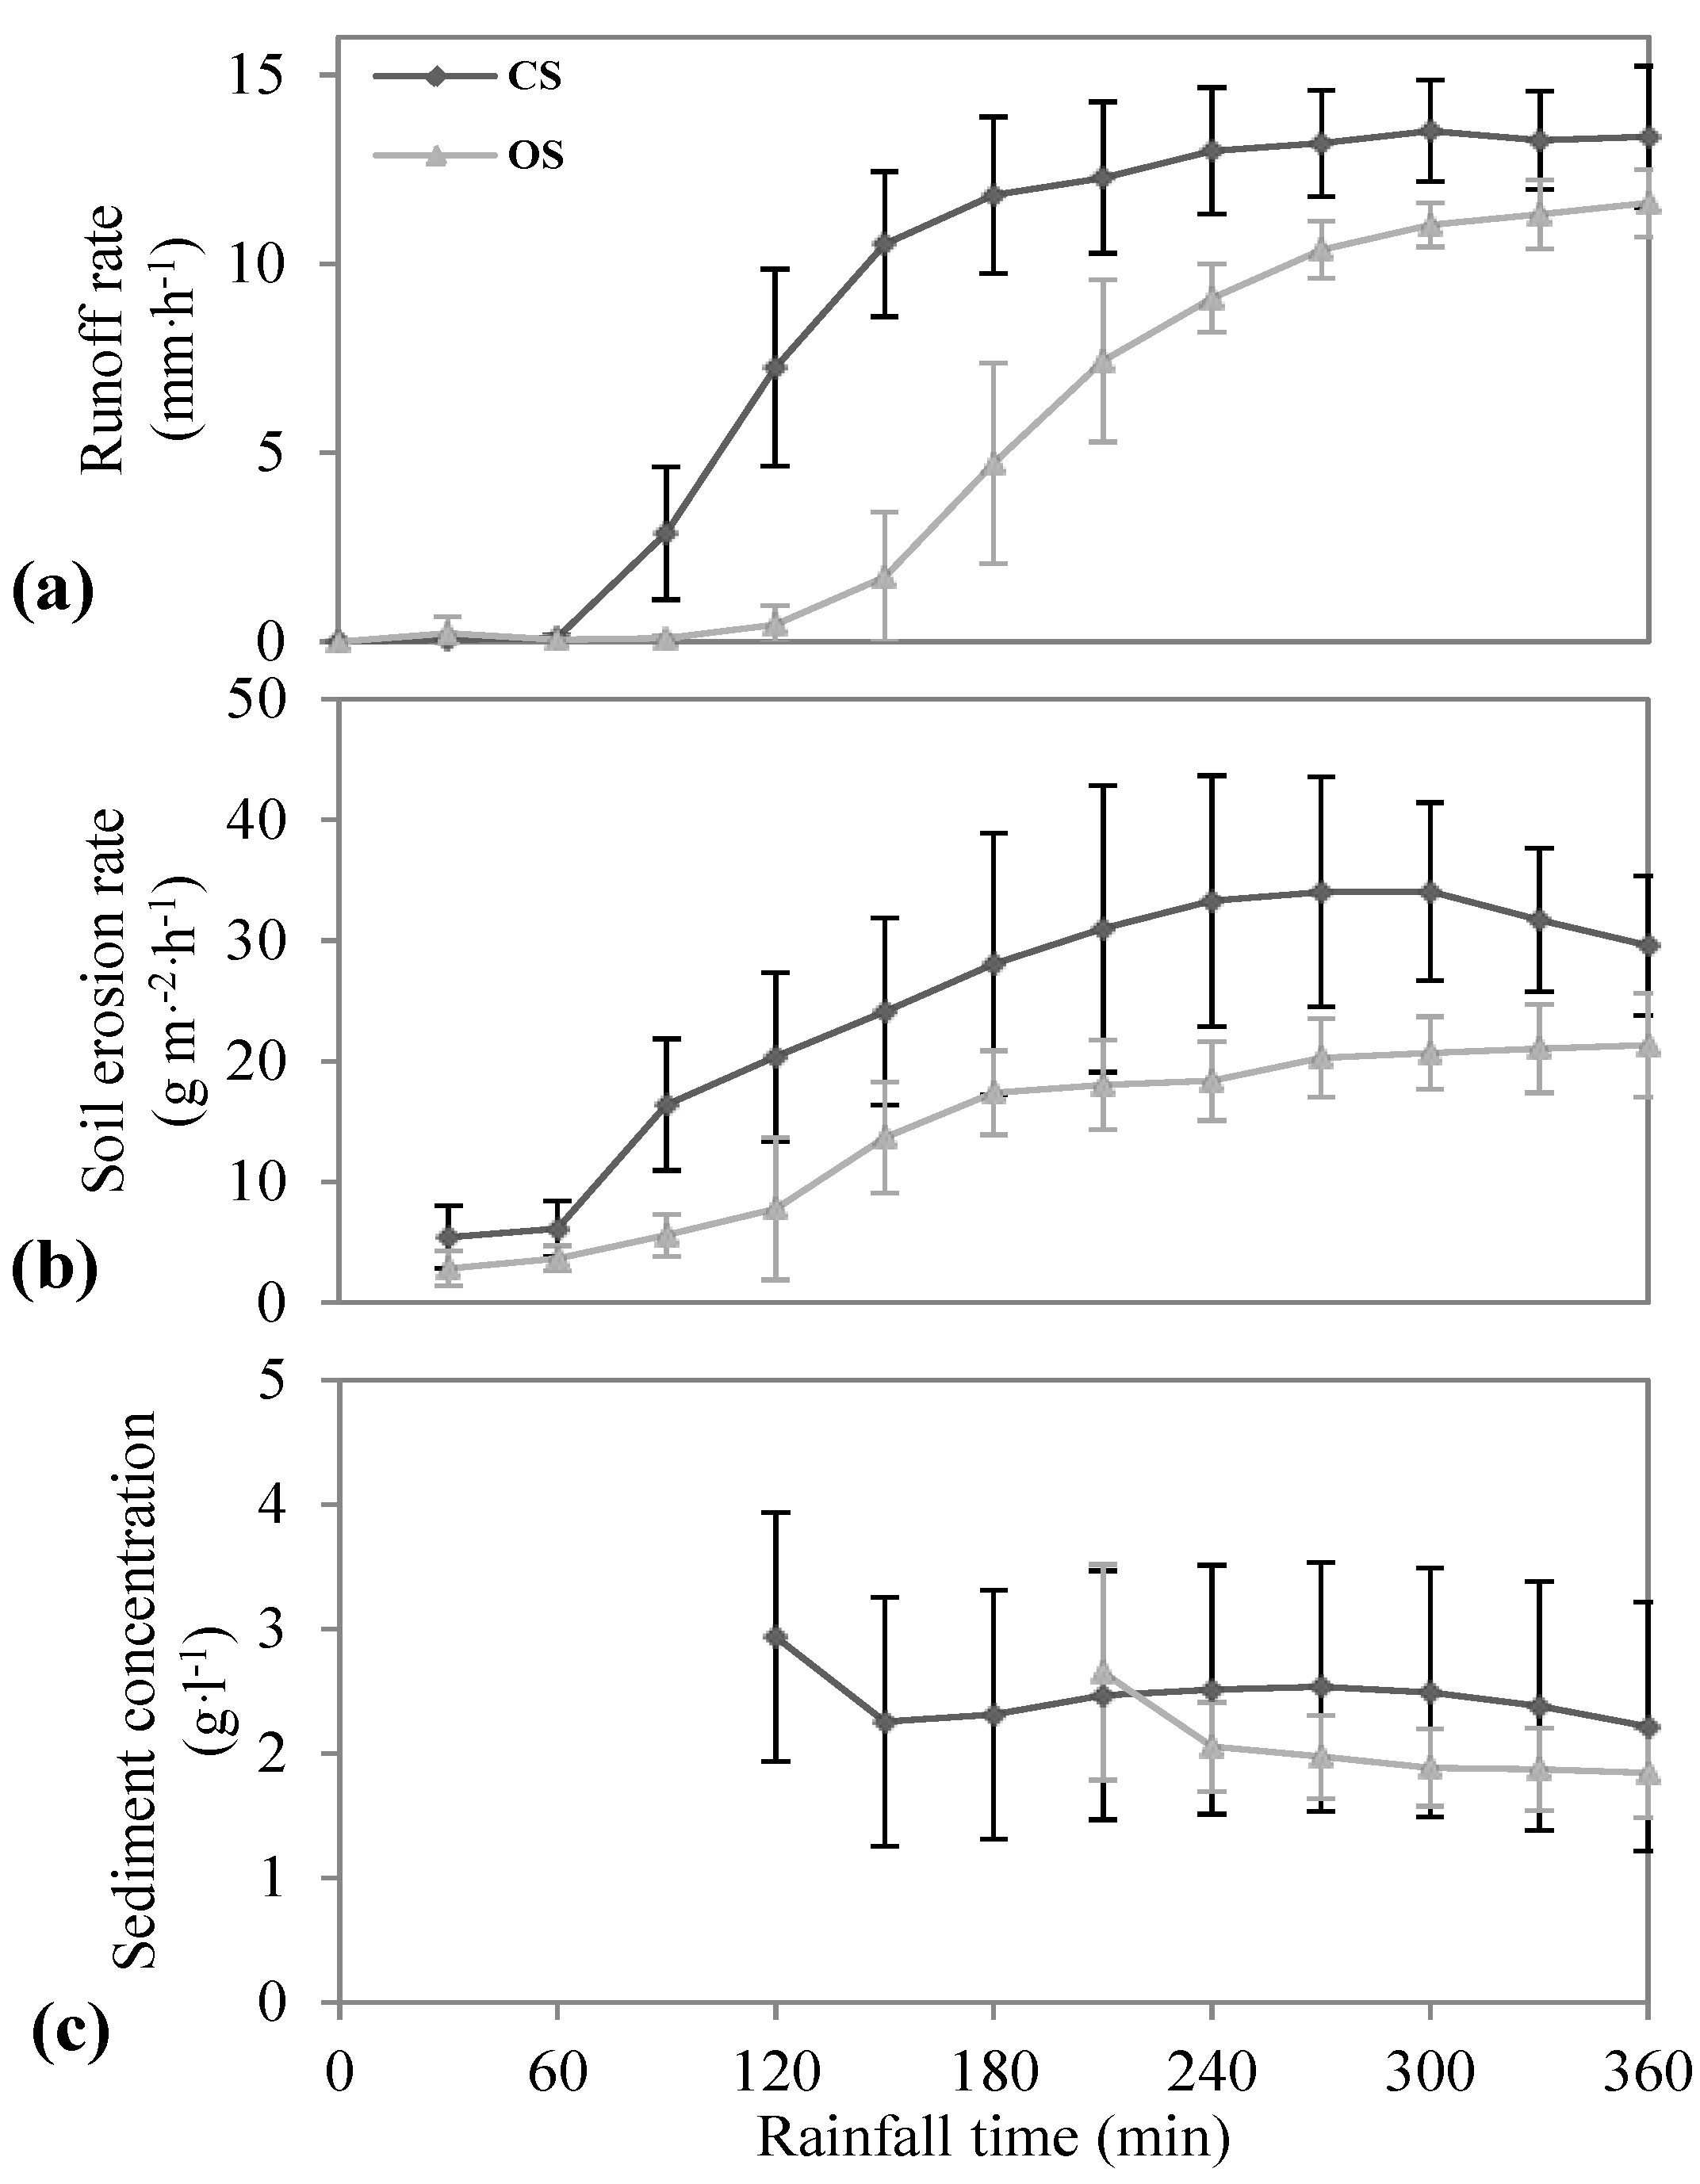
3.1. Erosional Response during Rainfall Time

Both CS and OS showed a similar temporal pattern of runoff and erosion (Figure 3). However, CS responded more rapidly and was significantly more pronounced than OS (t-test, p ≤ 0.05). The runoff of CS started after 60 min and kept increasing until a steady state was achieved at 180 min (Figure 3a), indicating the completion of structural crust formation [27,30]. The runoff on OS started 60 min later than for CS and reached a steady state after 240 min of rainfall, but with a relatively lower runoff rate than CS (Figure 3a). By the end of the six hour rainfall simulation, the runoff coefficients of CS and OS were, on average, 29.4% and 18.1%. Soil erosion from CS was also higher than from OS. The temporal pattern of soil erosion rates for both soils corresponded with their runoff rates (Figure 3b). The slight decline of soil erosion rates on CS implies the depletion of erodible materials. The sediment concentration of CS and OS roughly stayed constant after the runoff reached steady-state conditions (Figure 3c). Due to the limited amount of soil erosion at the beginning of the tests, the sediment concentration could not be calculated accurately and is therefore not shown here. The inter-replicate variations of runoff and soil erosion rates (indicated by the error bars in Figure 3a, b and the standard deviation in Table 2) were between 10% and 38% after reaching runoff steady state. This is mostly due to the unavoidable inherent variability of the erosion process [38,39]. However, the temporal patterns of runoff, soil erosion rates and the ERSOC of each replicate corresponded with each other (detailed data shown in [40]). Meanwhile, the erosional response for CS significantly differed from that for OS in almost all the cases (Table 2). The erosion data observed in our study is, therefore, considered capable of drawing representative conclusions on the effect of crusting on the ERSOC. Detailed erosional responses during the 360-min rainfall simulation are summarized in Table 2.
Figure 3. Development of (a) runoff rate, (b) soil erosion rate and (c) sediment concentration of conventionally-farmed soil (CS) and organically-farmed soil (OS) over 360 min of rainfall time. Error bars indicate the standard deviation. n = 10.
Agriculture 03 00726 g003
Table 2. Summary of the erosional responses of conventionally-farmed soil (CS) and organically-farmed soil (OS) over 360 min of rainfall time (an average of 10 replicates). The erosion area is 1884.96 cm2. Different superscripted letters in each column indicate the significant differences (t-test, p ≤ 0.05). The subscripted numbers after each average value show the standard deviation. n = 10.
SoilSteady state Total runoff (mm)Runoff coefficient (%)Total soil erosion (g)Soil concentration in runoff (mg·mm−1)Total SOC erosion (mg)SOC concentration in runoff (mg·mm−1)
Time (min)Runoff rate (mm·h−1 )Erosion rate (g·m−2·h−1)Sediment concentration (g·L−1)
CS18012.9 a ± 0.231.7 a ± 2.52.4 a ± 0.255.6 a ± 9.129.4 a ± 5.027.4 a ± 7.6484.7 a ± 69.1369.1 a ± 85.16.6 a ± 0.6
OS24010.7 b ± 0.220.3 b ± 0.51.9 b ± 0.0234.1 b ± 6.018.1 b ± 3.016.1 b ± 3.0476.1 a ± 57.7326.0 a ± 59.19.6 b ± 1.0

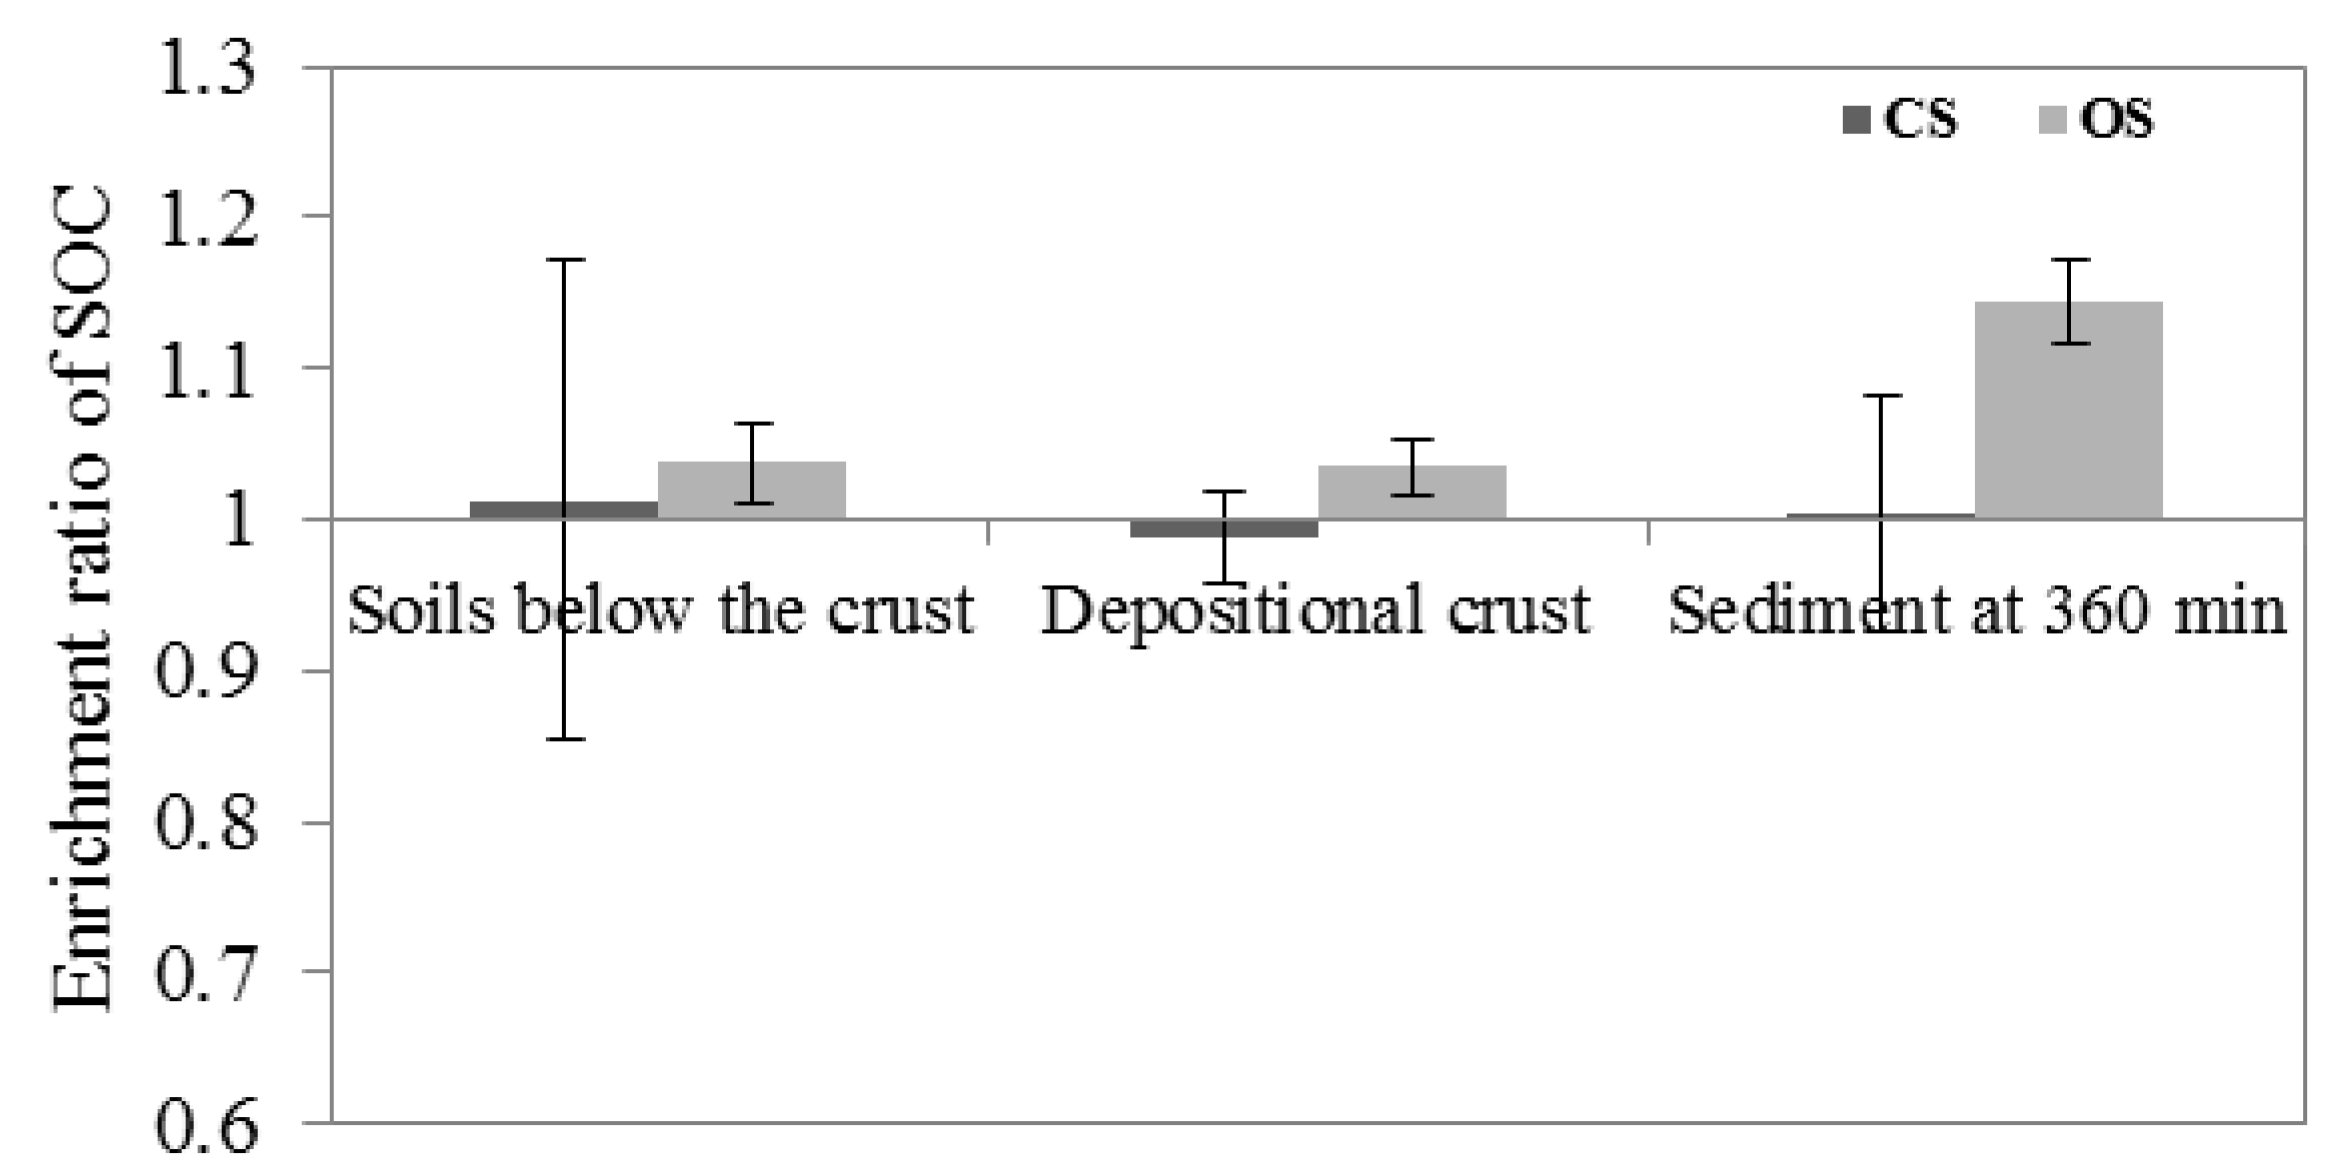
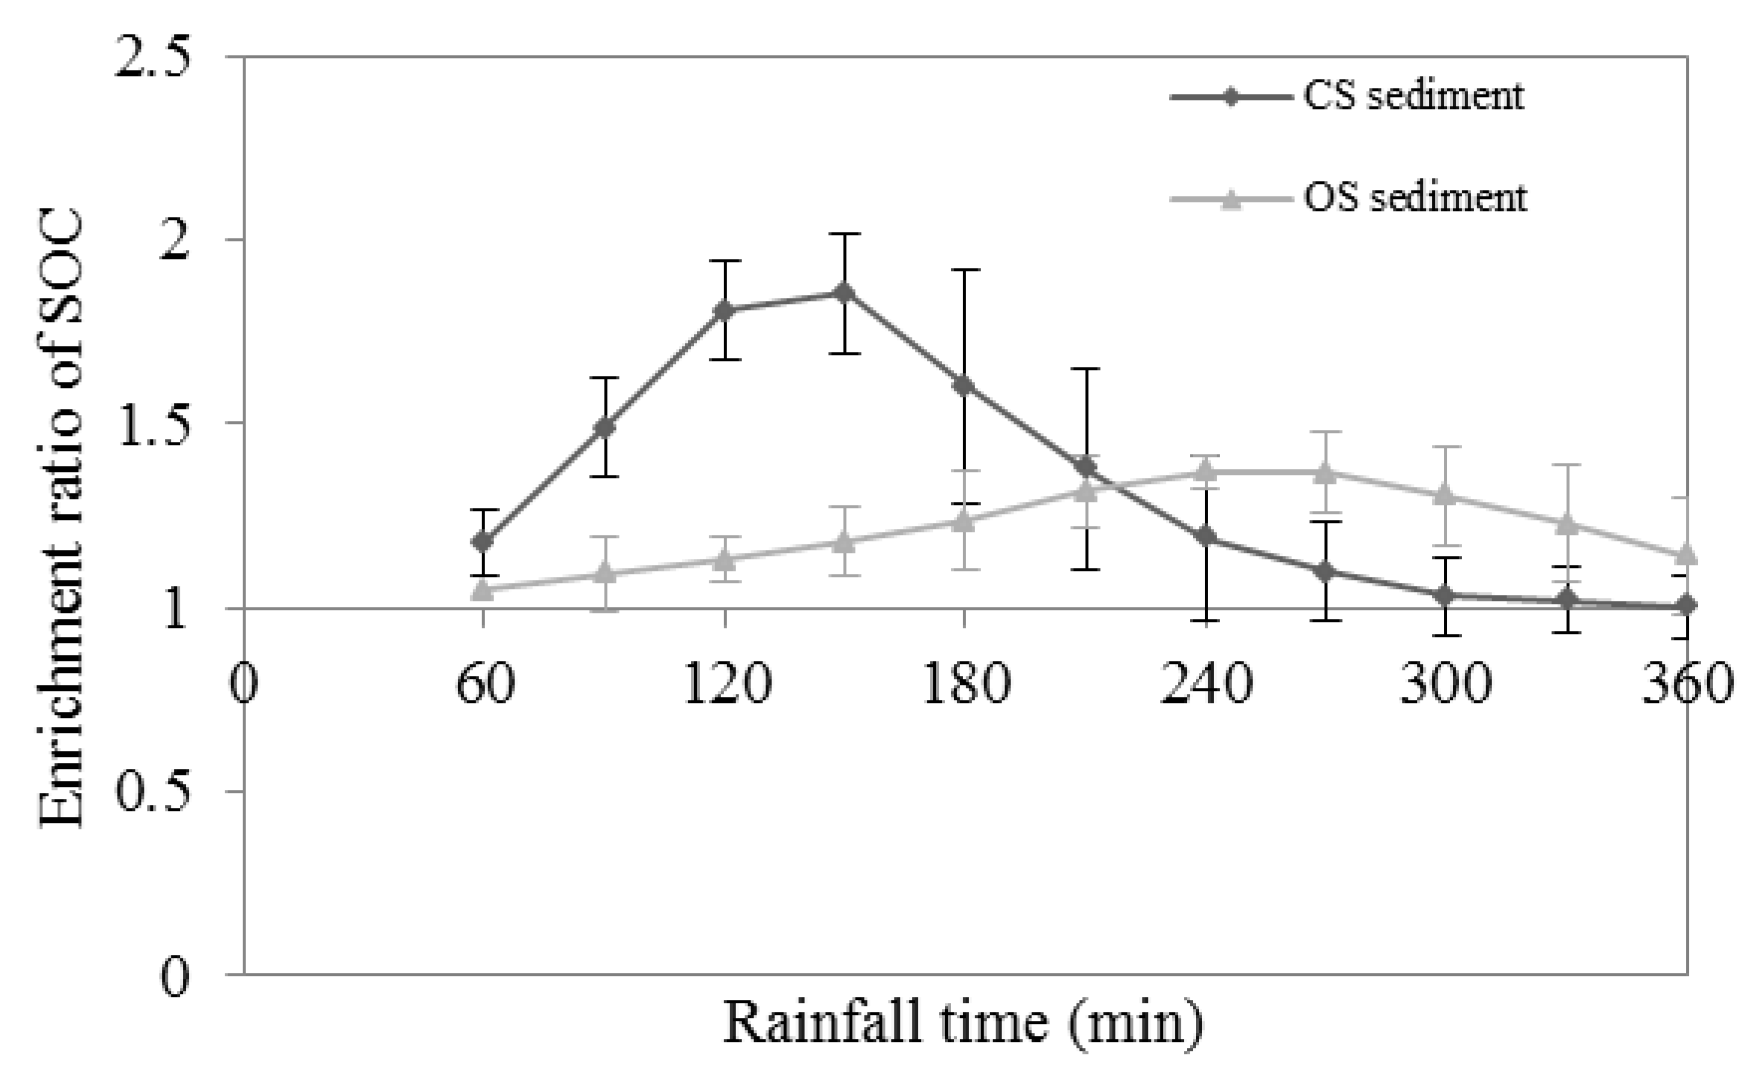
3.2. Temporal Variation of ERSOC in Sediment during Rainfall Time

The ERSOC in sediment changed for both CS and OS during the simulated rainfall (Figure 4). On both soils, the ERSOC in sediment initially increased, peaked around the time when steady-state runoff was achieved and, thereafter, declined. The maximum ERSOC in CS sediment was 1.86 and occurred between 120 and 150 min, while the peak ERSOC of OS sediment was only 1.37 and occurred around 240 to 270 min. At the end of the simulated rainfall, the CS ERSOC of seven out of ten replicates approached unity. Enrichment of SOC in sediment <1 compared to the original source soil was observed for the remaining three replicates. Overall, the total amount of eroded SOC was 369.1 mg for CS and 326.0 mg for OS, which were not significantly different from each other (t-test, p > 0.05, n = 10). Detailed data on the SOC erosion are shown in Table 2.
Figure 4. Development of the enrichment ratio for soil organic carbon (ERSOC) in eroded sediment from a conventionally-farmed soil (CS) and organically-farmed soil (OS) over 360 min of rainfall time. Error bars indicate the standard deviation. n = 10.
Agriculture 03 00726 g004

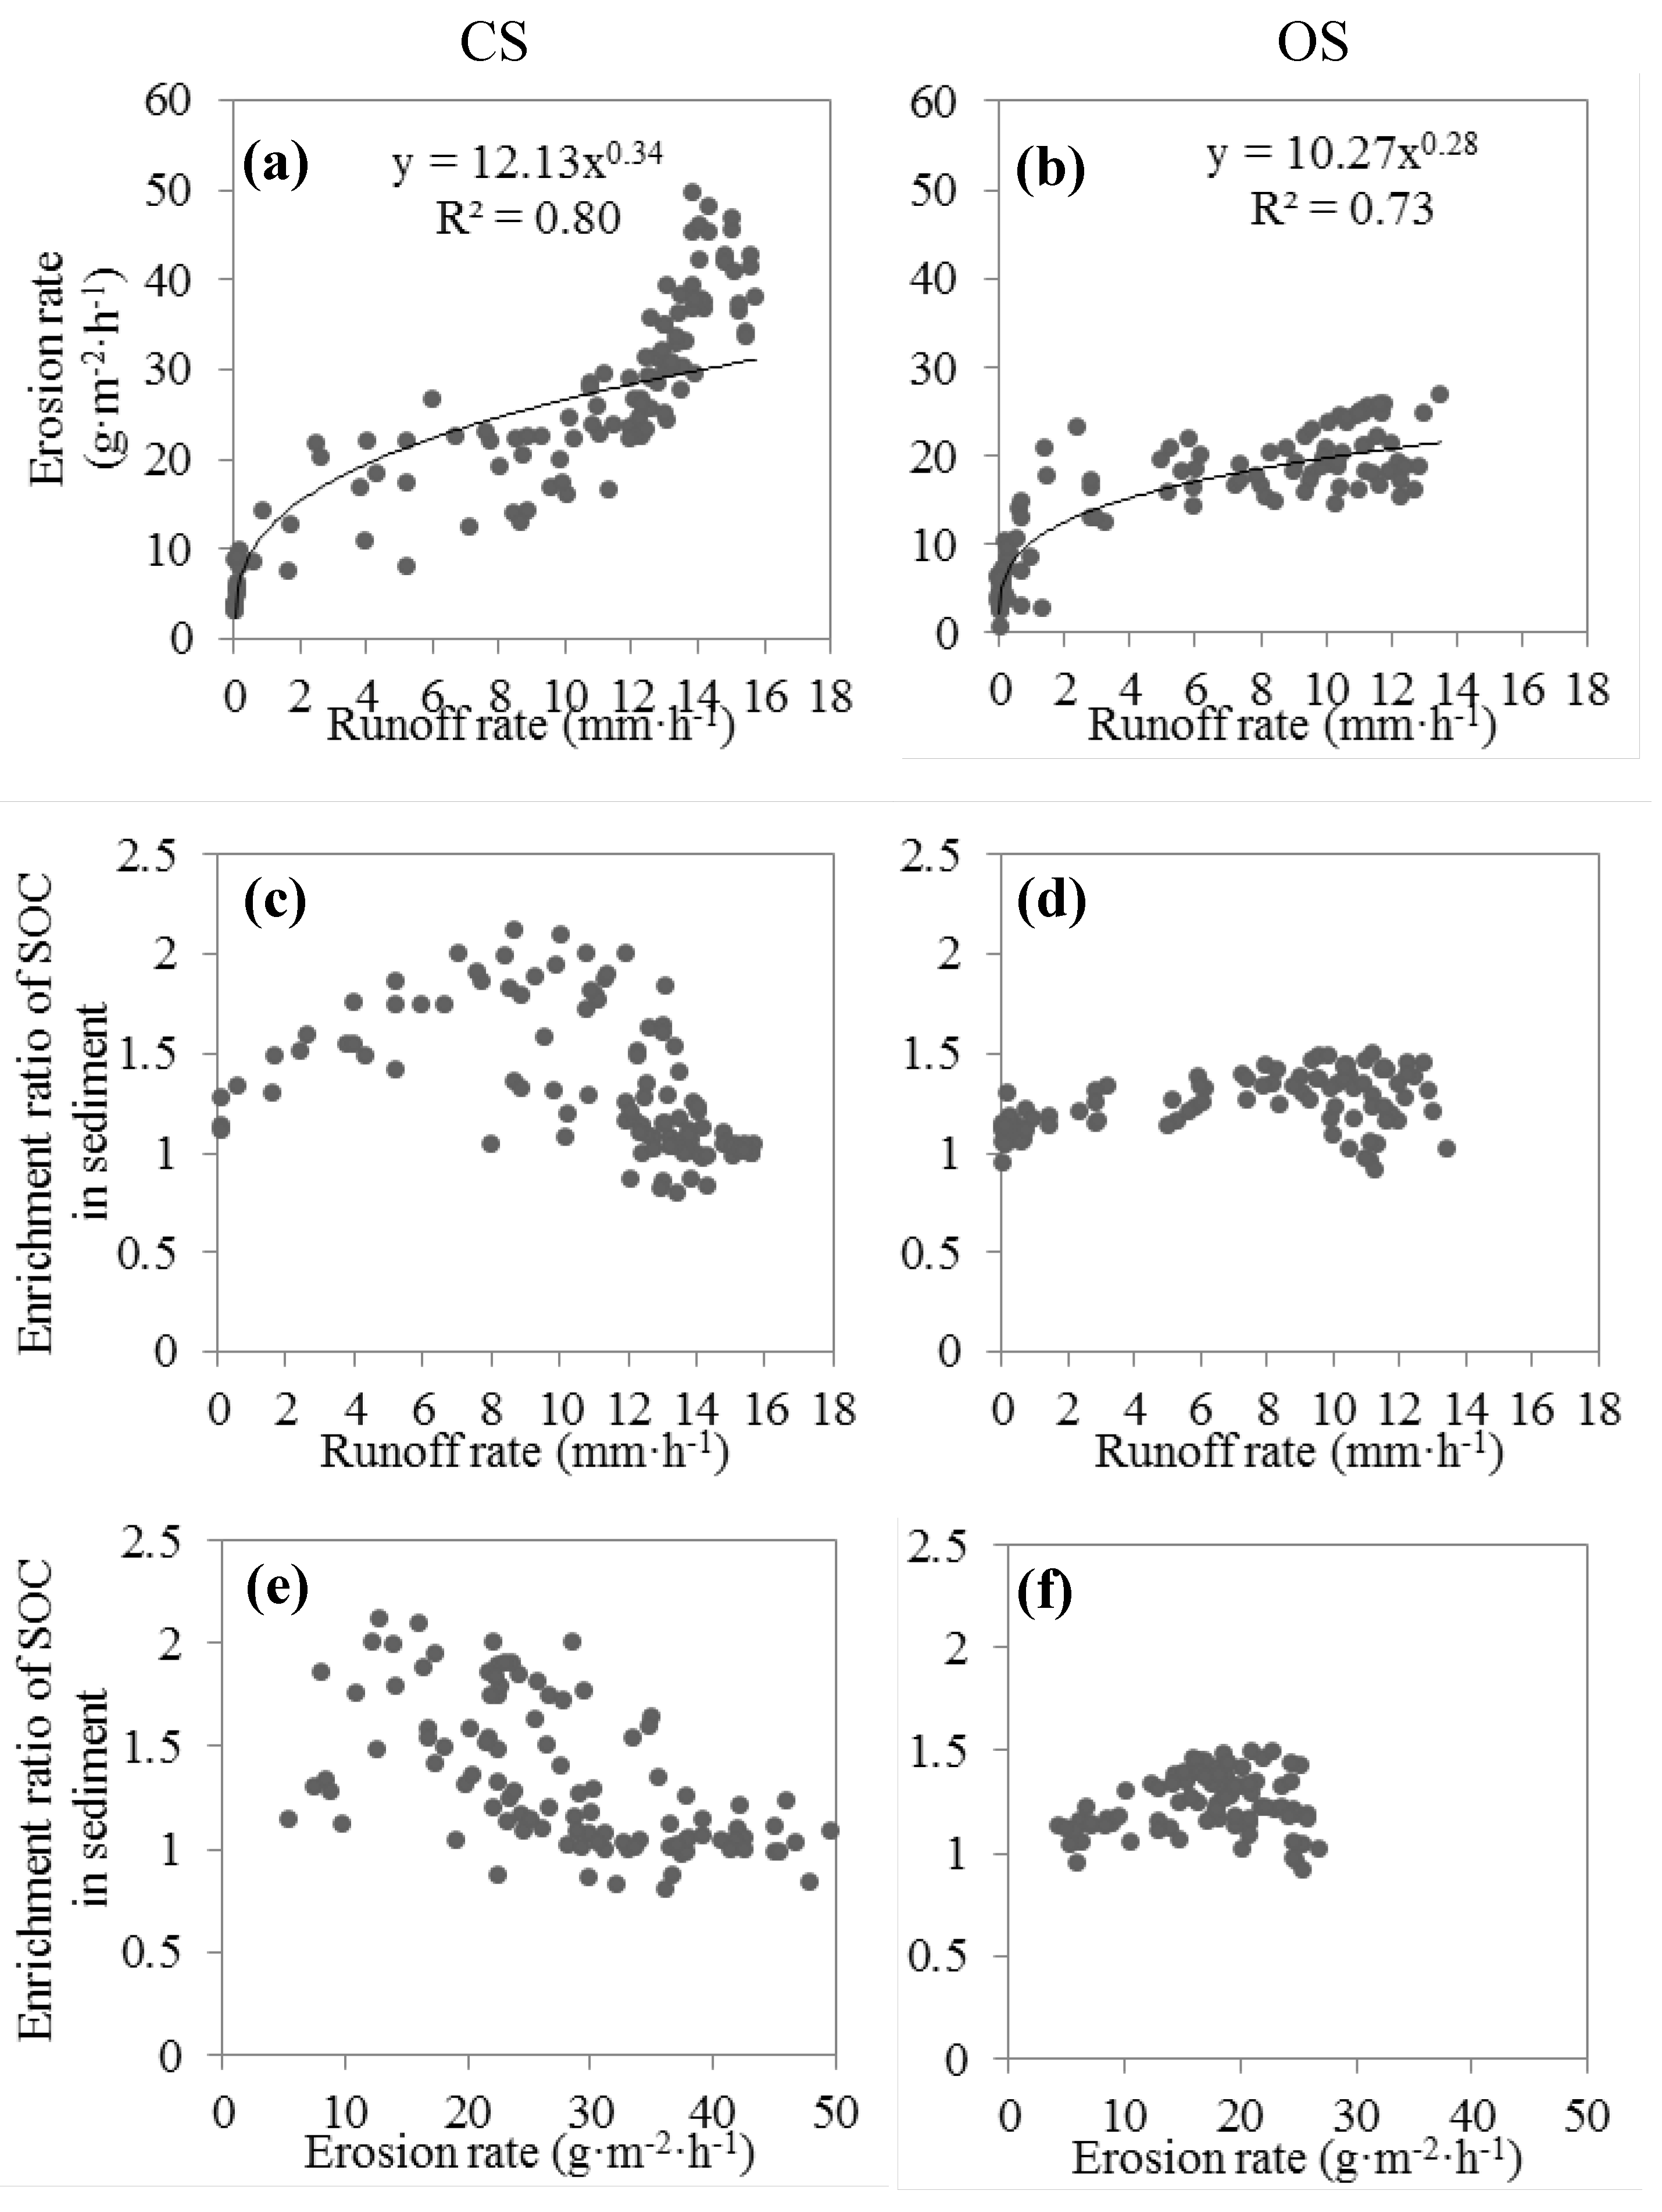
3.3. Interrill Erosional Response and SOC Erosion

The relationship between runoff and soil erosion rates differed noticeably for CS and OS (Figure 5a,b): soil erosion rates for the CS increased rapidly from 20 to 50 g·m−2·h−1 after runoff rates exceeded 10 mm·h−1, while the soil erosions rate for OS stabilized around 20 g·m−2·h−1 for runoff rates ranging from two to 14 mm·h−1. The power regression between runoff and soil erosion rate also showed that CS was more sensitive to runoff erosivity (exponent 0.34 versus 0.28) and soil erodibility (constant factor 12.12 versus 10.27) than OS (Figure 5a,b). In addition, the constant relationship for OS and the cloud above the tail of the power regression line of the CS imply that the erosion was non-selective at great runoff rates (Figure 5a). There was no consistent relationship between the ERSOC of sediment and runoff rate or erosion rate for either soil (Figure 5c–f), indicating that there must be some other factors (e.g., duration or stage of crust formation [9,15]) affecting the ERSOC of sediment other than just the runoff erosivity or soil erodibility.

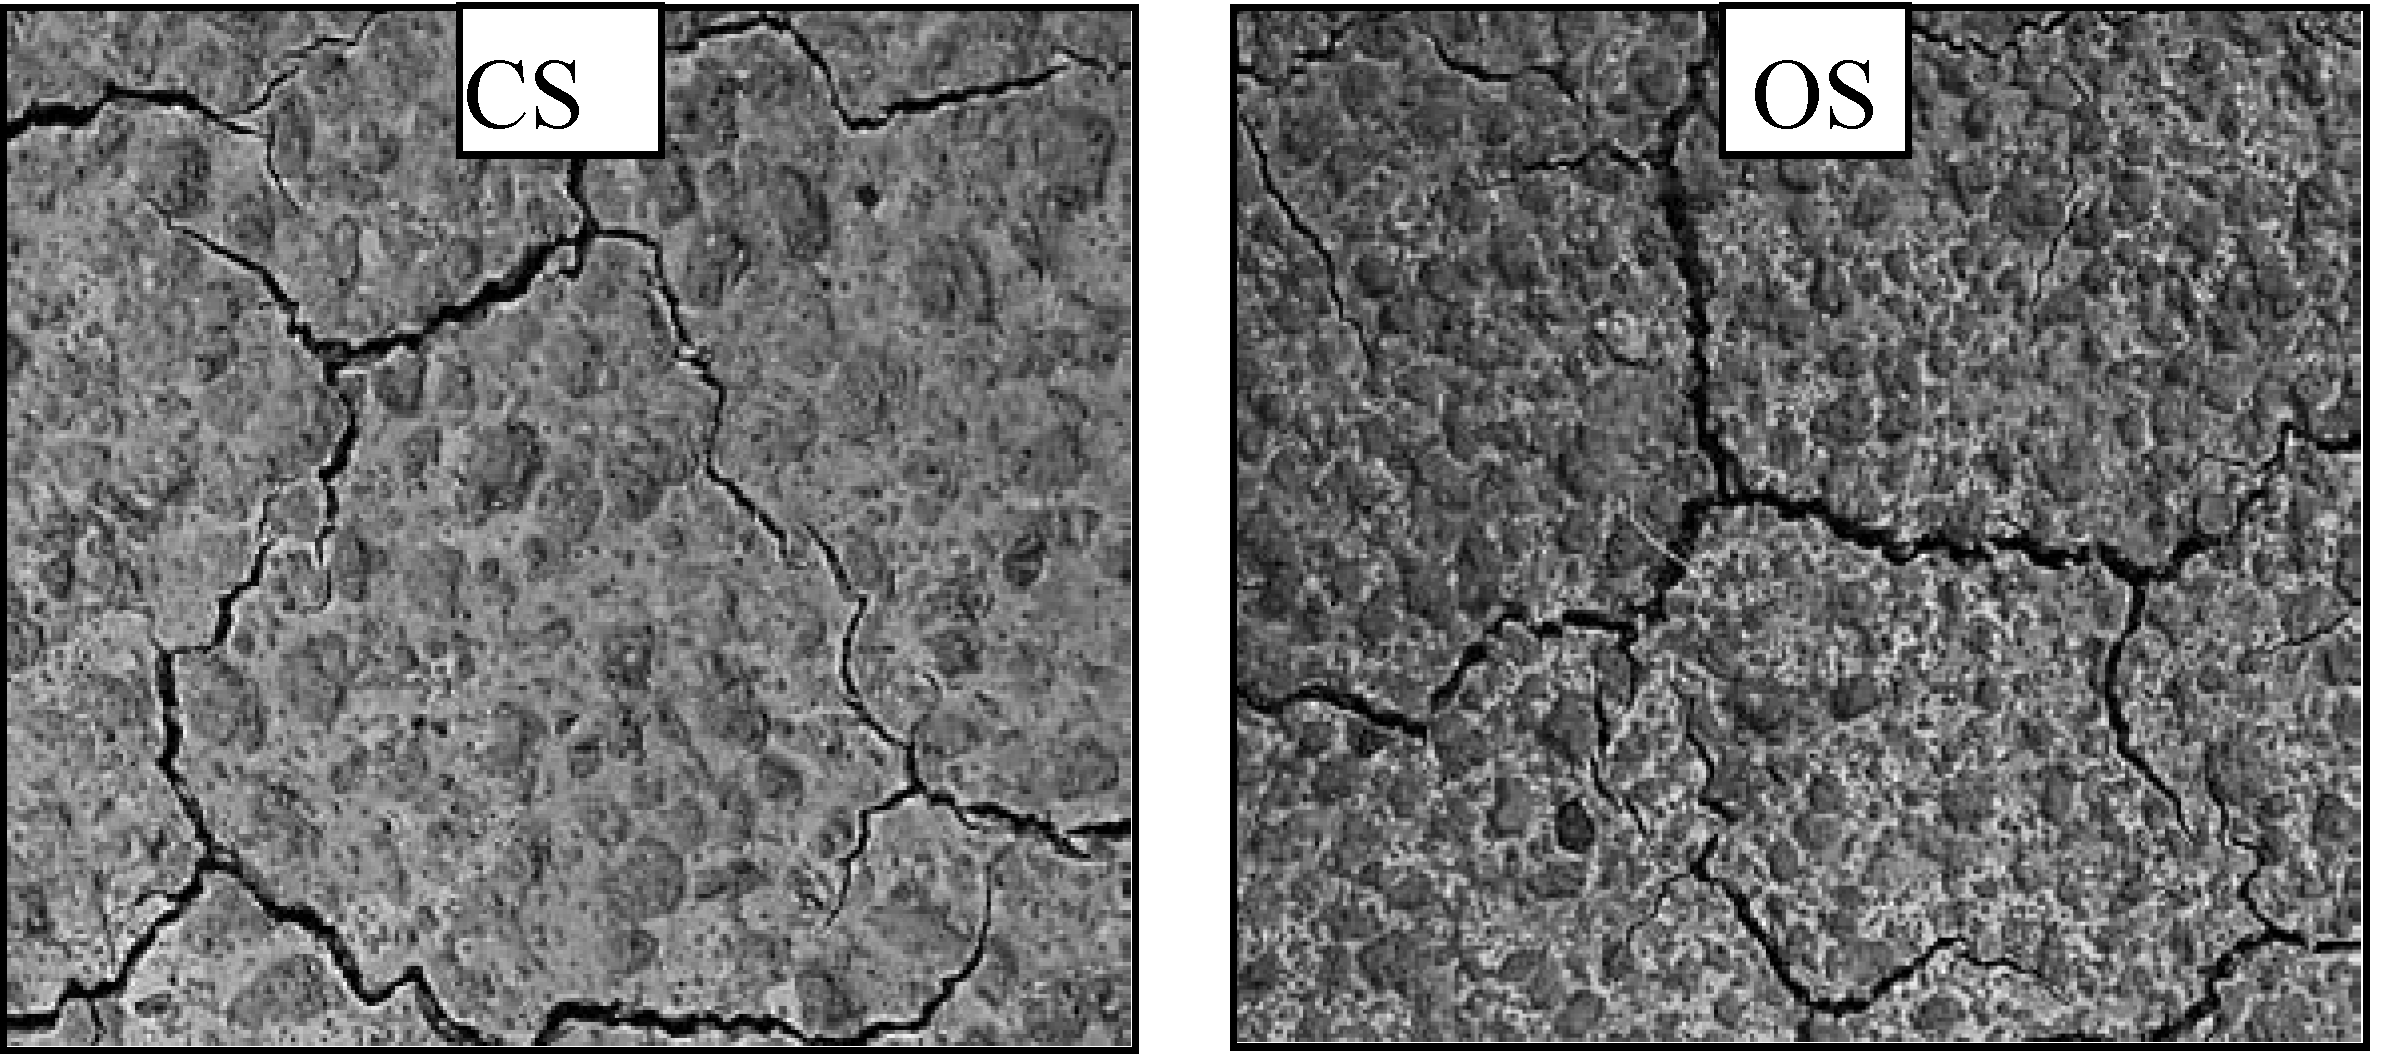
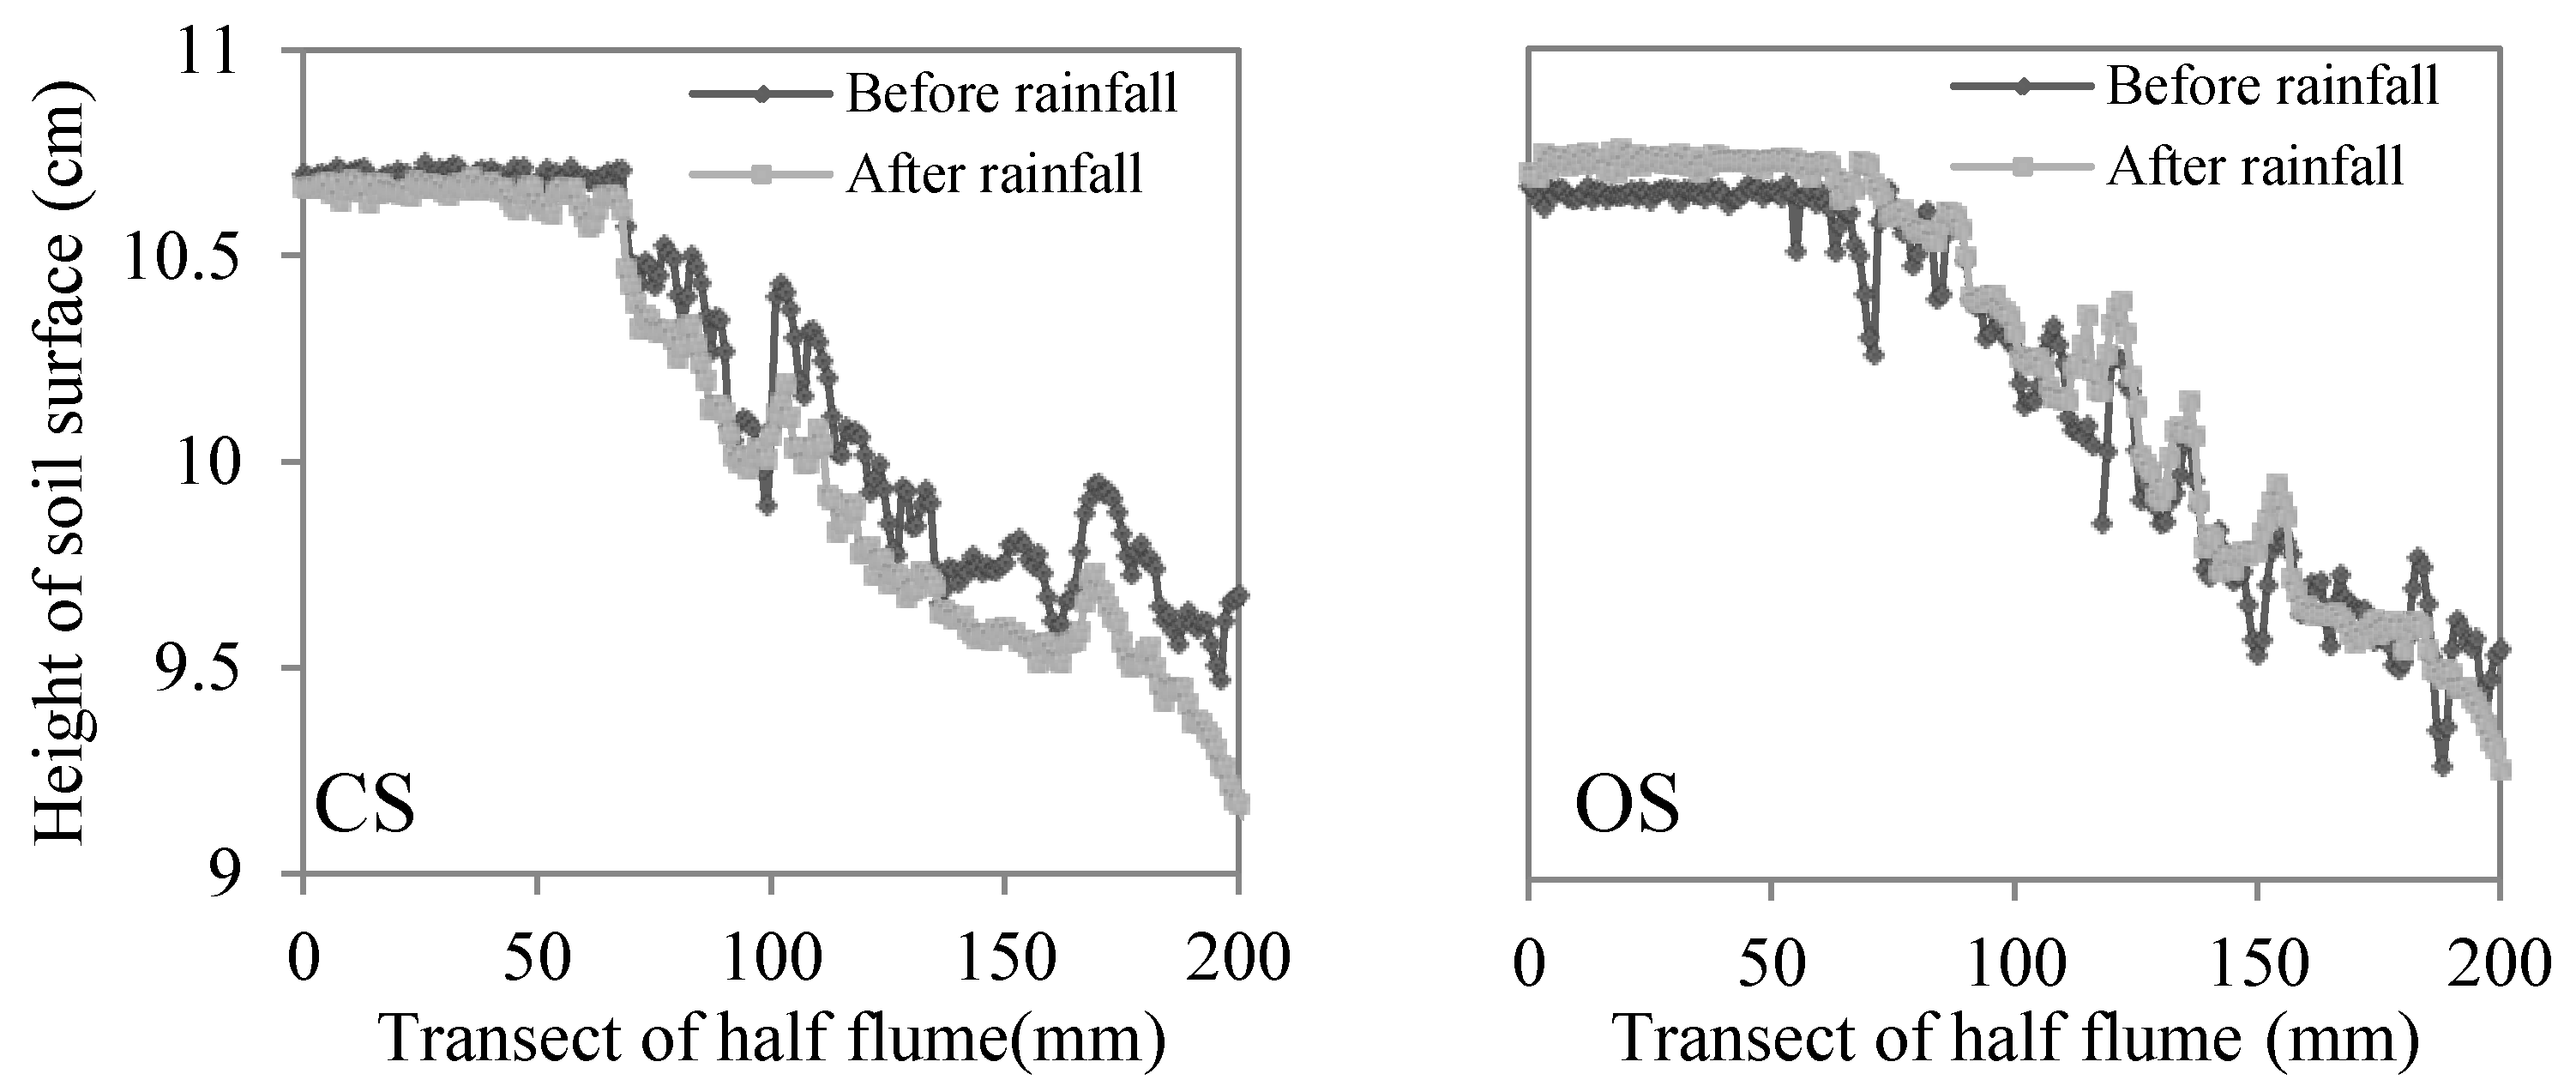
3.4. Crust Formation and Surface Properties

Both soils experienced the formation of distinct crust features during the simulation. After 6 h of rainfall, only a limited amount of large aggregates remained embedded on the CS, surrounded by a coherent depositional crust (Figure 6). In contrast, the extent of the structural crust on the OS was much greater than CS, and the depositional crust also contained visibly distinguishable aggregates (Figure 6). This indicates that the crusting process on CS progressed further than that on OS. A typical pattern of surface roughness changes are shown in Figure 7. The difference in surface relative roughness before and after all rainfall events was significant (Mann-Whitney Test, p ≤ 0.05) for the CS, but not for the OS. This result reflects the progressed crusting on the CS, which generated a stronger elevation contrast between flat extended depositional crusts and embedded crumbs. On the OS, the soil surface was still interspersed by more coarse aggregates, and a smaller area was covered by depositional crust. A similar effect of crusting on roughness was observed by Anderson and Kuhn [41]. The texture of sediments and crusts was similar to the original soil, which indicates non-selective erosion [32]. The SOC content in the crust after six hours of rainfall was not significantly different from that in their original source for either soil (p = 0.47 for CS and p = 0.08 for OS) (Figure 8).
Figure 5. Correlation of soil erosion rate with runoff rate (a,b), correlation of the ERSOC with runoff rate (c,d) and correlation of the ERSOC with soil erosion rate (e,f) of conventionally-farmed soil (CS) and organically-farmed soil (OS). Data from all 10 replicates are presented.
Agriculture 03 00726 g005
Figure 6. Soil surface after 6-h rainfall on conventionally-farmed soil (CS) on the left and organically-farmed soil (OS) on the right. On both soils, the dark patches are formed by structural crust consisting of degraded crumbs. Light-colored areas are depositional crusts consisting of fragments detached from structural crust by raindrop impact and wetting. (Picture size: 10 cm × 10 cm).
Agriculture 03 00726 g006
Figure 7. Typical pattern of surface roughness on the flume transects before and after rainfall. The 10th replicate from conventionally-farmed soil (CS) on the left and organically-farmed soil (OS) on the right is shown here as an example.
Agriculture 03 00726 g007
Figure 8. The enrichment ratio of soil organic carbon (SOC) in soils below the crust, depositional crust and eroded sediment at 360 min from a conventionally-farmed soil (CS) and from an organically-farmed soil (OS) compared to their initial SOC contents. Error bars indicate the standard deviation. n = 10.
Agriculture 03 00726 g008

4. Discussion

Our results confirm the a priori rationale that the ERSOC is influenced by crusting. For both soils used in this study, a cohesive structural crust and a depositional crust were formed (Figure 6). This pattern of crust formation follows the model developed by Chen et al. [27]. The loose particles forming the depositional layer were eroded once runoff started. This leads to a distinct pattern of soil erodibility during the simulation event: increasing until shortly after the runoff rate reaches maximum and declining when the depositional layer is removed (Figure 3). The erodibility peaks shortly after the steady-state runoff is achieved, because runoff becomes more competent, and the preceding destruction of aggregates has produced a temporally unlimited supply of particles that can be eroded by raindrop-impacted flow. The erodibility peak was less pronounced and delayed on the OS compared to the CS (Figure 3). Such differences are attributed to the greater aggregate stability of the OS (Table 1), which leads to slower aggregate breakdown (Figure 7), less erodible particles, slower crusting and less runoff [23,42,43].
The ERSOC showed a similar pattern: increasing first, peaking around when the steady-state runoff conditions were obtained and declining afterwards (Figure 4). We attribute this pattern to the depletion of SOC in the source soil induced by the effect of crusting on the selectivity of erosion. At the end of the rainfall event, the texture and SOC content of the soil and sediment did not differ for CS (Figure 8). This indicates that erosion was non-selective, and therefore, soil and sediment also had the same SOC content, i.e., an ERSOC of one. Schiettecatte et al. [12] also observed an ERSOC equal to one on a silt loam when unit sediment discharge exceeded a certain rate (1.7 g·s−1·m−1). They attributed this to the decreasing selectivity of the erosion process at greater sediment transport rates. We speculate that in our study, at the beginning of interrill erosion, the soil surface consisted of a mixture of aggregates of various sizes, promoting selective erosion of small and light particles. As indicated by the high SOC concentration in small-sized aggregates in the original soils (e.g., <20 µm in Figure 1), as well as in eroded sediment [34], sediment enriched in small-sized aggregates was also likely enriched in SOC. This explanation is consistent with the observation by Schiettecatte et al. [12].
Kuhn and Armstrong [15] also reported selective erosion of fine particles from a sandy soil. However, in their study, a non-erodible sandy layer was developed on the surface, armoring the lower lying soil, and, thus, preventing the achievement of non-selective erosion. In the end, provided that no supplement from adjacent areas or litter input occurred, interrill soil and SOC erosion eventually declined to zero. On the soils used in this study, aggregate destruction continued as the rainfall proceeded. Therefore, the particles forming the depositional crust became finer, while erosivity increased with higher runoff. As a consequence, erosion was increasingly non-selective, and the ERSOC declined over time again (Figure 4). This declining trend suggests that the ERSOC in sediment must be balanced over time by a decrease of SOC in the source area material. This further implies that scaling the ERSOC obtained from short rainfall events up to overall SOC erosion may be misleading. A similar declining pattern of the ERSOC over time was also observed by Polyakov and Lal [10] on both the erosional and depositional positions on a 4 m-long slope. Although the temporal variation of the ERSOC observed in our study applies, in a strict sense, only to laboratory conditions (without the effects of drying, vegetation growth and pronounced roughness elements), it points to the necessity of assessing the degree of crust formation in the field, so as to determine the relevance of crusting for the ERSOC under more complex natural conditions.
The effect of soil management practices on crusting also affected SOC. The SOC concentration in the runoff of the OS was greater than on the CS (9.6 versus 6.6 mg·mm−1, Table 2). While such a difference in concentration reflects the SOC of the two soils (16.9 mg·g−1 of CS versus 10.9 mg·g−1 of OS, Table 1), it does not correspond to the observed total soil erosion of 16.1 g from OS and 27.4 g from CS (Table 2). As a consequence, total SOC loss from the OS (326.0 mg) was only slightly lower than from the CS (369.1 mg) (Table 2). Overall, the loss of SOC from the OS is greater than its lower soil erodibility would suggest, highlighting the necessity of including the effect of crusting, which is often ignored in current SOC erosion modeling, in the assessment of SOC erosion. We attribute the difference in the erosional response of CS and OS to the stronger aggregation on the OS, which delayed crust formation. This reduced, but stretched, the peak of the ERSOC compared to the CS (Figure 4).

5. Conclusions

Interrill erosion, due to its universal occurrence, location at the soil-atmosphere interface and the assumed preferential erosion of SOC, potentially plays a great role in global carbon cycling [1]. The enrichment of SOC in interrill sediment observed in several studies is thus a potentially crucial parameter for assessing soil-climate interaction, as well as the off-site impacts of interrill erosion on water courses. However, the ERSOC of sediment is temporally variable as a consequence of crust formation and erosion. Conservation of mass also questions the use of a quasi-constant average (annual) value of the ERSOC of sediment to estimate the carbon erosion for a prolonged erosion time. The ERSOC of sediment must be balanced over time by a decline of SOC in the source area material. Therefore, extrapolation of enrichment ratios of organic carbon (ERSOC) obtained from short rainfall events up to overall SOC erosion may bear non-ignorable errors. The results of this study confirm these risks by illustrating that the ERSOC is closely related to the duration of rainfall events and the associated extent of crust formation and erosion.
While the prolonged rainfall (6 h) applied here is very limited in its feasibility under natural conditions, the temporal variation of the ERSOC of sediment proves that the ERSOC is dependent on the degree of crust formation and interrill erosion during the period when the soil is vulnerable to erosion by raindrop-impacted flow. Comparing our results with other observations [10,12,15] on ERSOC dynamics caused by crusting, we observe two basic patterns: (1) particles at the surface eventually become small enough for non-selective transport, due to continuous aggregate breakdown, so that the ERSOC will achieve unity; or (2) the erosion remains selective, and a non-erodible layer (e.g., armored by crust or by over-sized particles) is formed at the surface. In this case, provided that no supplement from adjacent areas occurs, interrill and SOC erosion will eventually decline to zero. For both scenarios, a “constant” ERSOC of sediment is biased, leading to an overestimation of SOC erosion, unless the ERSOC was determined for the entire crust formation. This conclusion applies in a strict sense only to laboratory conditions without the effects of drying, vegetation growth and pronounced roughness elements. Observations in the field are now required to determine the relevance of crusting for the ERSOC under more complex natural conditions. Nonetheless, the results of our study show the need for assessing the degree of crust formation in the field, both to ensure that rainfall simulation in the field reflects a typical degree of crust formation under given natural rainfall conditions and that monitoring covers the entire crusting process.

Acknowledgments

We gratefully acknowledge the financial support granted by Chinese Scholarship Council and the University of Basel. The contributions of Ruth Strunk and Mathias Würsch in carrying out the laboratory experiments are thankfully recognized. We particularly thank Marianne Caroni for her passionate contribution to the development of geoscience during her life. The generous support from Severin Kym from Bäumlihof and Edi Hilpert from Eulenhof for providing soil samples are also highly appreciated. The draft of the manuscript was substantially improved by the comments from Phil Greenwood.

Conflicts of Interest

The authors declare no conflict of interest.

References

  1. Kuhn, N.J.; Hoffmann, T.; Schwanghart, W.; Dotterweich, M. Agricultural soil erosion and global carbon cycle: Controversy over? Earth Surf. Process. Landf. 2009, 34, 1033–1038. [Google Scholar]
  2. Parson, A.J.; Abrahams, A.D. Field Investigations of Sediment Removal in Interrill Overland Flow. In Overland Flow; Routledge Taylor & Francis Group: London, UK, 1992; pp. 307–334. [Google Scholar]
  3. Sharpley, A.N. The Selection erosion of plant nutrients in runoff. Soil Sci. Soc. Am. J. 1985, 49, 1527–1534. [Google Scholar] [CrossRef]
  4. Quinton, J.N.; Catt, J.A.; Hess, T.M. The selecctive removal of phosphorus from soil: Is event size important? J. Env. Qual. 2001, 30, 538–545. [Google Scholar] [CrossRef]
  5. Teixeira, P.C.; Misra, R.K. Measurement and prediction of nitrogen loss by simulated erosion events on cultivated forest soils of contrasting structure. Soil Tillage Res. 2005, 83, 204–217. [Google Scholar] [CrossRef]
  6. Warrington, D.N.; Mamedov, A.I.; Bhardwaj, A.K.; Levy, G.J. Primary particle size distribution of eroded material affected by degree of aggregate slaking and seal development. Eur. J. Soil Sci. 2009, 60, 84–93. [Google Scholar] [CrossRef]
  7. Lal, R. Soil erosion and the global carbon budget. Environ. Int. 2003, 29, 437–450. [Google Scholar] [CrossRef]
  8. Van Hemelryck, H.; Fiener, P.; van Oost, K.; Govers, G.; Merckx, R. The effect of soil redistribution on soil organic carbon: An experimental study. Biogeosciences 2010, 7, 3971–3986. [Google Scholar] [CrossRef]
  9. Kuhn, N.J. Rainfall simulation experiments on crusting and interrill sediment organic matter content on a silt loam from devon. Erde 2010, 141, 283–300. [Google Scholar]
  10. Polyakov, V.O.; Lal, R. Soil erosion and carbon dynamics under simulated rainfall. Soil Sci. 2004, 169, 590–599. [Google Scholar] [CrossRef]
  11. Kuhn, N.J. Erodibility of soil and organic matter: Independence of organic matter resistance to interrill erosion. Earth Surf. Process. Landf. 2007, 32, 794–802. [Google Scholar] [CrossRef]
  12. Schiettecatte, W.; Gabriels, D.; Cornelis, W.M.; Hofman, G. Enrichment of organic carbon in sediment transport by interrill and rill erosion processes. Soil Sci. Soc. Am. J. 2008, 72, 50–55. [Google Scholar] [CrossRef]
  13. Wang, Z.; Govers, G.; Steegen, A.; Clymans, W.; van den Putte, A.; Langhans, C.; Merckx, R.; van Oost, K. Catchment-scale carbon redistribution and delivery by water erosion in an intensively cultivated area. Geomorphology 2010, 124, 65–74. [Google Scholar] [CrossRef]
  14. Rodrı́guez Rodrı́guez, A.; Guerra, A.; Arbelo, C.; Mora, J.L.; Gorrı́n, S.P.; Armas, C. Forms of eroded soil organic carbon in andosols of the Canary Islands (Spain). Geoderma 2004, 121, 205–219. [Google Scholar] [CrossRef]
  15. Kuhn, N.J.; Armstrong, E.K. Erosion of organic matter from sandy soils: Solving the mass balance. CATENA 2012, 98, 87–95. [Google Scholar] [CrossRef]
  16. Heil, J.W.; Juo, A.S.R.; McInnes, K.J. Soil properties influencing surface sealing of some sandy soils in the Sahel. Soil Sci. 1997, 162, 459–469. [Google Scholar] [CrossRef]
  17. Ramos, M.C.; Nacci, S.; Pla, I. Soil sealing and its influence on erosion rates for some soils in the Mediterranean Area. Soil Sci. 2000, 165, 398–403. [Google Scholar] [CrossRef]
  18. Kuhn, N.J.; Bryan, R.B. Drying, soil surface condition and interrill erosion on two Ontario soils. CATENA 2004, 57, 113–133. [Google Scholar] [CrossRef]
  19. Darboux, F.; le Bissonnais, Y. Changes in structural stability with soil surface crusting: Consequences for erodibility estimation. Eur. J. Soil Sci. 2007, 58, 1107–1114. [Google Scholar] [CrossRef]
  20. Palis, R.G.; Okwach, G.; Rose, C.W.; Saffigna, P.G. Soil erosion processes and nutrient loss. 1. The interpretation of enrichment ratio and nitrogen loss in runoff sediment. Aust. J. Soil Res. 1990, 28, 623–639. [Google Scholar] [CrossRef]
  21. Jacinthe, P.-A.; Lal, R.; Owens, L.B.; Hothem, D.L. Transport of labile carbon in runoff as affected by land use and rainfall characteristics. Soil Tillage Res. 2004, 77, 111–123. [Google Scholar] [CrossRef]
  22. Martínez-Mena, M.; López, J.; Almagro, M.; Albaladejo, J.; Castillo, V.; Ortiz, R.; Boix-Fayos, C. Organic carbon enrichment in sediments: Effects of rainfall characteristics under different land uses in a Mediterranean area. CATENA 2012, 94, 36–42. [Google Scholar] [CrossRef]
  23. Le Bissonnais, Y.; Cerdan, O.; Lecomte, V.; Benkhadra, H.; Souchère, V.; Martin, P. Variability of soil surface characteristics influencing runoff and interrill erosion. CATENA 2005, 62, 111–124. [Google Scholar] [CrossRef]
  24. Walker, P.H.; Kinnell, P.I.A.; Patricia, G. Transport of a non-cohesive sand mixture in rainfall and runoff experiments. Soil Sci. Soc. Am. J. 1978, 42, 793–801. [Google Scholar] [CrossRef]
  25. Hairsine, P.B.; Sander, G.C.; Rose, C.W.; Parlange, J.-Y.; Hogarth, W.L.; Lisle, I.; Rouhipour, H. Unsteady soil erosion due to rainfall impact: A model of sediment sorting on the hillslope. J. Hydrol. 1999, 220, 115–128. [Google Scholar] [CrossRef]
  26. Kinnell, P.I.A. Raindrop-induced saltation and the enrichment of sediment discharged from sheet and interrill erosion areas. Hydrol. Process. 2012, 26, 1449–1456. [Google Scholar] [CrossRef]
  27. Chen, Y.; Tarchitzky, J.; Brouwer, J.; Morin, J.; Banin, A. Scanning electron microscope observation on soil crusts and their formation. Soil Sci. 1980, 130, 49–55. [Google Scholar] [CrossRef]
  28. Slattery, M.C.; Bryan, R.B. Laboratory experiments on surface seal development and its effect on interrill erosion processes. J. Soil Sci. 1992, 43, 517–529. [Google Scholar]
  29. Le Bissonnais, Y. Aggregate stability and assessment of soil crustability and erodibility: I. Theory and methodology. Eur. J. Soil Sci. 1996, 47, 425–437. [Google Scholar] [CrossRef]
  30. Moore, D.C.; Singer, M.J. Crust formation effects on soil erosion processes. Soil Sci. Soc. Am. J. 1990, 54, 1117–1123. [Google Scholar] [CrossRef]
  31. Kuhn, N.J.; Armstrong, E.K.; Ling, A.C.; Connolly, K.L.; Heckrath, G. Interrill erosion of carbon and phosphorus from conventionally and organically farmed Devon silt soils. CATENA 2012, 91, 94–103. [Google Scholar] [CrossRef]
  32. Hu, Y.; Fister, W. Soil Organic Carbon Erosion from Two Silty Loam Soils—A Laboratory Rainfall Experiment. In Proceedings of the Session GM 4.2 “Erosion and Terrestrial Carbon Cycle”, in General Assembly of European Geoscience Union, Vienna, Austria, 03–08, April, 2011.
  33. Nimmo, J.R.; Perkins, K.S. Aggregate Stability and Size Distribution. In Soil Science Society of America; Dane, J.H., Topp, G.C., Eds.; Methods of Soil Analysis: Madison, WI, USA, 2002; Volume Part 4-Physical methods; pp. 317–328. [Google Scholar]
  34. Hu, Y.; Xiao, L.; Fister, W.; Kuhn, N.J. The effects of aggregation onto the fate of eroded organic carbon. (unpublished).
  35. Hu, Y.; Fister, W.; Rüegg, H.R.; Kinnell, P.I.A.; Kuhn, N.J. The Use of Equivalent Quartz Size and Settling Tube Apparatus to Fractionate Soil Aggregates by Settling Velocity. In Geomorphology Techniques (Online Edition); British Society for Geomorphology: London, UK, 2013; p. Section 1.1.1. [Google Scholar]
  36. MeteoSwiss. Monthly total precipitation during April, May, and June at Station Arisdorf (47°30' N, 7°46' E) near Möhlin from 1985 to 2012. MeteoSwiss, Federal Office of Meteorology and Climatology: Zürich, Switzerland.
  37. Borselli, L.; Torri, D.; Poesen, J.; Sanchis, P. Effects of water quality on infiltration, runoff and interrill erosion processes during simulated rainfall. Earth Surf. Process. Landf. 2001, 26, 329–342. [Google Scholar] [CrossRef]
  38. Wendt, R.C.; Alberts, E.E.; Hjelmfelt, A.T. Variability of runoff and soil loss from fallow experimental plots. Soil Sci. Soc. Am. J. 1986, 50, 730–736. [Google Scholar] [CrossRef]
  39. Bryan, R.B.; Luk, S.H. Laboratory experiments on the variation of soil erosion under simulated rainfall. Geoderma 1981, 26, 245–265. [Google Scholar] [CrossRef]
  40. Hu, Y.; Fister, W.; Kuhn, N.J. Inter-replicate variability and duration-related systematic variability in organic carbon erosion modeling. (unpublished).
  41. Anderson, K.; Kuhn, N.J. Variations in soil structure and reflectance during a controlled crusting experiment. Int. J. Remote Sens. 2008, 29, 3457–3475. [Google Scholar] [CrossRef]
  42. Barthes, B.; Roose, E. Aggregate stability as an indicator of soil susceptibility to runoff and erosion; validation at several levels. CATENA 2002, 47, 133–149. [Google Scholar] [CrossRef]
  43. Singer, M.J.; Le Bissonnais, Y. Importance of surface sealing in the erosion of some soils from a mediterranen climate. Geomorphology 1998, 24, 79–85. [Google Scholar] [CrossRef]

