Hyperspectral and Chlorophyll Fluorescence Imaging for Early Detection of Plant Diseases, with Special Reference to Fusarium spec. Infections on Wheat

Abstract
:
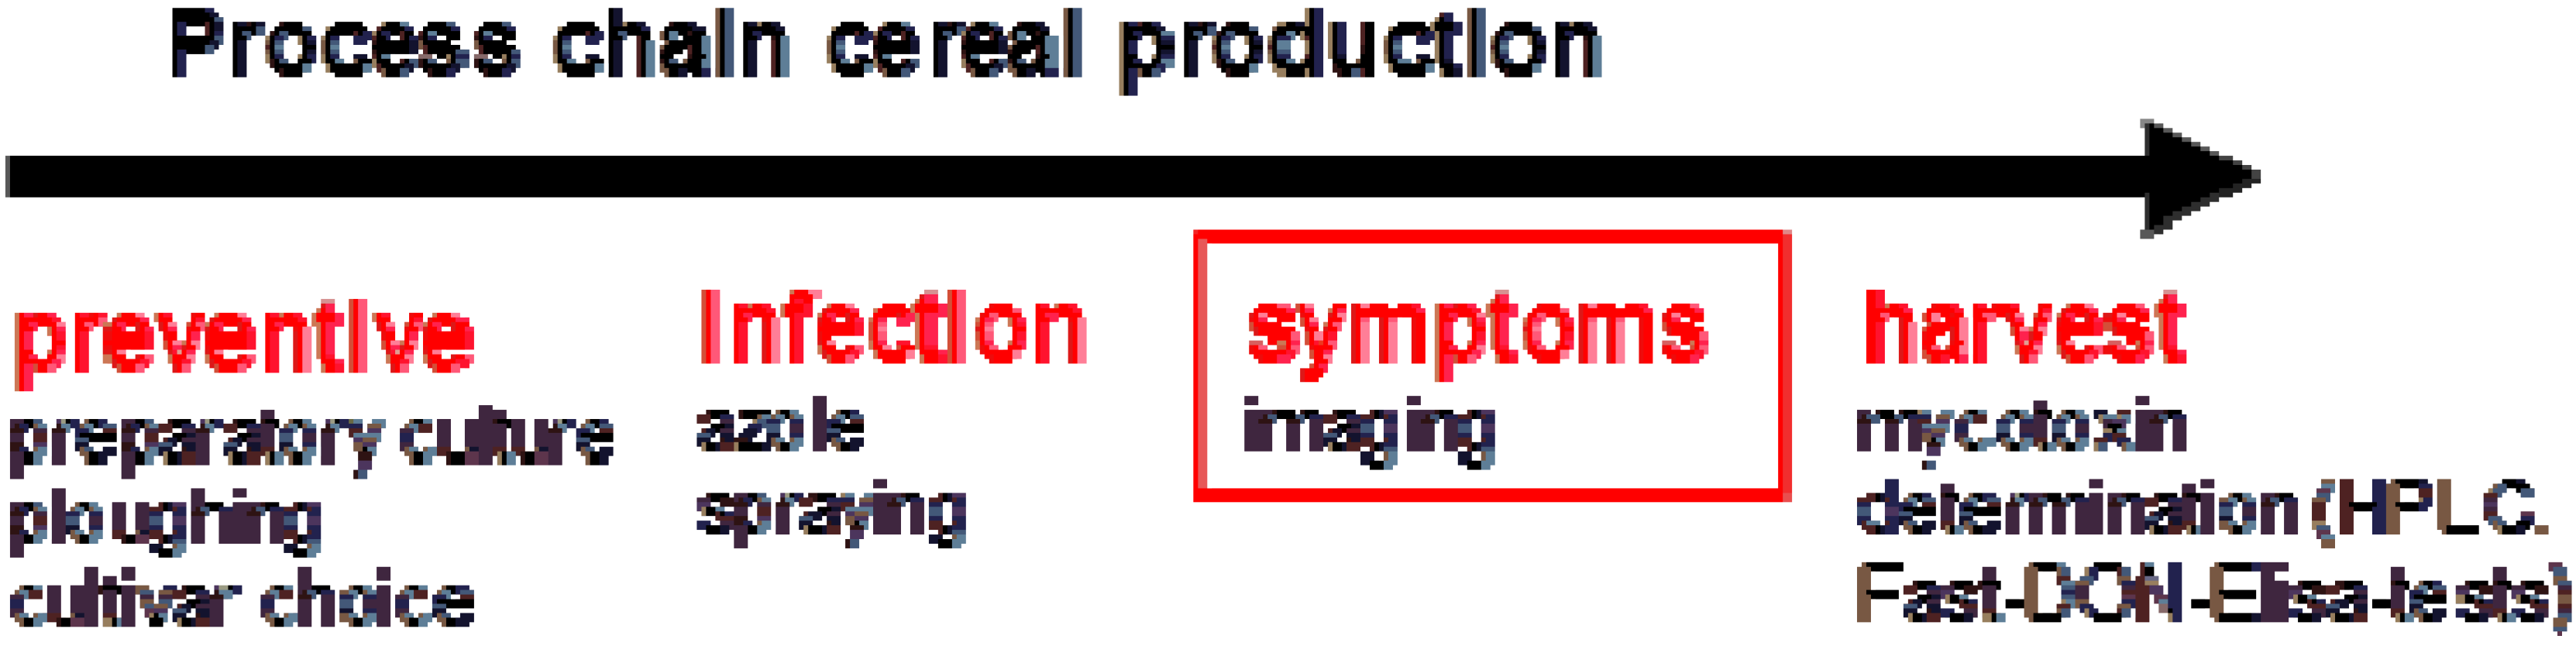
1. Introduction
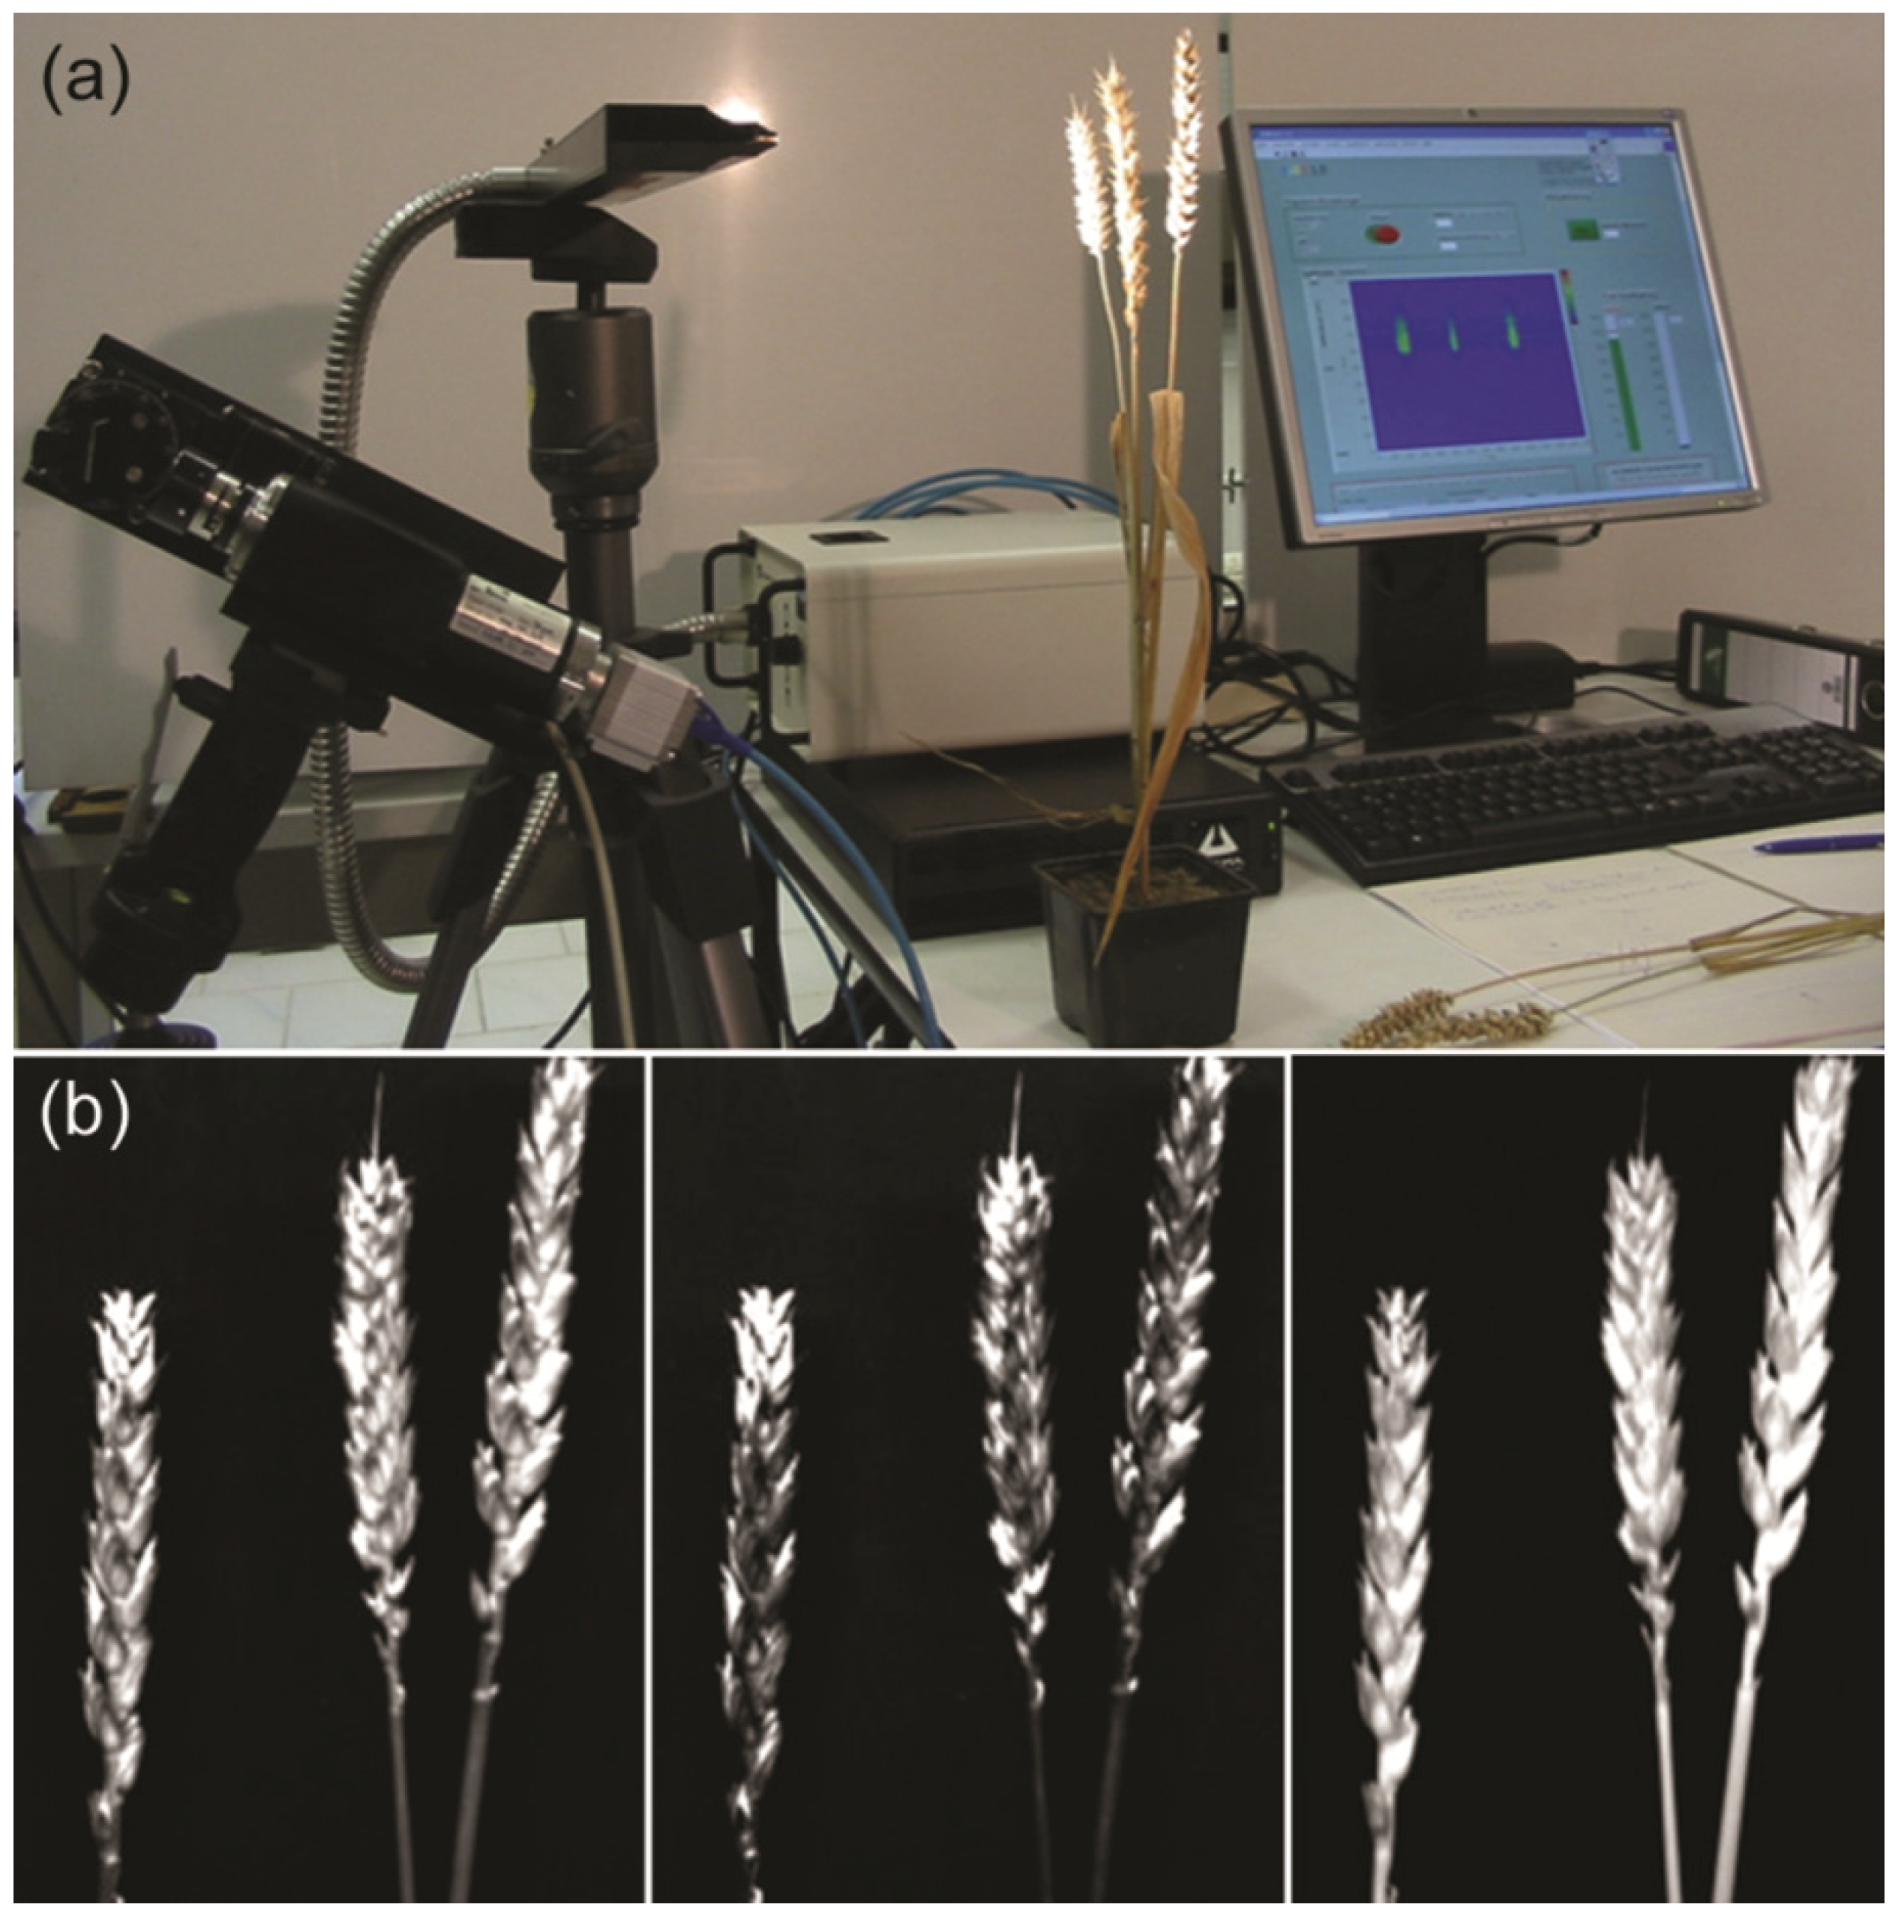
2. Imaging Techniques to Detect Head Blight Symptoms
2.1. Chlorophyll Fluorescence Imaging for Evaluation of Fungal Infections
2.1.1. Advantages of Image Analyses
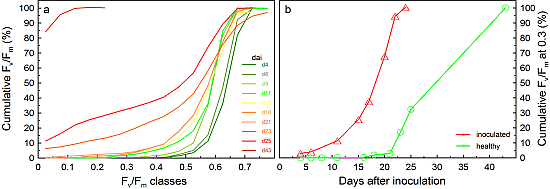
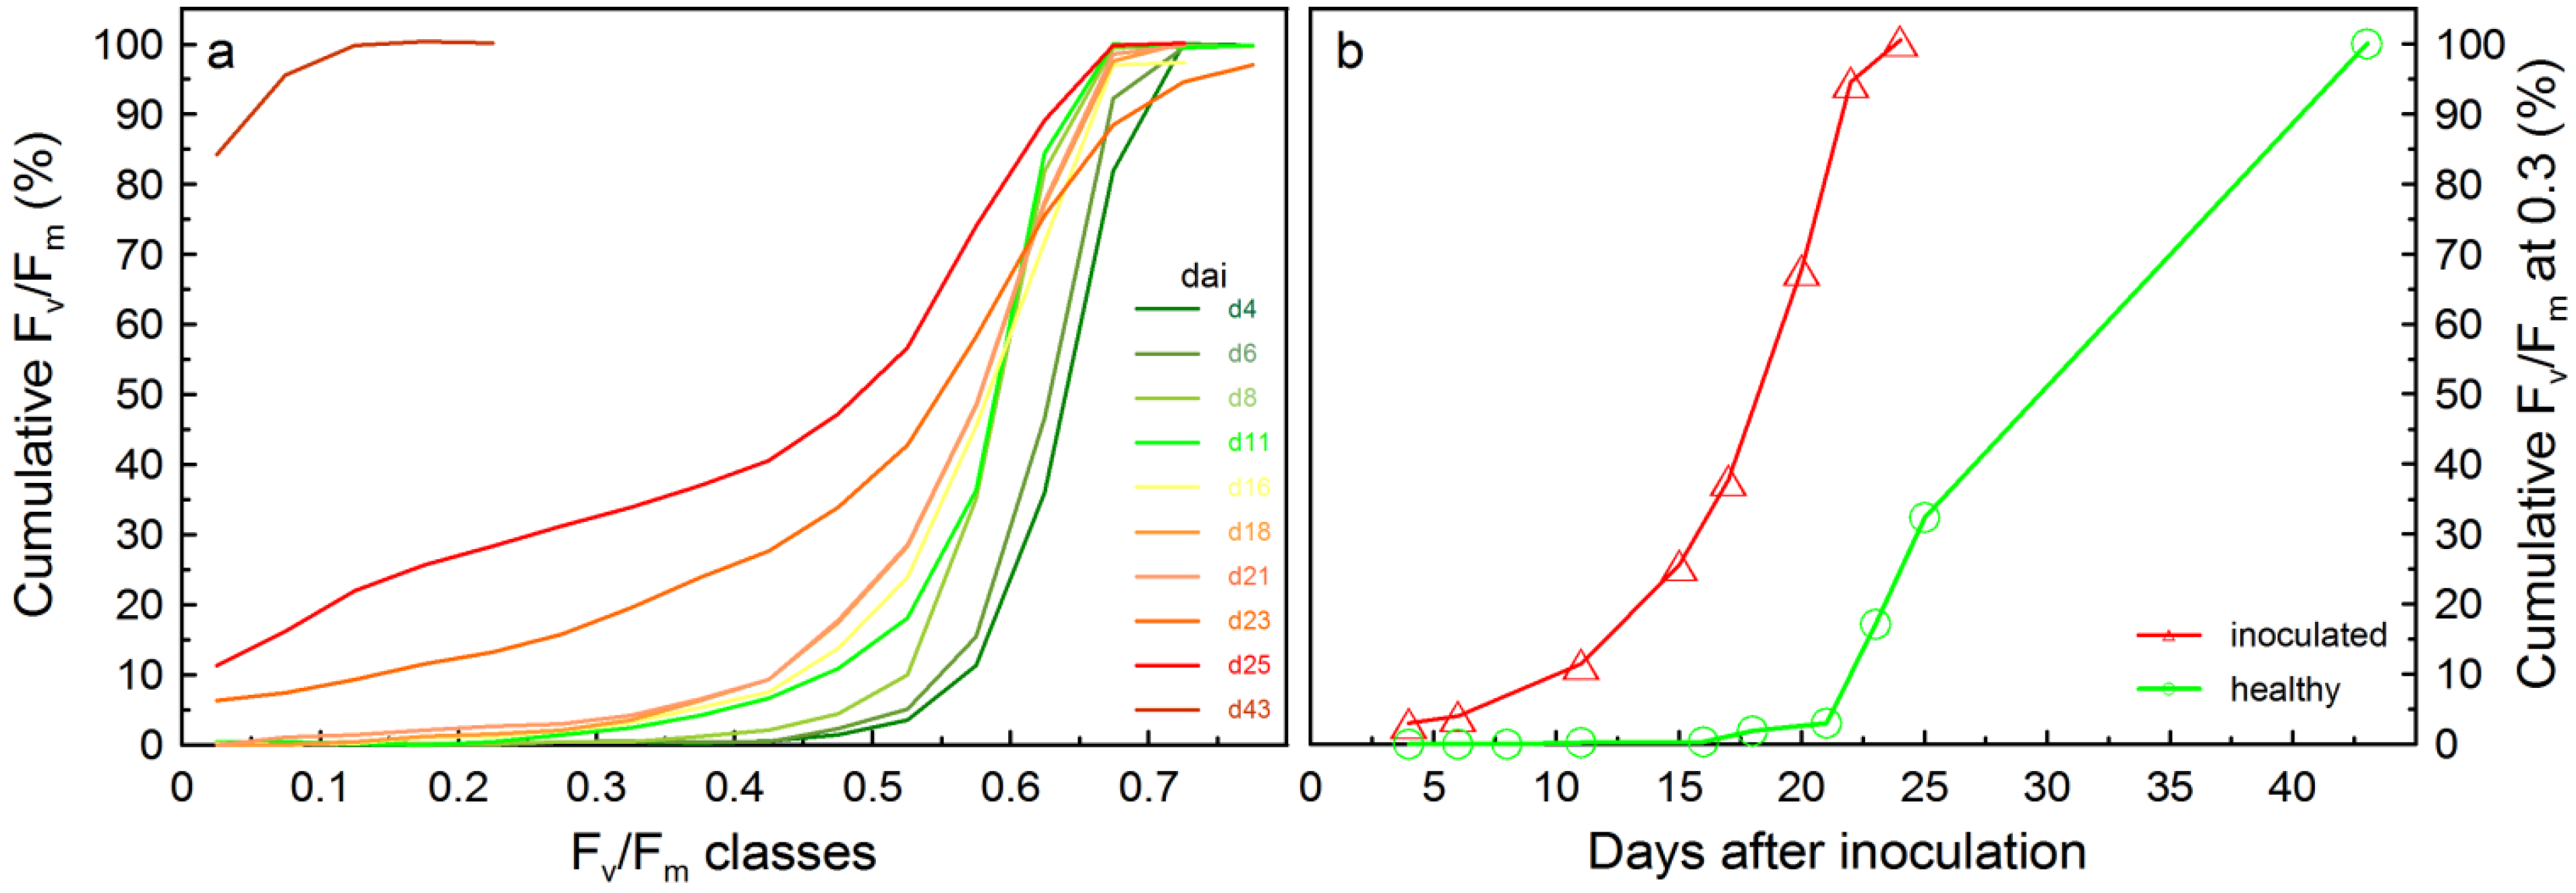
2.1.2. The Timeframe of Detection

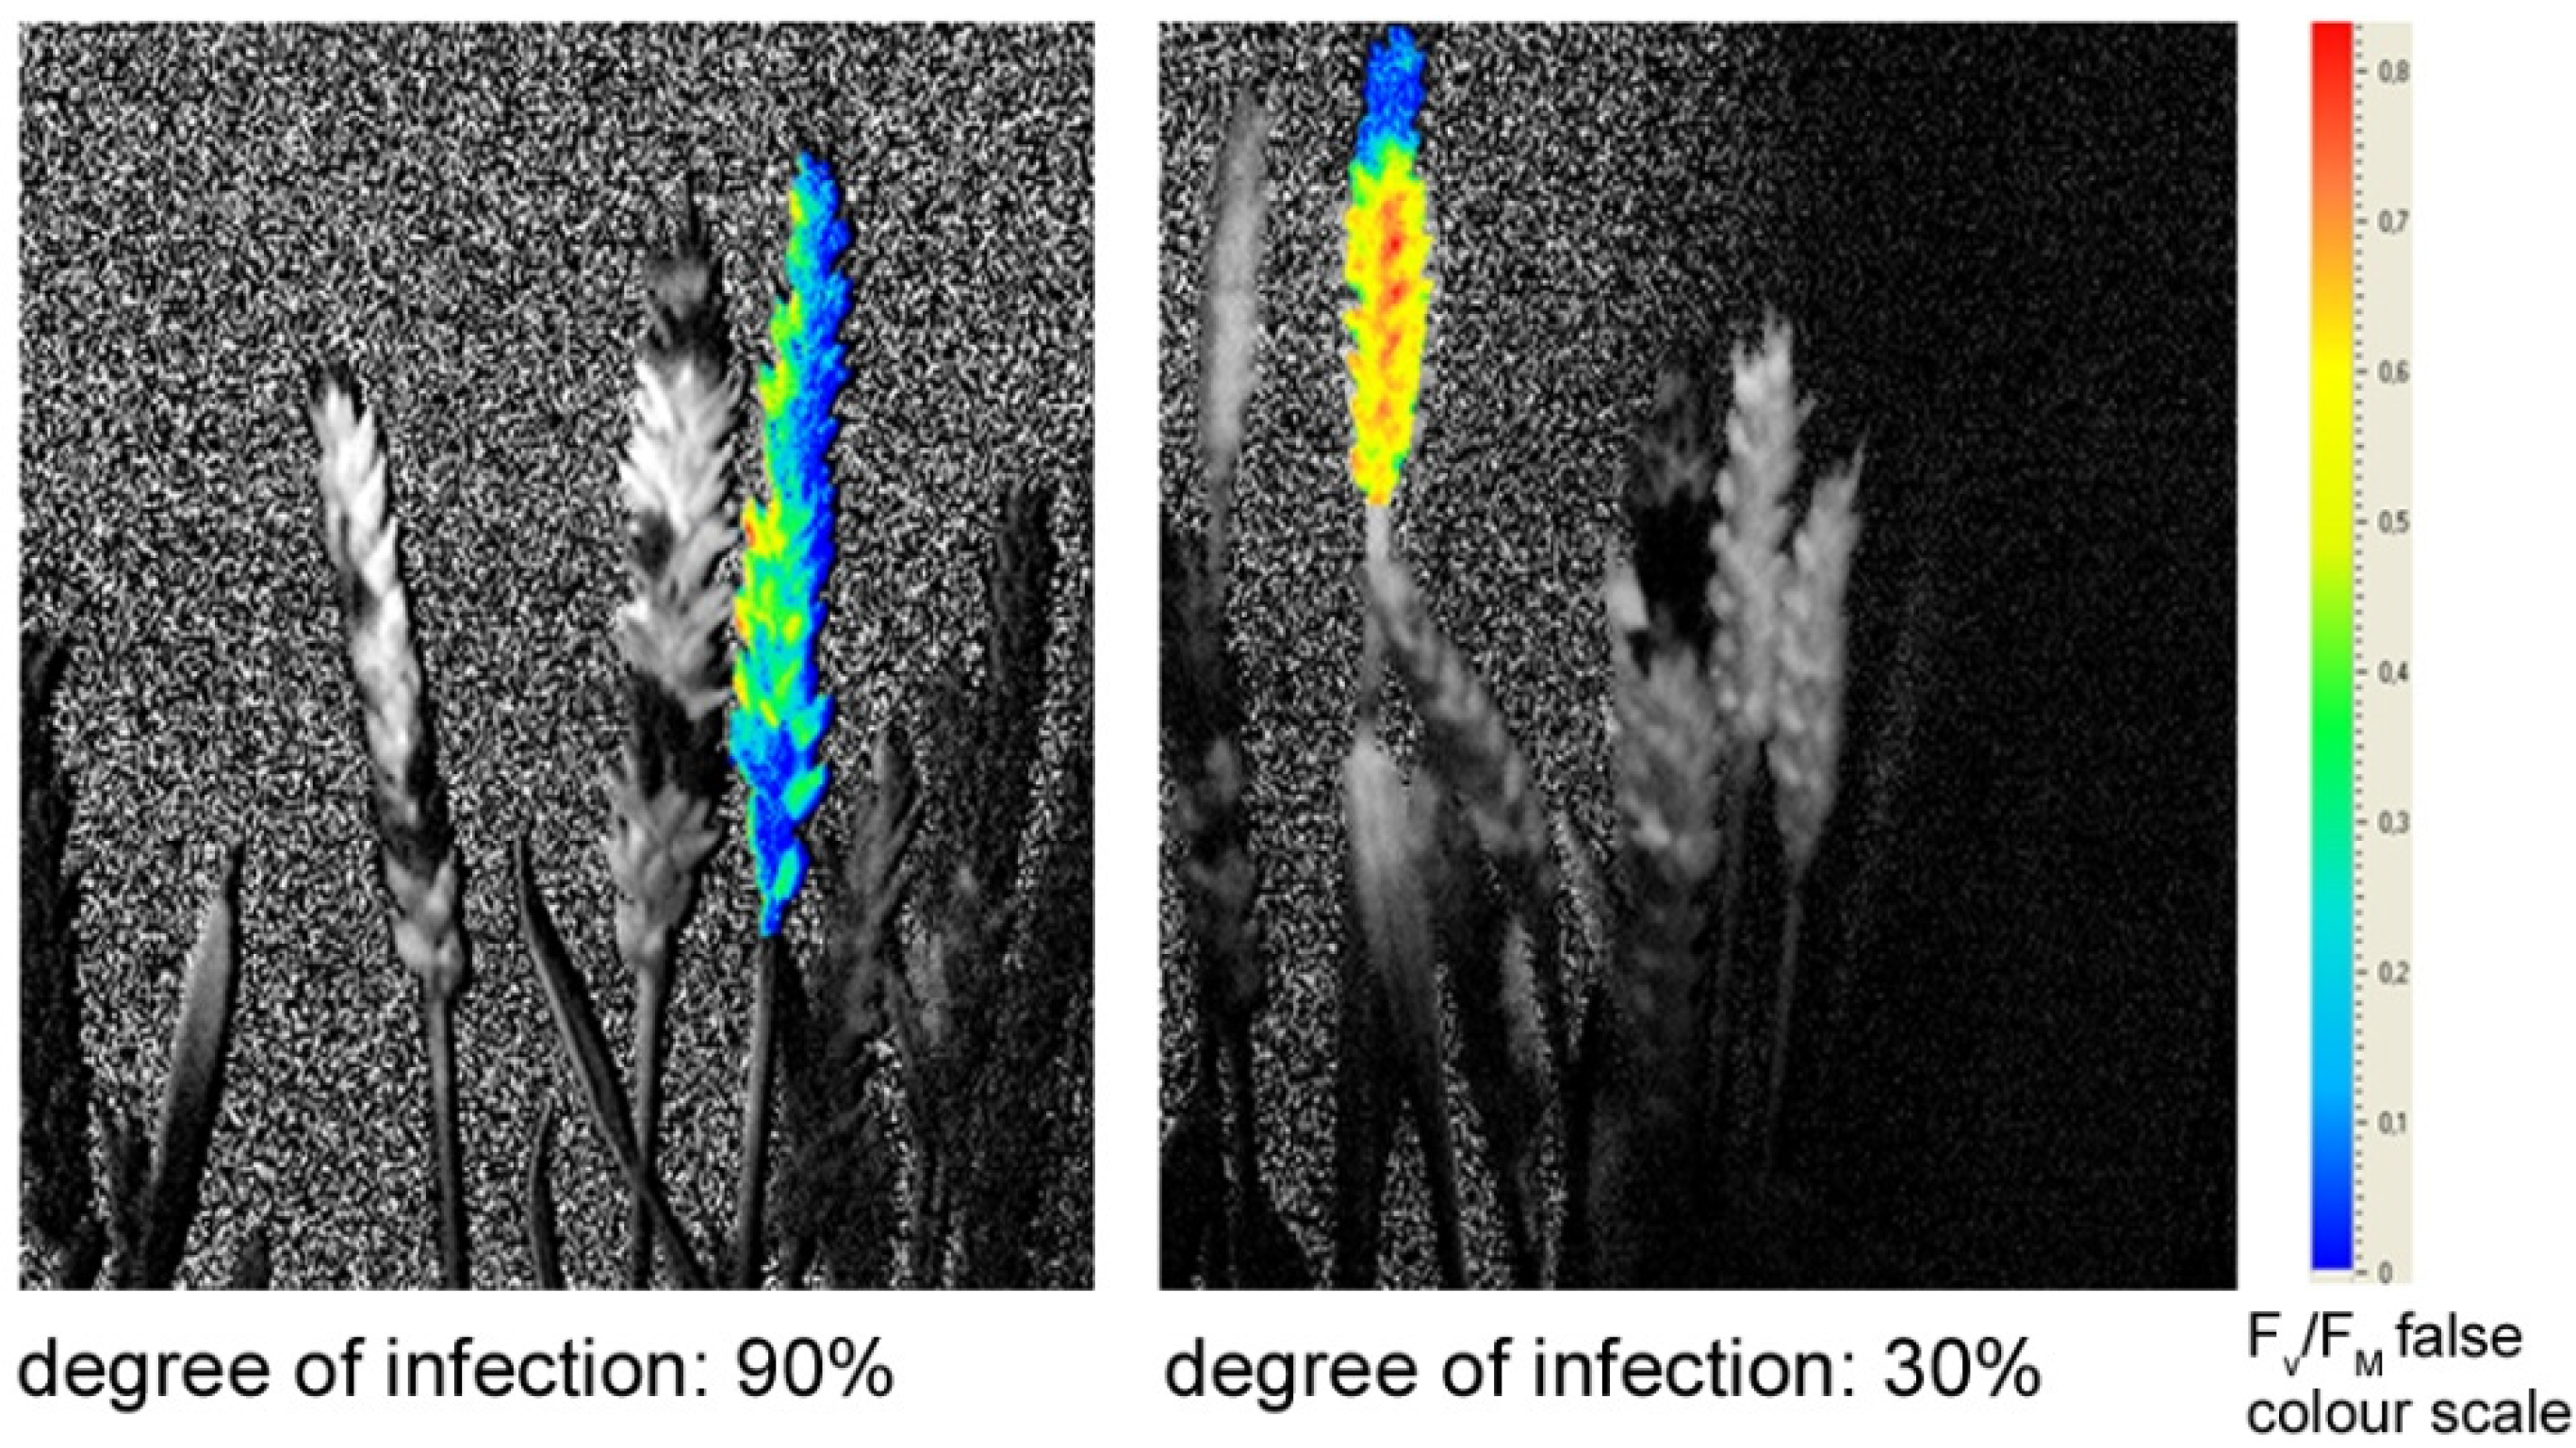
2.1.3. Detection Accuracy of CFI on Wheat Plants with Different Degrees of Fusarium Infection
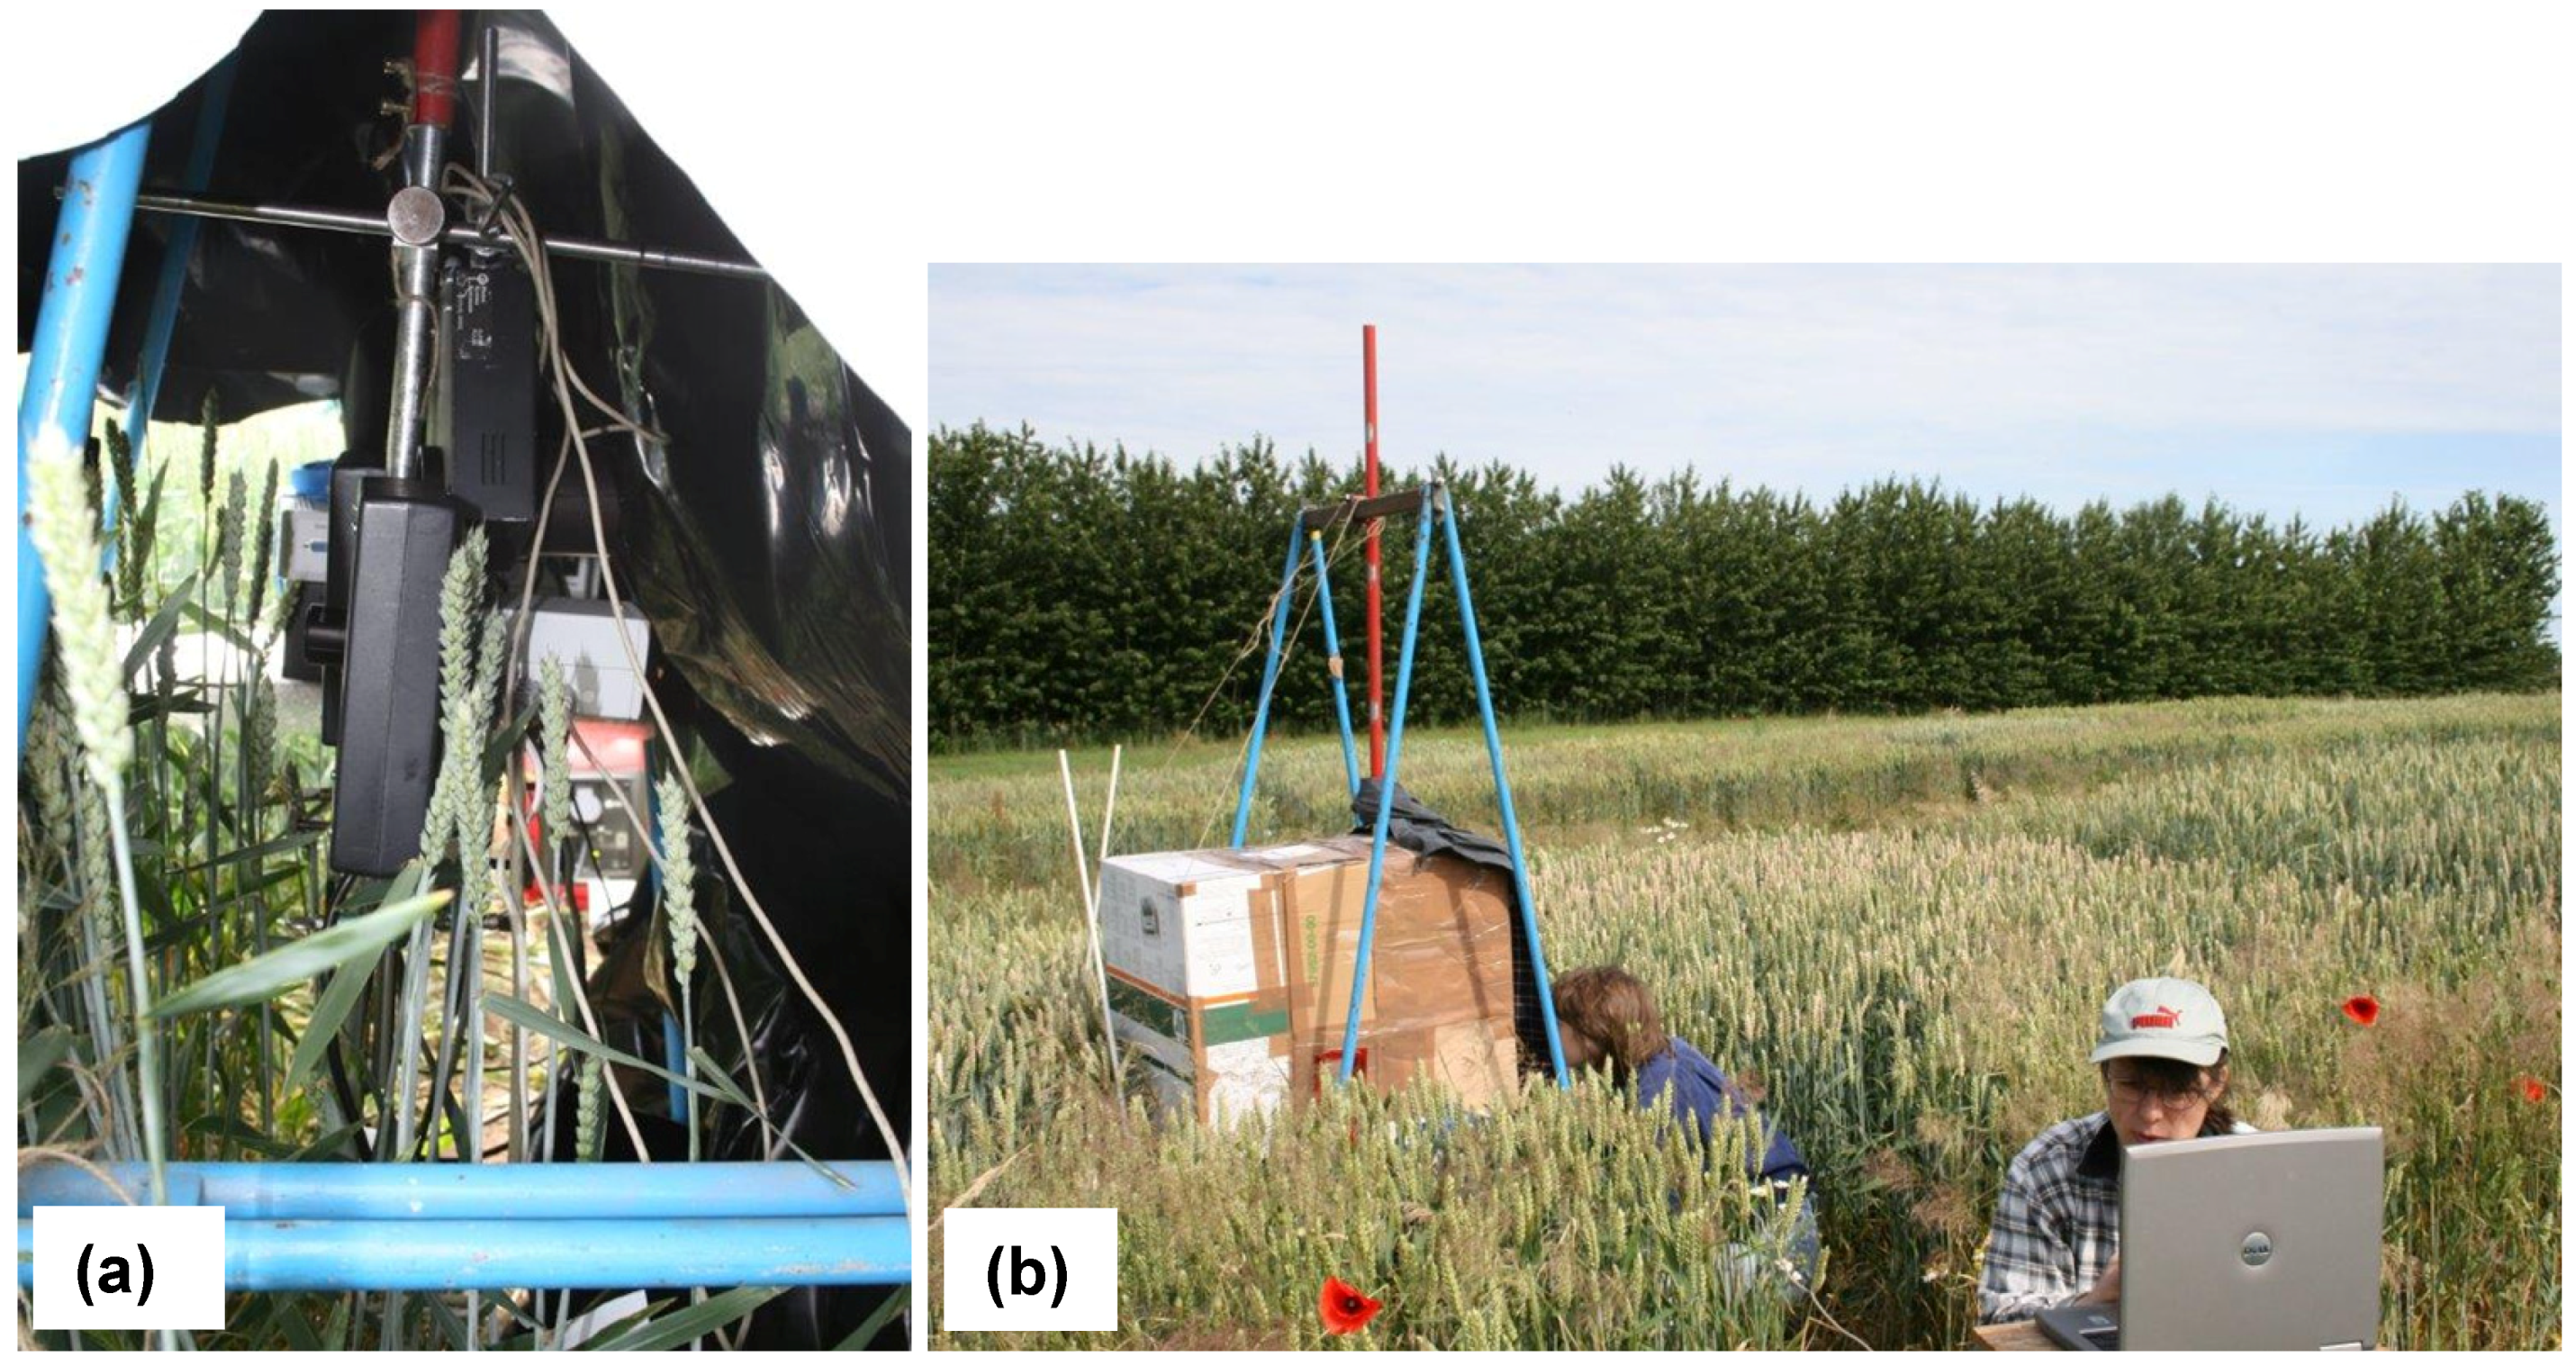
2.1.4. Application under Field Conditions


2.2. Hyperspectral Imaging in the VIS (400–700 nm) and NIR-Range (700–3000 nm)
2.2.1. Detection of Fusarium-Damaged Grains
2.2.2. Application of Hyperspectral Imaging for Head Blight Detection
2.2.2.1. Wavelength Ranges for a Successful Discrimination of Head Blight and Other Diseases

| Plant-Pathogen system | Relevant Spectral Lines | Targets/Method | References |
|---|---|---|---|
| Triticum aestivum—Fusarium | 550–560 nm 665–675 nm | detection of carotenoids and chlorophylls | [38] |
| Beta vulgaris—Cercospora beticola, Erysiphe betae and Uromyces betae | 10 optimal wavelengths between 450–1650 nm | [55] | |
| Triticum aestivum—Puccinia striiformis f. sp. tritici, P. graminis f. sp. tritici and P. triticina | indices | [56] | |
| Zea mays—Fusarium verticilloides (grains) | 1960 and 2100 nm for infected; 1450, 2300 and 2350 nm for non-infected grains | changes of carbohydrate and protein contents | [58] |
| Triticum aestivum—Fusarium (grains) | RBG | [61] | |
| Triticum aestivum—Fusarium (grains) | 1182 and 1242 nm | [2] | |
| Triticum aestivum—Fusarium (grains) | 1425 to 1440 nm and 1915 to 1930 nm | DON estimation changes of carbohydrates, proteins and lipid contents | [59] |
| Triticum aestivum—Fusarium (grains) | 1204, 1365 and 1700 nm | DON estimation changes of carbohydrates, proteins and lipid contents | [62] |
| Triticum aestivum—Penecillium spp. and Aspergillus species (grains) | 1284, 1316, 1347 nm | changes of carbohydrates, proteins and lipid contents | [63] |
| Triticum aestivum—Fusarium culmorum | 430–1750 nm | method: PLS | [64] |
| Triticum aestivum—Drechslera tritici-repenti | 550–750 nm | methods: PCA, FVBA | [72] |
| Beta vulgaris—Heterodera schachtii and Rhizoctonia solani | 400–1000 nm | methods: SVI, SAM | [74] |
| Triticum aestivum—Fusarium spp. | 670 ± 22, 800 ± 65 nm | [12] | |
| Triticum aestivum—Fusarium spp. | RGB | changes of chlorophyll and carotenoids | [75] |
| Triticum aestivum—Fusarium | bands in R, MIR and NIR | changes of chlorophyll and carotenoids | [11] |
2.2.2.2. Detection Accuracy and Time Frame of the Application of Existing Classification Algorithms
2.2.2.3. Optimum Stage of Head Development for Disease Detection
2.2.2.4. Effects of Steady and Unsteady Characteristics on the Automated Disease Determination
2.2.2.5. Effects of the Degree of Infection on the Detection Accuracy of Hyperspectral Imaging
2.3. Advantages and Disadvantages of Chlorophyll Fluorescence and Hyperspectral Imaging for Head Blight Detection
2.4. Approaches to Analyse Chlorophyll Fluorescence and Spectral Images

2.5. Improvement of Disease Recognition by Sensor Fusion
Acknowledgments
Author Contributions
Conflicts of Interest
References
- Shaner, G.E. Epidemiology of Fusarium Head Blight of Small Grain Cereals in North America. In Fusarium Head Blight of Wheat and Barley; Leonard, K.J., Bushnell, W.R., Eds.; APS Press: St. Paul, MN, USA, 2005; pp. 84–119. [Google Scholar]
- Delwiche, S.R. Classification of scab- and other mold-damaged wheat kernels by near-infrared reflectance spectroscopy. Trans. ASAE 2003, 46, 731–738. [Google Scholar]
- Ragab, W.; Drusch, S.; Kuhlmann, A.; Beyer, M. Characterizing effects of fermentation and baking on the deoxynivalenol content of rolls. J. Appl. Bot. Food Qual. 2005, 79, 197–201. [Google Scholar]
- DLG-Arbeitsgruppe “Mykotoxine”. Mykotoxine vermeiden statt “bekämpfen”. Sonderdr. DLG-Mitt. 8. Available online: http://www.dlg.org/uploads/media/myko.pdf (accessed on 1 March 2010).
- Gelderblom, W.C.A.; Jaskiewicz, K.; Marasas, W.F.O.; Thiel, P.G.; Horak, R.M.; Vleggaar, R.; Kriek, N.P.J. Fumonisins—Novel mycotoxins with cancer-promoting activity produced by Fusarium-moniliforme. Appl. Environ. Microbiol. 1988, 54, 1806–1811. [Google Scholar]
- Kuiper-Goodman, T. Mycotoxins: Risk assessment and legislation. Toxicol. Lett. 1995, 82/83, 853–859. [Google Scholar] [CrossRef]
- Massart, F.; Saggese, G. Oestrogenic mycotoxin exposures and precocious pubertal development. Int. J. Androl. 2010, 33, 369–376. [Google Scholar] [CrossRef]
- Ministerium für Infrastruktur und Landwirtschaft des Landes Brandenburg (MIL). Mykotoxine: Vorkommen und Bekämpfungsstrategien in Brandenburg; Ministerium für Ländl; Entwicklung, Umwelt und Verbraucherschutz des Landes Brandenburg: Brandenburg, Germany, 2004; p. 80. [Google Scholar]
- Pestka, J.J.; Smolinski, A.T. Deoxynivalenol: Toxicology and potential effects on humans. J. Toxicol. Environ. Health 2005, 8, 39–69. [Google Scholar] [CrossRef]
- Thate, A.; Schumann, S.; Hanschmann, G.; Urban, Y. Auftreten von Ährenfusariosen und Mykotoxinen in Sachsen und Ergebnisse der Vor- und Nachernteuntersuchungen von Winterweizen 2007 (Appearance of ear fusariosis and mycotoxins in Saxonia and results of pre- and postharvest investigations on winter wheat 2007). Nachrichtenblatt Dtsch. Pflanzenschutzd. 2008, 60, 117. [Google Scholar]
- Laguette, S.; Hollingsworth, C.; Motteberg, C.; MacRae, I. Potentials and Limits of Remote Sensing Data for Detection of Fusarium Head Blight on Hard Red Spring Wheat in Minnesota. In Proceedings of the 7th International Conference on Precision Agriculture and Other Precision Resources Management, Hyatt Regency, Minneapolis, MN, USA, 25–28 July 2004; Mulla, D.J., Ed.; Precision Agriculture Center, University of Minnesota: St. Paul, MN, USA, 2004; pp. 1196–1203. [Google Scholar]
- Dammer, K.H.; Moeller, B.; Rodemann, B.; Heppner, D. Detection of head blight (Fusarium ssp.) in winter wheat by color and multispectral image analyses. Crop Protect. 2011, 30, 420–428. [Google Scholar] [CrossRef]
- Von Willert, D.; Matyssek, R.; Herppich, W. Experimental Plant Ecology: Fundamentals and Applications. In Experimentelle Pflanzenökologie: Grundlagen und Anwendungen; Georg Thieme Verlag: Stuttgart, Germany, 1995; p. 344. [Google Scholar]
- Maxwell, K.; Johnson, G.N. Chlorophyll fluorescence—A practical guide. J. Exp. Bot. 2000, 51, 659–668. [Google Scholar] [CrossRef]
- Nedbal, L.; Soukupova, J.; Whitmarsh, J.; Trtilek, M. Postharvest imaging of chlorophyll fluorescence from lemons can be used to predict fruit quality. Photosynthetica 2000, 38, 571–579. [Google Scholar] [CrossRef]
- Herppich, W.B.; Hetz, E.; Dammer, K.-H.; Langner, H.-R.; Beuche, H.; Hellebrand, H.-J. Application of chlorophyll fluorescence imaging analysis in fungal pathogen detection. In Bornimer Agrartechnische Berichte; Institut für Agrartechnik Bornim e.V.: Potsdam, Germany, 2005; Volume 40, pp. 95–108. [Google Scholar]
- Daley, P.F. Chlorophyll fluorescence analysis and imaging in plant stress and disease. Can. J. Plant Pathol. 1995, 17, 167–173. [Google Scholar] [CrossRef]
- Nedbal, L.; Whitmarsh, J. Chlorophyll Fluorescence Imaging of Leaves and Fruits. In Advances in Photosynthesis and Respiration; Papageorgiou, G.C., Govindjee, X., Eds.; Springer: Dordrecht, The Netherlands, 2004; Volume 19, pp. 389–407. [Google Scholar]
- Kuckenberg, J.; Tartachnyk, I.; Noga, G. Temporal and spatial changes of chlorophyll fluorescence as a basis for early and precise detection of leaf rust and powdery mildew infections in wheat leaves. Precis. Agric. 2009, 10, 34–44. [Google Scholar] [CrossRef]
- Rolfe, S.A.; Scholes, J.D. Chlorophyll fluorescence imaging of plant-pathogen interactions. Protoplasma 2010, 247, 163–175. [Google Scholar] [CrossRef]
- Bonfig, K.B.; Schreiber, U.; Gabler, A.; Roitsch, T.; Berger, S. Infection with virulent and avirulent P-syringae strains differentially affects photosynthesis and sink metabolism in Arabidopsis leaves. Planta 2006, 225, 1–12. [Google Scholar] [CrossRef]
- Buerling, K.; Hunsche, M.; Noga, G. Quantum yield of non-regulated energy dissipation in PSII (Y(NO)) for early detection of leaf rust (Puccinia triticina) infection in susceptible and resistant wheat (Triticum aestivum L.) cultivars. Precis. Agric. 2010, 11, 703–716. [Google Scholar] [CrossRef]
- Chaerle, L.; Hagenbeek, D.; de Bruyne, E.; Valcke, R.; Van Der Straeten, D. Thermal and chlorophyll-fluorescence imaging distinguish plant-pathogen interactions at an early stage. Plant Cell Physiol. 2004, 45, 887–896. [Google Scholar] [CrossRef]
- Chaerle, L.; Hagenbeek, D.; de Bruyne, E.; Van Der Straeten, D. Chlorophyll fluorescence imaging for disease-resistance screening of sugar beet. Plant Cell Tissue Organ Cult. 2007, 91, 97–106. [Google Scholar] [CrossRef]
- Prokopova, J.; Spundova, M.; Sedlarova, M.; Husickova, A.; Novotny, R.; Dolezal, K.; Naus, J.; Lebeda, A. Photosynthetic responses of lettuce to downy mildew infection and cytokinin treatment. Plant Physiol. Biochem. 2010, 48, 716–723. [Google Scholar] [CrossRef]
- Martinez, D.E.; Luquez, V.M.; Bartoli, C.G.; Guiamet, J.J. Persistence of photosynthetic components and photochemical efficiency in ears of water-stressed wheat (Triticum aestivum). Physiol. Plant 2003, 119, 519–525. [Google Scholar] [CrossRef]
- Wang, X.; Cai, J.; Jiang, D.; Liu, F.; Dai, T.; Cao, W. Pre-anthesis high-temperature acclimation alleviates damage to the flag leaf caused by post-anthesis heat stress in wheat. J. Plant Physiol. 2011, 168, 585–593. [Google Scholar] [CrossRef]
- Tartachnyk, I.I.; Rademacher, I.; Kuehbauch, W. Distinguishing nitrogen deficiency and fungal infection of winter wheat by laser-induced fluorescence. Precis. Agric. 2006, 7, 281–293. [Google Scholar] [CrossRef]
- Kuckenberg, J.; Tartachnyk, I.; Schmitz-Eiberger, M.; Noga, G. Early detection of leaf rust and powdery mildew infections on wheat leaves by PAM fluorescence imaging. Precis. Agric. 2007, 8, 515–521. [Google Scholar]
- Robert, C.; Bancal, M.O.; Lannou, C.; Ney, B. Quantification of the effects of Septoria tritici blotch on wheat leaf gas exchange with respect to lesion age, leaf number, and leaf nitrogen status. J. Exp. Bot. 2006, 57, 225–234. [Google Scholar]
- Buerling, K.; Hunsche, M.; Noga, G. Use of blue-green and chlorophyll fluorescence measurements for differentiation between nitrogen deficiency and pathogen infection in winter wheat. J. Plant Physiol. 2011, 168, 1641–1648. [Google Scholar] [CrossRef]
- Matous, K.; Benediktyova, Z.; Berger, S.; Roitsch, T.; Nedbal, L. Case study of combinatorial imaging: What protocol and what chlorophyll fluorescence image to use when visualizing infection of Arabidopsis thaliana by Pseudomonas syringae? Photosynth. Res. 2006, 90, 243–253. [Google Scholar]
- Buschmann, C.; Bilke, S.; Butterer, A.; Enk, A.; Längle, T.; Wenzel, O.; Lichtenthaler, H.K. Einfluß von Trockenstreß auf die Photosyntheseaktivität verschiedener Ökotypen der Buche (Fagus sylvatica L.)—Unterschiede in der Trockenstressempfindlichkeit. In Berichtsreihe zum Statusseminar der Baden-Württemberg-Projektträgerschaft “Lebensgrundlage Umwelt und ihre Sicherung” (BW-PLUS), FZKA-BWPLUS 15, Diskussionskreis; Botanisches Institut II, Universität Karlsruhe: Leopoldshafen, Germany, 1999; pp. 1–12. [Google Scholar]
- Kitajima, M.; Butler, W.L. Excitation spectra for photosystem-I and photosystem-II in chloroplasts and spectral characteristics of distribution of quanta between 2 photosystems. Biochem. Biophys. Acta 1975, 408, 297–305. [Google Scholar]
- Pinto, L.S.R.C.; Azevedo, J.L.; Pereira, J.O.; Vieira, M.L.C.; Labate, C.A. Symptomless infection of banana and maize by endophytic fungi impairs photosynthetic efficiency. New Phytol. 2000, 147, 609–615. [Google Scholar] [CrossRef]
- Murchie, E.; Lawson, T. Chlorophyll fluorescence analysis: A guide to good practice and understanding some new applications. J. Exp. Bot. 2013, 64, 3983–3998. [Google Scholar] [CrossRef]
- Polder, G.; van der Heijden, G.W.A.M.; van Doom, J.; van der Schoor, R.; Baltissen, A.H.M.C. Detection of the Tulip Breaking Virus (TBV) in Tulip Using Spectral and Vision Sensors. In Proceedings of the 7th European Conference on Precision Agriculture (Precision Agriculture’09), Wageningen, NL, 6–8 July 2009; van Henten, E.J., Goense, D., Lokhorst, C., Eds.; Wageningen Academic Publishers: Wageningen, The Netherlands; pp. 219–227.
- Bauriegel, E.; Giebel, A.; Herppich, W.B. Rapid Fusarium head blight detection on winter wheat ears using chlorophyll fluorescence imaging. J. Appl. Bot. Food Qual. 2010, 83, 196–203. [Google Scholar]
- Häuser-Hahn, I. Focus on Fusarium at BCS Research & Development. Presentation at Fusariumsymposium Monheim. Available online: http://www.press.bayercropscience.com/bcsweb/cropprotection.nsf/id/FS05_FoconFusatBCSRD_EN (accessed on 20 January 2010).
- Bauriegel, E.; Giebel, A.; Herppich, W.B. Hyperspectral and chlorophyll fluorescence imaging to analyse the impact of Fusarium culmorum on the photosynthetic integrity of infected wheat ears. Sensors 2011, 11, 3765–3779. [Google Scholar] [CrossRef]
- Kang, Z.S.; Buchenauer, H. Cytology and ultrastructure of the infection of wheat spikes by Fusarium culmorum. Mycol. Res. 2000, 104, 1083–1093. [Google Scholar] [CrossRef]
- Brown, N.A.; Urban, M.; van de Meene, A.M.; Hammond-Kosack, K.E. The infection biology of Fusarium graminearum: Defining the pathways of spikelet to spikelet colonisation in wheat ears. Fungal Biol. 2010, 114, 555–571. [Google Scholar] [CrossRef]
- Förschler, A.; Portz, C.; Steiner, U.; Schmitz-Eiberger, M.; Noga, A. Minderung von pilzlichem Pathogenbefall im organischen Obstbau durch Zufuhr von Antioxidantien, Schriftenreihe des Lehr- und Forschungsschwerpunktes USL. Landwirtschaftliche Fakultät der Universität Bonn: Bonn, Germany, 2003; Volume 113, 1–41. [Google Scholar]
- Bauer, H.; Plattner, K.; Volgger, W. Photosynthesis in Norway spruce seedlings infected by the needle rust Chrysomyxa rhododendri. Tree Physiol. 2000, 20, 211–216. [Google Scholar] [CrossRef]
- Bauriegel, E.; Giebel, A.; Geyer, M.; Schmidt, U.; Herppich, W. Early detection of Fusarium infection in wheat using hyper-spectral imaging. Comput. Electron. Agric. 2011, 75, 304–312. [Google Scholar] [CrossRef]
- Bravo, C.; Moshou, D.; Oberti, R.; West, J.; McCartney, A.; Bodria, L.; Ramon, H. Foliar disease detection in the field using optical sensor fusion. Agric. Eng. Int. 2004, 6, 1–14. [Google Scholar]
- Polder, G.; Heijden, G.; Doorn, J.; Baltissen, T. Automatic detection of tulip breaking virus (TBV) in tulip fields using machine vision. Biosyst. Eng. 2014, 117, 35–42. [Google Scholar] [CrossRef]
- Polder, G.; van der Heijden, G.; Jalink, H.; Snel, J. Correcting and matching time sequence images of plant leaves using penalized likelihood warping and Robust Point Matching. Comput. Electron. Agric. 2007, 55, 1–15. [Google Scholar]
- Jalink, H.; van der Schoor, R.; Schapendonk, A.H.C.M. A Method and a Device for Making Images of the Quantum Efficiency of the Photosynthetic System with the Purpose of Determining the Quality of Plant Material and a Method and a Device for Measuring, Classifying and Sorting Plant Material. Patent WO2004040274, 13 May 2004. [Google Scholar]
- Herppich, W.B.; Foerster, J.; Zeymer, J.; Geyer, M.; Schlüter, O. Chlorophyll fluorescence image analysis for non-destructive monitoring of physiological changes in fresh and fresh-cut produce. In Environmentally Friendly and Safe Technologies for Quality of Fruit and Vegetables; Nunes, C., Ed.; Universidade do Algarve: Faro, Portugal, 2012; pp. 45–51. [Google Scholar]
- Petkova, V.; Denev, I.D.; Cholakov, D.; Porjazov, I. Field screening for heat tolerant common bean cultivars (Phaseolus vulgaris L.) by measuring of chlorophyll fluorescence induction parameters. Sci. Hortic. 2007, 111, 101–106. [Google Scholar] [CrossRef]
- Firtha, F.; Fekete, A.; Kaszab, T.; Gillay, B.; Nogula-Nagy, M.; Kovacs, Z.; Kantor, D.B. Methods for improving image quality and reducing data load of NIR hyperspectral images. Sensors 2008, 8, 3287–3298. [Google Scholar] [CrossRef]
- Chen, Y.R.; Chao, K.L.; Kim, M.S. Machine vision technology for agricultural applications. Comput. Electron. Agric. 2002, 36, 173–191. [Google Scholar] [CrossRef]
- Mahlein, A.K.; Steiner, U.; Dehne, H.W.; Oerke, E.C. Spectral signatures of diseased sugar beet leaves. In Proceedings of the 7th European Conference on Precision Agriculture (Precision Agriculture’09), Wageningen, NL, 6–8 July 2009; van Henten, E.J., Goense, D., Lokhorst, C., Eds.; Wageningen Academic Publishers: Wageningen, The Netherlands; pp. 271–278.
- Nieuwenhuizen, A.; Hofstee, J.; van de Zande, J.; Meuleman, J.; van Henten, E. Classification of sugar beet and volunteer potato reflection spectra with a neural network and statistical discriminant analysis to select discriminative wavelengths. Comput. Electron. Agric. 2010, 73, 146–153. [Google Scholar] [CrossRef]
- Devadas, R.; Lamb, D.W.; Simpfendorfer, S.; Backhouse, D. Evaluating ten spectral vegetation indices for identifying rust infection in individual wheat leaves. Precis. Agric. 2009, 10, 459–470. [Google Scholar] [CrossRef]
- Shahin, M.A.; Symons, S.J. Detection of Fusarium damaged kernels in Canada Western Red Spring wheat using visible/near-infrared hyperspectral imaging and principal component analysis. Comput. Electron. Agric. 2011, 75, 107–112. [Google Scholar] [CrossRef]
- Williams, P.; Manley, M.; Fox, G.; Geladi, P. Indirect detection of Fusarium verticillioides in maize (Zea mays L.) kernels by near infrared hyperspectral imaging. J. Near Infrared Spectrosc. 2010, 18, 49–58. [Google Scholar] [CrossRef]
- Peiris, K.; Pumphrey, M.; Dowell, F. NIR absorbance characteristics of deoxynivalenol and of sound and Fusarium-damaged wheat kernels. J. Near Infrared Spectrosc. 2009, 17, 213–221. [Google Scholar] [CrossRef]
- Makkai, G.; Erostyak, J.; Mesterhazy, A. Identification of Fusarium graminearum infection severity of wheat grains by digitally aided spectroscopy. Opt. Eng. 2013, 52. [Google Scholar] [CrossRef]
- Wiwart, M.; Koczowska, I.; Borusiewicz, A. Estimation of Fusarium head blight of Triticale using digital image analysis of gain. In Computer Analysis of Images and Patterns; Skarbek, W., Ed.; Publisher: Warsaw, Poland, 2001; Volume 2124, pp. 563–569. [Google Scholar]
- Dowell, F.E.; Ram, M.S.; Seitz, L.M. Predicting scab, vomitoxin, and ergosterol in single wheat kernels using near-infrared spectroscopy. Cereal Chem. 1999, 76, 573–576. [Google Scholar] [CrossRef]
- Singh, C.B.; Jayas, D.S.; Paliwal, J.; White, N.D.G. Fungal detection in wheat using near-infrared hyperspectral imaging. Trans. ASABE 2007, 50, 2171–2176. [Google Scholar] [CrossRef]
- Polder, G.; van der Heijden, G.W.M.; Waalwijk, C.; Young, I.T. Detection of Fusarium in single wheat kernels using spectral imaging. Seed Sci. Technol. 2005, 33, 655–668. [Google Scholar]
- Nilsson, H.E. Remote-sensing and image-analysis in plant pathology. Annu. Rev. Phytopathol. 1995, 33, 489–527. [Google Scholar] [CrossRef]
- Zarco-Tejada, P.J.; Ustin, S.L.; Whiting, M.L. Temporal and spatial relationships between within-field yield variability in cotton and high-spatial hyperspectral remote sensing imagery. Agron. J. 2005, 97, 641–653. [Google Scholar] [CrossRef]
- Peñuelas, J.; Baret, F.; Filella, I. Semiempirical indexes to assess carotenoids chlorophyll-A ratio from leaf spectral reflectance. Photosynthetica 1995, 31, 221–230. [Google Scholar]
- Peñuelas, J.; Gamon, J.A.; Fredeen, A.L.; Merino, J.; Field, C.B. Reflectance indexes associated with physiological-changes in nitrogen-limited and water-limited sunflower leaves. Remote Sens. Environ. 1994, 48, 135–146. [Google Scholar] [CrossRef]
- Lichtenthaler, H.K.; Lang, M.; Sowinska, M.; Heisel, F.; Mieh, J.A. Detection of vegetation stress via a new high resolution fluorescence imaging system. J. Plant Physiol. 1996, 148, 599–612. [Google Scholar] [CrossRef]
- Lichtenthaler, H.K.; Gitelson, A.; Lang, M. Non-destructive determination of chlorophyll content of leaves of a green and an aurea mutant of tobacco by reflectance measurements. J. Plant Physiol. 1996, 148, 483–493. [Google Scholar] [CrossRef]
- Baret, F.; Guyot, G.; Major, D. Coupled Fluorescence and Reflectance Measurements to Improve Crop Productivity Evaluation; Lichtenthaler, H.K., Ed.; Kluwer Academic Publisher: Dordrecht, The Netherlands, 1988; pp. 319–324. [Google Scholar]
- Muhammed, H.H.; Larsolle, A. Feature vector based analysis of hyperspectral crop reflectance data for discrimination and quantification of fungal disease severity in wheat. Biosyst. Eng. 2003, 86, 125–134. [Google Scholar] [CrossRef]
- Walther, U.; Flath, K.; Moll, E.; Prochnow, J.; Sachs, E. Methodische Anleitung zur Bewertung der partiellen Resistenz von Sorten bzw. Linien unter Berücksichtigung epidemiologischer Aspekte. Mitteilungen der Biologischen Bundesanstalt für Land und Forstwirtschaft 2000, 374, 9–25. [Google Scholar]
- Hillnhuetter, C.; Mahlein, A.K.; Sikora, R.A.; Oerke, E.C. Use of imaging spectroscopy to discriminate symptoms caused by Heterodera schachtii and Rhizoctonia solani on sugar beet. Precis. Agric. 2012, 13, 17–32. [Google Scholar] [CrossRef]
- Hehmke, M.; Dammer, K.H.; Herppich, W.B.; Hellebrand, J.; Beuche, H.; Rodemann, B. Digital image analysis for detection of head blight (Fusarium spp.) in winter wheat. In. In Proceedings of the International Symposium. Agricultural Field Trials—Today and Tomorrow, Stuttgart-Hohenheim, Germany, 8–10 October 2007; Bleiholder, H., Ed.; Grauer: Stuttgart, Germany, 2007; pp. 56–61. [Google Scholar]
- Miedaner, T.; Schneider, B. Züchtungsstrategien zur Verringerung von Ährenfusariosen und Mykotoxingehalten bei Getreide; Universität Bonn: Bonn, Germany, 2002; pp. 55–67. [Google Scholar]
- Castillejo-Gonzalez, L.I.; Lopez-Granados, F.; Garcia-Ferrer, A.; Manuel Pena-Barragan, J.; Jurado-Exposito, M.; Sanchez de la Orden, M.; Gonzalez-Audicana, M. Object- and pixel-based analysis for mapping crops and their agro-environmental associated measures using QuickBird imagery. Comput. Electron. Agric. 2009, 68, 207–215. [Google Scholar]
- Yang, F.; Li, J.L.; Gan, X.Y.; Qian, Y.R.; Wu, X.L.; Yang, Q. Assessing nutritional status of Festuca arundinacea by monitoring photosynthetic pigments from hyperspectral data. Comput. Electron. Agric. 2010, 70, 52–59. [Google Scholar]
- South, S.; Qi, J.G.; Lusch, D.P. Optimal classification methods for mapping agricultural tillage practices. Remote Sens. Environ. 2004, 91, 90–97. [Google Scholar] [CrossRef]
- Becker, B.L.; Lusch, D.P.; Qi, J.G. A classification-based assessment of the optimal spectral and spatial resolutions for Great Lakes coastal wetland imagery. Remote Sens. Environ. 2007, 108, 111–120. [Google Scholar] [CrossRef]
- Richards, J.A.; Jia, X. Supervised Cassification Techniques. In Remote Sensing Digital Image, Analysis; Springer-Verlag GmbH: Heidelberg, Germany, 1999. [Google Scholar]
- ENVI.Tutorial: Selected Hyperspectral Methods. Available online: http://www.creaso.com (assessed on 1 July 2010).
- Yuhas, R.H.; Goetz, F.H.A.; Boardmann, J.W. Discrimination among Semiarid Landscape Endmembers Using the Spectral Angle Mapper (SAM) Algorithm. In Summaries of the Third Annual JPL Airborne Geoscience Workshop; Jet Propulsion Laboratory Publication 92: Pasadena, CA, USA, 1992; pp. 147–149. [Google Scholar]
- Kruse, F.A.; Lefkoff, A.B.; Boardman, J.W.; Heidebrecht, K.B.; Shapiro, A.T.; Barloon, P.J.; Goetz, A.F.H. The spectral image-processing system (Sips)—Interactive visualization and analysis of imaging spectrometer data. Remote Sens. Environ. 1993, 44, 145–163. [Google Scholar] [CrossRef]
- Mahlein, A.K.; Steiner, U.; Hillnhuetter, C.; Dehne, H.W.; Oerke, E.C. Hyperspectral imaging for small-scale analysis of symptoms caused by different sugar beet diseases. Plant Methods 2012, 8. [Google Scholar] [CrossRef]
- Mewes, T.; Franke, J.; Menz, G. Spectral requirements on airborne hyperspectral remote sensing data for wheat disease detection. Precis. Agric. 2011, 12, 795–812. [Google Scholar] [CrossRef]
- Menesatti, P.; Antonucci, F.; Pallottino, F.; Giorgi, S.; Matere, A.; Nocente, F.; Pasquini, M.; D’Egidio, M.G.; Costa, C. Laboratory vs. in-field spectral proximal sensing for early detection of Fusarium head blight infection in durum wheat. Biosyst. Eng. 2013, 114, 289–293. [Google Scholar] [CrossRef]
- Heitefuss, R.; König, K.; Obst, A.; Reschke, M. Pflanzenkrankheiten und Schädlinge im Ackerbau; DLG-Verlag: München, Germany, 1993; p. 151. [Google Scholar]
- Gitelson, A.A.; Gritz, Y.; Merzlyak, M.N. Relationships between leaf chlorophyll content and spectral reflectance and algorithms for non-destructive chlorophyll assessment in higher plant leaves. J. Plant Physiol. 2003, 160, 271–282. [Google Scholar] [CrossRef]
- Lichtenthaler, H.K. Spektroskopische Eigenschaften von Pflanzen und ihre Nutzung zur Fernerkundung der Vegetation. Fridericiana 1994, 49, 25–45. [Google Scholar]
- Nicotra, A.B.; Hofmann, M.; Siebke, K.; Ball, M.C. Spatial patterning of pigmentation in evergreen leaves in response to freezing stress. Plant Cell Environ. 2003, 26, 1893–1904. [Google Scholar] [CrossRef]
- Polder, G.; van der Heijden, G.W.A.M.; Young, I.T. Spectral image analysis for measuring ripeness of tomatoes. Trans. ASAE 2002, 45, 1155–1161. [Google Scholar]
- Risius, H.; Hahn, J.; Korte, H. Die Guten ins Töpfchen—Trennung des Erntegutes nach Qualitätseigenschaften während des Mähdruschs. Neue Landwirtsch. 2008, 11, 52–54. [Google Scholar]
- Risius, H.; Hahn, J.; Korte, H. Implementation of Process Analytical Technology (PAT) for the Determination of Product Quality on a Combine Harvester. In Proceedings of the 67 International Conference on Agricultural Engineering LAND.TECHNIK Ag Eng, Hannover, Germany, 6–7 November 2009; pp. 375–380.
- Forstreuter, M.; Schröder, R.; Herppich, W.B. Chlorophyllfluoreszenzbildanalyse zur raschen Indikation des Befalls von Laub- und Nadelbäumen durch herbivore Insekten (Chlorophyll fluorescence imaging to analyse insect herbivory on broad-leaved and coniferous trees). Comput. Bildanal. Landwirtsch. Workshop 2006, 2006, 26–33. [Google Scholar]
- Csefalvay, L.; di Gaspero, G.; Matous, K.; Bellin, D.; Ruperti, B.; Olejnickova, J. Pre-symptomatic detection of Plasmopara viticola infection in grapevine leaves using chlorophyll fluorescence imaging. Eur. J. Plant Pathol. 2009, 125, 291–302. [Google Scholar] [CrossRef]
- Aldea, M.; Frank, T.D.; DeLucia, E.H. A method for quantitative analysis of spatially variable physiological processes across leaf surfaces. Photosyn. Res. 2006, 90, 161–172. [Google Scholar] [CrossRef]
- Oerke, E.; Steiner, U.; Dehne, H.; Lindenthal, M. Thermal imaging of cucumber leaves affected by downy mildew and environmental conditions. J. Exp. Bot. 2006, 57, 2121–2132. [Google Scholar] [CrossRef]
- Bravo, C. Automatic Foliar Disease Detection in Winter Wheat. Ph.D. Thesis, Katholieke Universiteit Leuven, Leuven, Belgium, February 2006; p. 258. [Google Scholar]
- Kim, D.; Cho, B.; Lee, Y. Multispectral Imaging Technique for Detection of Fungi-Infected Seed Potatoes Based on Hyperspectral Imagery. In Papers Book; Valencia Conference Centre: Valencia, Spain, 8–12 July 2012; p. C-1183. [Google Scholar]
- Davies, A.M.C.; Fearn, T. Back to basics: The principles of principal component analysis. Spectrosc. Eur. 2005, 16, 20–23. [Google Scholar]
- Gamon, J.A.; Penuelas, J.; Field, C.B. A narrow-waveband spectral index that tracks diurnal changes in photosynthetic efficiency. Remote Sens. Environ. 1992, 41, 35–44. [Google Scholar] [CrossRef]
- Weis, M.; Rumpf, T.; Gerhards, R.; Plümer, L. Comparison of Different Classification Algorithms for Weed Detection from Images Based on Shape Parameters. In Bornimer Agrartechnische Berichte; ATB: Potsdam, Germany, 2009; Volume 69, pp. 53–64. [Google Scholar]
- Bauer, S.D.; Korc, F.; Foerstner, W. The potential of automatic methods of classification to identify leaf diseases from multispectral images. Precis. Agric. 2011, 12, 361–377. [Google Scholar] [CrossRef]
- Polder, G.; van der Heijden, G.; van Doorn, J.; Clevers, J.; van der Schoor, R.; Baltissen, A. Detection of the tulip breaking virus (TBV) in tulips using optical sensors. Precis. Agric. 2010, 11, 397–412. [Google Scholar] [CrossRef]
- Moshou, D.; Bravo, C.; West, J.; Wahlen, T.; McCartney, A.; Ramon, H. Automatic detection of “yellow rust” in wheat using reflectance measurements and neural networks. Comput. Electron. Agric. 2004, 44, 173–188. [Google Scholar]
- Pflanzenschutzdienste der Länder. Brandenburg, Sachsen und Thüringen. Available online: www.tll.de/ainfo/pdf/psab0210.pdf (accessed on 9 July 2011).
© 2014 by the authors; licensee MDPI, Basel, Switzerland. This article is an open access article distributed under the terms and conditions of the Creative Commons Attribution license (http://creativecommons.org/licenses/by/3.0/).
Share and Cite
Bauriegel, E.; Herppich, W.B. Hyperspectral and Chlorophyll Fluorescence Imaging for Early Detection of Plant Diseases, with Special Reference to Fusarium spec. Infections on Wheat. Agriculture 2014, 4, 32-57. https://doi.org/10.3390/agriculture4010032
Bauriegel E, Herppich WB. Hyperspectral and Chlorophyll Fluorescence Imaging for Early Detection of Plant Diseases, with Special Reference to Fusarium spec. Infections on Wheat. Agriculture. 2014; 4(1):32-57. https://doi.org/10.3390/agriculture4010032
Chicago/Turabian StyleBauriegel, Elke, and Werner B. Herppich. 2014. "Hyperspectral and Chlorophyll Fluorescence Imaging for Early Detection of Plant Diseases, with Special Reference to Fusarium spec. Infections on Wheat" Agriculture 4, no. 1: 32-57. https://doi.org/10.3390/agriculture4010032