Article

Gradual Accumulation of Heavy Metals in an Industrial Wheat Crop from Uranium Mine Soil and the Potential Use of the Herbage

by
Gerhard Gramss
1,* and
Klaus-Dieter Voigt
2
1
Institute of Earth Sciences, Friedrich-Schiller-University, Burgweg 11, Jena D-07749, Germany
2
Food GmbH Jena, Orlaweg 2, D-07743 Jena, Germany
*
Author to whom correspondence should be addressed.
Agriculture 2016, 6(4), 51; https://doi.org/10.3390/agriculture6040051
Submission received: 17 June 2016 / Revised: 8 September 2016 / Accepted: 22 September 2016 / Published: 10 October 2016

Abstract

:
Testing the quality of heavy-metal (HM) excluder plants from non-remediable metalliferous soils could help to meet the growing demands for food, forage, and industrial crops. Field cultures of the winter wheat cv. JB Asano were therefore established on re-cultivated uranium mine soil (A) and the adjacent non-contaminated soil (C). Twenty elements were determined by Inductively Coupled Plasma Mass Spectrometry (ICP-MS) from soils and plant sections of post-winter seedlings, anthesis-state, and mature plants to record within-plant levels of essential and toxic minerals during ripening and to estimate the (re)use of the soil-A herbage in husbandry and in HM-sensitive fermentations. Non-permissible HM loads (mg∙kg−1∙DW) of soil A in Cd, Cu, and Zn of 40.4, 261, and 2890, respectively, initiated the corresponding phytotoxic concentrations in roots and of Zn in shoots from the seedling state to maturity as well as of Cd in the foliage of seedlings. At anthesis, shoot concentrations in Ca, Cd, Fe, Mg, Mn, and Zn and in As, Cr, Pb, and U had fallen to a mean of 20% to increase to 46% during maturation. The respective shoot concentrations in C-grown plants diminished from anthesis (50%) to maturity (27%). They were drastically up/down-regulated at the rachis-grain interface to compose the genetically determined metallome of the grain during mineral relocations from adjacent sink tissues. Soil A caused yield losses of straw and grain down to 47.7% and 39.5%, respectively. Nevertheless, pronounced HM excluder properties made Cd concentrations of 1.6–3.08 in straw and 1.2 in grains the only factors that violated hygiene guidelines of forage (1). It is estimated that grains and the less-contaminated green herbage from soil A may serve as forage supplement. Applying soil A grains up to 3 and 12 in Cd and Cu, respectively, and the mature straw as bioenergy feedstock could impair the efficacy of ethanol fermentation by Saccharomyces cerevisiae.

1. Introduction

The worldwide loss of cropland to expanding urban communities and their infrastructure, to mining, and to areas of industrial heavy metal (HM) and radionuclide immissions is compounded by agricultural mismanagement, land erosion, increasing salinity [1,2], and the use of As, Cd, and U contaminated phosphate fertilizers [3,4,5]. Contemporarily, industrial and energy crops subsidized in favor of greenhouse gas-avoiding decarbonisations of the economy [6,7] displace food and forage production [2]. Land contaminated by mining and metallurgy with As, Cd, Cr, Cu, Ni, Pb, U, and Zn may gradually recover by the downwash of metal-clay complexes from the plough layer to subsoil strata (clay migration) within several decades [8,9]. Reducing the soils’ aqua-regia HM load down to 90%–50% by phytoextraction with plants takes hundreds to ten thousands of years [10,11,12]. An exclusion of non-remediable metalliferous soils from farming is therefore unacceptable.
With the production of 251,000 Mg uranium from 1946 to 1990, an area of 34 km2 was depreciated in a densely populated East-German region with waste rock dumps, ore mill tailings, open pits, and subsurface mining activities [13,14]. During landscape restorations, contamination hot spots were sealed for long-term surveillance. The less contaminated sites were covered by up to 1 m of casing soil and afforested and turfed for (non)commercial use [9,15]. Local remnants of forgotten overburden soils elevated in As, Cd, Cu, Mn, Pb, U, and Zn were used to screen European crops for HM tolerance in pot and field cultures. Relative to HM excluder plants (bioconcentration factors < 1; [16]) such as bean, cereals, lupin, and maize, the herbage of potted HM sequestering plants (buckwheat, beet root species) contained up to 18-fold in trace metals. Herbage of 17 crops from uranium mine soils varied in the concentrations of As (32×), Cd (60×), Cu (5×), Ni (7×), Pb (7×), U (27×), and Zn (27×), and modified the cultivar-specific uptake of Cd by another 2.5 times [17].
The wide HM concentration spans of herbage formed in response to oversupply with soil minerals and nitrogen shrink drastically in field-grown seeds of cereals and legumes due to their strict indigenous mineral control [18,19,20,21,22,23]. Within the ears of wheat, the transfer of Zn to the grain is confined by two regulatory barriers. They are placed between the rachis and the grain, and between the grain’s outer aleurone layer of three to four cells and the endosperm [24,25]. In pea plants, the more accidental metal concentrations in the herbage experienced drastic up- and down-regulations at the pod wall/seed coat interface. A further barrier was placed between the seed coat and the embryo, both of which were separated by a post-phloem-filled apoplastic space [19,26]. In this way, mineral concentration spans of 9–109× in Cu, Fe, Mn, Ni, and Zn within a set of tested field soils shrank to spans of 1.3–2× in whole peas and wheat grains [19,27]. This narrow span marked the target concentration point of the optimized and inherent seed metallome that ensures the vigorous and metal-stress-free development of the seedling. The strict HM excluder properties on the seed level result in food and forage-compatible seed crops even from soils with phytotoxic Cd, Cu, and Zn concentrations. Thus, cereals and legumes tend to reduce the critical Cd load of food and forage seeds to the permissible range of 0.1 and 1 mg∙kg−1, respectively, fresh weight if grown on soils beyond the legislative limit of 3 mg∙kg−1 [19,27,28]. In addition, seed crops allow for essential extensions of the permissible soil concentrations in As, Cd, Cu, Mn, U, and Zn, thus reducing pressure on the quality of soil remediation [19,29]. Nevertheless, the herbage of seed crops, which is in (potential) demand by husbandry, green chemistry, and bioenergy production is not under strict HM control. Therefore, its handling needs particular attention.
The global wheat production of 670 million metric tons, for example, in 2012 [30] yields 0.8-fold biomass in straw [31] by leaving the stubbles to the croplands’ carbon cycle. Beyond the portion returned to agriculture and stock farming [32], 400 million tons of wheat straw per annum are expected to furnish the manufacturing of second-generation transportation fuel [33,34] to replace wheat grains and corn, which are presently used in bioethanol production [35]. A large spectrum of green-chemical precursors of lower MW can be derived from wheat straw by extraction and fast pyrolysis [36]. Its lignocellulose scaffold comprises 33%–40% cellulose in decay-resistant crystalline fibrils as well as 21%–26% hemicelluloses and 11%–23% lignin [32,35,37] connected by intimate structural links [38,39]. Apart from its content in HM, the key to its use as bioethanol feedstock is the cost-effective hydrolysis to its hydrocarbon monomers. The respective hexose sugars fermentable to ethanol or the gasoline surrogate, isobutanol, by microorganisms [40,41,42] are glucose as a cellulose monomer [43] and the glucose/galactose/mannose constituents of hemicelluloses [44]. Their major pentose sugars, d-xylose and l-arabinose, are not fermented [45]. Fungal cellulase mixes and beta-glucosidases [34,35,46] do not release more than 25% of the fermentable sugars that are theoretically present in the close lignocellulose complex of milled but untreated wheat straw [47]. In a hydrothermal pre-treatment, lignocellulose substrates such as timber, grasses, and straws are milled, amended with water, dilute mineral acids, alkali, or oxidizing agents and exposed to 25–260 °C at 1–12 MPa for minutes to hours [38,47,48,49,50] to break the links between carbohydrates and lignin and between the carbohydrates themselves. Hydrolase treatments are then raising the yield of fermentable sugar monomers from 70% up to >90% [47,49]. Their fermentation by yeasts such as Saccharomyces cerevisiae and (recombinant) bacteria [49,51,52] results in ethanol outputs ranging from 62 to 111 g∙kg−1 (equivalent to 78–140 L∙Mg−1) of wheat or alfalfa straw at the lab scale [35,50,52,53]. The fermentations are impaired by microbial inhibitors derived from lignin and monomeric sugars during pre-treatment [53,54,55,56]. Furthermore, elevated Cd [57,58,59] and Cu [60] loads of the lignocellulose feedstock impair the vitality and efficacy of ethanologenic microorganisms.
With the objective of expanding farming to the non-remediable metalliferous soils from uranium mining, the fact that seeds respond much less to oversupply with (toxic) soil minerals than the associated herbage [18,20,21,22,23] was used. Thus, consecutive field cultures of wheat, rye, and pea plants were established on the aged and geologically related soils that formed concentration gradients from HM hot spots to non-contaminated sites. Concentrations of Cd, Cu, Pb, and Zn in grains of the winter wheat cv. JB Asano with 40%, 40%, 46%, and 66%, respectively, and 70%, 60%, 48%, 61%, respectively, remained below those of three high-performance wheat lines and one rye cv., respectively [27], but missed the low Cd values of pea seeds [19]. The HM load and the potential use of the associated herbage had not been reported. In this study, plant samples of field-grown JB Asano were drawn at the post-winter seedling state and at anthesis and maturity from the HM hot spot soil A and the non-contaminated reference soil C. The course of mineral macronutrient and (toxic) trace element concentrations was followed from the roots via different plant sections to the grains. The goal was to record the movements of essential and non-essential minerals among the plant sections during ripening as influenced by phytotoxic soil HM concentrations. The actual HM load in different parts of the flowering and mature herbage as well as in grains was then related to their permissible (re)use in nutrition and husbandry or to their applicability as an industrial crop in HM-sensitive fermentation processes.

2. Materials and Methods

2.1. Wheat Cultivar

The winter wheat cultivar JB Asano is an A-quality crop denoted by a high 1000-seed fresh weight (FW) and an average raw protein content. An 11-ha field culture was established in fall, 2013 in Ronneburg district (Germany).

2.2. Soils

With the local inclusion of aged metalliferous overburdened soil from uranium mining into non-contaminated cropland, a gradient of geologically related soils with diminishing HM concentrations had been formed (refer to Table 1 for mineral concentrations) in the late 1960s. The clay-loam soil was derived from Permian limestone, mottled sandstone, and dolomite [61]. Plots of around 120 m2 were marked at the positions A (HM hot spot) and C (not impaired by mining) in September 2013. Shaping the test plots ensured homogeneity of ≤15% in the soil content of Ca and Mg and the main toxicants, As, Cd, Cu, and Zn, to minimize the effects of metal uptake competition. The soil mineral content was confirmed by the random collection of six soil samples per location (3 kg each) from the 20-cm plough layer in early May 2014. All the samples were analyzed independently. The soil samples A and C (sieve 0.8 mm) of pHaqu 7.26 and 6.20 contained 3.53% and 4% in Corg, respectively.

2.3. Processing Plant Samples

Duplicate sets of 70–100 plants each were randomly drawn from both 120-m2 plots on 25 February (post-winter-seedlings, 8 cm tall), 22 May (anthesis state), and 18 July 2014 (maturity). After intensive rinsing, the size and the dry weight (DW) details were determined prior to and after the dissection into roots, stems, leaves and sheaths, rachis, glumes, and grains. The duplicate samples milled for analyses (Pulverisette 14; Fritsch GmbH, Idar-Oberstein, Germany) were prepared from root and shoot tissues carefully washed with deionized water (at least 10 g in DW) and from seeds (at least 20 g in air DW).

2.4. Outwash of Straw Minerals during Simulated Hydrothermal Pre-Treatment

The leaves and upper stems of mature soil A-grown straw were milled (sieve 1.2 mm). A portion of 2 g∙DW was suspended in 20 mL of bideionized water, acidified from pH 7.3 to 3.9 with 32% HCl, and autoclaved at 121 °C for 10 min. After discarding a supernatant of 8 mL, the wet solids were washed in another 20 mL of bideionized water (total dilution 1:15 w/w) and then dried.

2.5. Mineral Concentrations in Soils and Plant Tissues

Mineral concentrations were determined for duplicate aqua regia-extracted 5 g samples of soils (sieve 0.8 mm), whereas 0.3 g samples of milled plant tissues were microwave-digested in HNO3 (4 mL) and H2O2 (1 mL) (Mars Xpress; CEM GmbH, Kamp-Lintfort, Germany) and diluted to 150 mL with bideionized water. The solutions were analyzed by Inductively Coupled Plasma Mass Spectrometry (Thermo, X series ICP-MS). The resulting detection limits (in mg∙kg−1∙DW) were as follows: 0.0005, Th; 0.002, Cd, Co, Cs, U; 0.005, Cr; 0.01, As, Mn, Pb; 0.02, Cu, Sr; 0.03,Ba, Ni, Zn; 0.04, Fe; 0.1, Al, Mg; 0.4, K, Na; 1, P; and 3, Ca.

2.6. Nitrogen Compounds

Duplicate soil samples (1–4 g∙DW) were extracted with 0.1 M∙KCl solution (1:10, w/v) at 25 °C for 1 h on an overhead shaker. The centrifuged supernatants (14,000 g, 5 min) were used to determine the NH4+ content with Aquamerck ammonium test solution (Merck, Darmstadt). The nitrate content was spectrophotometrically quantified at 210 nm (Helios Beta; Unicam UV–Vis; Cambridge, U.K.) against a blank sample reduced with copper-coated zinc granules [70] with maximum deviations of ±8% for soil replicates. Organic N in 250 mg of milled plant samples was determined with a modified Kjeldahl method by using 5 mL each of H2O2 (30%) and H2SO4 (96%) in the presence of 0.5 g Kjeldahl catalyst (Fluka).

2.7. Statistical Treatments

SPSS 8.0 software was used to calculate the standard deviations (SD) of duplicate to quadruplicate results and linear correlations, and to perform one-way analyses of variance.

3. Results

3.1. Development of the Mineral Load in Herbage from the Seedling State to Maturity

The arable soil from HM hot spot A and the non-contaminated reference soil C showed geogenically determined differences in the concentrations of Ca, Mg, and all the trace elements whereas mineral fertilizing avoided notable deviations in N, P, and K. Soil A was elevated in uranium and the gangue minerals, As, Cd, Cu, Mn, and Zn while soil C safely matched the guidelines set for cropland (Table 1). The post-winter seedlings of cv. JB Asano denoted by a 100-plant root and shoot DW of 2.14 and 13.74 g, respectively, discriminated between macronutrients and trace minerals in their modes of uptake. Compared to the mineral load of the soils A and C, concentrations in roots of the respective seedlings reached values of 3–4 times in P, 11 times in K, and 0.2–0.55 times in Ca and Mg. Additionally, shoot concentrations surpassed those in roots by another 1.6–3 times (Table 1). Deviating from the uptake mode of macronutrients, concentrations of trace elements in the seedling roots reached only 2%–24% of those in the soils A and C. They further diminished upon their transfer into the shoot (Table 1). The elevated root concentrations of 50%–140% to those in soils thereby reached the highly soluble traces of Cd and Zn [62].
At anthesis, 100-plant sets grown on the soils A and C came with 7.72 and 13.4 g in roots, respectively, and 88.3 and 172 g in shoots to DWs, respectively, which did not essentially change during further maturation, although the shoots increased by 130%. The root concentrations of Ca, Fe, Mn, Ni, and the non-essentials As, Cr, Pb, and U progressively increased from the post-winter seedling state to maturity both in soil A and soil C-grown plants to means of 292% and 304%, respectively. Anthesis-state roots fell to means of 46% (soil A) and 69% (soil C) in the essentials (Cd), Cu, K, Mg, P, and Zn due to the preceding rapid vegetative growth. Exploited differently as sink tissues of minerals for the developing grains, the elements enriched in maturing soil-A grown roots decreased to a mean of 64% and continued to fall in soil C-grown roots to 50% by supplying the 2.5-fold higher grain mineral demand in the latter case (Table 1 and Table 2). Accordingly, shoot concentrations of Ca, (Cd), Fe, Mg, Mn, Zn, and the non-essentials As, Cr, Pb, and U of soil-A grown plants fell to a mean of 20% to those in seedlings at anthesis to increase once more to 46% during maturation. Concentrations of Cu, K, Ni, and P continuously declined to 23% (Table 1).
This progressive decline to 27% of the concentrations in seedlings also denoted all Table 1 elements of soil C-grown shoots, with Cu and Cr recovering moderately during maturation. The development of the concentration spans given for soil, root, and herbage samples (values in parentheses, Table 1) also deserves attention. Relative to those of the greatly diverging soils, the concentration spans of roots, shoots, and especially those of grains predominantly tended to decline in the case of macro- and micronutrients. They remained arbitrary for non-essential elements.

3.2. Grain and Straw Yield at Maturity

Determined on the basis of randomly drawn 100-plant sets, the number and FW of grains from soil-A grown plants reached 47.7% and 39.5%, respectively, of the values for soil C-grown plants. The 1000-seed FWs from both locations differed significantly by 12% (Table 2). The straw: grain relation amounted to 0.984 for soil A- and 0.818 for soil C-grown plants cut at the root collar. A grain yield of 7.23 Mg∙ha−1 in 2014 on soil C would thus correspond with a harvest of 5.9 Mg of straw. Accordingly, straw production on soil A would come to 2.8 Mg∙ha−1 (Table 2).

3.3. Course of Mineral Concentrations Across the Sections of Mature Soil A- and Soil C-Grown Wheat

Complementing the individual concentration data of Table 3, Figure 1 unites several groups of elements with a similar mode of passage and illustrates their way from root to grain of soil A-grown wheat plants. The plotting of potassium deposits from the root via stem and rachis to the mature grain resulted in a bell-shaped curve (Figure 1a). It illustrates the reduction of excessive K concentrations in the upper herbage by a factor of 3 to make grains correspond with those from other soil A-grown wheat cvs. (Table 3). Deviating from this mode, Mg, N, and P also reached relative maxima in the upper stem and rachis. Nevertheless, a drastic up-regulation of the Mg, N, and P transfer by 177%, 600%, and 726%, respectively, at the rachis/grain interface was required to obtain minerally balanced grains (Table 3; Figure 1a). From the high concentrations of Ca and Zn in upper stem and rachis, only 7% and 11%, respectively, gained access to grains of a normal composition. The poor transfer from the high-concentrated root to the lower stem at percentages of 0.7%–12% was typical of the essential and the non-essential trace elements (Table 3; Figure 1a). Denoted by relative enrichments in the upper stem and rachis, the current concentrations were broken down to 3.2 (U) to 87% (Cr) at the rachis-grain interface to compose the final grain mineral load. Cu and Mn experienced final up-regulations to 173% and 110%, respectively (Table 3).
Figure 1b demonstrates that the curves denoting the mineral flow for the different groups of elements in mature soil C-grown plants resembled those of the soil A-crops. The topographic deviations of Figure 1b to those of Figure 1a were attributed to the fact that the root mineral concentrations, which represented the 100% reference points, were 2.3 times higher in soil A- than in soil C-grown plants (Table 3 versus Table 4). At the same time, soil A- and soil C- grown plants tried to hold the mineral resources of their grains within a narrow and identical range (Table 1). This is best demonstrated in the curves of the poorly regulable Zn. The soil A-supported concentration of 1117 mg∙kg−1 in the rachis was (insufficiently) broken down to 11% (126 mg∙kg−1) in the grain (Table 3). Due to the ‘normal’ Zn content in soil C, a drastic up-regulation of 286% was necessary to derive acceptable 27 mg∙kg−1 in the grain from the poor resources in the upper shoot (Table 4).

3.4. Putative Contributions of Sink Tissues to Grain Fill

The abating resources of minerals in the herbage from anthesis to maturity may be indicative of their gradual translocation to the emerging grains. According to Table 1, the concentrations of whole soil A-grown anthesis-state shoots surpassed those of the mature ones in K (1.2×), P (4.3×), Cu (1.4×), and Ni (1.8×). The concentrations of all the other elements ranged by factors of 0.09× (U) to 0.9× (Mg) below the mineral loads of the mature herbage. The high surplus in P was observed for all sections of the anthetic plant (Table 3, Figure 2a). Its fall to the level of the mature plant accompanied a drastic rise in grain P. This was apparently promoted by contributions of 38% from the sink tissues of all shoot sections to grain fill (Figure 2a). The relocations of K from the leaves and glumes amounted to 80% of the demand in grains. Their content of Cu and Ni could have originated from sink tissues of the whole herbage (to the amounts of 27.6% and 27.7%, respectively). In the case of Fe and Zn, like the majority of elements, the anthetic tissues had not yet reached the concentrations of the mature herbage (Table 1 and Table 3, Figure 2a) and were therefore devoid of early disposable mineral reserves in this state of development. Although their temporary role as sink tissues shall not be negated, they joined the grains as net importers of the respective elements during maturation to serve, like the roots themselves, as the final repository or dead-end sink of the minerals not required for grain fill (Table 1).
The mineral composition of soil C was not basically different from that of soil A, but it lagged the phytotoxic Cd, Cu, and Zn load (Table 1). The surplus concentrations of Ca (1.5×), Fe (1.5×), K (1.9×), Mg (2.2×), Mn (2.9×), P (6.2×), and Zn (2.7×) in soil C-grown anthetic whole shoots had disappeared in the mature herbage (Table 1) by the putative contribution of most of the plant sections to grain fill (Figure 2b). Additionally, even the roots yielded diminishing concentrations of all minerals (Table 1) to the high production of grains (Table 2). Confined to the herbage, relocations exceeded, or contributed to, the mineral demand in grains with 155% in K, 39% in Mg, 48.2% in P, 237% in Ca, −15.1% in Cu, 54.2% in Fe, 55% in Mn, and 35.2% in Zn.

3.5. Distribution of Heavy-Metal Toxicants and Macronutrients in Soil-A Grown Herbage

Figure 3 demonstrates that most of the critical HM toxicants were held to 83% in As, Cd, Pb, and Zn and to 59%, 36%, and 98% in Cr, Cu, and U, respectively by the whole straw and kept off from the grain. As determined by concentration and biomass, 45%–53% of the toxicants Cd, Cu, Pb, and Zn were associated with the stems and another 31%–40% with flag leaves and sheaths (Figure 4).
The respective order of HM extraction from the 20 cm plough layer of soil A is given in Table 5. The values are specified for roots with the adhering 12-cm stubbles, for the harvestable rest straw, and for grains. The whole plants’ HM load ranged from 0.02‰ (As, Pb) to 0.2‰–0.4‰ (Cd, Zn) of the total content in soil A. The percentage of (N), P, and K retention by stubbles in both test soils did not predominantly exceed the 10-% threshold mark (Table 6).

3.6. Leaching Heavy Metals from Mature Straw During Simulated Hydrothermal Pre-Treatment

The mature soil-A grown straw composed of upper stem and leaf tissues lost half of its mineral load during autoclaving at 121 °C combined with a 1:15 (w/w) dilution step at pH 3.9. The concentrations fell to 31%–46% (mean 39.0) in Ca, K, Mg, P, and in As, Mn, Sr, and Zn; to 49%–60% (mean 52.5) in Ba, Cd, Co, Cs, Na, and Th; and to 68%–87% (mean 76.4) in Al, Cr, Cu, Fe, Ni, Pb, and U. The phytotoxic elements diminished from (mg∙kg−1∙DW) 4.11 to 2.20 in Cd; 5.21 to 3.52 in Cu; and 1278 to 533 in Zn.

4. Discussion

4.1. Impact of Soil Heavy Metals on Performance and Mineral Flow of the Developing Wheat Crop

Non-permissible HM levels of soil A [62,63,64] were accountable for phytotoxic concentrations (Table 1; [68,69]) of Cd, Cu, and Zn in roots and of Zn in shoots of cv. JB Asano from the seedling state to maturity, as well as of Cd in the foliage of seedlings. Cadmium concentrations in the herbage violated the hygiene standards of forage (1 mg∙kg−1; [5]), whereas the high Zn load may be tolerable for monogastric livestock (500–1000 mg∙kg−1) rather than for ruminants (300–500 mg∙kg−1; [71]). The strict indigenous HM control of seeds [19,20,28,72] at least held the grains obtained from a soil of 40 mg∙kg−1 Cd to the permissible range of forage (Table 1). The roots, herbage, and seeds grown on the non-contaminated soil C persisted in the range of ‘normal plant HM concentrations’ (Table 1; [62,65]) and yielded food quality grains. In reference to these, phytotoxic effects of soil A reduced straw and grain production to 47.7% and 39.5%, respectively (Table 2). Both the quantity of grains produced as well as their inherent attempts to gain the optimum but not maximum in (organics and) minerals essential for survival and germination [27,73] coined the mineral flow across the herbage.
In the sum of macronutrients and trace elements except Zn, soil-A grains reached around 94% and 90%, respectively, of the soil C-grown seeds but were loaded up with Zn at the expense of Fe (derived from Table 1). The soil A-grown straw reached 96.4% of the soil C-grown biomass in the sum of trace elements except Zn. It dominated in the sum of macronutrients with 147% the soil-C grown straw whose partial depletion resulted from the higher rates of mineral relocations from sink tissues to the 2.5-fold higher grain biomass.
The high demand of grains in soil C treatment depleted the minerals in root and shoot, whereas the few saturated soil A grains blocked mineral drain from the respective sink tissues (Table 1 and Table 2) and depreciated them to dead-end sinks of the less essential elements in the course of maturation. The gradual (seed fill-initiated) decline of the mineral load from root to seed is common to mature cereals obtained from non-contaminated soils [74,75,76,77]. However, a declining mineral load in growing plants may also be uptake-dependent. In rice, the acquisition of Ca, K, Mg, N, and P peaked at panicle initiation (i.e., at 56% of the plants’ development) to fall in a bell-shaped curve to zero at maturity [78]. Similarly, the foliages of alfalfa and annual ryegrass showed diminishing mineral resources in later growth stages [79,80]. Maillard et al. [81] recorded growth cessation in leaves of cereals, further crops, and trees at around 40% of their life span and initiation of senescence followed by a drain of nutrients at midlife. Ageing goldenrod (Solidago gigantea Ait.) preferentially translocated KP to the perennial rhizomes [82].
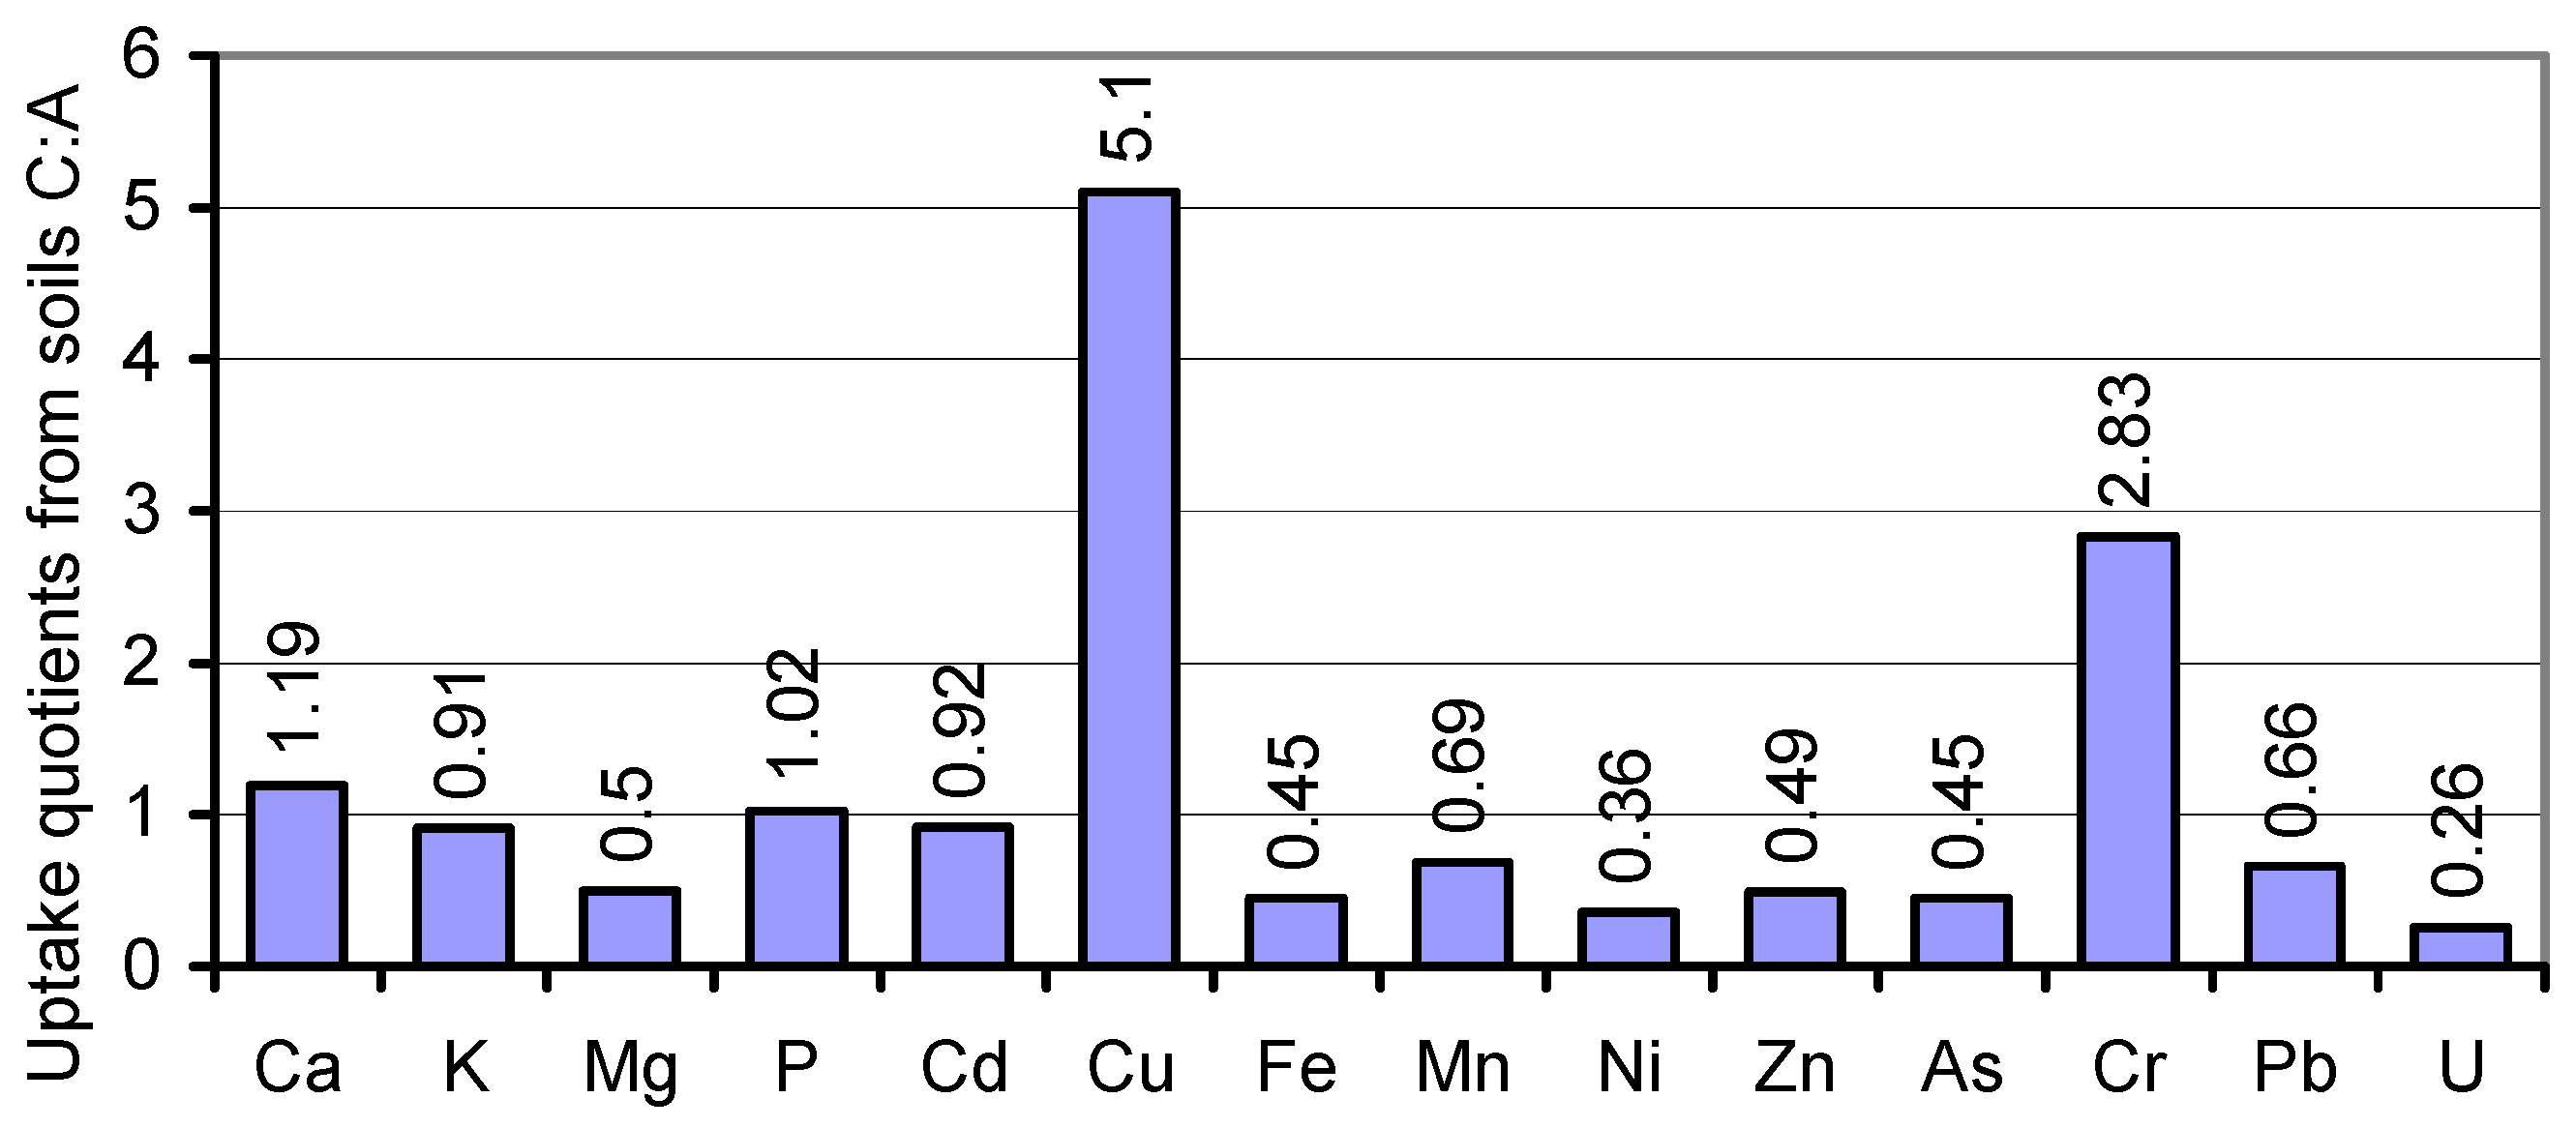
In the search for mineral uptake competitions in cv. JB Asano from the two variably composed soils A and C, we calculated the percentages of the elements per kg of the whole plant tissue (mg∙kg−1 DW) to their total content in soil. Fixing soil A percentages at factor 1, the soil uptake rates of Ca, Cd, K, and P by soil C-grown tissues coincided with those from soil A (Figure 5). Unlike Cu and Cr, Mg and most of the traces were taken up at drastically lower rates from the resources in soil C. Attempts to level the Cu and Mg content of soil A- and soil C-grown grains during seed fill in the inherently narrow span (Table 1; [27,72]) may have caused the relatively elevated and reduced respective uptake of these elements, whereas variations in the uptake rates of other elements, for example, by mechanisms of uptake competition, shall not be derived from the data. The respective conclusions for a single organism should solely be drawn from lab-scale tests on defined media rather than on polymetallic soils. Thus, the impact of elevated HM concentrations in soil on the grain content of macronutrients cannot be postulated.
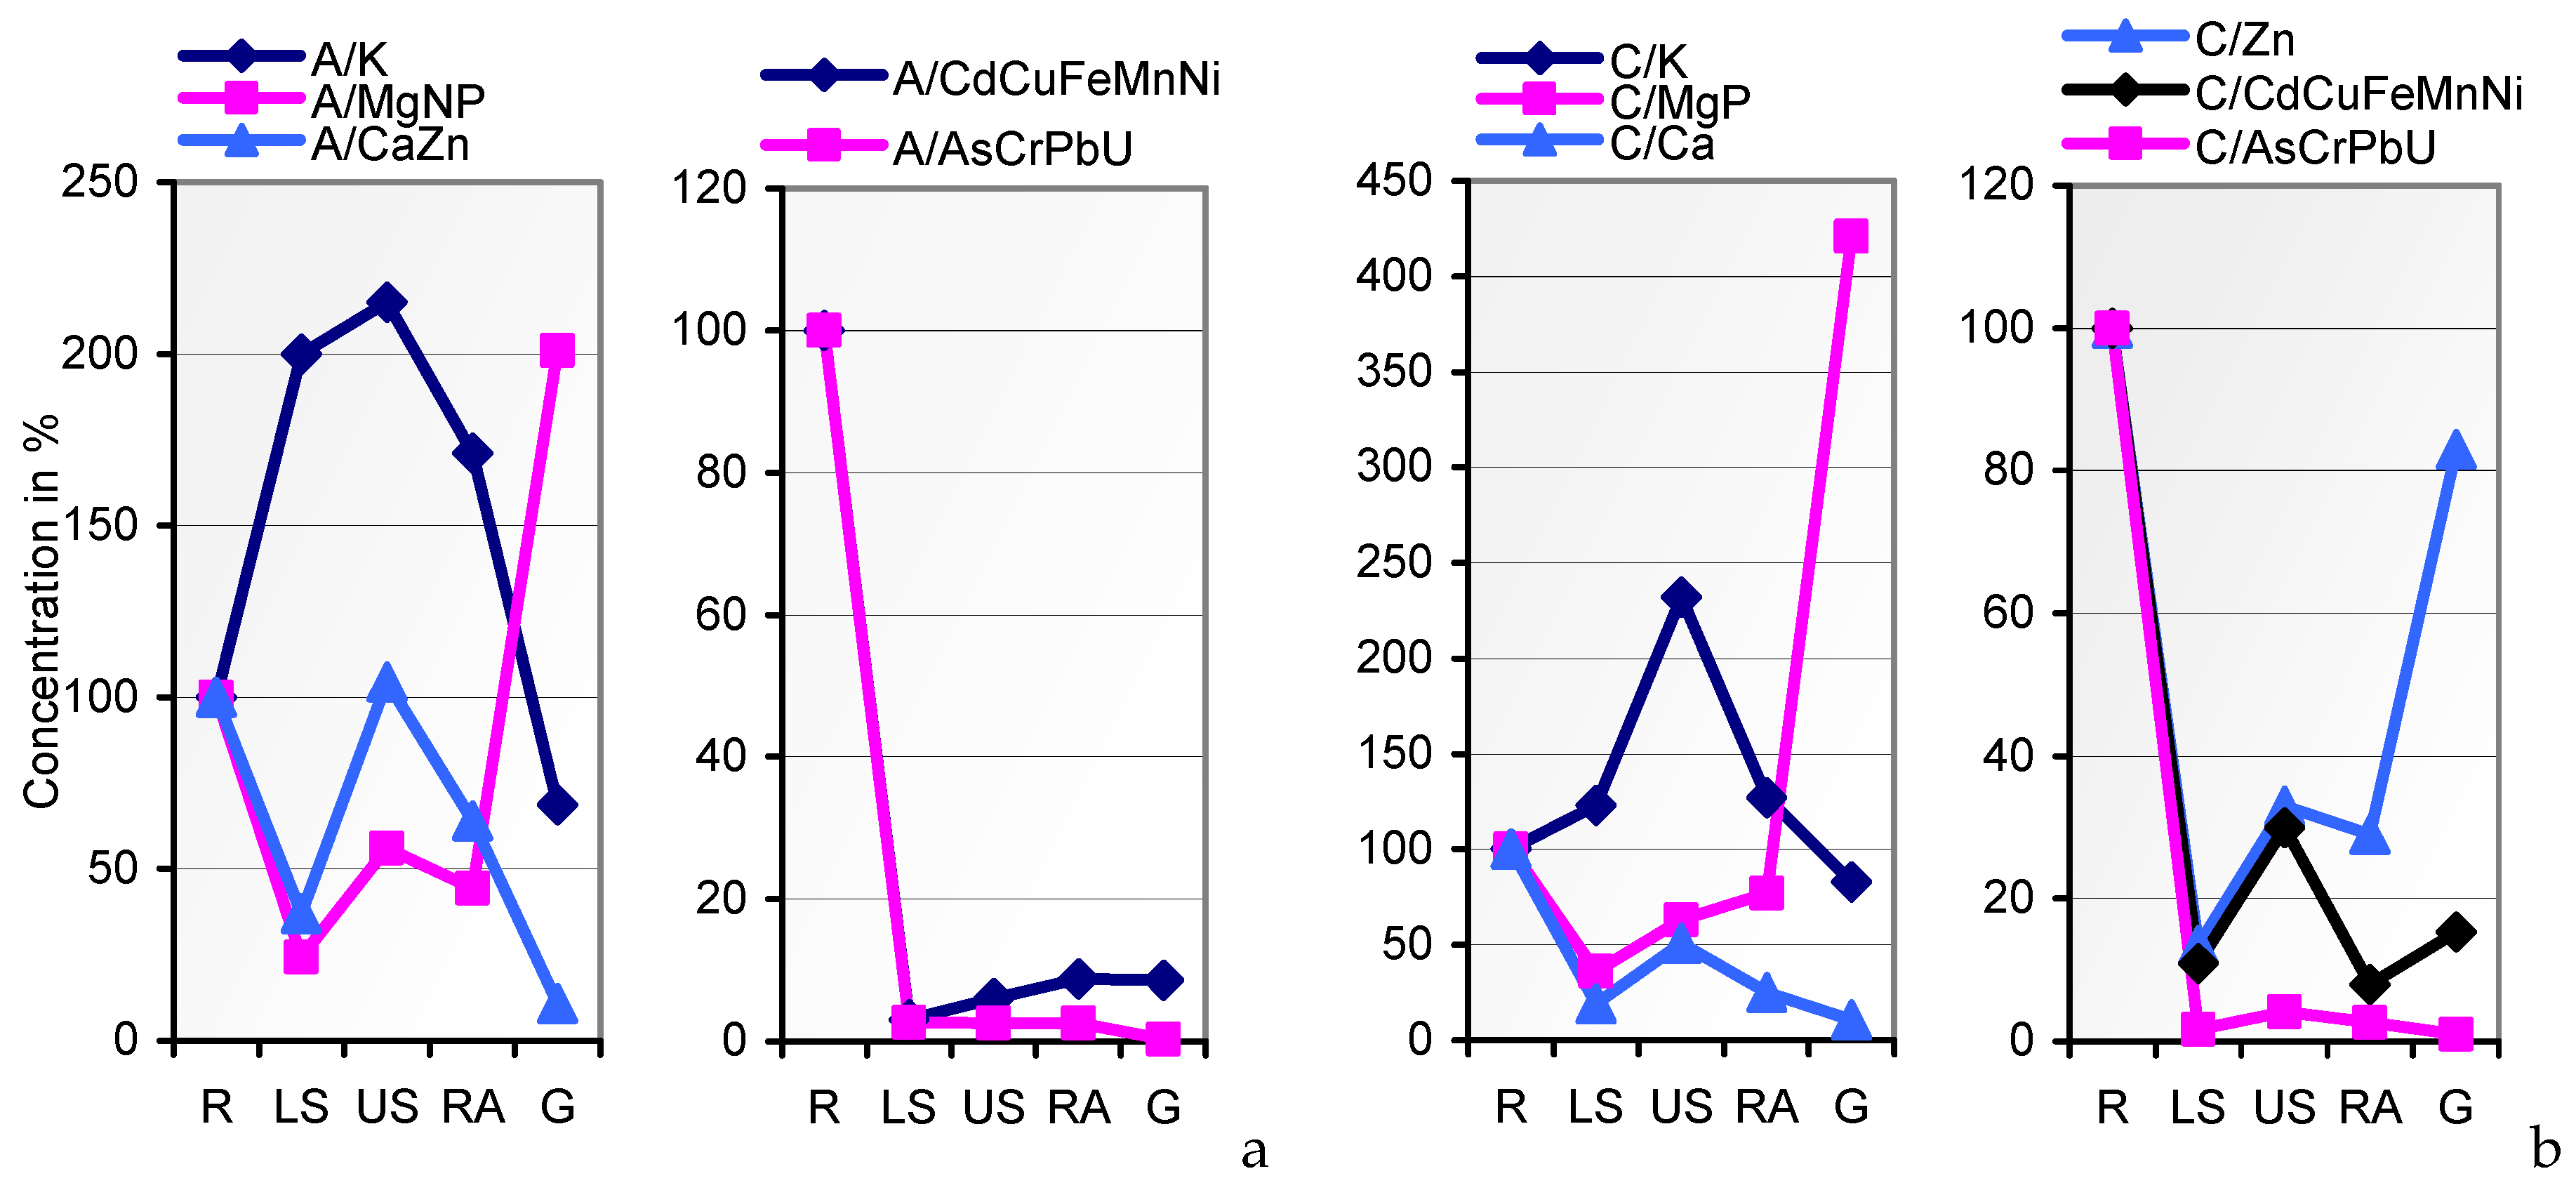
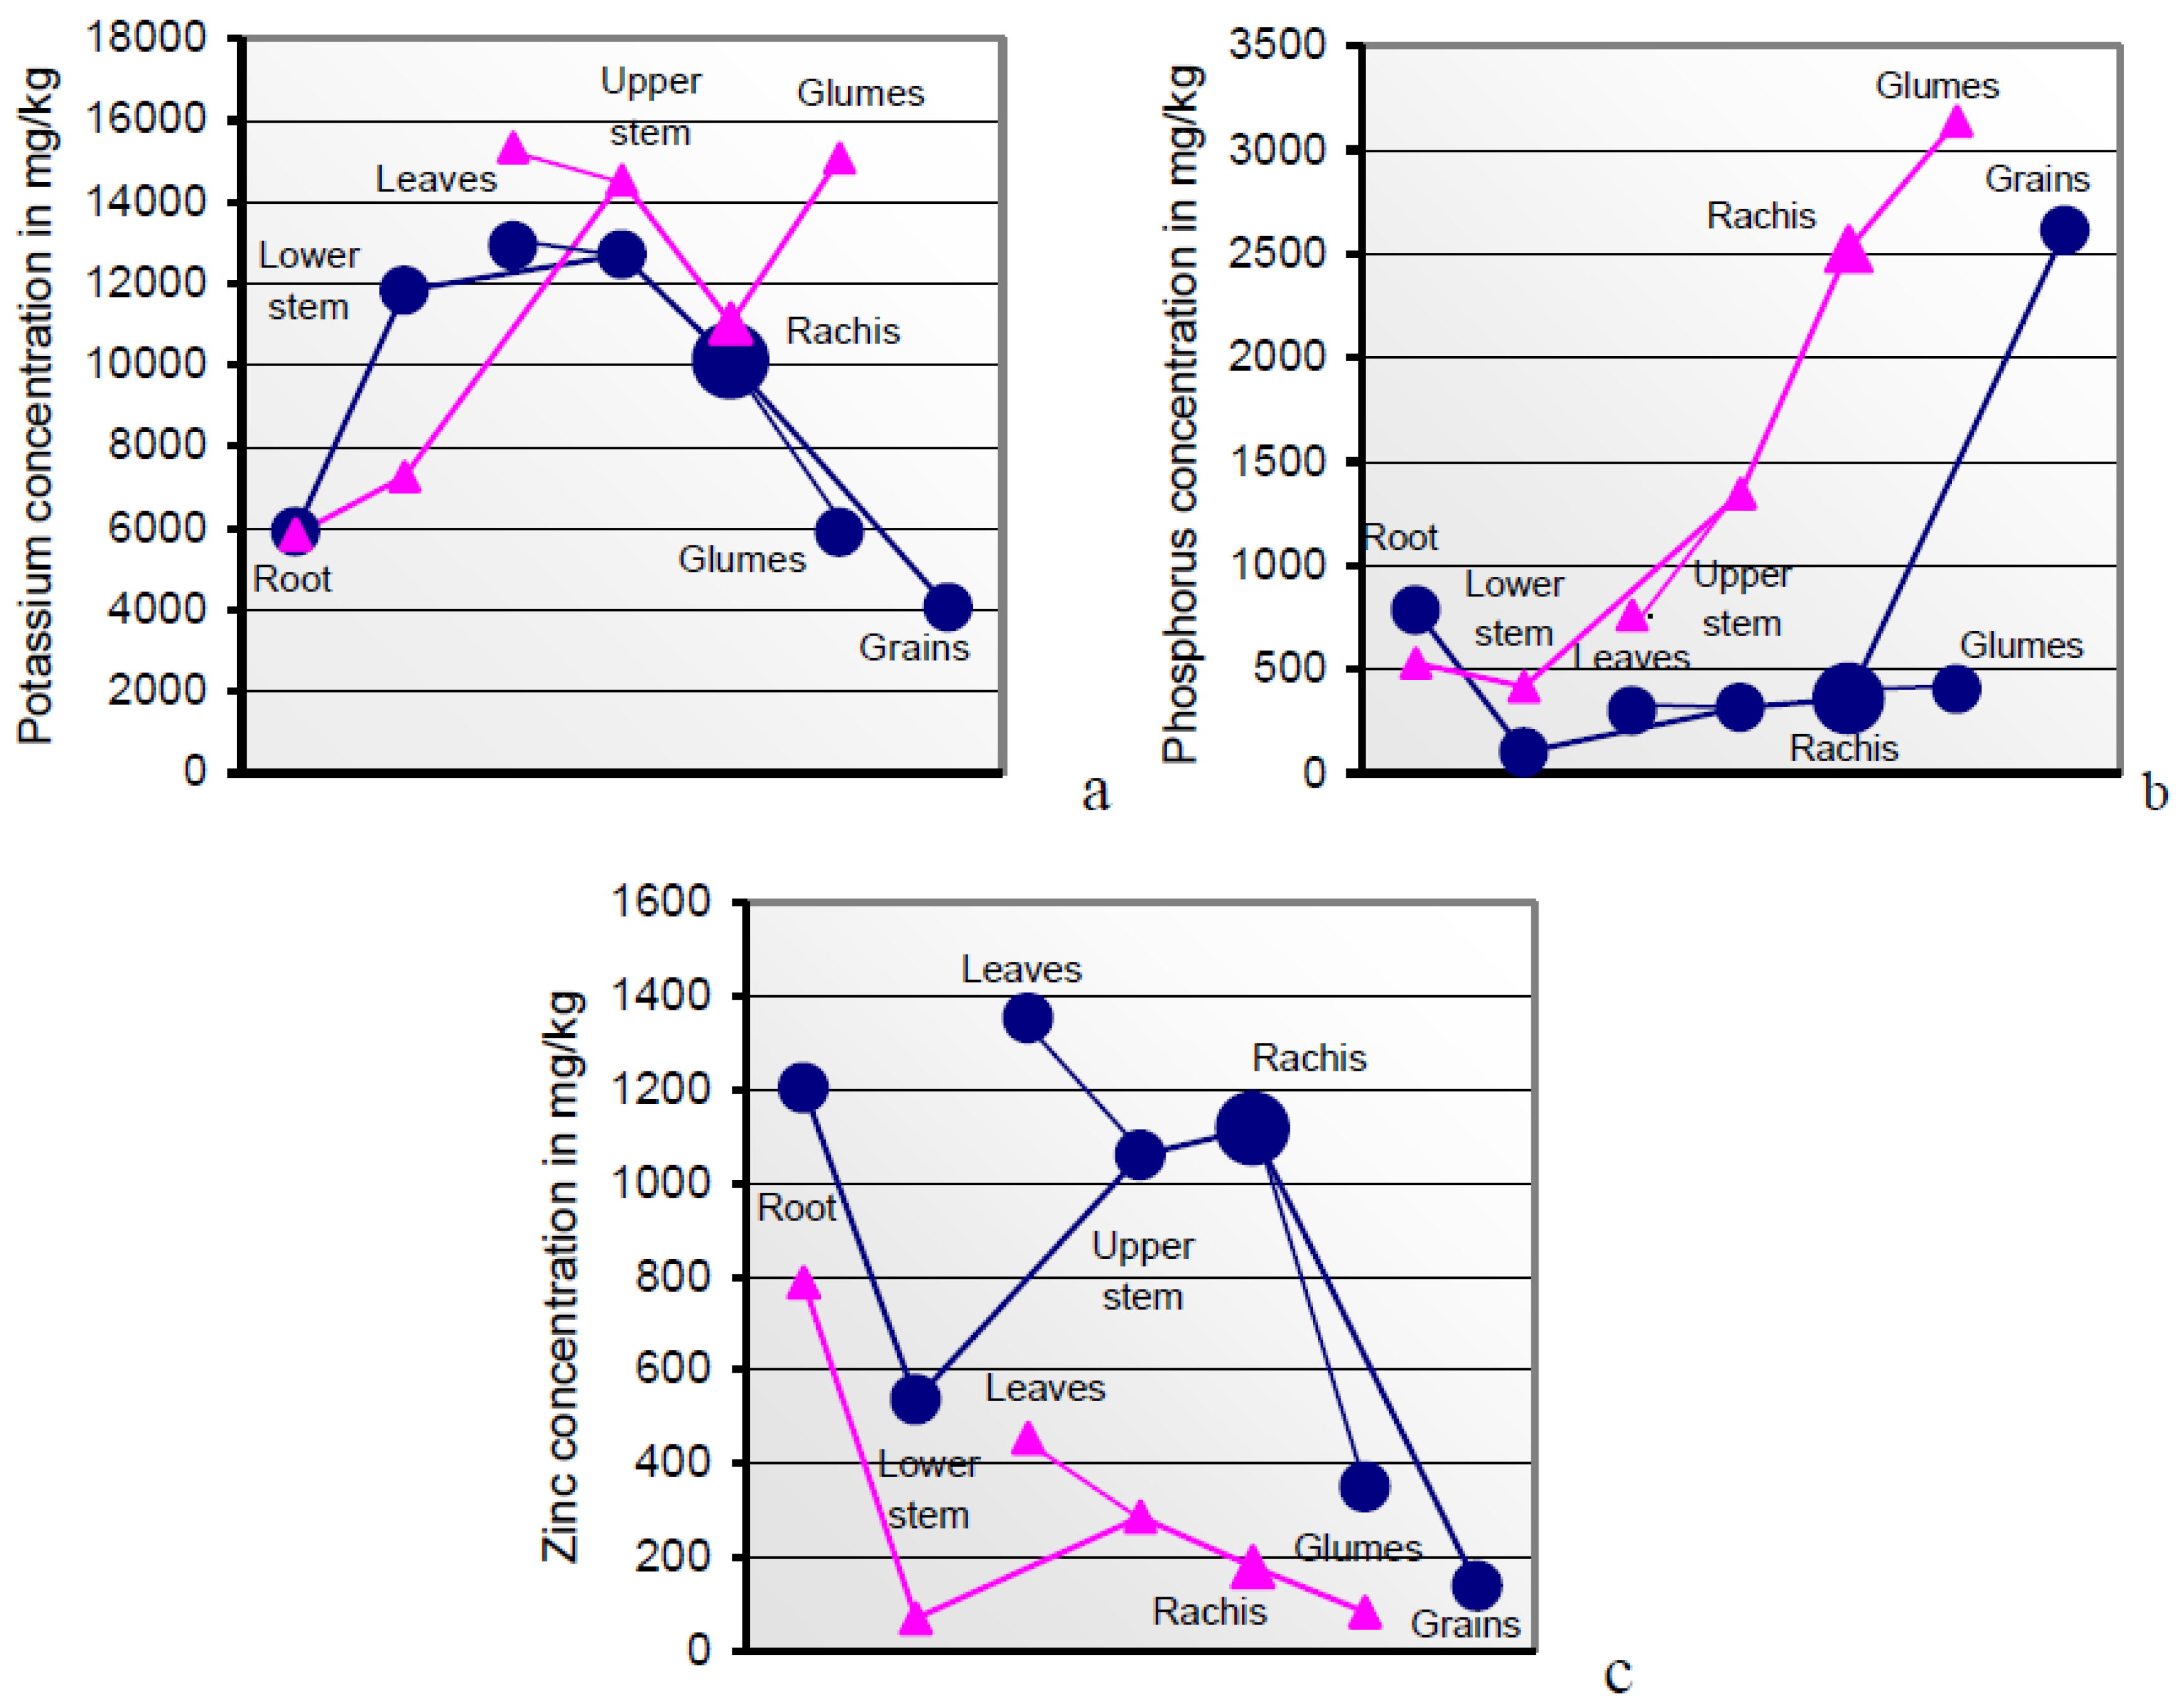
The mineral loads arrested in the sections of root, lower/upper stem, and rachis of the mature soil A-grown plant deviated drastically from those of the grain in a manner that is poorly accessible to interpretations. Severe incisions into the flow of all the minerals except K occurred at the root/lower stem interface (Table 3; Figure 1a). The concentrations predominantly rising in the upper shoot were once more dramatically down- or up-regulated at the extremely versatile rachis/grain interface in more or less successful attempts to realize the inherent seed target metallome of the cultivar [19,20,21,72]. Unlike the herbage, grains respond least to changes in agronomic conditions and the supply with soil minerals [83,84,85] and nitrogen [18,23], and they stabilize their metallome inherently in a narrow range [21,23,27]. This was also reported for the Fe and Zn content of soybean [22], rice [21], and pea plants [20], although the respective concentrations in vegetative tissues rose drastically. Similarly, variable regimes of fertilization had little impact on the seed content of fatty acids and cellulose in peanut [86], of amino acids, sugars, and phenolics in pea plants [19,87], and of starch and proteins in maize [88]. Raising the Norg content in shoots of Chinese cabbage (Brassica chinensis L.) to the 3.4- to 3.7-fold of water-treated plants by NH4Cl application resulted in near-linear increases in the sum of the metalloprotein-associated transition metals, (Cd), Co, Cu, Mn, Ni, and Zn but not of Fe to 3.6- to 3.7-fold. Contributions of the individual elements ranged from 2.5× (Co, Cu, Ni) to >4× (Cd, Mn, Zn). Concentrations in Ca and Mg with their structural, metabolic, and enzyme regulatory functions [89,90] reached 2-fold. Concentrations in the sum of Fe, K, Na, V, and a group of non-essential metals did not exceed 1.1- to 1.2-fold as the individual contributions of Cr, Fe, and V diminished (to 0.45–0.75×) whereas those of Al, Ba, K, Li, Pb, Sr, Ti, and U slightly increased (to 1–1.8×) [91]. The protein (Norg) content in grains from soil A ranged below that of the comparable reference grains (Table 3) and could be partly responsible for their lower mineral load. Peterson et al. [92] postulate the uptake promotion of Ca, Cu, Fe, Mg, Mn, P, S, and Zn but not of Cl and K by rising grain protein.
Table 4 and Figure 1b document the congruity in the mode of mineral distribution and management in soil A- and soil C-grown plants. Therefore, the grains coincided with the widest in the content of macronutrients as well as in Cu and Fe (Table 1) as shown by the narrow concentration spans around the inherent target level (values in parentheses). The corresponding concentration spans in soils and wheat grains amounted to, for example, 3.15 and 1.49 in Ca, respectively, 7.5 and 1.08 in Cu, respectively, 25 and 3.69 in Zn, respectively, but 32 and 24, respectively, in the less compensable Cd [27].
In wheat grown on Tunisian mine tailings, soil, shoot, and grain concentrations varied by 27, 49, and 13× in Pb, respectively; 420, 43, and 30× in Cd, respectively; and 97, 35, and 2.4× in Zn, respectively [83]. The field pea cv. Rocket responded to soil concentration spans of macro- and micronutrients in the range of 4.6 (Ca) to 109 (Zn) with variations of 1.31–2.40×, and to 475× in soil Cd with 15.9× in seeds [19]. Hundreds of spelt wheat genotypes were grown at six locations in Turkey over three years. Notwithstanding large differences in their individual mineral uptakes, the median-value variations in grain protein and Ca, Cu, Fe, K, Mg, Mn, P, S, and Zn across all accessions ranged from as little as 1.16× (K) to 2.02× (Ca) [85].
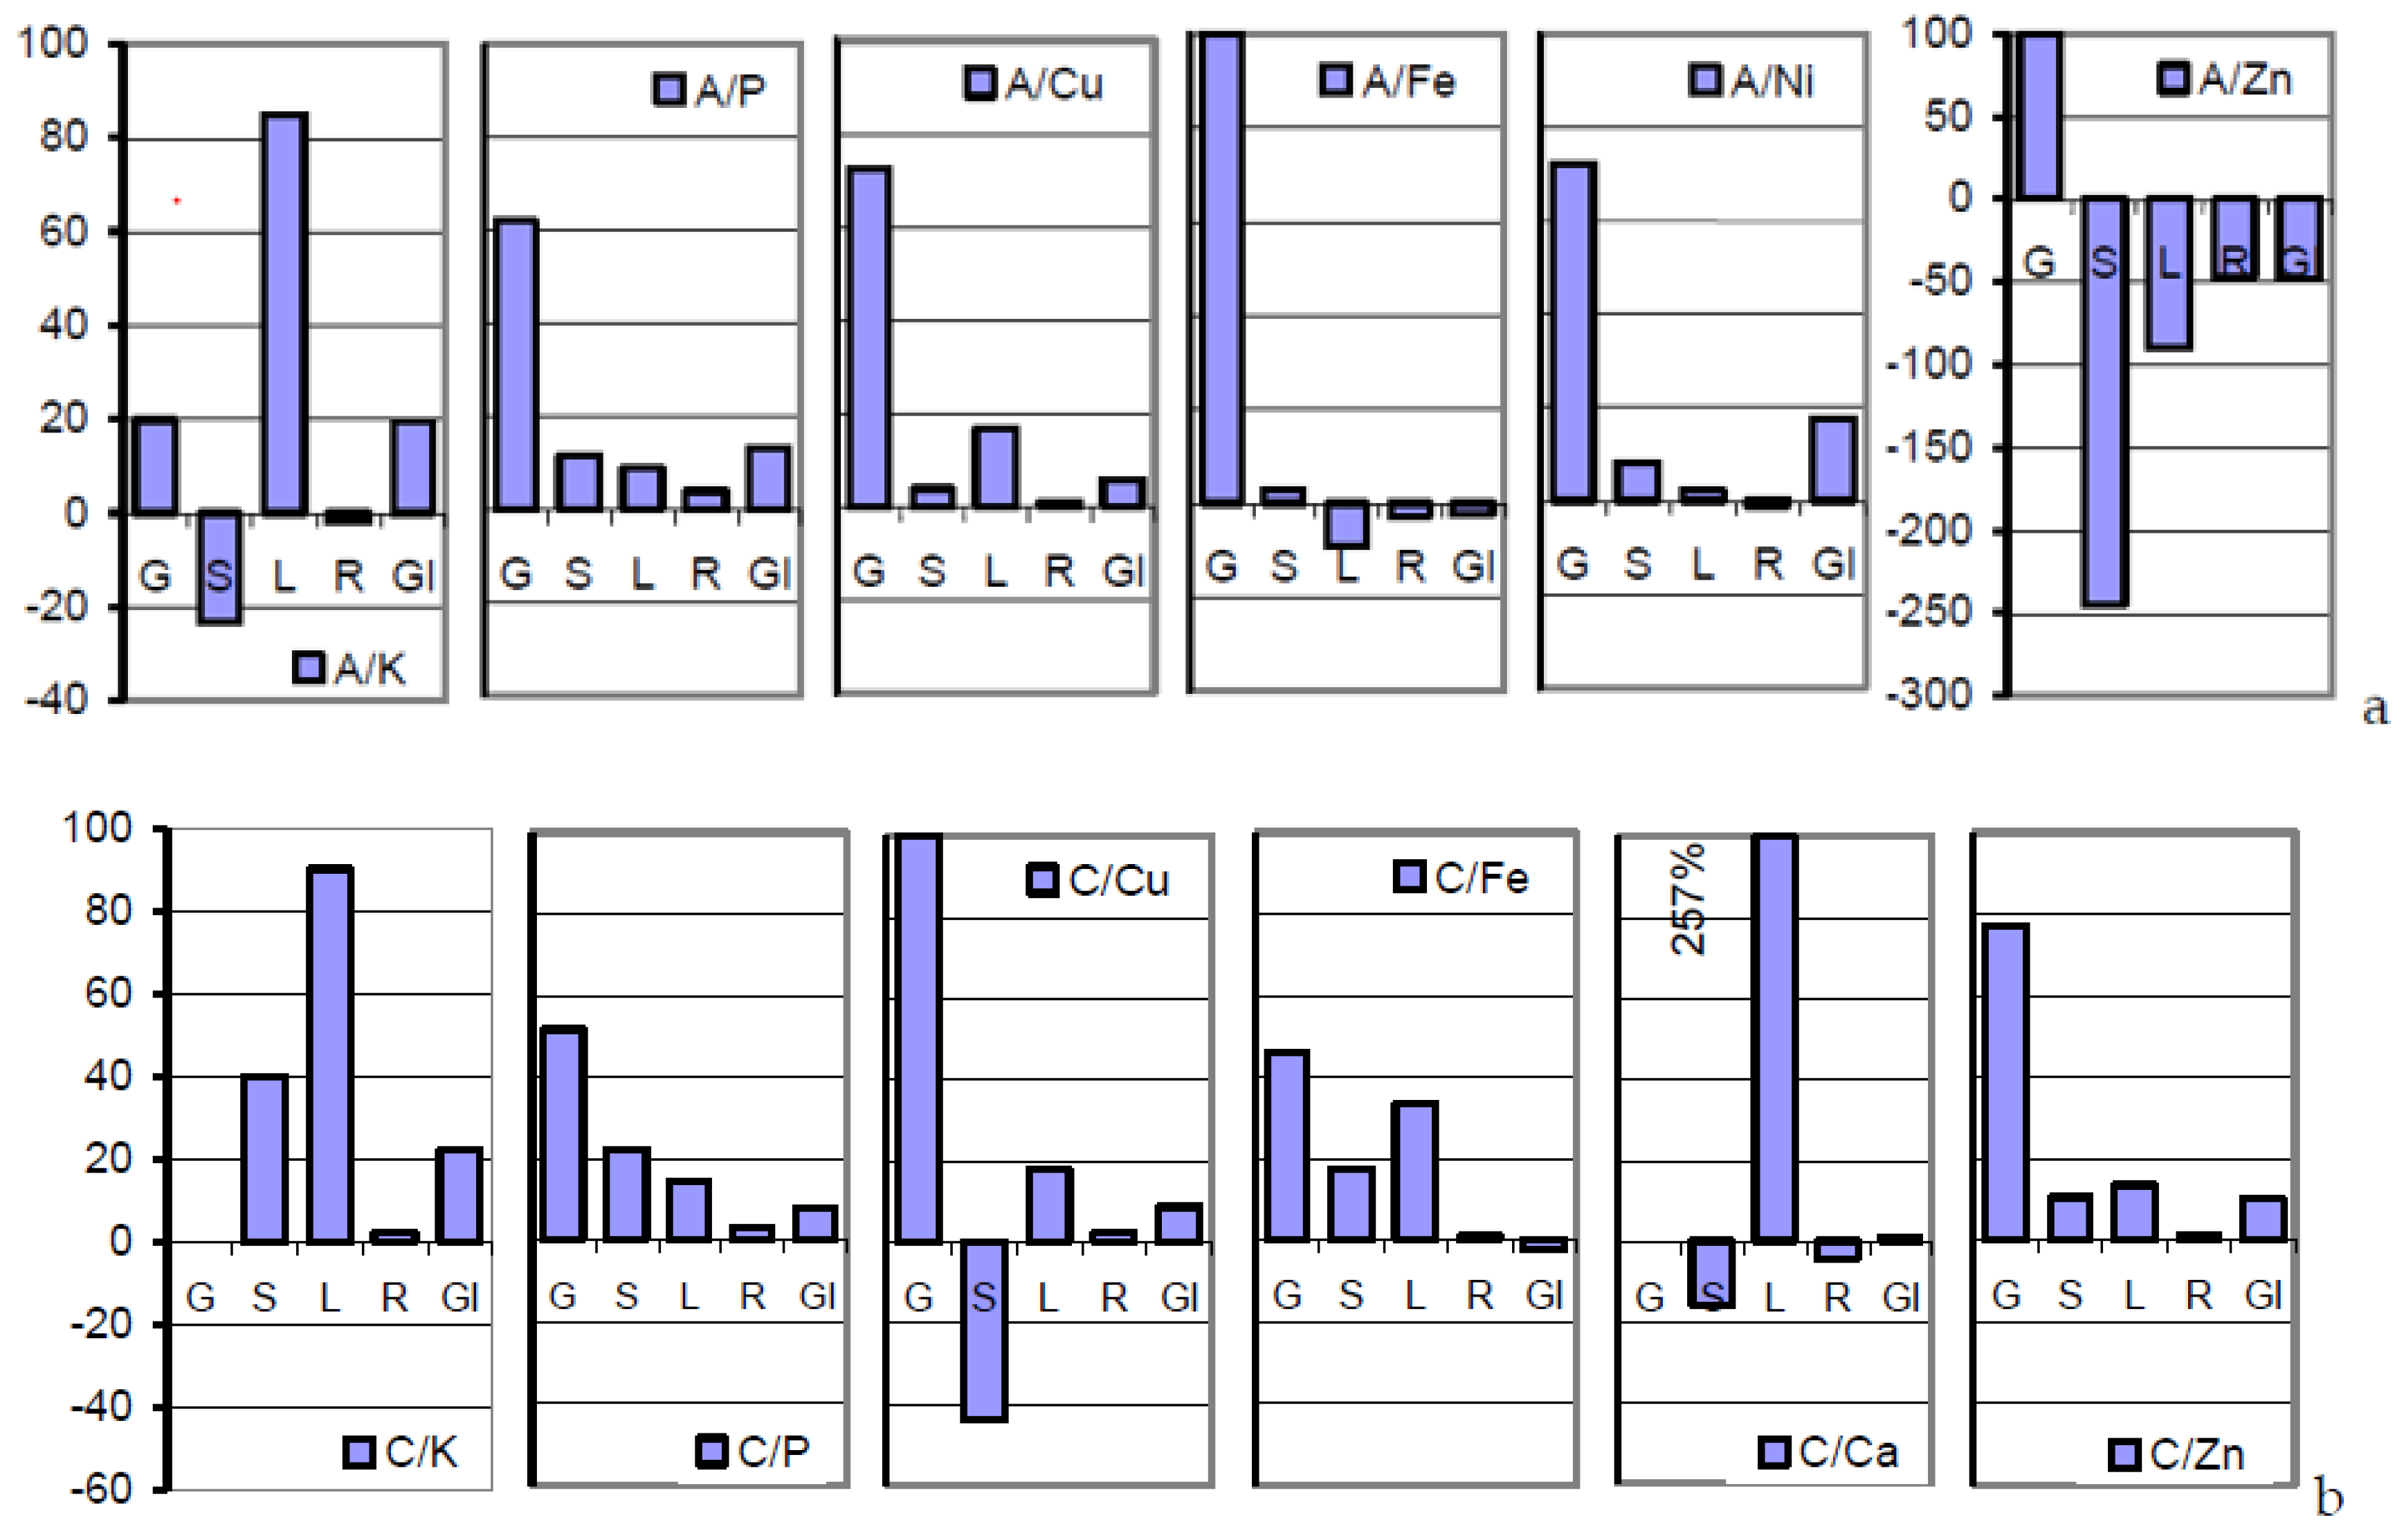
Higher resources in anthetic than in mature plant sections indicate mineral relocations from the gradually senescing sink tissues of the post-midlife herbage [81] to the phloem-fed grains, superimposed by rapidly diminishing mineral uptake rates from the soil [78]. Flag leaves with internodal sheaths and glumes were the sink tissues with the highest mineral concentrations (Table 3 and Table 4; Figure 2 and Figure 6). Sucrose and potassium are the major osmotic species [93] to move the phloem sap via differences in the hydrostatic pressure from the donor tissues to the grains [94].
It is part of the plant’s strategic and analytical top performance to identify the individual organic and mineral phloem constituents and to translocate them in delimited quantities to the grain in realizing its genetically pre-determined composition [72]. The cytoplasm strands in sieve tubes actively capture the single phloem constituents in congruence with the current plant metabolic state [90]. The Figure 6a–c illustrate the order of surplus concentrations of K, P, but not Zn, across anthetic to mature sections of soil A-grown plants. Interestingly, the plant safely distinguishes between both the rachis-borne structures of grains and glumes in their roles as sink and source tissues.

4.2. Applicability of the Herbage from the Metalliferous Soil A

Compared to the herbage from soil C, the Cd, Cu, and Zn phytotoxicity of soil A reduced the harvestable biomass in cv. JB Asano to 40% and the total uptake of K and P from soil proportionally to 46% 33%, respectively (Table 6). N, P, and K concentrations of the harvestable straw from both soils (Table 6) corresponded the widest with the values reported for K (6.7–11.6 kg∙Mg−1∙DW); P (0.38–1.3); and N (5) [32,95,96,97]. Contaminations of 1.69–4.24 mg∙kg−1 DW in Cd and up to 1353 in Zn of the mature soil-A grown straw (Table 1 and Table 3) exclude its use as bedding material or roughage supplement to domestic animals [5,71]. This rule must not apply to the premature herbage. The Cd load of the (post-)winter herbage as well as of the soil itself is a serious hazard to winter grazing and thereby soil ingesting local herbivores (Table 1; [12,98,99]). Nevertheless, the rapidly growing green matter in the pre-tillering to the post-anthesis state shows a temporary and significant decline in the critical toxicants As, Cd, Cr, Pb, U, and Zn (Table 1) and could potentially serve as a roughage supplement for the domestic livestock. This is supported by the facts that wheat herbage in the predominantly leafy and anthesis states varied in crude protein (24.4% and 11.8% of DW, respectively), hemicellulose (17.9 and 31.5, respectively), cellulose (18 and 27.3, respectively), lignin (1.9 and 4, respectively), and thus in digestibility (74.7 and 68.3, respectively) [100]. Similarly, the metabolizable energy (ME) in the herbage cut at flowering, milk or dough stage, and maturity was 9, 8, and 7–8 MJ∙kg−1∙DW in oats and 8, 8, and 6–7 MJ∙kg−1∙DW in wheat, respectively [101].
Returning the mature soil A-grown herbage to the cropland may be less problematic. In the sum of As, Cd, Cr, Cu, Pb, and U, and Zn (individually), 33.8 and 461 g ha−1, respectively, came to roots and stubbles, 9.85 and 1927, respectively, to the entire harvestable rest straw, and, for comparison, 15.6 and 308, respectively, to the grains (Table 5; Figure 3). Processing the straw to biochar [102,103] may prevent the excessive propagation of mineral-immobilizing and nitrogen-binding microorganisms in alkaline soils while its positive effects on crop production of temperate zone soils are contested [104]. Apart from mineral losses by volatilization during straw combustion at 400–800 °C [96], 3.08 mg∙kg−1 DW of Cd in the mature soil-A grown straw (Table 1) would account for only 0.03‰–0.06‰ of the ash content reportedly ranging 4.65%–9.9% per∙DW [32,35,96,105]. In proportion to the macronutrients, Cd came to 11,280 mg∙per∙kg∙P, to 282 per∙kg∙K, and to 786 per∙kg∙N (refer to Table 1). Comparable values for the root biomass amounted to 37,500 in P, 4975 in K, and 2673 in N. Ashed soil-A grown herbage is therefore no NPK fertilizer. Commercial high-purity mineral P fertilizers of 7–33 mg∙Cd per∙kg∙P2O5 constitute 16–75 mg∙Cd∙per∙kg∙P and are surpassed by values of 220–570 mg∙Cd∙per∙kg∙P in other products [8,106].
One can accept the use of the Cd-contaminated wheat straw in rates of 15%–45% as bulking material in the vermicomposting of sewage sludge (e.g., [107]). Renouncing its use as a soil structure-improving material, however, does not really contribute to soil remediation. Consecutive wheat crops of 1070 years (Zn), 2400 (Cd), and 28,400 years (Pb) were necessary to capture 50% of the HM load of soil A by the whole plant (including roots) under the conditions of stable uptake rates (Table 5). This corresponds with similar calculations [10,11,12]. True soil remediation effects may come from the gradual downwash of mineral-clay complexes from the plough layer to subsoil strata [8,9]. Uranium waste rock deposits restored and turfed 30–35 years ago were initially treated with liquid manure and husbandry composts which released metal cation ligands and motile organic colloids. Across 34 test plots, the re-distribution of As, Cd, Co, Cr, Cu, Ni, Pb, U, and Zn resulted in mean concentrations of 108, 158, and 187 mg∙kg−1 DW in the 0–3-cm sward layer, the 4–20-cm (plough) layer, and the 21–50-cm subsoil, respectively. In test plots not impaired by soil compaction and pseudogley formation, the ratings from the 0–3 cm sward layer, the 4–20 cm (plough) layer, and the 50–80 cm subsoil came to, for example, 42, 66, and 190 mg∙kg−1∙DW, respectively, in As; 3.6, 4.8, and 23.5, respectively, in Cd; 31, 41, and 111, respectively, in Pb; and 459, 725, and 4104, respectively, in Zn with means of 76, 116, and 577, respectively, across all the elements [9,108].
The HM load of the soil A-grown herbage does not interfere with the extraction of green chemicals [36,109]. However, the fungi used in the preparatory delignification of the biomass feedstock for bioethanol production face the full toxicity of internal HM. The resulting oxidative stress leads to the damage of cellular biomolecules such as DNA, lipids, and proteins by reactive oxygen species and may result in cell death [110,111,112] and restrictions in mycelial growth, enzymatic activity, and the rate of substrate conversion [113,114,115]. Toxicity effects of Cd as pronounced in liquid media drastically diminish in the presence of soils, organic matter, and high concentrations of dissolved salts [116]. In the solid-state fermentation of rice straw with the basidiomycete Phanerochaete chrysosporium, Cd halved the activities of lignin peroxidase at 4 mg∙kg−1 DW and of manganese peroxidase at 6 mg∙kg−1; it also halved the degradation of lignin at 16 mg∙kg−1, and of cellulose and hemicellulose at about 32 mg∙kg−1 [115]. The weight loss of straw incubated with P. chrysosporium was optimum at Pb concentrations of 30 mg∙kg−1, but proceeded, too, at 400 mg∙kg−1 [117]. The colonization of non-sterile soil by the basidiomycete Pleurotus ostreatus reached limits at concentrations of 50–100 mg∙kg−1 DW in Hg and 100–500 mg∙kg−1 in Cd [113]. An A-type soil lot of 41 mg∙kg−1∙DW in Cd, 156 mg∙kg−1 in Pb, and 3320 mg∙kg−1 in Zn enabled normal mycelial growth and fructification by the lignicolous basidiomycetes Hypholoma fasciculare, Kuehneromyces mutabilis, and P. ostreatus [118]. Lignocellulose fermenting fungi should therefore tolerate the full but moderate HM load of the soil-A grown wheat straw, whereas drastic HM dilution steps precede its use as feedstock in current bioethanol fermentation experiments at lab scale.
The preferred Simultaneous Saccharification and Fermentation (SSF) technology includes the hydrothermal pre-treatment at elevated temperature and atmospheric pressure predominantly in solid-liquid proportions of 1:10 (w/w) followed by the washing and drying of the solids. In the subsequent breakdown of cellulose and hemicellulose by commercial hydrolase enzymes and the concomitant microbial transformation of the liberated fermentable hexose sugars to ethanol, solid-liquid proportions of 1:10 to 1:20 are reported in the incubation media (e.g., [35,37,48,52]). According to Le et al. [119], the retention of minerals in the hydrothermally pre-treated lignocellulose is dependent on pH, temperature, and treatment time. Initial pH values of 2–4 made Ca, K, Mg, Mn, P, and Zn levels fall to less than 20% by DW whereas Al, Cu, Fe, and Si concentrations did not change. These data match the widest with those obtained by experimental autoclaving of soil A-grown straw at 121 °C which was combined with a 1:15 dilution step at pH 3.9 (Section 3.6). The treatment rendered the concentrations of the phytotoxicants Cd, Cu, and Zn non-critical.
The enzymatic hydrolysis of the pre-treated lignocellulose structures could promote release of the residual HM resources into the liquid incubation medium. Baker’s yeast (Saccharomyces cerevisiae) as the preferred ethanologenic organism experienced 5% and EC50 growth inhibition in solution at 0.11 and 1.12 mg∙L−1, respectively, in Cd; 55 and 96 mg∙L−1, respectively, in Mn; 59 and 117 mg∙L−1, respectively, in Ni; and 65 and 163 mg∙L−1, respectively, in Zn during 12 h of incubation [57]. The yeast exposed to 10 mg∙L−1 Cd was temporarily inhibited to regain an almost normal growth rate [120] apparently owing to its biosorption capacity in the order of 45 mg Cd2+ per gram of biomass within 2 h [121]. Exposure to Cu reduced the viability of the yeast cells to 88% at 0.32 mg∙L−1 within 1 h and to 11% at 2.54 mg∙L−1 within 5 min [60]. Incubation at 30 °C for 24 h reduced the number of viable yeast cells from 18 × 109 per gram to 5–12 × 109 in the presence of 25 mg∙L−1 Pb, and to 4–8 × 10⁹ in the presence of 10 mg∙L−1 Cd [58]. Adding 50 µM Cd (5.6 mg∙L−1) to a glucose/yeast extract medium reduced ethanol production by S. cerevisiae from 25 to 2 g∙L−1 within 10 h. Ethanol formation was not impaired even at 1 mM∙Cd in the medium if its uptake was competitively repressed by Ca2+ supplements at the molar ratio of 50–100:1 [
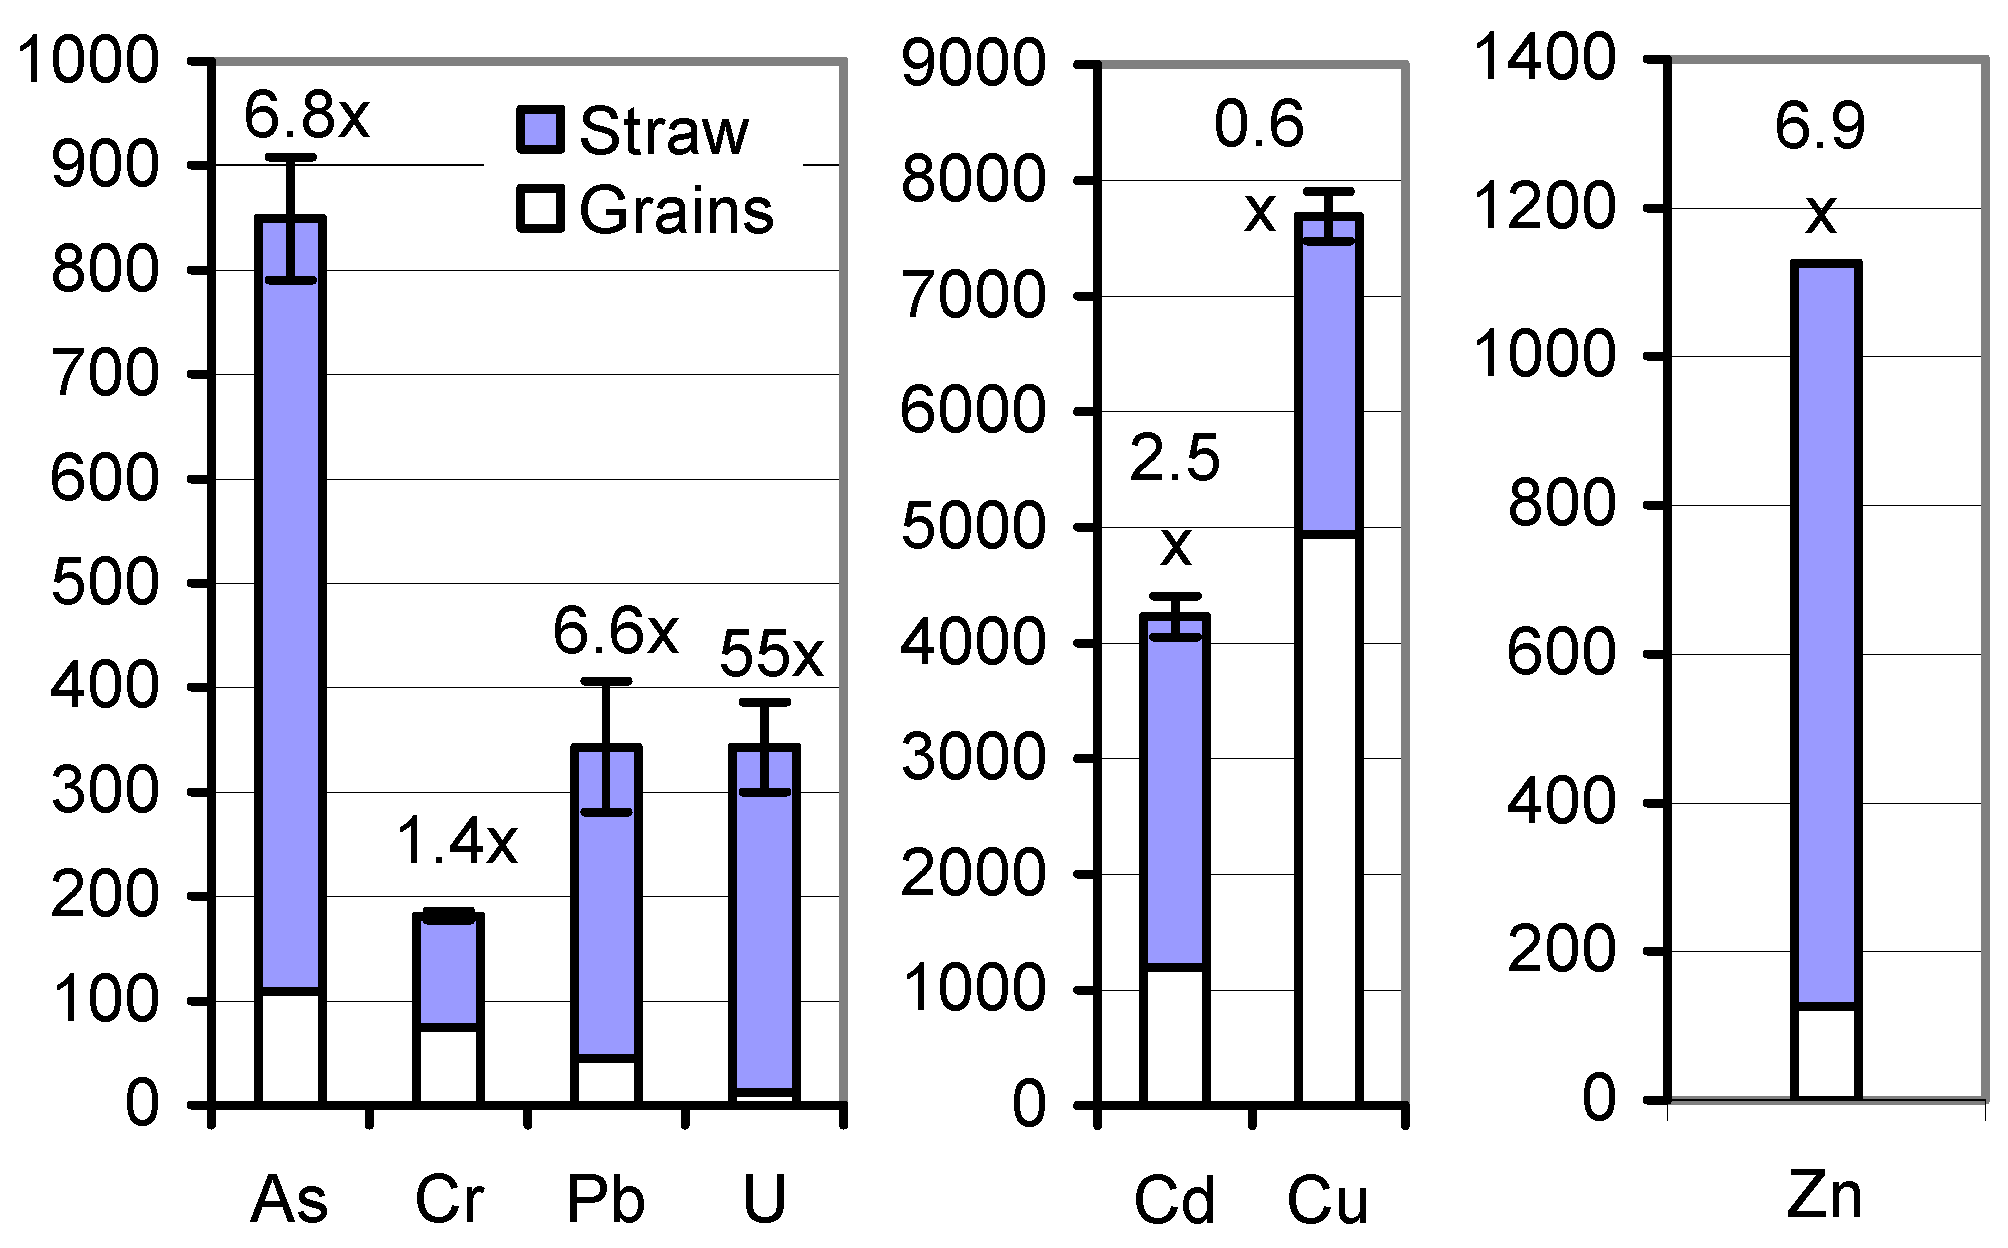
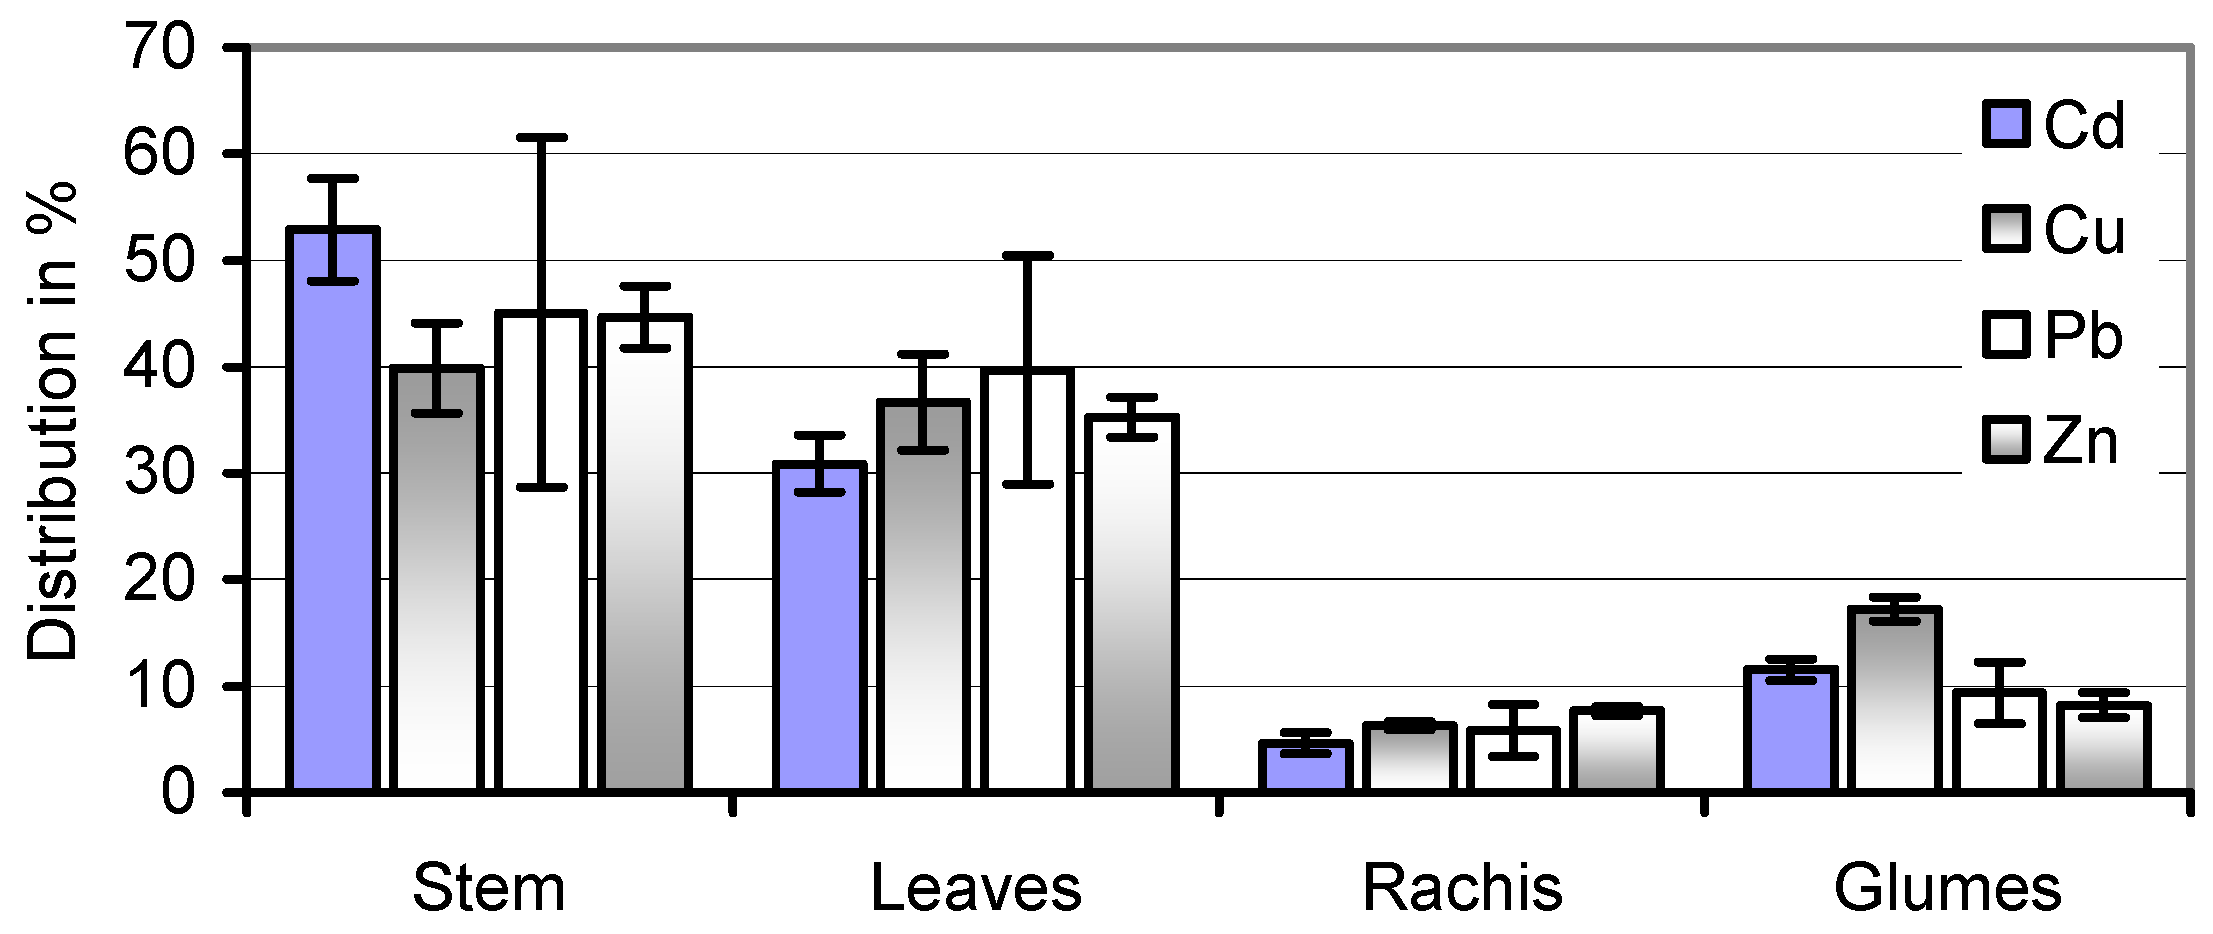
59]. The equal distribution of Cd, Cu, Pb, and Zn in stems and leaves of the soil A-grown straw (Figure 4) makes speculations about a selective harvest of less-contaminated and therefore more valuable portions of the herbage illusory. At the same time, wet pre-treatment removes the majority of its potential HM toxicants.
Critical Cd and Cu concentrations may be obtained during the fermentation of ground whole-wheat grains in aqueous slurries. The suspensions may contain 10%–17% dry matter (w/w) at lab scale [122,123] and around 25% in practice [124]. The combined effects of Cd and Cu concentrations reaching 3.13 and 12.3 mg∙kg−1∙DW, respectively, in several soil A-grown wheat cvs. (Table 3) could strain HM tolerance and vitality of yeast cells to the utmost. Their productivity could be impaired by the progressive acquisition of HM even from low concentrations in the incubation media during the 48–72-h batch fermentation process [125].

5. Conclusions

The geologically related soils A and C differed little in their macronutrient content, however, phytotoxic effects incited by the elevated Cd, Cu, and Zn load of soil A reduced the straw and grain yield in cv. JB Asano to 47.7% and 39.5%, respectively. The combined excluder properties and the strict HM delimitations during seed fill prevented the widest of an enrichment in the crop of the high-concentrated soil contaminants, As, Cd, Cu, U, and Zn. Cadmium concentrations of 1.6 mg∙kg−1∙DW at anthesis, 3.08 in the mature straw, and 1.2 in grains were the only ones to violate the forage hygiene guidelines of 1 mg∙kg−1. Unlike green matter and grains, the mature straw should therefore not be used in husbandry and biochar production. Caution is recommended for the use of grains rather than of straw with Cd and Cu concentrations beyond 3 and 12 mg∙kg−1 DW, respectively, as bioethanol feedstock. Cd and Cu toxicities could lead to productivity losses in the fermentation of alcohol by S. cerevisiae. With that said, a higher Mn, Ni, Pb, and Zn load would be tolerated by the yeasts [57,58] and accepted by forage hygiene guidelines (Table 1 legend). Therefore, the straw did not lose its applicability as a roughage supplement in husbandry and as bioethanol feedstock if its As, Mn, Pb, and U content would essentially increase. This means that for alkaline A-type clay-loam soils, the acceptable load in As, Mn, Pb, and U—but not in the phytotoxic Ni and Zn—could rise beyond the Table 1 values if quasi-industrial grain crops are grown.

Author Contributions

In this cooperative work, Gerhard Gramss primarily conducted the agricultural part, whereas Klaus-Dieter Voigt performed the mineral analyses. The script was elaborated in mutual consultation.

Conflicts of Interest

The authors declare no conflicts of interest.

References

  1. Nair, P.K.R. Grand challenges in agroecology and land use systems. Front. Environ. Sci. 2014, 2. [Google Scholar] [CrossRef]
  2. United Nations Environment Programme. Assessing Global Land Use: Balancing Consumption with Sustainable Supply. A Report of the Working Group on Land and Soils of the International Resource Panel; Bringezu, S., Schütz, H., Pengue, W., O’Brien, M., Garcia, F., Sims, R., Howarth, R.W., Kauppi, L., Swilling, M., Herrick, J., Eds.; United Nations Environment Programme: Nairobi, KE, USA, 2014. [Google Scholar]
  3. François, M.; Grant, C.; Lambert, R.; Sauvé, S. Prediction of cadmium and zinc concentration in wheat grain from soils affected by the application of phosphate fertilizers varying in Cd concentration. Nutr. Cycl. Agroecosyst. 2009, 83, 125–133. [Google Scholar] [CrossRef]
  4. Schnug, E.; Lottermoser, B.G. Fertilizer-derived uranium and its threat to human health. Environ. Sci. Technol. 2013, 47, 2433–2434. [Google Scholar] [CrossRef] [PubMed]
  5. The European Parliament and the Council of the European Union. Directive 2002/32/EC of the European Parliament and of the Council of 7 May 2002 on undesirable substances in animal feed. Off. J. Eur. Commun. 2002, 140, 10–21. [Google Scholar]
  6. Oberthür, S.; Dupond, C. Decarbonization in the European Union. Internal Policies and External Strategies. Palgrave Macmillan UK, 2015. Available online: http://www.palgrave.com/us/book/9781137406828 (accessed on 15 January 2016).
  7. Williams, J.H.; Haley, B.; Kahrl, F.; Moore, J.; Jones, A.D.; Torn, M.S.; McJeon, H. Pathways to Deep Decarbonisation in the United States. The U.S. Report of the Deep Decarbonization Pathways Project of the Sustainable Development Solutions Network and the Institute for Sustainable Development and International Relations. 2014. Available online: https://ethree.com/publications/index_US2050.php (accessed on 15 January 2016).
  8. Carrillo-González, R.; Šimůnek, J.; Sauvé, S.; Adriano, D. Mechanisms and pathways of trace element mobility in soils. Adv. Agron 2006, 91, 111–178. [Google Scholar]
  9. Gramss, G.; Voigt, K.-D. The legacy of uranium mining: Farming on non-remediable soils? In Uranium: Sources, Exposure and Environmnetal Effects; Nelson, J.R., Ed.; Novapublishers: New York, NY, USA, 2015. [Google Scholar]
  10. Duquène, L.; Vandenhove, H.; Tack, F.; Meers, E.; Baeten, J.; Wannijn, J. Enhanced phytoextraction of uranium and selected heavy metals by Indian mustard and ryegrass using biodegradable soil amendments. Sci. Total Environ. 2009, 407, 1496–1505. [Google Scholar] [CrossRef] [PubMed]
  11. Evangelou, M.W.H.; Ebel, M.; Schaeffer, A. Chelate assisted phytoextraction of heavy metals from soil. Effect, mechanism, toxicity, and fate of chelating agents. Chemosphere 2007, 68, 989–1003. [Google Scholar] [CrossRef] [PubMed]
  12. Gramss, G.; Voigt, K.-D. Forage and rangeland plants from uranium mine soils: Long-term hazard to herbivores and livestock? Environ. Geochem. Health 2014, 36, 441–452. [Google Scholar] [CrossRef] [PubMed]
  13. Geletneky, J.W. Hydrogeologische/Hydrologische Untersuchung einer Prä-Flutungssituation am Beispiel des Gessentals im ehemaligen ostthüringischen Uranbergbaugebiet. Ph.D. Thesis, Friedrich-Schiller-University Jena, Jena, Germany, 2002. [Google Scholar]
  14. Grawunder, A.; Lonschinski, M.; Merten, D.; Büchel, G. Distribution and bonding of residual contamination in glacial sediments at the former uranium mining leaching heap of Gessen/Thuringia, Germany. Geochemistry 2009, 69, 5–19. [Google Scholar] [CrossRef]
  15. Hagen, M.; Jakubick, A.T. Returning the Wismut legacy to productive use. In Uranium in the Environment; Merkel, B.J., Hasche-Berger, A., Eds.; Springer: Berlin, Germany, 2006. [Google Scholar]
  16. Baker, A.J.M. Accumulators and excluders—Strategies in the response of plants to heavy metals. J. Plant Nutr. 1981, 3, 643–654. [Google Scholar] [CrossRef]
  17. Bergmann, H.; Voigt, K.-D.; Machelett, B.; Gramss, G. Variation in heavy metal uptake by crop plants. In Uranium in the Environment; Merkel, B.J., Hasche-Berger, A., Eds.; Springer: Berlin, Germany, 2006. [Google Scholar]
  18. Aciksoz, S.B.; Yazici, A.; Ozturk, L.; Cakmak, I. Biofortification of wheat with iron through soil and foliar application of nitrogen and iron fertilizers. Plant Soil 2011, 349, 215–225. [Google Scholar] [CrossRef]
  19. Gramss, G.; Voigt, K.-D. Regulation of the mineral concentrations in pea seeds from uranium mine and reference soils diverging extremely in their heavy metal load. Sci. Hort. 2015, 194, 255–266. [Google Scholar] [CrossRef]
  20. Grusak, M.A. Iron transport to developing ovules of Pisum sativum. I. Seed import characteristics and phloem iron-loading capacity of source regions. Plant Physiol. 1994, 104, 649–655. [Google Scholar] [PubMed]
  21. Stomph, T.J.; Jiang, W.; Van Der Putten, P.E.L.; Struik, P.C. Zinc allocation and re-allocation in rice. Front. Plant Sci. 2014, 5. [Google Scholar] [CrossRef] [PubMed]
  22. Vasconcelos, M.W.; Clemente, T.E.; Grusak, M.A. Evaluation of constitutive iron reductase (AtFRO2) expression on mineral accumulation and distribution in soybean (Glycine max L.). Front. Plant Sci. 2014, 5, 112. [Google Scholar] [CrossRef] [PubMed]
  23. Xue, Y.-F.; Yue, S.-C.; Zhang, Y.-Q.; Cui, Z.-L.; Chen, X.-P.; Yang, F.-C.; Cakmak, I.; McGrath, S.P.; Zhang, F.-S.; Zou, C.-Q. Grain and shoot zinc accumulation in winter wheat affected by nitrogen management. Plant Soil 2012, 361, 153–163. [Google Scholar] [CrossRef]
  24. Borrill, P.; Connorton, J.M.; Balk, J.; Miller, A.J.; Sanders, D.; Uauy, C. Biofortification of wheat grain with iron and zinc: Integrating novel genomic resources and knowledge from model crops. Front. Plant Sci. 2014, 5, 53. [Google Scholar] [CrossRef] [PubMed]
  25. Wang, Y.X.; Specht, A.; Horst, W.J. Stable isotope labelling and zinc distribution in grains studied by laser ablation ICP-MS in an ear culture system reveals zinc transport barriers during grain filling in wheat. New Phytol. 2011, 189, 428–437. [Google Scholar] [CrossRef] [PubMed]
  26. Van Dongen, J.T.; Ammerlaan, A.M.H.; Wouterlood, M.; Van Aelst, A.C.; Borstlap, A.C. Structure of the developing pea seed coat and the post-phloen transport pathway of nutrients. Ann. Bot. 2003, 91, 729–737. [Google Scholar] [CrossRef] [PubMed]
  27. Gramss, G.; Voigt, K.-D. Regulation of heavy metal concentrations in cereal grains from uranium mine soils. Plant Soil 2013, 364, 105–118. [Google Scholar] [CrossRef]
  28. Il’in, V.B. Heavy metals in the soil-crop system. Eurasian Soil Sci. 2007, 40, 993–999. [Google Scholar] [CrossRef]
  29. Gramss, G.; Voigt, K.-D. Seed crops: Alternative for non-remediable uranium mine soils. In Uranium—Past and Future Challenges; Merkel, B.J., Arab, A., Eds.; Springer International Publishing: Cham, Switzerland, 2015. [Google Scholar]
  30. FAOSTAT Gateway_World Wheat Production 2012. Available online: http://faostat3.fao.org/faostat-gateway/go/to/download/Q/QC/E (accessed on 12 April 2014).
  31. Richtsätze für die Bewertung von landwirtschaftlichen Kulturen—Stand: September 2015. Landwirtschaftskammer Nordrhein-Westfalen. Available online: http://richtsaetze.pdf (accessed on 5 Novemberr 2015).
  32. Khan, T.S.; Mubeen, U. Wheat straw: A pragmatic overview. Curr. Res. J. Biol. Sci. 2012, 4, 673–675. [Google Scholar]
  33. Larson, E.D. Biofuel Production Technologies: Status Prospects and Implications for Trade and Development; United Nations Conference on Trade and Development: New York, NY, USA; Geneva, IL, USA, 2008. [Google Scholar]
  34. Tishler, Y.; Samach, A.; Rogachev, I.; Elbaum, R.; Levy, A.A. Analysis of wheat straw biodiversity for use as a feedstock for biofuel production. Bioenerg. Res. 2015, 8, 1831–1839. [Google Scholar] [CrossRef]
  35. Ballesteros, I.; Negro, M.J.; Oliva, J.M.; Cabañas, A.; Manzanares, P.; Ballesteros, M. Ethanol production from steam-explosion pretreated wheat straw. Appl. Biochem. Biotechnol. 2006, 129–132, 496–508. [Google Scholar] [CrossRef]
  36. Schnitzer, M.; Monreal, C.M.; Powell, E.E. Wheat straw biomass: A resource for high-value chemicals. J. Environ. Sci. Health B 2014, 49, 51–67. [Google Scholar] [CrossRef] [PubMed]
  37. Han, L.; Feng, J.; Zhang, S.; Ma, Z.; Wang, Y.; Zhang, X. Alkali pretreated of wheat straw and its enzymatic hydrolysis. Braz. J. Microbiol. 2012, 2012, 53–61. [Google Scholar] [CrossRef] [PubMed]
  38. Brodeur, G.; Yau, E.; Badal, K.; Collier, J.; Ramachandran, K.B.; Ramakrishnan, S. Chemical and physicochemical pretreatment of lignocellulosic biomass: A review. Enzyme Res. (Hindawi) 2011, 2011, 787532. [Google Scholar] [CrossRef] [PubMed]
  39. Kristensen, J.B.; Thygesen, L.G.; Felby, C.; Jørgensen, H.; Elder, T. Cell-wall structural changes in wheat straw pretreated for bioethanol production. Biotechnol. Biofuels 2008, 1, 5. [Google Scholar] [CrossRef] [PubMed]
  40. Blombach, B.; Riester, T.; Wieschalka, S.; Ziert, C.; Youn, J.-W.; Wendisch, V.F.; Eikmanns, B.J. Corynebacterium glutamicum tailored for efficient isobutanol production. Appl. Environ. Microbiol. 2011, 77, 3300–3310. [Google Scholar] [CrossRef] [PubMed]
  41. Higashide, W.; Li, Y.; Yang, Y.; Liao, J.C. Metabolic engineering of Clostridium cellulolyticum for production of isobutanol from cellulose. Appl. Environ. Microbiol. 2011, 77, 2727–2733. [Google Scholar] [CrossRef] [PubMed]
  42. Xue, C.; Zhao, J.-B.; Chen, L.-J.; Bai, F.-W.; Yang, S.-T.; Sun, J.-X. Integrated butanol recovery for an advanced biofuel: Current state and prospects. Appl. Microbiol. Biotechnol. 2014, 98, 3463–3474. [Google Scholar] [CrossRef] [PubMed]
  43. Kumar, R.; Singh, S.; Singh, O.V. Bioconversion of lignocellulosic biomass: Biochemical and molecular perspectives. J. Ind. Microbiol. Biotechnol. 2008, 35, 377–391. [Google Scholar] [CrossRef] [PubMed]
  44. Scheller, H.V.; Ulvskov, P. Hemicelluloses. Annu. Rev. Plant Biol. 2010, 61, 263–289. [Google Scholar] [CrossRef] [PubMed]
  45. Madhavan, A.; Srivastava, A.; Kondo, A.; Binaria, V.S. Bioconversion of lignocellulose-derived sugars to ethanol by engineered Saccharomyces cerevisiae. Crit. Rev. Biotechnol. 2012, 32, 22–48. [Google Scholar] [CrossRef] [PubMed]
  46. Serapiglia, M.J.; Humiston, M.C.; Xu, H.; Hogsett, D.A.; De Orduña, R.M.; Stipanovic, A.J.; Smart, L.B. Enzymatic saccharification of shrub willow genotypes with differing biomass composition for biofuel production. Front. Plant Sci. 2013, 4, 57. [Google Scholar] [CrossRef] [PubMed]
  47. Al jibouri, A.K.H.; Turcotte, G.; Wu, J.; Cheng, C.-H. Ozone pretreatment of humid wheat straw for biofuel production. Energy Sci. Engin. 2015, 3, 541–548. [Google Scholar] [CrossRef]
  48. Jaisamut, K.; Paulová, L.; Patáková, P.; Rychtera, M.; Melzoch, K. Optimization of alkali pretreatment of wheat straw to be used as substrate for biofuels production. Plant Soil Environ. 2013, 59, 537–542. [Google Scholar]
  49. Talebnia, F.; Karakashev, D.; Angelidaki, I. Production of bioethanol from wheat straw: An overview on pretreatment, hydrolysis and fermentation. Biores. Technol. 2010, 101, 4744–4753. [Google Scholar] [CrossRef] [PubMed]
  50. Tutt, M.; Kikas, T.; Olt, J. Influence of different pretreatment methods on bioethanol production from wheat straw. Agron. Res. Biosyst. Engin. 2012, 1, 269–276. [Google Scholar]
  51. Lee, S.J.; Lee, S.-J.; Lee, D.-W. Design and development of synthetic microbial platform cells for bioenergy. Front. Microbiol. 2013, 4, 92. [Google Scholar] [CrossRef] [PubMed]
  52. Morikawa, Y.; Zhao, X.; Liu, D. Biological co-production of ethanol and biodiesel from wheat straw: A case of dilute acid pretreatment. RSC Adv. 2014, 4, 37878–37888. [Google Scholar] [CrossRef]
  53. Thomsen, S.T.; Jensen, M.; Schmidt, J.E. Production of 2nd generation bioethanol from lucerne - optimization of hydrothermal pre-treatment. BioResources 2012, 7, 1582–1593. [Google Scholar] [CrossRef]
  54. Klinke, H.B.; Ahring, B.K.; Schmidt, A.S.; Thomsen, A.B. Characterization of degradation products from alkaline wet oxidation of wheat straw. Biores. Technol. 2002, 82, 15–26. [Google Scholar] [CrossRef]
  55. Larsson, S.; Palmqvist, E.; Hahn-Hägerdal, B.; Tengborg, C.; Stenberg, K.; Zacchi, G.; Nilvebrant, N.-O. The generation of fermentation inhibitors during dilute acid hydrolysis of softwood. Enzyme Microb. Technol. 1999, 24, 151–159. [Google Scholar] [CrossRef]
  56. Piotrowski, J.S.; Zhang, Y.; Bates, D.M.; Keating, D.H.; Sato, T.K.; Ong, I.M.; Landick, R. Death by a thousand cuts: The challenges and diverse landscape of lignocellulosic hydrolysate inhibitors. Front. Microbiol. 2014, 5, 90. [Google Scholar] [CrossRef] [PubMed]
  57. Hosiner, D.; Gerber, S.; Lichtenberg-Fraté, H.; Glaser, W.; Schüller, C.; Klipp, E. Impact of acute metal stress in Saccharomyces cerevisiae. PLoS ONE 2014, 9, e83330. [Google Scholar] [CrossRef] [PubMed]
  58. Nassar, N.R.A.; Heikal, Y.A.; Abou Donia, M.A.M.; Fadel, M.; Abdel-Rahman, G.N. Selection of Saccharomyces cerevisiae strains tolerant to lead and cadmium toxicity. Intern. J. Biol. Biomolec. Agric. Food Biotechnol. Engin. 2015, 9, 93–100. [Google Scholar]
  59. Xu, Q.; Wu, M.; Hu, J.; Gao, M.-T. Effects of nitrogen sources and metal ions on ethanol fermentation with cadmium-containing medium. J. Basic Microbiol. 2016, 56, 26–35. [Google Scholar] [CrossRef] [PubMed]
  60. Howlett, N.G.; Avery, S.V. Induction of lipid peroxidation during heavy metal stress in Saccharomyces cerevisiae and influence of plasma membrane fatty acid unsaturation. Appl. Environ. Microbiol. 1997, 63, 2971–2976. [Google Scholar] [PubMed]
  61. Tonndorf, H. Metallogenie des Urans im ostdeutschen Zechstein—Ein Beitrag zum Nachweis und zur Charakteristik stofflicher Umverteilungs- und Anreicherungsprozesse. In Abhandlungen der Sächsischen Akademie der Wissenschaften zu Leipzig, Mathematisch-naturwissenschaftliche Klasse, Band 58, Heft 3; Akademie Verlag: Berlin, Germany, 1994. [Google Scholar]
  62. Schachtschabel, P.; Blume, H.P.; Brümmer, G.; Hartge, K.H.; Schwertmann, U. Lehrbuch der Bodenkunde, 14th ed.; Enke: Stuttgart, Germany, 1998. [Google Scholar]
  63. Kloke, A. Contents of arsenic, cadmium, chromium, fluorine, lead, mercury and nickel in plants grown on contaminated soil. In United Nations–ECE Symptom on Effects of Air-Borne Pollution on Vegetation; United Nations Economic Commission for Europe: Warsaw, Poland, 1979. [Google Scholar]
  64. Huang, M.; Zhou, S.; Sun, B.; Zhao, Q. Heavy metals in wheat grain: Assessment of potential health risk for inhabitants in Kunshan, China. Sci. Total Environ. 2008, 405, 54–61. [Google Scholar] [CrossRef] [PubMed]
  65. Auermann, E.; Dässler, H.-G.; Jacobi, J.; Cumbrowski, J.; Meckel, U. Untersuchungen zum Schwermetallgehalt von Getreide und Kartoffeln. Die Nahrung 1980, 24, 925–937. [Google Scholar] [CrossRef] [PubMed]
  66. European Communities. Council regulation (EC) No. 1881/2006 of December 2006 on setting maximum levels of certain contaminants in foodstuffs. Off. J. Eur. Commun. L Ser. 2006, 364, 5–24. [Google Scholar]
  67. Bowen, H.J.M. Environmental Chemistry of the Elements; Academic Press: London, UK, 1979. [Google Scholar]
  68. Marschner, H. Mineral Nutrition of Higher Plants, 2nd ed.; Academic Press: London, UK, 1995. [Google Scholar]
  69. Sauerbeck, D. Welche Schwermetallgehalte in Pflanzen durfen uberschritten werden, um Wachstumsbeeintrachtigungen zu vermeiden? Landwirtsch Forsch 1983, 39, 108–129. [Google Scholar]
  70. Schinner, F.; Öhlinger, R.; Kandeler, E.; Margesin, R. Bodenbiologische Arbeitsmethoden, 2nd ed.; Springer: Berlin, Germany, 1993. [Google Scholar]
  71. McDowell, L.R. Minerals in Animal and Human Nutrition, 2nd ed.; Elsevier Science: Amsterdam, The Netherlands, 2003. [Google Scholar]
  72. Gramss, G.; Voigt, K.-D. Stability of the inherent target metallome in seed crops and a mushroom grown on soils of extreme mineral spans. Agronomy 2016, 6, 14. [Google Scholar] [CrossRef]
  73. Rose, T.J.; Raymond, C.A.; Bloomfield, C.; King, G.J. Perturbation of nutrient source–sink relationships by post-anthesis stresses results in differential accumulation of nutrients in wheat grain. J. Plant Nutr. Soil Sci. 2015, 178, 89–98. [Google Scholar] [CrossRef]
  74. Barman, S.C.; Sahu, R.K.; Bhargava, S.K.; Chaterjee, C. Distribution of heavy metals in wheat, mustard, and weed grown in field irrigated with industrial effluents. Bull. Environ. Contam. Toxicol. 2000, 64, 489–496. [Google Scholar] [CrossRef] [PubMed]
  75. Bose, S.; Bhattacharyya, A.K. Heavy metal accumulation in wheat plant grown in soil amended with industrial sludge. Chemosphere 2008, 70, 1264–1272. [Google Scholar] [CrossRef] [PubMed]
  76. Liu, W.-X.; Liu, J.-W.; Wu, M.-Z.; Li, Y.; Zhao, Y.; Li, S.-R. Accumulation and translocation of toxic heavy metals in winter wheat (Triticum aestivum L.) growing in agricultural soil of Zhengzhou, China. Bull. Environ. Contam. Toxicol. 2009, 82, 343–347. [Google Scholar] [CrossRef] [PubMed]
  77. Mishra, M.; Sahu, R.K.; Sahu, S.K.; Padhy, R.N. Growth, yield and elements content of wheat (Triticum aestivum) grown in composted municipal solid wastes amended soil. Environ. Dev. Sustain. 2009, 11, 115–126. [Google Scholar] [CrossRef]
  78. García y García, A.; Dourado-Neto, D.; del Valle Basanta, M.; López Ovejero, R.F.; Favarin, J.L. Logistic rice model for dry matter and nutrient uptake. Sci. Agric. 2003, 60, 481–488. [Google Scholar] [CrossRef]
  79. Brink, G.E.; Sistani, K.R.; Oldham, J.L.; Pederson, G.A. Maturity effects on mineral concentration and uptake in annual ryegrass. J. Plant Nutr. 2006, 29, 1143–1155. [Google Scholar] [CrossRef]
  80. Wang, Z.; Lu, J.; Yang, M.; Yang, H.; Zhang, Q. Stoichiometric characteristics of carbon, nitrogen, and phosphorus in leaves of differently aged lucerne (Medicago sativa) stands. Front. Plant Sci. 2015, 6, 1062. [Google Scholar] [CrossRef] [PubMed]
  81. Maillard, A.; Diquélou, S.; Billard, V.; Laîné, P.; Garnica, M.; Prudent, M.; Garcia-Mina, J.-M.; Yvin, J.-C.; Ourry, A. Leaf mineral nutrient remobilization during leaf senescence and modulation by nutrient deficiency. Front. Plant Sci. 2015, 6, 317. [Google Scholar] [CrossRef] [PubMed]
  82. Gramss, G.; Voigt, K.-D.; Merten, D. Phytoextraction of heavy metals by dominating perennial herbs. In The New Uranium Mining Boom; Merkel, B., Schipek, M., Eds.; Springer: Berlin, Germany, 2011. [Google Scholar]
  83. Boussen, S.; Soubrand, M.; Bril, H.; Ouerfelli, K.; Abdeljaouad, S. Transfer of lead, zinc and cadmium from mine tailings to wheat (Triticum aestivum) in carbonated Mediterranean (Northern Tunisia) soils. Geoderma 2013, 192, 227–236. [Google Scholar] [CrossRef]
  84. Cheng, W.-D.; Zhang, G.-P.; Yao, H.-G.; Wu, W.; Xu, M. Genotypic and environmental variation in cadmium, chromium, arsenic, nickel, and lead concentrations in rice grains. J. Zhejiang Univ. Sci. B 2006, 7, 565–571. [Google Scholar] [CrossRef] [PubMed]
  85. Gomez-Becerra, H.F.; Erdem, H.; Yazici, A.; Tutus, Y.; Torun, B.; Ozturk, L.; Cakmak, I. Grain concentrations of protein and mineral nutrients in a large collection of spelt wheat grown under different environments. J. Cereal Sci. 2010, 52, 342–349. [Google Scholar] [CrossRef]
  86. Osuji, G.O.; Brown, T.K.; South, S.M.; Duncan, J.C.; Johnson, D.; Hyllam, S. Molecular adaptation of peanut metabolic pathways to wide variations of mineral ion composition and concentration. Am. J. Plant Sci. 2012, 3, 33–50. [Google Scholar] [CrossRef]
  87. Grusak, M.; Emerick, J. Dynamics of Dry Matter and Mineral Allocation to Pod Walls Versus Seeds in Common Bean; Meeting Abstract; Southern Plains Area Home/Children’s Nutrition Research Center: Houston, TX, USA, 2012. [Google Scholar]
  88. Wu, Y.; Messing, J. Proteome balancing of the maize seed for higher nutritional value. Front. Plant Sci. 2014, 5, 240. [Google Scholar] [CrossRef] [PubMed]
  89. Andreini, C.; Bestini, I.; Cavallaio, G.; Holliday, G.L.; Thornton, J.M. Metal ions in biological catalysis: From enzyme databases to general principles. J. Biol. Inorg. Chem. 2008, 13, 1205–1218. [Google Scholar] [CrossRef] [PubMed]
  90. Mengel, K. Ernährung und Stoffwechsel der Pflanze, 7th ed.; Gustav Fischer: Jena, Germany, 1991. [Google Scholar]
  91. Gramss, G.; Schubert, R.; Bergmann, H. Carbon and nitrogen compounds applied to uranium mine dump soil determine (heavy) metal uptake by Chinese cabbage. Environ. Res. J. 2011, 5, 793–818. [Google Scholar]
  92. Peterson, C.J.; Johnson, V.A.; Mattern, P.J. Influence of cultivar and environment on mineral and protein concentrations of wheat flour, bran, and grain. Cereal Chem. 1986, 63, 183–186. [Google Scholar]
  93. Patrick, J.W.; Offler, C.E. Compartmentation of transport and transfer events in developing seeds. J. Exp. Bot. 2001, 52, 551–564. [Google Scholar] [CrossRef] [PubMed]
  94. Zhang, W.-H.; Zhou, Y.; Dibley, K.E.; Tyerman, S.D.; Furbank, R.T.; Patrick, J.W. Nutrient loading of developing seeds. Funct. Plant Biol. 2007, 34, 314–331. [Google Scholar] [CrossRef]
  95. Copeland, J.; Turley, D. Report Prepared for The National Non-Food Crops Centre, 2008. Available online: http://StrawAvailabilityinGreatBritain.pdf (accessed on 5 November 2015).
  96. Dodson, J.R. Wheat Straw Ash and Its Use As a Silica Source. Ph.D. Thesis, University of York, York, UK, 2011. [Google Scholar]
  97. Incona, Initiative effiziente Stickstoffdüngung, 2009. Available online: http://Sondernewsletter_Jun09_web.pdf (accessed on 5 November 2015).
  98. Angle, J.S.; Linacre, N.A. Metal phytoextraction—A survey of potential risks. Int. J. Phytoremed. 2005, 7, 241–254. [Google Scholar] [CrossRef] [PubMed]
  99. Smith, K.M.; Abrahams, P.W.; Dagleish, M.P.; Steigmajer, J. The intake of lead and associated metals by sheep grazing mining-contaminated floodplain pastures in mid-Wales, UK: I. Soil ingestion, soil-metal partitioning and potential availability to pasture herbage and livestock. Sci. Total Environ. 2009, 407, 3731–3739. [Google Scholar] [CrossRef] [PubMed]
  100. Horn, G.W.; Zorrilla-Rios, J.; Akin, D.E. Influence of stage of forage maturity and ammoniation of wheat straw on ruminal degradation of wheat forage tissues. Anim. Feed Sci. Technol. 1989, 24, 201–218. [Google Scholar] [CrossRef]
  101. Feed Value of Selected Foodstuffs/Feeding and Nutrition/Beef/Livestock/Agriculture/Ag-Windows Internet Explorer. Available online: http://agriculture.vic.gov.au/agriculture/livestock/beef/feeding-and-nutrition (accessed on 11 March 2016).
  102. Bamminger, C.; Marschner, B.; Jüschke, E. An incubation study on the stability and biological effects of pyrogenic and hydrothermal biochar in two soils. Eur. J. Soil Sci. 2014, 65, 72–82. [Google Scholar] [CrossRef]
  103. Bargmann, I.; Rillig, M.C.; Kruse, A.; Greef, J.-M.; Kücke, M. Effects of hydrochar application on the dynamics of soluble nitrogen in soils and on plant availability. J. Plant. Nutr. Soil. Sci. 2014, 177, 48–58. [Google Scholar] [CrossRef]
  104. Kloss, S.; Zehetner, F.; Wimmer, B.; Buecker, J.; Rempt, F.; Soja, G. Biochar application to temperate soils: Effects on soil fertility and crop growth under greenhouse conditions. J. Plant Nutr. Soil Sci. 2014, 177, 3–15. [Google Scholar] [CrossRef]
  105. Reddy, N.R.; Palmer, J.K.; Pierson, M.D.; Bothast, R.J. Wheat straw hemicelluloses: Composition and fermentation by human colon Bacteroides. J. Agric. Food Chem. 1983, 31, 1308–1313. [Google Scholar] [CrossRef]
  106. Pérez, A.L.; Anderson, K.A. DGT estimates cadmium accumulation in wheat and potato from phosphate fertilizer applications. Sci. Total Environ. 2009, 407, 5096–5103. [Google Scholar] [CrossRef] [PubMed]
  107. Hashemimajd, K.; Jamaati-e-Somarin, S. Contribution of organic bulking materials on chemical quality of sewage sludge vermicompost. Ciênc. Agrotec. Lavras 2011, 35, 1077–1084. [Google Scholar] [CrossRef]
  108. Schönbuchner, H. Untersuchungen zu Mobilität und Boden-Pflanze-Transfer von Schwermetallen auf/in Uranhaltigen Haldenböden. Ph.D. Thesis, Friedrich-Schiller-University Jena, Jena, Germany, 2002. [Google Scholar]
  109. Zhang, Y.-H.P. Reviving the carbohydrate economy via multi-product lignocellulose biorefineries. J. Ind. Microb. Biotechnol. 2008, 35, 367–375. [Google Scholar] [CrossRef] [PubMed]
  110. Chen, G.; Zhou, Y.; Zeng, G.; Liu, H.; Yan, M.; Chen, A.; Guan, S.; Shang, C.; Li, H.; He, J. Alteration of culture fluid proteins by cadmium induction in Phanerochaete chrysosporium. J. Basic Microbiol. 2015, 55, 141–147. [Google Scholar] [CrossRef] [PubMed]
  111. Ma, N.; Li, C.; Dong, X.; Wang, D.; Xu, Y. Different effects of sodium chloride preincubation on cadmium tolerance of Pichia kudriavzevii and Saccharomyces cerevisiae. J. Basic Microbiol. 2015, 55, 1002–1012. [Google Scholar] [CrossRef] [PubMed]
  112. Muthukumar, K.; Nachiappan, V. Cadmium-induced oxidative stress in Saccharomyces cervisiae. Ind. J. Biochem. Biophys. 2010, 47, 83–87. [Google Scholar]
  113. Baldrian, P.; In Der Wiesche, C.; Gabriel, J.; Nerud, F.; Zadražil, F. Influence of cadmium and mercury on activities of ligninolytic enzymes and degradation of polycyclic aromatic hydrocarbons by Pleurotus ostreatus in soil. Appl. Environ. Microbiol. 2000, 66, 2471–2478. [Google Scholar] [CrossRef] [PubMed]
  114. Su, C.; Jiang, L.; Zhang, W. A review on heavy metal contamination in the soil worldwide: Situation, impact and remediation techniques. Environ. Skept. Crit. 2014, 3, 24–38. [Google Scholar]
  115. Zhao, W.; Zhang, C.; Zeng, G.; Huang, D.; Xu, P.; Cheng, M. Growth, metabolism of Phanerochaete chrysosporium and route of lignin degradation in response to cadmium stress in solid-state fermentation. Chemosphere 2015, 138, 560–567. [Google Scholar] [CrossRef] [PubMed]
  116. Cadmium Review 2003. Nordic Council of Ministers. Available online: http://www.who.int/ifcs/documents/forums/forum5/nmr_cadmium.pdf (accessed on 8 December 2015).
  117. Huang, D.-L.; Zeng, G.-M.; Feng, C.-L.; Hu, S.; Jiang, X.-Y.; Tang, L.; Su, F.-F.; Zhang, Y.; Zeng, W.; Liu, H.-L. Degradation of lead-contaminated lignocellulosic waste by Phanerochaete chrysosporium and the reduction of lead toxicity. Environ. Sci. Technol. 2008, 42, 4946–4951. [Google Scholar] [CrossRef] [PubMed]
  118. Gramss, G.; Voigt, K.-D. Clues for regulatory processes in fungal uptake and transfer of minerals to the basidiospore. Biol. Trace Elem. Res. 2013, 154, 140–149. [Google Scholar] [CrossRef] [PubMed]
  119. Le, D.M.; Sørensen, H.R.; Knudsen, N.O.; Schjoerring, J.K.; Meyer, A.S. Biorefining of wheat straw: Accounting for the distribution of mineral elements in pretreated biomass by an extended pre-treatment-severity equation. Biotechnol. Biofuels 2014, 7, 141. [Google Scholar] [CrossRef] [PubMed] [Green Version]
  120. Berdicevsky, I.; Duek, L.; Merzbach, D.; Yannai, S. Susceptibility of different yeast species to environmental toxic metals. Environ. Pollut. 1993, 80, 41–44. [Google Scholar] [CrossRef]
  121. Liang, B.; Li, M.; Shang, J. Human metallothionein enhanced tolerance and biosorption of cadmium when expressed in Saccharomyces cerevisiae. Adv. Mater. Res. 2013, 779–780, 195–200. [Google Scholar] [CrossRef]
  122. Neves, M.A.; Kimura, T.; Shimizu, N.; Shiiba, K. Production of alcohol by Simultaneous Saccharification and Fermentation of low-grade wheat flour. Braz. Arch. Biol. Technol. 2006, 49, 481–490. [Google Scholar] [CrossRef]
  123. Pejin, D.J.; Vučurović, V.M.; Popov, S.D.; Dodić, J.M.; Dodić, S.N. Production of ethanol from Kantata wheat variety. APTEFF 2006, 37, 155–161. [Google Scholar] [CrossRef]
  124. Punter, G.; Rickeard, D.; Larivé, J.-F.; Edwards, R.; Mortimer, N.; Horne, R.; Bauen, A.; Woods, J. Well-to-wheel evaluation for production of ethanol from wheat. A report by the LowCVP Fuels Working Group, WTW Sub-Group. Available online: http://www.kubusz.net/Jahoda/Vystup/Zdroje/Biofuels_WTW_final_report.pdf (accessed on 18 March 2016).
  125. Ingledew, W.M. Alcohol production by Saccharomyces cerevisiae: A yeast primer. In The Alcohol Textbook, 3rd ed.; Jacques, K.A., Lyons, T.P., Kelsall, D.R., Eds.; Nottingham University Press: Nottingham, UK, 1998. [Google Scholar]
Figure 1. Variation in concentrations of minerals from the root (R; 100%) via the lower part (12 cm) of the mature wheat stem (LS) to upper stem (US), rachis (RA), and grain (G) in plants of cv. JB Asano grown on the metalliferous soil A (a) and the non-contaminated soil C (b). Values are arithmetic means for sets of minerals with similar modes of passage. Compare Table 3 and Table 4 for significant differences within the flow of the individual elements.
Agriculture 06 00051 g001
Figure 2. Putative contribution of sink tissues of the anthesis-state plant to the mineral transfer into the maturing grains of wheat cv. JB Asano from metalliferous soil A (a) and non-contaminated soil C (b). Values expressed in percent. G, grains; S, stem; L, leaves and sheaths; R, rachis; Gl, glumes. Values indicated for “G” mark the putative direct and sink-tissue independent mineral transfer to the grain. Standard deviations range 0.025–0.075× value.
Agriculture 06 00051 g002
Figure 3. Absolute amounts (mg; Zn in g) and proportions (values heading the columns) of the heavy-metal toxicants in soil-A grown straw (0.984 Mg) and in the associated grains of cv. JB Asano (1 Mg) at maturity. Refer to soil-A values in Table 1. The dark columns sections do not refer to the zero axis. Error bars show the ± SD values for straw.
Agriculture 06 00051 g003
Figure 4. Approximate distribution (%) of Cd, Cu, Pb, and Zn in straw sections of wheat cv. JB Asano grown on the metalliferous gradient soil A. Error bars show ± SD.
Agriculture 06 00051 g004
Figure 5. Quotients of the percentages the whole plants (root, shoot, and grains) incorporated from the total soil content of the respective mineral. Values of soil-C grown plants are divided by those of the soil-A grown plants which represent factor 1. Standard deviations range from 6%–13% of the values.
Agriculture 06 00051 g005
Figure 6. Course of K (a); P (b); and Zn (c) concentrations from roots to mature grains of whole wheat plants cv. JB Asano analyzed at anthesis (bright curves) and maturity (dark curves). Note the role of leaves and glumes as sink tissues and the concentration differences between both rachis-borne structures of grains and glumes in the plants grown on the metalliferous soil A. Compare Table 3 for significant differences within the flow of the individual elements.
Agriculture 06 00051 g006
Table 1. Evolution of the mineral concentrations in roots, shoots, and grains (mg∙kg−1∙dry weight (DW)) of wheat cv. JB Asano grown on the metalliferous soil (A) and the reference soil (C) from the seedling state via anthesis to maturity. In parentheses, the concentrations of the individual elements in the soil A- to soil C-grown plant tissues are expressed as quotients from high:low values. Note the recommended concentration limits for arable soil, herbage, and food grains.
ElementSoilSeedling 25 FebruaryAnthesis 22 MayMaturity 18 JulyGrainsLimits
RootShootRootShootRootShootSoil aHerbs b,c
Macronutrients
CaA6650171846602010 d162633803230287--
C240013243906 e1707 e202024431308257 e
(2.77)(1.3)(1.19)(1.18)(1.24)(1.38)(2.47)(1.12)
KA227024,42032,355584013,2055910 d10,940 d4275--
C206521,495 e34,470 e773016,7105222 e8600 e4310 e
MgA3660116029506801016106012301114--
C51108601713669 e965 e5764331116 e
-(1.4)(1.35)(1.72)(1.02)(1.05)(1.84)(2.84)(1)
NA68.1NDNDNDND11,000392018,000--
C87.5NDNDNDNDNDNDND
PA6702733519053011707842732606--
C8632783 e4410 e7222220486356 e3143
-(1.29)(1.02)(1.18)(1.36)(1.9)(1.61)(1.3)(1.21)
Micronutrients
(Cd)A40.456.913.125.51.629.4 d3.081.230.05–0.4
C1.381.20.50.8640.0970.610 d0.100 d0.0750.3
-(29.3)(47.4)(26.2)(29.5)(16.5)(48.2)(30.8)(16)-
CuA26145.513.537.2 d3.8365.62.80 d4.941002–20
C50119.113.5 d7.35 d11.6 d8.943.9850100
-(5.22)(4.14)(1.48)(2.76)(1.92)(5.66)(3.19)(1.24)-
FeA18,510635200666 d27.6241033 d24.6--
C31,750498 e188 e262066.4184043.0 e36
-(1.72)(1.28)(1.06)(3.93)(2.41)(1.31)(1.3)(1.46)
MnA178056.764.565 d16.821719.1 d2040–100014–30
C154037.329.814918.9 e1196.4718.4 e
NiA435.221.745.38 d1.09 d11.80.6052.091000.1–3
C37.91.280.7494.19 e0.4923.18 d0.596 d,e0.3924050
ZnA28901570649787276120388712630010–100
C2081024249.419.332.77.1827200500
-(13.9)(15.4)(15.5)(15.9)(14.3)(36.8)(124)(4.67)-
Non-essential elements
AsA1406.541.46.95 d0.27520.20.7520.109200.01–1
C290.8930.2813.680.112.270.070.023040
-(4.83)(7.32)(4.98)(1.89)(2.5)(8.9)(10.7)(5.45)-
CrA16.41.620.790.920.0724.20.108 d0.0751000.1–1
C30.71.02 e1.18 e5.540.655 d4.48 d,e2.910.026150–200
PbA1484.961.565.64 d0.1120.30.303 d0.0451000.1–6
C541.070.486.43 e0.322 de4.48 d0.211 d,e0.012 e250–300
UA29.94.830.6153.360.0318.490.3370.006230.002–0.015
C6.70.4210.0921.250.023 e0.844 d0.004 (84.3)0.001 e
-(4.46)(11.5)(6.68)(2.69)(1.35)(10.1)-(6)
a Heavy-metal concentration limits of cropland recommended for Europe [62,63] and China ([64]; the latter are given in italics). Bold face font: Unusually elevated soil concentrations; b Normal plant heavy-metal concentrations [62,65]; c Legislative contamination limits for food grains after [66] (and expanded values for forage grains and herbage after [5] in parentheses): Cd, 0.1 (1); As, 0.5 (2); Pb, 0.2 (10; green forage, 40 mg∙kg−1∙DW); d Values for roots and shoots, respectively, within a horizontal line fail to differ significantly at p ≤ 0.05 from the preceding ones; e Mineral concentrations of plant tissues from gradient soils A and C fail to differ significantly at p ≤ 0.05. N, sum of NH4-N + NO3-N in soil and as Kjeldahl-N (mg∙kg−1∙DW) in herbage. ND, not determined. Phytotoxicity thresholds (mg∙kg−1∙DW) in cereals and vegetables: As, 20; Cd, 5–10; Cr(III), 5–20; Cr(VI), 1–2; Cu, 14–25; Ni, 11–30; Pb, 20–35; Zn, 150–220 [67,68,69].
Table 2. Production of grains and straw by wheat cv. JB Asano grown on the metalliferous (A) and the non-contaminated (C) soil. Gravimetric values are given in fresh weight (FW) ± SD (rest water around 16% per DW).
SoilNo. of Grains Per 100 PlantsGrain FW Per 100 Plants (in Grams)1000-Seed FW (in Grams)Straw Per 100 Plants (in Grams)Straw (Mg) Per Mg of Grains
A1840 ± 13296 ± 852.37 ± 0.3295 ± 5.40.984 ± 0.10
C4100 ± 78243 ± 4.559.24 ± 0.52199 ± 6.40.818 ± 0.04
Grain production on soil C amounted to 7.23 Mg∙ha−1 in 2014.
Table 3. The course of mineral concentrations (mg∙kg−1∙DW) across the plant sections of wheat cv. JB Asano in the states of maturity (18 July) and anthesis (22 May). The plants were grown on uranium gradient soil A.
ElementStateRootLower StemUpper StemLeavesRachisWhole GrainsGlumesReference Grains d
KMatur591011,820 a12,69012,91510,1034275 a5890 a4690–6540
Anth58407270 a,b14,540 a15,33611,030 aLacking15,076 a,b
MgMatur1060352 a965 a2915 a631 a1114 a903 a1520–1710
Anth680 b204 a,b800 a1620 a,b723 a958 a,b
NMatur11,0003000 a400050003000 a18,000 a4000 a19,800–30,000
PMatur784102 a314 a2703592606 a403 a4750–5290
Anth530 b417 a,b1347 a,b691 a,b2523 a,b3138 a,b
CaMatur3380989 a4095 a6920 a1190 a287 a1390 a457–538
Anth2012 b307 a,b710 a,b3304 a,b525 a,b526 b
ZnMatur1203536 a1059 a13531117126 a346 a132–190
Anth787 b69 a,b286 a,b454 a,b179 a,b83 a,b
CdMatur29.42.29 a4.26 a4.112.34 a1.20 a1.69 a1.37–3.13
Anth25.51.78 a,b2.32 a,b1.61 a,b0.435 a,b0.480 b
CuMatur65.61.43 a3.05 a4.44 a2.86 a4.94 a2.28 a11.4–12.3
Anth37.2 b1.53 a4.07 a4.294.46 b5.60 a,b
FeMatur241016.6 a15.275.7 a35.7 a24.625.739.6–50.3
Anth666 b14.7 a22.4 a34.9 a,b29.534.6
MnMatur2174.95 a10.8 a45.6 a18.1 a2016.526.4–30.8
Anth65 b7.1 a,b14.7 a,b24.9 a,b9.7 a,b13.6 a
NiMatur11.80.280 a0.615 a0.340 a2.51 a2.09 a0.715 a1.09–1.41
Anth5.38 b0.303 a1.40 a,b0.283 a2.83 a3.81 a,b
AsMatur20.20.215 a0.745 a1.27 a0.920 a0.109 a0.775 a0.080–0.433
Anth6.95 b0.159 a0.155 b0.500 a,b0.072 a,b0.040 b
CrMatur4.20.050 a0.0650.172 a0.086 a0.0750.1640.025–0.036
Anth0.920 b0.068 a0.0570.077 b0.10.078
PbMatur20.30.374 a0.1760.520.2890.045 a0.1350.057–0.098
Anth5.64 b0.061 a,b0.0590.151 b0.1390.138
UMatur8.490.571 a0.360.3230.185 a0.006 a0.090 a0.016–0.099
Anth3.36 b0.032 a,b0.025 b0.044 b0.012 b0.008 b
Biomass in grams (DW ± SD) given for 100-plant sets of roots, whole shoots, and grains
Matur7.25 ± 0.7940.2 ± 4.2 for whole stem18.7 ± 2.34.94 ± 0.2982.1 ± 7.517 ± 1.180.8 ± 4.9
Anth7.72 ± 0.7437.7 ± 3.635.2 ± 3.8c4.16 ± 0.25-11.2 ± 0.7c88.3 ± 5.3 shoot
a Values within a horizontal line differ significantly at p ≤ 0.05 from preceding ones; b Tissue mineral concentrations at anthesis differ significantly at p ≤ 0.05 from those in the state of maturity; c Biomass at anthesis differs significantly at p ≤ 0.05 from that in the state of maturity. “Leaves” comprise internodal sheaths; d Soil-A grown wheat grains of the cultivars Bussard, Brilliant, and Akteur [27]. Matur, at maturity (18 July); Anth, anthesis (22 May).
Table 4. The course of the mineral concentrations (mg∙kg−1∙DW) across the plant sections of wheat cv. JB Asano in the states of maturity (18 July) and anthesis (22 May). The plants were grown on the non-contaminated reference soil C (compare Table 3).
ElementStateRootLower stemUpper StemLeavesRachisWhole GrainsGlumes
KMatur52226400 a12,120 a10,4606650 a4310 a4230
Anth7730 b9684 a,b19,235 a,b20,685 b11,340 a,bLacking16,540 a,b
MgMatur576128 a344 a935 a249 a1116 a477 a
Anth669 b285 a,b827 a,b1523 a,b820 a,b1130 a,b
PMatur486241 a321 a332540 a3143 a591 a
Anth722 b1140 a,b2946 a,b1.870 a,b3530 a,b3612 b
CaMatur2443464 a1242 a2915 a611 a257 a862 a
Anth1707 b364 a,b1316 a4238 a,b443 a,b1224 a,b
ZnMatur32.74.41 a10.8 a5.70 a9.44 a27 a7.02 a
Anth49.4 b7.39 a,b23.5 a,b16.7 a,b32.7 a,b39.8 a,b
CdMatur0.610.158 a0.116 a0.064 a0.050.0750.038 a
Anth0.864 b0.120 a0.078 a,b0.115 a,b0.034 a0.055
CuMatur11.62.49 a14.9 a9.65 a1.49 a3.98 a6.87 a
Anth13.5 b2.86 a7.71 a,b8.76 a4.47 a,b13.4 a,b
FeMatur184011.2 a20.8 a91 a33.8 a3673.3 a
Anth2620 b24.1 a,b42.5 a,b108 a49.4 a,b92.5 a,b
MnMatur1193.42 a5.18 a9.51 a11.2 a18.4 a8.22 a
Anth149 b7.59 a,b20.7 a,b26.7 a,b12.1 a18.3 a,b
NiMatur3.180.114 a0.232 a1.28 a0.249 a0.392 a1.24 a
Anth4.19 b0.289 a,b0.2350.540 a,b0.484 b1.38 a
AsMatur2.270.036 a0.084 a0.0950.0830.020 a0.066 a
Anth3.68 b0.054 a0.040 b0.230 a,b0.030 a,b0.054
CrMatur4.480.145 a0.404 a7.99 a0.175 a0.026 a5.94 a
Anth5.54 b0.398 a,b0.130 a,b1.35 a,b0.124 a0.460 a,b
PbMatur4.480.065 a0.160.390 a0.1210.012 a0.336 a
Anth6.43 b0.159 a0.0830.512 a0.105 a0.724 a,b
UMatur0.8440.003 a0.0020.0070.0040.0010.005
Anth1.25 b0.010 a,b0.0070.047 a,b0.006 a0.016 a,b
Biomass in grams (DW ± SD) given for 100-plant sets of roots, grains (and whole shoots: 169.2 ± 6.4 at maturity; 172 ± 7.3 at anthesis).
Matur13.2 ± 0.695 ± 5.3 for whole stem38.3 ± 1.99.25 ± 0.25207.8 ± 4.526.6 ± 2.7
Anth13.4 ± 1.186.2 ± 5.859.4 ± 3.6c7.30 ± 0.70-19.1 ± 2.4
a Values within a horizontal line differ significantly at p ≤ 0.05 from preceding ones; b Tissue mineral concentrations at anthesis differ significantly at p ≤ 0.05 from those in the state of maturity; c Biomass at anthesis differs significantly at p ≤ 0.05 from that in the state of maturity. “Leaves” comprise internodal sheaths. Matur, at maturity (18 July); Anth, anthesis (22 May).
Table 5. The approximate order of heavy-metal extractions (g∙ha−1) by cv. JB Asano and their proportions (‰) to the total content in the 20-cm plough layer of soil A. Compare Table 1 for total soil concentrations.
ElementRoots and StubblesGrainsHarvestable Rest StrawIn the Whole Plant (‰)
As4.430.2661.720.023
Cd7.192.936.530.206
Cr0.9230.1830.2400.041
Cu14.712.16.180.063
Pb4.510.1100.5860.018
U2.040.0150.5930.044
Zn46130819270.466
Basic data (Mg∙ha−1 DW): whole straw, 2.40 ± 0.15; grains, 2.44 ± 0.22; roots, 0.215 ± 0.023; stubbles (12 cm), 0.377 ± 0.020.
Table 6. The approximate order of N, P, and K extraction (kg∙ha−1) by cv. JB Asano from soils A and C. Compare Table 1, Table 2, Table 3 and Table 4 for primary data. In parentheses, the percentages of minerals in roots/stubbles to those of the harvestable crop. In brackets [ ], the mineral concentrations of the herbage (kg∙Mg−1∙DW).
SoilCropMg∙ha−1 ± SD (DW)Uptake of Macronutrients in kg∙ha−1
KPN
AGrains2.44 ± 0.2210.430 [4.27]6.360 [2.61]43.920 [18.0]
Harvestable straw2.023 ± 0.1222.130 [10.9]0.550 [0.27]7.930 [3.92]
Sum 32.560 (100%)6.910 (100%)51.850 (100%)
ARoots0.215 ± 0.0231.270 [5.91]0.169 [0.79]2.365 [11.0]
Stubbles 12 cm0.337 ± 0.0203.977 [11.8]0.039 [0.12]1.130 [3.35]
Sum 5.247 (16.1%)0.208 (3%)3.495 (6.7%)
CGrains6.18 ± 0.1326.640 [4.31]19.400 [3.14]ND
Harvestable straw5.06 ± 0.1943.520 [8.60]1.800 [0.36]-
Sum 70.160 (100%)21.200 (100%)-
CRoots0.395 ± 0.0182.060 [5.22]0.192 [0.49]ND
Stubbles 12 cm0.714 ± 0.0244.570 [6.40]0.172 [0.24]-
Sum 6.630 (9.5%)0.364 (1.7%)-
ND, not determined.

