Article

Sorghum Biomass Production for Energy Purpose Using Treated Urban Wastewater and Different Fertilization in a Mediterranean Environment

1
Department of Agriculture, Food and Environment (Di3A), University of Catania, Via Valdisavoia 5, 95123 Catania, Italy
2
Department of Agronomy, Food, Natural Resources, Animals and Environment—DAFNAE, University of Padua, Agripolis Campus, Viale dell’Università 16, 35020 Legnaro, Italy
3
Consiglio Nazionale delle Ricerche-Istituto per la Valorizzazione del Legno e delle Specie Arboree (IVALSA), Via Gaifami 18, 95123 Catania, Italy
*
Author to whom correspondence should be addressed.
Agriculture 2016, 6(4), 67; https://doi.org/10.3390/agriculture6040067
Submission received: 29 August 2016 / Revised: 25 November 2016 / Accepted: 13 December 2016 / Published: 21 December 2016
(This article belongs to the Special Issue Innovative Approaches to Agricultural Water Management)

Abstract

:
With the aim at enhancing the sustainability of biomass production in the Mediterranean area, this paper analyzes, for the first time, the production of sorghum (Sorghum bicolor (L.) Moench) biomass for bioenergy production using urban treated wastewaters and bio-fertilization. For this purpose, the effects on biomass production of three different fertilizations (no-nitrogen control, biofertilizer, and mineral ammonium nitrate), four levels of constructed wetland (CW) wastewater restitutions (0%, 33%, 66% and 100%) of crop evapotranspiration (ETc) and three harvesting dates (at full plant maturity, at the initial senescence stage, and at the post-senescence stage) were evaluated in a two year trial. For bio-fertilization, a commercial product based on arbuscular mycorrhizal fungi was used. Mineral nitrogen (N) fertilization significantly increased dry biomass (+22.8% in the first year and +16.8% in the second year) compared to the control (95.9 and 188.2 g·plant−1, respectively). The lowest and highest biomass production, in 2008 and 2009, was found at 0% (67.1 and 118.2 g·plant−1) and 100% (139.2 and 297.4 g·plant−1) ETc restitutions. In both years, the first harvest gave the highest biomass yield (124.3 g·plant−1 in the first year and 321.3 g·plant−1 in the second), followed by the second and the third one. The results showed that in Mediterranean areas, constructed wetlands treated wastewaters, when complying with the European restrictions for their use in agriculture, may represent an important tool to enhance and stabilize the biomass of energy crops by recycling scarce quality water and nutrients otherwise lost in the environment.

1. Introduction

The competition for freshwater among agricultural, industrial, and civil uses has intensified over recent years. Agriculture is the largest consumer of world water resources [1,2], accounting for 80% of all consumption [
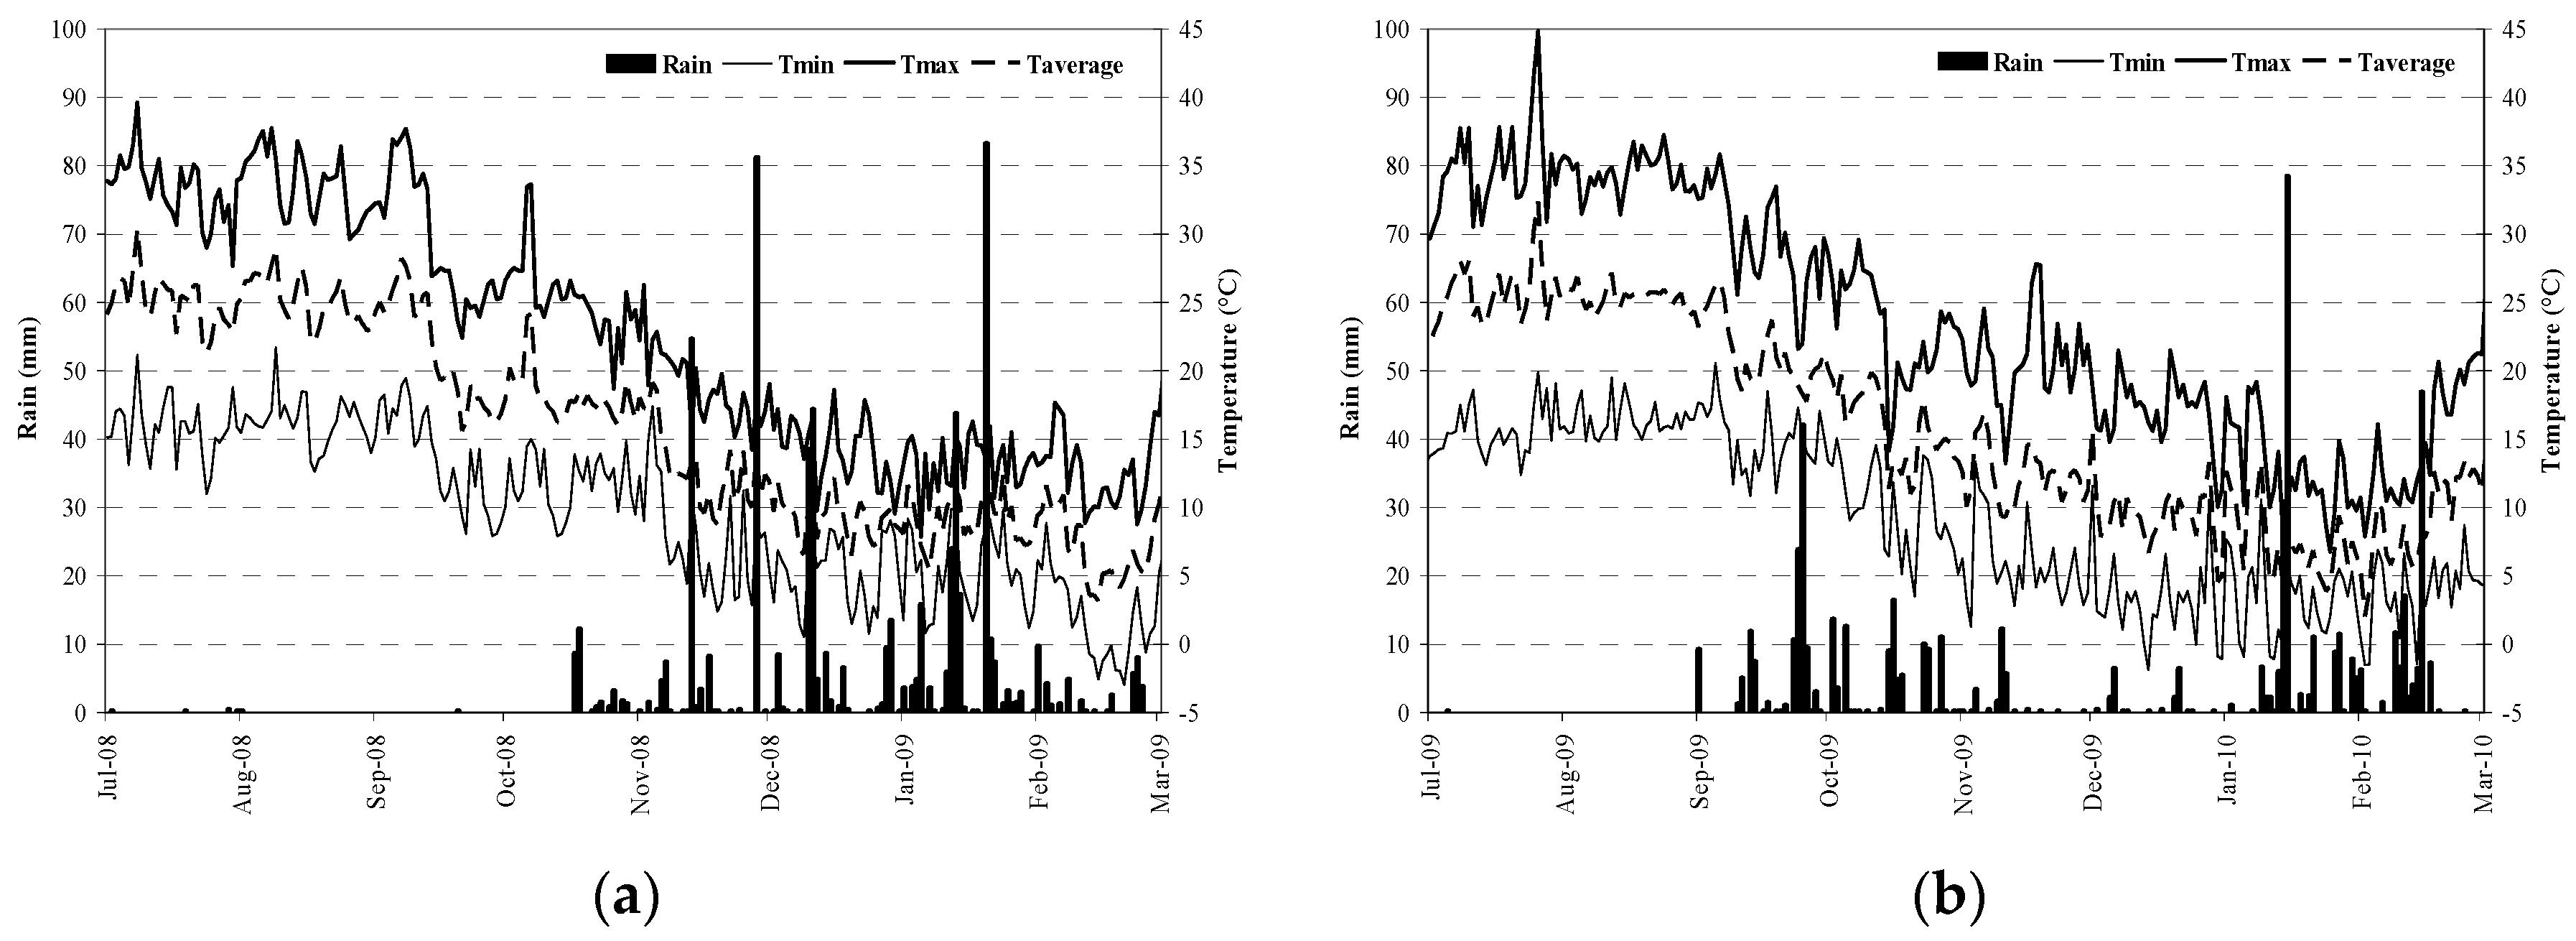
3]. Southern Italy, similar to many Mediterranean areas, is characterized by arid or semiarid conditions with mostly seasonal and unevenly distributed precipitation events. Rains are concentrated during late autumn-winter months with heavy precipitation events and long dry spring-summer spells when irrigations are necessary to obtain good yields from crops [4,5]. In this context, an appropriate irrigation management and wastewater reuse, as a non-conventional water resource, can help by providing a proportion of the irrigation water and reducing pressure on conventional water resources [6,7,8].
Worldwide, around 20 million hectares of land are irrigated with wastewater [9,10], and this value could increase during the next few decades as water demand intensifies. Climate change and global warming are encouraging this trend [11]. In fact, according to Valipour [12], 46% of the world is not suitable for rainfed agriculture because of climate changes and other meteorological conditions. In Mediterranean regions, wastewater reclamation and reuse is increasingly being integrated into strategies for saving water resources, particularly for irrigation [13,14,15]. The use of raw wastewater is nevertheless not recommended because it contains biodegradable organic matter, inorganic and organic chemicals, toxic substances, and disease-causing agents [16]. Epidemiological evidence exists for waterborne disease transmission by crops irrigated with untreated sewage [17], whereas appropriate wastewater treatment should ensure health protection [6].
Constructed wetland (CW) technologies have been found to be efficient in removing the major chemical pollutants and biological organisms from municipal and domestic wastewaters [18,19], which after treatment are suitable for crop irrigation [20,21]. The use of treated wastewater for irrigation [22,23] allows for the conservation of good quality water resources, thereby improving environmental and economic performance of the overall process of crop production. During CW treatment, not all the nutrients are removed (in particular, nitrogen and phosphorus) from wastewater. As reviewed by Vymazal [24], in horizontal subsurface flow of a CW system the average total nitrogen (TN), ammonium nitrogen (NH4-N), nitrate nitrogen (NO3-N), and total phosphorus (TP) wastewater load after treatment are 61%, 66%, 68%, and 68%, respectively, compared to the inlet flow. Nutrients may be available for crops irrigated with these water sources, thus reducing crop fertilizer inputs and consequently environmental pollution; for example, nitrogen fertilization is responsible for up to 50% of the total energy input in arable crops [25,26]. Furthermore, if wastewaters are used in the Mediterranean environment on crops that grow in the warm and dry season (like sorghum), the downward movement of soil solution containing N is naturally restrained by evapotranspiration. This might contribute to limit fertilizer rates while reducing environmental releases, without affecting yield potential. An important issue about the nutrients supplied with treated wastewater concerns the available nutrients fraction for plants. Considering available forms of N (NO3-N and NH4-N) and P (PO4-P) for plant nutrition, our previous results showed that they represent on average about 95% and 80% of TN and TP, respectively, in the CWs outlet water [27].
Moreover, nutrients supplied by wastewater as organic or insoluble forms become available through chemical and/or biological processes in a time that is function of soil and meteorological characteristics. In this context, arbuscular mycorrhizal fungi (AMF), a group of obligate biotrophs, may enhance the environmental sustainability of biomass production [28]. It is generally acknowledged that AMF symbiosis enhances plant mineral nutrition [29,30,31], and when associated with some bacteria or other fungi, they can increase the plant uptake from insoluble forms of nutrients [32]. Furthermore, AMF affect the water balance of host plants [33], and when irrigation volumes are reduced, they may improve crop water use efficiency [34].
Among the different agricultural systems, increasing attention has been paid in recent years to the use of wastewater for biomass crops [22], whose world production is approximately 985 million tons biomass per year [35]. On a large scale, irrigating energy crops with non-conventional water resources [36] in marginal soils could decrease the energy inputs for cultivation (decreasing fertilization needs and reducing pollutant disposal on the surface) and could help conserve potable water supplies, which is a useful feature particularly in semi-arid Mediterranean environments [37].
Considering energy crops, sorghum is a C4 crop with a high biomass yield and different possible bioenergy uses (combustion, bioethanol, anaerobic digestion) that make it a promising bioenergy plant [38,39]. It is outstanding in daily accumulation of dry matter [40] and presents a good nitrogen use efficiency [41]. Sorghum is a warm season crop that requires irrigation to achieve maximum yields in arid and semiarid environments [42,43,44]. Aerial biomass yields as high as 33 and 51 Mg·ha−1 (Mg: Megagram) were obtained by Habyarimana et al. [45] in their evaluations of temperate hybrids and tropical sorghum cultivars, respectively, under rainfed and 100% ETc restitution regimes. Cosentino et al. [46], in a field experiment conducted in Sicily using sweet sorghum, comparing three irrigation (0%, 50%, and 100% of ETc restoration) and four N fertilization (0, 60, 120, and 180 kg·ha−1) levels, observed that final yield was significantly affected only by the amount of water distribution with an average biomass production of 7.5, 21.1, and 27.1 Mg·ha−1 with 0%, 50%, and 100% ETc restoration, respectively. Moreover, the integration of wastewater into irrigation schemes can help farmers to better exploit soil water reserves; for example, for sorghum, early spring-summer sowings can be considered in the Mediterranean climate zone, but seed germination and emergence may be subjected to suboptimal soil temperatures and not uniform crop establishment may result. Thus, the availability of wastewater for irrigation can permit the sowing at the optimal time with a uniform crop emergence.
Crop harvest time influences both biomass yield and quality, thereby affecting bioenergy production [47,48]. However, the possible identification of different biomass harvest times allows for better biomass management by reducing the space required for its storage.
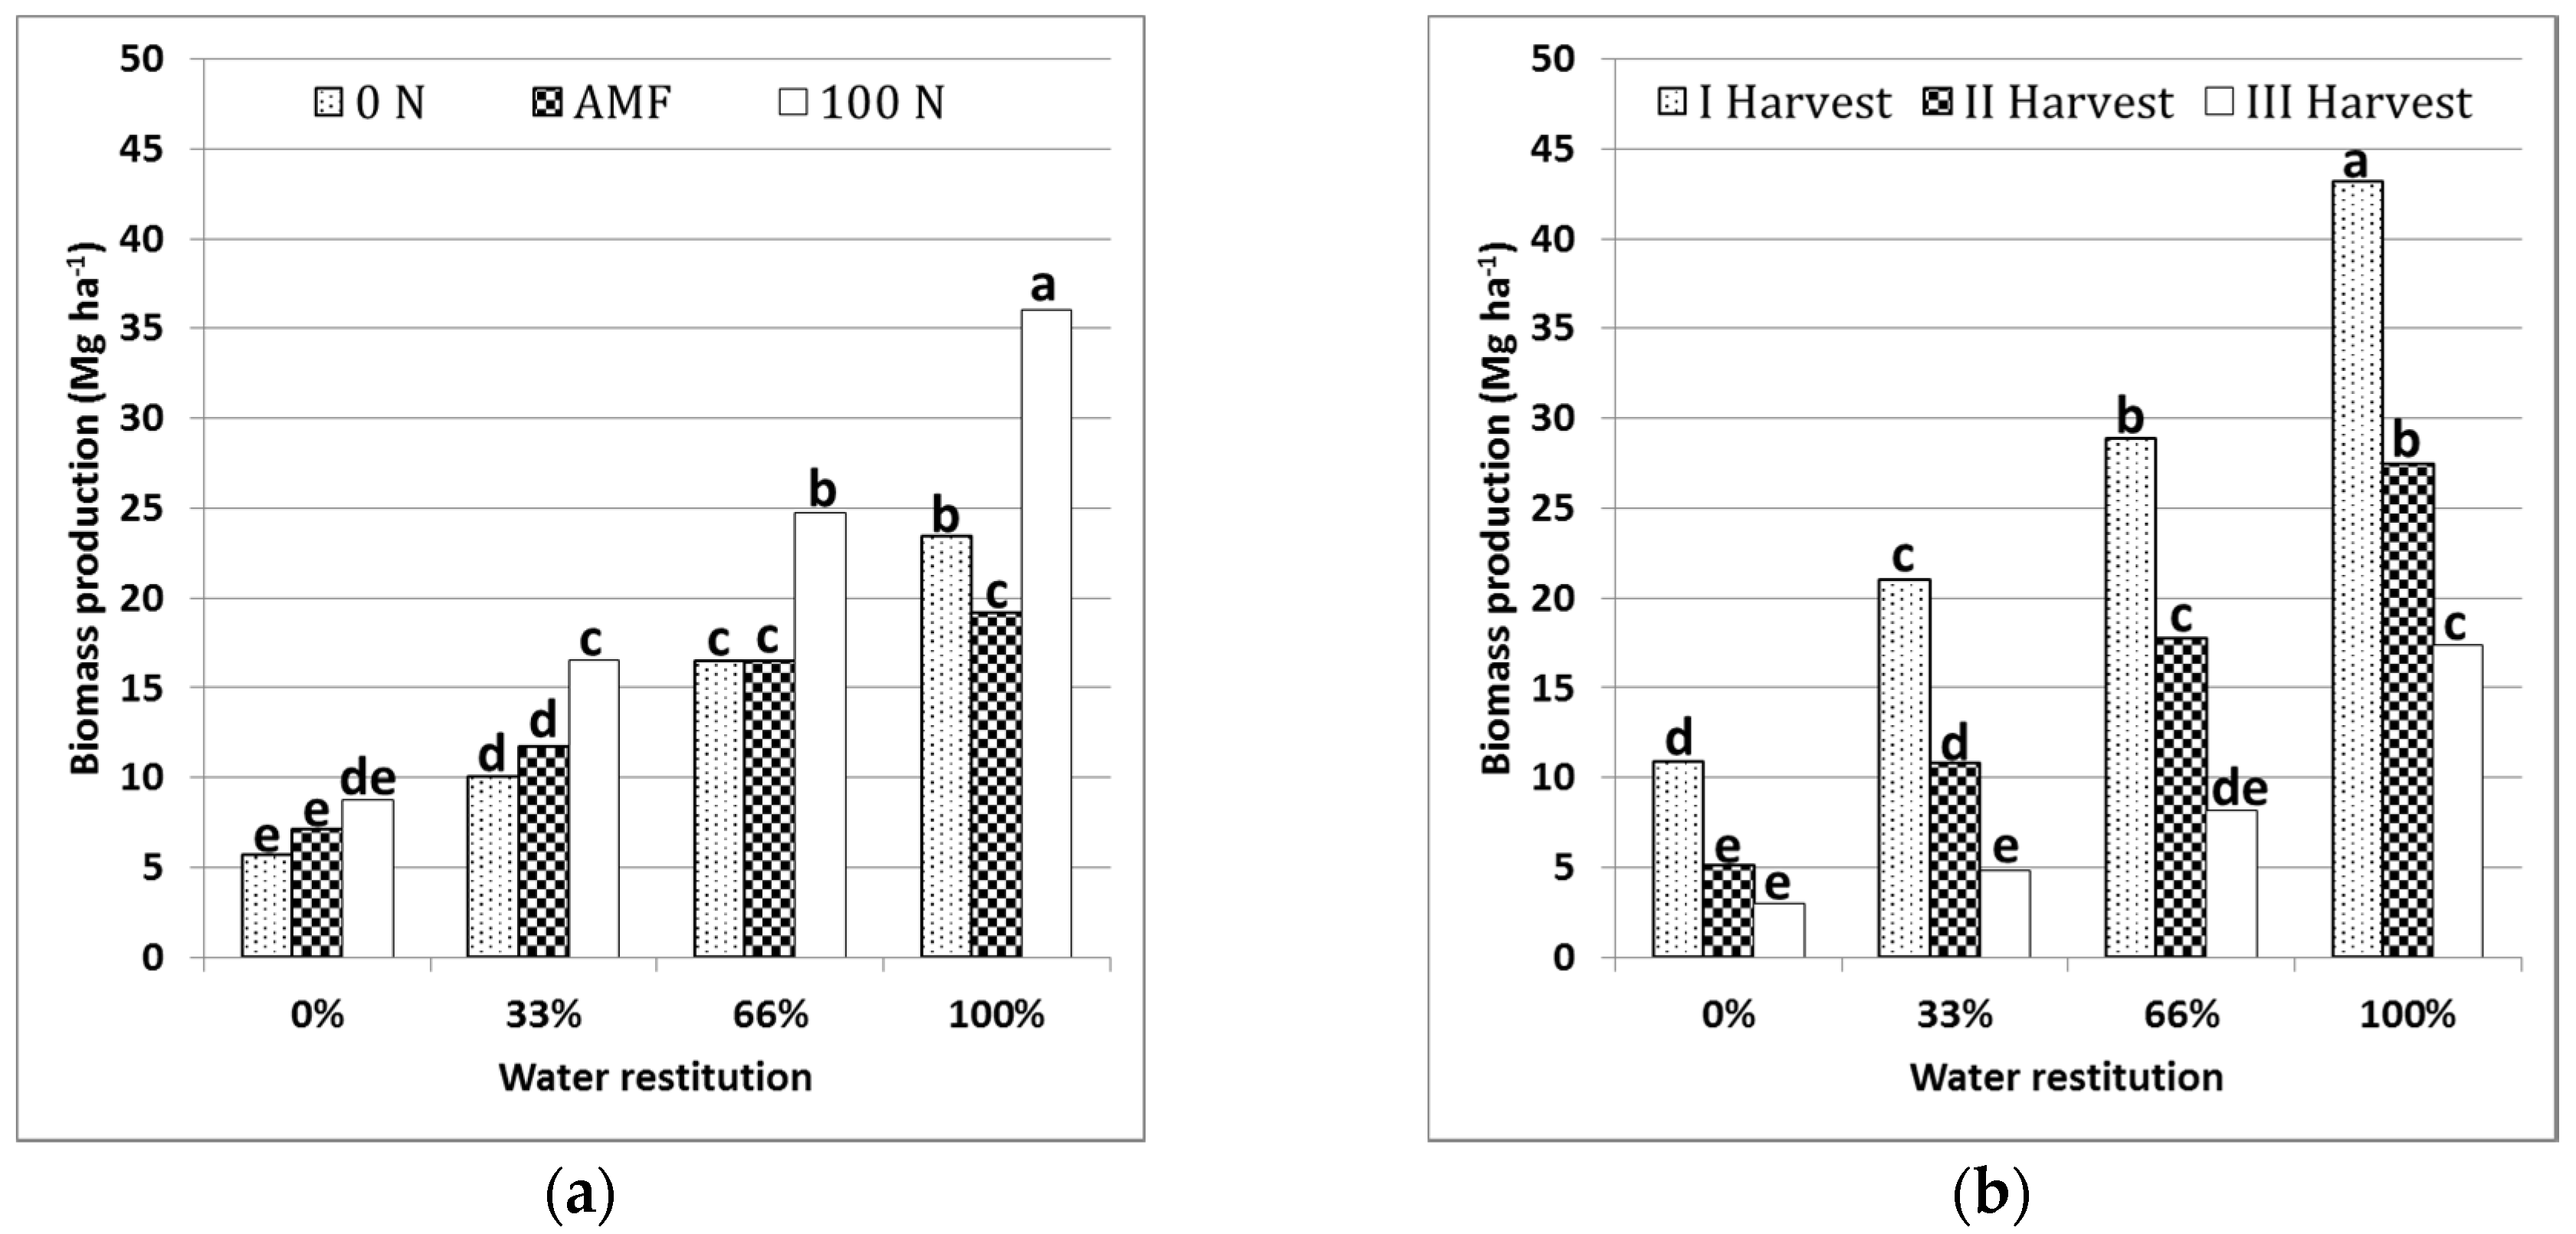
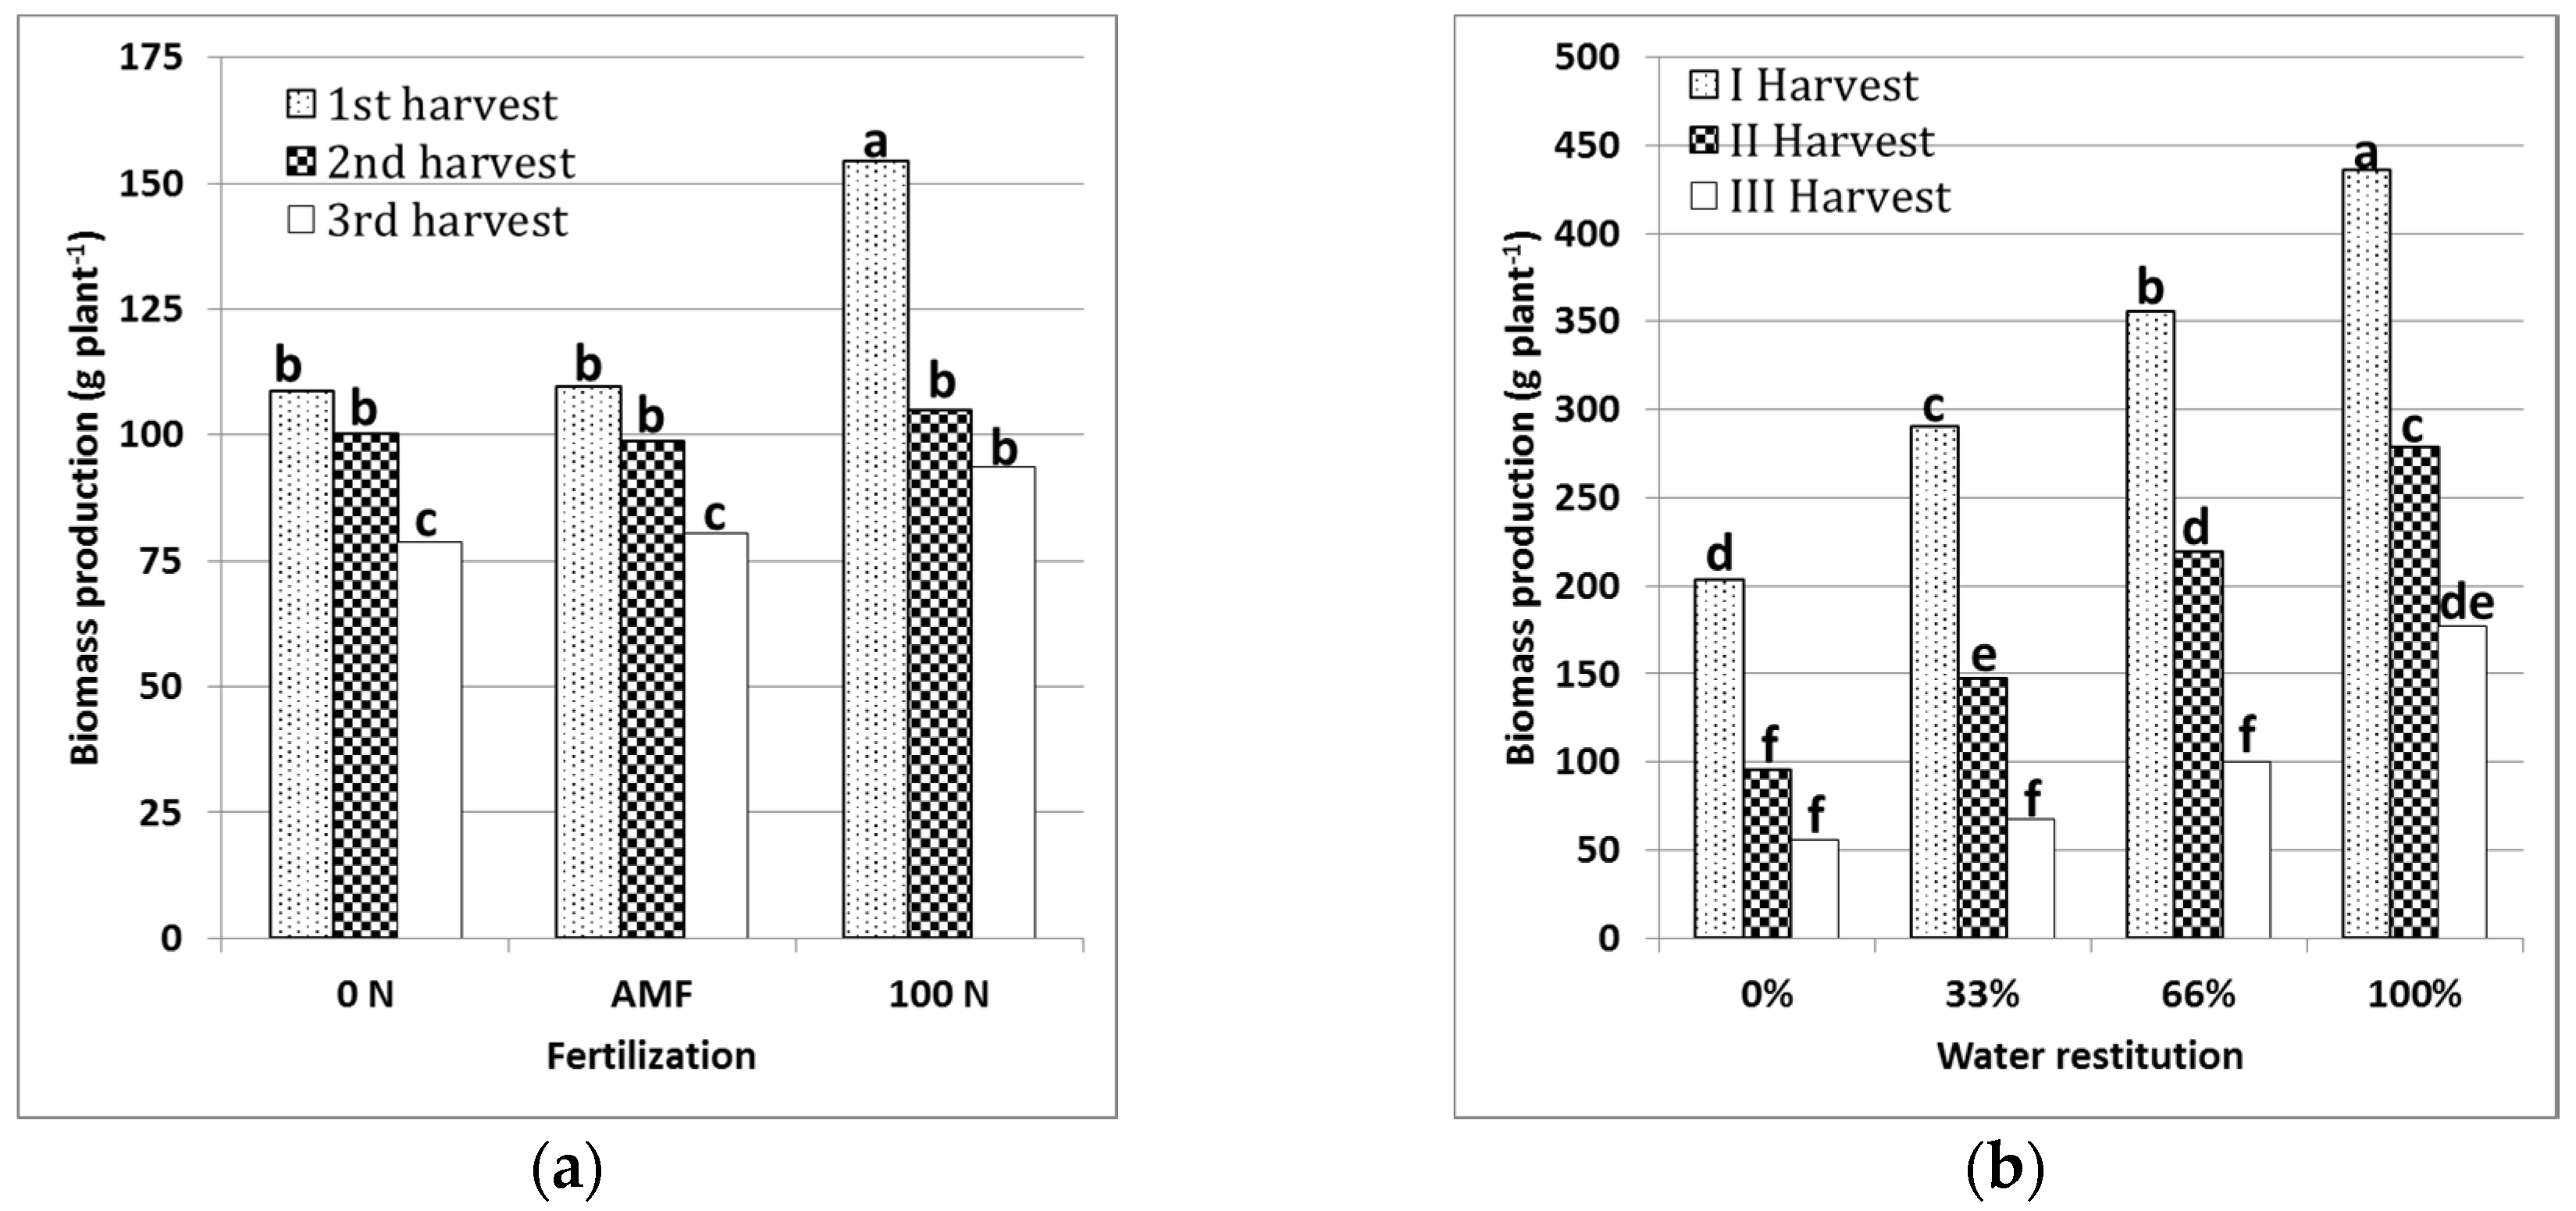
To our knowledge, no study has previously considered at the same time the effect of different urban wastewater volumes, bio-fertilization with AMF, and harvesting time on sorghum biomass production in a Mediterranean environment. With all these considerations in mind, a field trial was conducted in South Italy for two years in order to evaluate the biomass production of Sorghum bicolor (L.) Moench, as affected by: (1) four wastewater volume irrigations (0%, 33%, 66%, and 100% of ETc restitution); (2) three levels of fertilization (non-nitrogen fertilization, AMF fertilization, and mineral nitrogen fertilization); (3) different harvesting dates.

2. Materials and Methods

2.1. Experimental Site

The experiment was conducted in an open field in 2008–2010 near the CW system of S. Michele di Ganzaria (Eastern Sicily—Latitude 37°16′ N, Longitude 14°25′ E, altitude 490 m), a small town with about 5000 inhabitants.

2.2. Constructed Wetland and Water Cleaning Processes

Urban wastewater was treated by a primary and secondary conventional wastewater treatment plant, with a pre-treatment step followed by two parallel water lines (Imhoff tank, trickling filter, and a secondary sedimentation tank). Part of the secondary effluent of the conventional treatment plant, about 4 L·s−1, was diverted and treated by the two horizontal subsurface-flow CWs, in operation since 2001 and 2006 [49], which have a surface area of about 1950 m2 (25 m × 78 m) and 2080 m2 (33 m × 63 m), respectively. Phragmites australis (Cav.) Trin. ex Steud was used as vegetation in both beds.

2.3. Experimental Design and Treatments

Wastewater treated by CW has been used in an experimental field established for sorghum (Sorghum bicolor hybrid H133 Syngenta) biomass production near CW. In the two years of the trial, a split-plot design was used to compare four irrigation regimes (0%, 33%, 66%, and 100% of ETc restitution) and three sources of fertilization (non-nitrogen fertilization (0 N), bio-fertilization based on AMF (AMF), and mineral fertilization with ammonium nitrate (100 N)). Dry control treatment (0% ETc restitution) was irrigated until seedling establishment. The irrigation regimes were the main plots and fertilization levels were the sub-plots. Each sub-plot had a surface of 9 m2 (3 m × 3 m). In order to evaluate the optimum harvest time to balance productivity and moisture content, three dates were chosen to sample sorghum biomass inside each sub-plot, at the end of October 2008 and 2009 (almost full plant maturity-I Harvest), in November 2008 and 2009 (initial senescence stage-II Harvest), and February 2009 and 2010 (post-senescence stage-III Harvest).

2.4. Crop Establishment and Management

Sorghum was sown as a second crop on 7 July 2008 and 18 June 2009, adopting a seeding rate of 25 seeds·m−2 and no tillage technique. Soil was tilled only before the first crop season with one mouldboard ploughing (20 cm depth) and one harrowing (10 cm depth). The irrigation schedule was based on water restitution at four levels (0%, 33%, 66%, and 100%) restitution of ETc applied from July to October 2008 and from July to October 2009. The field was equipped with in-line labyrinth drippers provided by the Italian company Irritec S.p.A. (Capo d’Orlando, Italy) to increase the irrigation efficiency [50].
Treated wastewater irrigation scheduling was based on a simplified water balance equation:
I = ETc − P
where I is irrigation water applied (mm), ETc is the crop evapotranspiration (mm) rate calculated as a product of the reference evapotranspiration (ET0) and the crop coefficient (Kc) (FAO Irrigation and Drainage Paper No. 56). ET0 was determined from meteorological data by means of the FAO Penman-Monteith equation (FAO Irrigation and Drainage Paper No. 56). Daily climatic factors used in the Penman-Monteith equation consisted of solar radiation (SR), air temperature (T), relative humidity (RH), wind speed at 2 meters (U2) and direction, rainfall (P) and were determined using an on-site CR510 automatic weather station (Campbell Scientific, Logan, UT, USA) located close to the experimental site.
In bio-fertilized plots was used the commercial biological formulation Micosat F—AT WP composed by AMF (Glomus genus), rhizosphere bacteria, and saprophytic antagonistic fungi. Bio-fertilizer was uniformly mixed in soil contiguous to seeds (18 L·ha−1) supplied only in the first year, and the residual effects were studied in the second year. In mineral fertilized plots, 100 kg·N·ha−1 of ammonium nitrate was applied, distributed half at sowing and half at the beginning of stem elongation. The same phosphate fertilization, 40 kg·ha−1 in each vegetative season, was supplied for all studied treatments.

2.5. Wastewater Analysis

During both irrigation seasons, 2008 and 2009, biweekly water samples were collected from CW effluents and the physical–chemical characteristics were analyzed. The following parameters were measured according to Standard Methods [51]: Total Suspended Solid (TSS) (at 105 °C), Biological Oxygen Demand (BOD5), Chemical Oxygen Demand (COD), Total Nitrogen (TN), Total Phosphorus (TP), Electrical Conductivity (EC), and pH. BOD5 and COD of CW effluents were evaluated on samples filtered by GF/C Whatman glass fibre.

2.6. Soil Analysis

From each main plot, four soil samples were collected (0–30 cm depth) at the beginning of the experiment (July 2008), before the application of urban treated wastewater, and at the end of each production season (March 2009 and 2010). Chemical and physical analyses, reported in Table 1, were conducted according to the “Official methods of soil analysis” of the Italian Ministry of Agriculture and Forestry. The soil texture was classified as clay, according United States Department of Agriculture Soil Taxonomy [52], with the following percentage values: sand 20.3%, silt 22.6%, and clay 57.1%.

2.7. Analysis of Root Mycorrhization

In all plots, at the end of each growing season, samples of root systems were collected from three randomly selected plants with a hand-operated soil probe (5 cm diameter) to a depth of 20 cm. Roots were washed with a few drops of Tween 20 in tap water and then rinsed several times in tap water. After that, the roots were cleared with 10% KOH and stained with 0.1% cotton blue in lactic acid solution overnight (about 12 h). Roots were then de-stained with pure lactic acid for about 2 h. The percentage of AMF colonization (arbuscular abundance in the root systems (A %) and frequency of root colonization (F %)) was estimated in accordance with Trouvelot et al. [53].

2.8. Biomass Dry Weight

At every harvest time, three samples consisting of five plants each, were collected from opposite sides and the middle of each plot. Biomass dry weight was determined by drying samples in a thermo-ventilated oven at 65 °C until constant weight was reached.

2.9. Statistical Analysis

Statistical analysis was carried out by Analysis of Variance (ANOVA) using CoStat version 6.003 (CoHort Software, Monterey, CA, USA). Mean values were compared using Fisher's least significant difference (LSD) test.

3. Results and Discussion

3.1. Meteorological Variables

The experimental area is characterized by a typical dry Mediterranean climate (around 500 mm·year−1 precipitation) dominated by a Mediterranean rainfall regime: rains with an uneven distribution throughout the year with spring/summer being the driest period (occasional rainfall) and autumn/winter the wettest. The rainfall registered from July to November 2008 was 196 mm while from July to November 2009 it was 249 mm (Figure 1), with 104 and 120 days without precipitations, respectively. The longest dry periods were registered from July to mid-October in the first year (76 consecutive days without rain) and from July to the end of August in the second (55 consecutive days without rain). During the 2008 and 2009 growing seasons, the daily average air temperature was 20.6 and 20.2 °C, respectively.

3.2. Soil Analysis

At the beginning of the trials, the soil analysis showed a remarkable shortage of nutrients, such as organic carbon (OC), TN, and phosphorus (Table 1). The main soil chemical properties remained almost unchanged from July 2008 to March 2010, except for OC and TN contents, which fluctuated during the study period. Consequently, the C/N ratio reached its maximum value at the end of the studied period due to an increase in OC concentration and a reduction in TN content. This result can be related to the: (i) different meteorological condition (especially rain) during the studied years; (ii) supply of organic matter and nitrogen by the wastewater; (iii) no tillage soil management; (iv) soil N depletion through plant uptake. In fact, the variation of the availability of soluble C and N is notably affected by seasonal meteorological conditions and agricultural practices [54] that in turn influence soil microbial biomass and activity [55,56].

3.3. Wastewater Analysis, Irrigation, and Nutrients Applied

The average wastewater characteristics of the CW effluents during the studied period are shown in Table 2. BOD5, COD, TN, and TP concentrations in all analyzed samples were below the limits required by Italian law for the reuse of CW effluents for agriculture (20 mg·L−1 for BOD5, 100 mg·L−1 for COD, 35 mg·L−1 for TN, and 10 mg·L−1 for TP). The Total Suspended Solids (10 mg·L−1 law limit) measured concentrations were above the standard limits at the end of the trial period. Wastewater composition confirms that horizontal flow of CWs are very effective as a tertiary treatment of urban wastewater. They have been successfully used to treat municipal wastewater with a wide range of inflow concentrations [57]. In addition to wastewater treatment, CWs are often designed for multipurpose ecosystems services such as carbon sequestration or wildlife habitat [58], which can assume particular relevance in semi-arid and arid environments. The results reported in this study confirmed the findings of Cirelli et al. [59] for the same CW system during its first five years of operation (2001–2005). The maintenance of treatment performance shows that CWs can guarantee high performance over time. As in this study, they observed an effluent average quality compatible with the limits imposed by the Italian regulation for wastewater discharge in water bodies and for wastewater reuse.
The lower precipitation in the 2008 irrigation season (July to October), with only 32 mm, compared to the same period in 2009, with about 225 mm, generated very different plant water availability in the soil. Consequently, the irrigation wastewater volumes were significantly higher in 2008 than in 2009. Volumes applied were 450 mm, 600 mm, and 700 mm (2008 irrigation season) and 150 mm, 300 mm, and 450 mm (2009 irrigation season) on plots with 33%, 66%, and 100% restitution of crop evapotranspiration, respectively.
The amounts of TN and TP released with irrigation water during the studied period are reported in Table 3. In the 2009 season, a higher TN amount (ranging from 20.7 to 62.1 kg·ha−1) with respect to 2008 was applied with irrigation, despite the lower water volumes, due to its substantially higher concentration. In both seasons, the quantities of TP supplied with mineral fertilization and irrigation exceeded the 65 kg·ha−1 required by the sorghum crop [60] except for 33% ETc and 66% ETc treatments in 2009 season.

3.4. Analysis of Mycorrhization

Comparing the AMF colonization and infection data, no significant differences were detected between the two years. The percentage frequency of AMF in the sorghum root systems was significantly (p < 0.05) higher in the N-fertilization treatment (41.5%) than the bio-fertilization (32.5%) and non-fertilization (26.0%) treatments, whereas the arbuscular presence was detected only in the inoculated plants (Table 4).
The highest infection, observed in non-mycorrhized nitrogen fertilized plants, suggested that the infection may be attributed to the presence of indigenous mycorrhizal fungi in the soil and that nitrogen supply exerts a positive effect on them [61]. The initial nutrient status of ecosystems may determine responses of AMF to fertilization, as the presence of high levels of fertilizer in the soil dramatically alters the interaction between plants and microbial communities [62]. As such, N additions could raise native AMF community in the N limited sites [63] more than the inoculation of a commercial fertilizer based on AMF. Our results are in agreement with Garcia et al. [64] who found, in the Duke Forest, significantly higher tree root AMF colonization in areas that were fertilized applying 100 kg·N·ha−1.

3.5. Plant Aboveground Dry Biomass and Its Components

Table 5 shows the effects of the studied factors on aboveground dry biomass per plant and its components separately in the two cropping seasons. Plant dry weight was significantly affected by all the studied factors (fertilization treatments, ETc restitutions, and harvesting dates) and by interaction of fertilization and harvest date in 2008 (Figure 2a) and ETc restitutions and harvest date in 2009 (Figure 2b).
Regardless of the other studied factors (ETc restitution and harvesting dates), nitrogen fertilization determined a significant enhancement of dry aboveground biomass per plant equal to 117.8 g·plant−1 on the first year (+22.8%) and to 219.9 g·plant−1 on the second (+16.8% in the second) as compared to the control (95.9 and 188.2 g·plant−1, respectively). This result may be mainly attributed to the significant rise in culm dry weight (Table 5) determined by the highest nitrogen fertilization. Johnston et al. [65] reported that application of nitrogen fertilizer increases sorghum culm yield. Sainju et al. [66] and Almodares et al. [67] reported an increase of biomass production due to nitrogen fertilization. The mycorrhization of plants did not promote significant biomass differences from the unfertilized control treatment in either trial year, whereas in the second year, the mycorrhizal fungi effect was also not statistically different from N fertilized plants (Table 5).
Whatever the fertilization and the harvest date, ETc restitution, from 0% to 100%, determined a progressive significant increase in dry biomass in the two growing seasons. The significantly lowest and highest biomass productions, as expected, were found, in both years, at 0% (67.1 and 118.2 g·plant−1 in 2008 and 2009, respectively) and 100% (139.2 and 297.4 g·plant−1 in 2008 and 2009, respectively) water restitution. At the highest water restitution rate, a constant significant rise in culm and leaf dry weight were observed (Table 5). Dalla Marta et al. [68], investigating sweet sorghum growth and productive responses to different water treatments, reported that increasing irrigation volumes promoted crop growth, leading to significant differences in fresh and dry biomass weights, and in fresh and dry culm weights.
Regardless of the other factors, in both years, regarding the effects of the different harvests, the first harvesting date gave the highest biomass production per plant (124.0 g·plant−1 in the first year and 321.3 g·plant−1 in the second), followed by the second harvest (101.4 g·plant−1 in the first year and 185.3 g·plant−1 in the second). The third harvest was the worst in both cropping seasons (84.2 g·plant−1 in 2008 and 100.2 g·plant−1 in 2009). A significantly higher leaf dry weight was found at the first harvest. For energy and other biomass uses, it may be envisaged that the whole plant contributes to final output, whereas the stem is the only plant fraction used for fiber extraction and bio-ethanol production [41]. Thus, the final biomass composition for specific uses may also be regulated by an opportune choice of harvesting date.
For the first year, the significance of the interaction of fertilization and harvest date revealed that the first harvest gave the best production in the 100 N fertilized plot but was not significantly different from the second one in unfertilized and in AMF plots. For the second year, the higher productions registered on the first harvest increased as the ETc restitutions were raised (Figure 2).

3.6. Shoots Number per Unit Area and Biomass Yield per Hectare (ha)

The number of shoots per square meter was higher (+50.9%) in the first year (15.1 shoots·m−2) than in the second year (7.6 shoots·m−2) (Table 6). Moreover, a significant increase of the shoots number in both years was promoted by water restitution increases. Nitrogen fertilization significantly influenced the number of shoots in both years, with an average increase of 74% the first year and 85% the second year as compared to the unfertilized treatment (control). However, during the first growing season, the best results for shoots number were obtained with nitrogen fertilization at the highest ETc restitutions. AMF inoculation significantly increased (+11.4%) the shoots number per square meter as compared to the unfertilized treatment only in 2009 (Table 6). No interactions between the studied factors were found for this character in the second growing season.
When biomass yield per ha was examined, the different irrigation regimes generated significantly different aboveground dry biomass productions (Figure 3a), with the highest values detected in 100% ETc plots (average value of about 27.78 Mg·ha−1) and lowest in 0% ETc plots (average value of about 6.76 Mg·ha−1). No significant differences were highlighted between 33% and 66% ETc plots, with an average dry biomass yield of about 16.49 Mg·ha−1. The percentage biomass yield loss, on average of the two cropping seasons and fertilization treatments, was significantly (p < 0.01) negatively related with ETc percentage restitution (Figure 3b). The higher yield performance observed under the 100% ETc restitution regime indicates that any effort to maximize and stabilize sorghum biomass production might be subordinated to an adequate water supply [44]. The highest yield recorded under 100% ETc was similar to the one reported under similar experimental conditions by Campi et al. [36] (23 Mg·ha−1). Nitrogen fertilization determined a significantly higher biomass production (+56.4%) than other treatments, especially in the first year (Figure 3a) due to the larger number of differentiated culms (Table 6). In the 2009 season, the weight per plant increased (Table 5), allowing maintenance of crop dry matter production comparable to that obtained in 2008 (Figure 3a and Figure 4a,b) despite the lower stem density (Table 6). The average biomass moisture content values in the three harvests showed no significant differences (71%, 70%, and 68% in the first, second, and third, respectively) while the biomass yield was significantly lower at the third harvest in 2009 (Figure 4b), due to the progress of plant senescence in winter, with a 42.5% lower production than the average biomass obtained in the first and second harvest. Analyzing the interaction effect of the studied factors in each year, similarly to the number of shoots, biomass production per hectare was significantly affected by the interaction of ETc restitution and fertilization in 2008 (Figure 5a) and similarly to the production per plant, by the interaction of ETc restitution and harvest date in 2009 (Figure 5b).

4. Conclusions

The analysis of CW irrigation water quality, except for TSS values in a few samples, showed values below the maximum allowed by Italian legislation for the reuse of CWs wastewater in agriculture, but at the same time provided useful amounts of N and P for plant nutrition. Wastewater spreading influenced only a few soil chemical properties (C and N contents), suggesting that the wastewater effects on crop production, by changing soil chemical characteristics, should be evaluated in long period trials. Moreover, the enhancement in organic carbon registered after two years of treated wastewater irrigation may positively influence soil fertility maintenance, assuring also a suitable environment for the useful microorganisms.
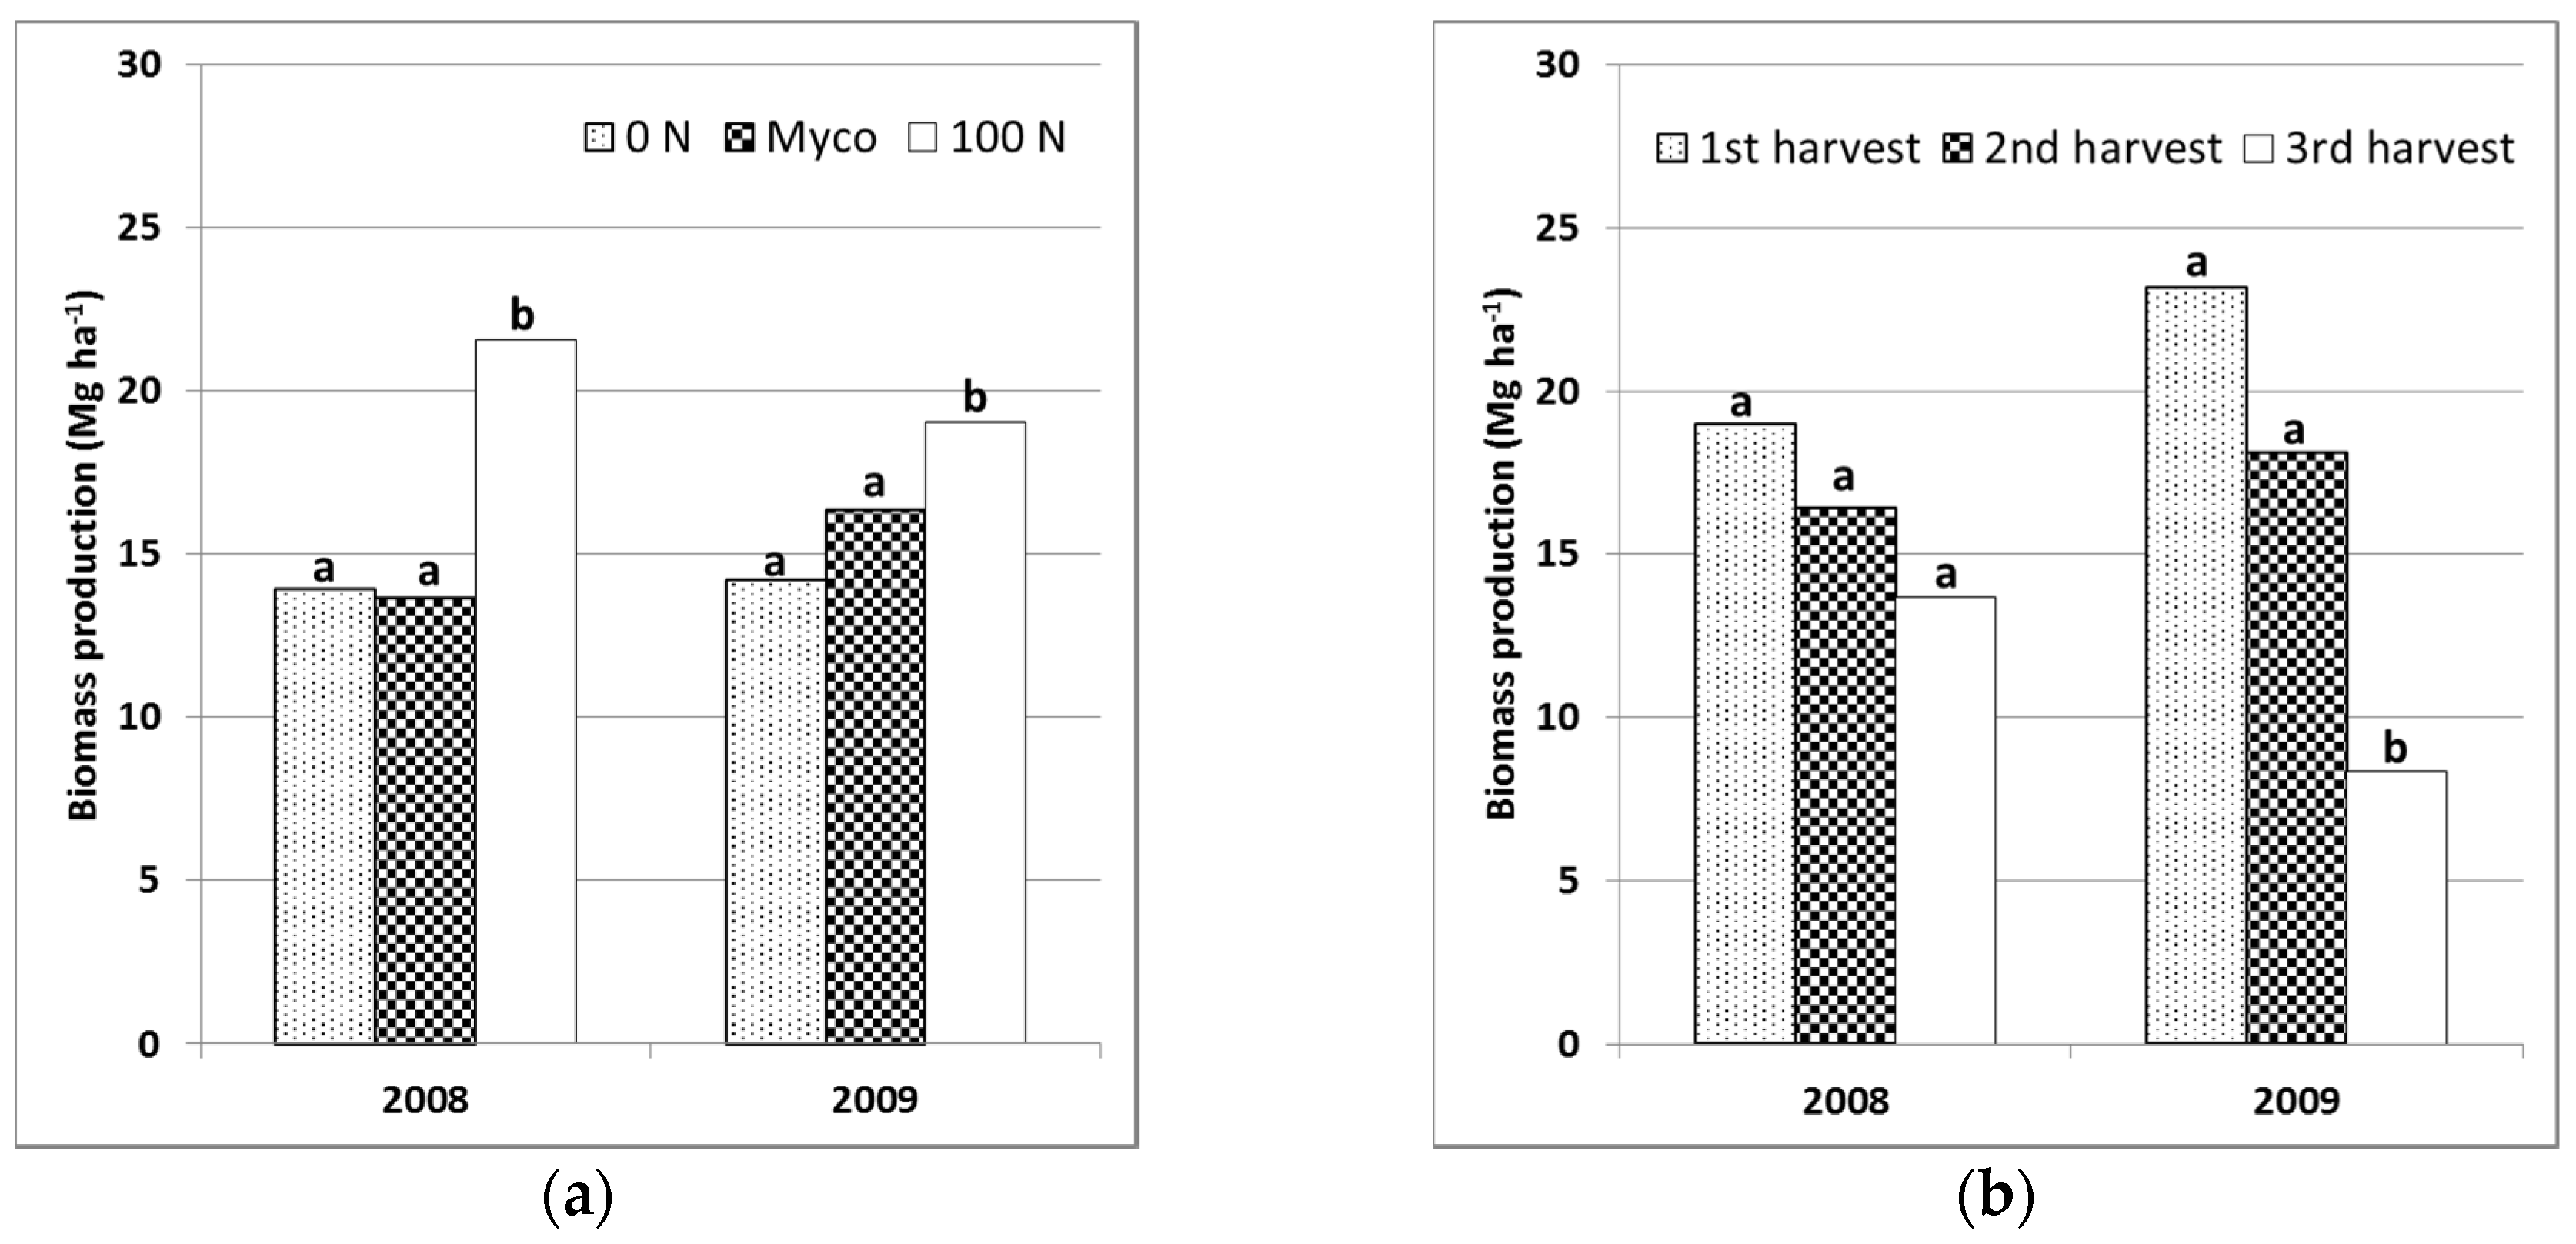
Nitrogen and water availability are unanimously considered to be the two major limiting factors in crop growth, therefore the sorghum biomass yield, as expected, was positively affected by nitrogen fertilization and ETc restitution levels, with a rise in the yield for all plots (unfertilized and fertilized) in the second cropping season.
No advantages in terms of biomass production can be ascribed to mycorrhizal inoculum in as much as native mycorrhizal fungi colonization were present in both nitrogen-fertilized and non-fertilized sorghum roots. The presence in the soil of native mycorrhizal fungi was tied to the typical extensive (low input) agriculture of the inland areas of Sicily.
Harvesting date was a very important factor in determining the optimal period for highest aboveground dry biomass yield if the crop is cultivated for energy purposes. In particular, it was shown that plant harvesting at the end of the senescence phase causes a dry biomass loss without substantial reductions of tissue moisture content with hence no different biomass calorific value.
The spring-summer Mediterranean weather conditions meet the productive needs of sorghum with the exception of water requirements, which are not satisfied by the almost null spring-summer rainfall. Thus, especially in these arid and semi-arid areas, the reuse of urban CWs treated wastewater can be an important tool to enhance and stabilize spring crops production, and to reduce energy inputs by recycling scarce quality water and nutrients otherwise lost in the environment. However, wastewater use should also be preceded by additional analysis to confirm the absence, or the presence below the law limits, of harmful substances to human beings (heavy metals and/or emerging contaminants).

Acknowledgments

The research activity was financially supported by the MIUR (Italian Ministry of Education, University and Research) through the Programmi di Ricerca Scientifica di Rilevante Interesse Nazionale—PRIN 2007—“Production and energy transformation of herbaceous biomasses irrigated with wastewater”. The funding source had no involvement in study design; in the collection, analysis and interpretation of data; in the writing of the report.

Author Contributions

A.C.B. and M.M. conceived and designed the experiments; M.M., A.C.B., C.M., and C.C performed experiment and laboratory analysis; A.C.B., M.M., C.M. and V.C. analyzed the data; A.C.B. contributed reagents/materials/analysis tools; C.M., A.C.B., V.C, M.M., C.C. and M.B. wrote and revised the paper.

Conflicts of Interest

The authors declare no conflict of interest. The founding sponsors had no role in the design of the study; in the collection, analyses, or interpretation of data; in the writing of the manuscript, and in the decision to publish the results.

References

  1. Scanlon, B.R.; Jolly, I.; Sophocleous, M.; Zhang, L. Global impacts of conversions from natural to agricultural ecosystems on water resources: Quantity versus quality. Water Resour. Res. 2007, 43, W03437. [Google Scholar] [CrossRef]
  2. Iglesias, A.; Garrote, L.; Flores, F.; Moneo, M. Challenges to manage the risk of water scarcity and climate change in the Mediterranean. Water Resour. Manag. 2007, 21, 775–788. [Google Scholar] [CrossRef]
  3. Jury, W.A.; Vaux, H. The role of science in solving the world’s emerging water problems. Proc. Natl. Acad. Sci. USA 2005, 102, 15715–15720. [Google Scholar] [CrossRef] [PubMed]
  4. Barbagallo, S.; Barbera, A.C.; Cirelli, G.L.; Milani, M.; Toscano, A. Reuse of constructed wetland effluents for irrigation of energy crops. Water Sci. Technol. 2014, 70, 1032–1039. [Google Scholar] [CrossRef] [PubMed]
  5. Valipour, M. Hydro-module determination for Vanaei Village in Eslam Abad Gharb, Iran. ARPN J. Agric. Biol. Sci. 2012, 7, 968–976. [Google Scholar]
  6. Pereira, L.S.; Oweis, T.; Zairi, A. Irrigation management under water scarcity. Agric. Water Manag. 2002, 57, 175–206. [Google Scholar] [CrossRef]
  7. Valipour, M.; Eslamian, S. Analysis of potential evapotranspiration using 11 modified temperature-based models. Int. J. Hydrol. Sci. Technol. 2014, 4, 192–207. [Google Scholar] [CrossRef]
  8. Valipour, M.; Singh, V.P. Global Experiences on Wastewater Irrigation: Challenges and Prospects. In Balanced Urban Development: Options and Strategies for Liveable Cities; Maheshwari, B., Singh, V.P., Thoradeniya, B., Eds.; Springer: Bern, Switzerland, 2016; pp. 289–327. [Google Scholar]
  9. Hamilton, A.J.; Stagnitti, F.; Xiong, X.; Kreidl, S.L.; Benke, K.K.; Maher, P. Wastewater irrigation: The state of play. Vadose Zone J. 2007, 6, 823–840. [Google Scholar] [CrossRef]
  10. Keraita, B.; Jiménez, B.; Drechsel, P. Extent and implications of agricultural reuse of untreated, partly treated and diluted wastewater in developing countries. CAB Rev. 2008, 3, 1–15. [Google Scholar] [CrossRef]
  11. Alcamo, J.; Flörke, M.; Märker, M. Future long-term changes in global water resources driven by socio-economic and climatic changes. Hydrolog. Sci. J. 2007, 52, 247–275. [Google Scholar] [CrossRef]
  12. Valipour, M. Necessity of irrigated and rainfed agriculture in the world. Irrig. Drain. Syst. Eng. 2013. [Google Scholar] [CrossRef]
  13. Cirelli, G.L.; Consoli, S.; Licciardello, F.; Aiello, R.; Giuffrida, F.; Leonardi, C. Treated municipal wastewater reuse in vegetable production. Agric. Water Manag. 2012, 104, 163–170. [Google Scholar] [CrossRef]
  14. Angelakis, A.N.; Marecos Do Monte, M.H.F.; Bontoux, L.; Asano, T. The status of wastewater reuse practice in the Mediterranean basin: Need for guidelines. Water Res. 1999, 33, 2201–2217. [Google Scholar] [CrossRef]
  15. Lopez, A.; Pollice, A.; Lonigro, A.; Masi, S.; Palese, A.M.; Cirelli, G.L.; Toscano, A.; Passino, R. Agricultural wastewater reuse in southern Italy. Desalination 2006, 187, 323–334. [Google Scholar] [CrossRef]
  16. Salgot, M.; Huertas, E.; Weber, S.; Dott, W.; Hollender, J. Wastewater reuse and risk: Definition of key objectives. Desalination 2006, 187, 29–40. [Google Scholar] [CrossRef]
  17. Peterson, S.; Ashbolt, N. Viral risks associated with wastewater reuse: Modeling virus persistence on wastewater irrigated salad crops. Water Sci. Technol. 2001, 43, 23–26. [Google Scholar]
  18. Vymazal, J. Removal of enteric bacteria in constructed treatment wetlands with emergent macrophytes: A review. J. Environ. Sci. Heal. 2005, 40, 1355–1367. [Google Scholar] [CrossRef]
  19. Mietto, A.; Borin, M. Performance of two small subsurface flow constructed wetlands treating domestic wastewaters in Italy. Environ. Technol. 2013, 34, 1085–1095. [Google Scholar] [CrossRef] [PubMed]
  20. Pedrero, F.; Kalavrouziotis, I.; Alarcón, J.J.; Koukoulakis, P.; Asano, T. Use of treated municipal wastewater in irrigated agriculture—Review of some practices in Spain and Greece. Agric. Water Manag. 2010, 97, 1233–1241. [Google Scholar] [CrossRef]
  21. Castorina, A.; Consoli, S.; Barbagallo, S.; Branca, F.; Farag, A.; Licciardello, F.; Cirelli, G.L. Assessing environmental impacts of constructed wetland effluents for vegetable crop irrigation. Int. J. Phytoremediat. 2016, 18, 626–633. [Google Scholar] [CrossRef] [PubMed]
  22. Borin, M.; Barbera, A.C.; Milani, M.; Molari, G.; Zimbone, S.M.; Toscano, A. Biomass production and N balance of giant reed (Arundo donax L.) under high water and N input in Mediterranean environments. Eur. J. Agron. 2013, 51, 117–119. [Google Scholar] [CrossRef]
  23. Aiello, R.; Cirelli, G.L.; Consoli, S. Effects of reclaimed wastewater irrigation on soil and tomato fruits: A case study in Sicily (Italy). Agric. Water Manag. 2007, 93, 65–72. [Google Scholar] [CrossRef]
  24. Vymazal, J. Removal of nutrients in various types of constructed wetlands. Sci. Total Environ. 2007, 380, 48–65. [Google Scholar] [CrossRef] [PubMed]
  25. Cavazza, L. Output and input analysis in energy balance of agricultural production. Riv. Agron. 1983, 17, 202–211. [Google Scholar]
  26. Reed, W.; Geng, S.; Hills, F.J. Energy input and output analysis of four field crops in California. J. Agron. Crop Sci. 1986, 157, 99–104. [Google Scholar] [CrossRef]
  27. Milani, M.; University of Catania, Catania, Italy. Personal communication, 2016.
  28. Liu, T.; Wang, C.; Chen, H.; Fang, F.; Zhu, X.; Tang, M. Effects of arbuscular mycorrhizal colonization on the biomass and bioenergy production of Populus × canadensis ‘Neva’ in sterilized and unsterilized soil. Acta Physiol. Plant. 2014, 36, 871–880. [Google Scholar] [CrossRef]
  29. Clark, R.B.; Zeto, S.K. Mineral acquisition by arbuscular mycorrhizal plants. J. Plant Nutr. 2000, 23, 867–902. [Google Scholar] [CrossRef]
  30. Mensah, J.A.; Koch, A.M.; Antunes, P.M.; Kiers, E.T.; Hart, M.; Bücking, H. High functional diversity within species of arbuscular mycorrhizal fungi is associated with differences in phosphate and nitrogen uptake and fungal phosphate metabolism. Mycorrhiza 2015, 25, 533–546. [Google Scholar] [CrossRef] [PubMed]
  31. Garg, N.; Chandel, S. Arbuscular mycorrhizal networks: Process and functions. A review. Agron. Sustain. Dev. 2010, 30, 581–599. [Google Scholar] [CrossRef]
  32. Taktek, S.; Trépanier, M.; Servin, P.M.; St-Arnaud, M.; Piché, Y.; Fortin, J.A.; Antoun, H. Trapping of phosphate solubilizing bacteria on hyphae of the arbuscular mycorrhizal fungus Rhizophagus irregularis DAOM 197198. Soil Biol. Biochem. 2015, 90, 1–9. [Google Scholar] [CrossRef]
  33. Augé, R.M. Water relations, drought and vesicular-arbuscular mycorrhizal symbiosis. Mycorrhiza 2001, 11, 3–42. [Google Scholar] [CrossRef]
  34. Dodd, I.C.; Ruiz-Lozano, J.M. Microbial enhancement of crop resource use efficiency. Curr. Opin. Biotechnol. 2012, 23, 236–242. [Google Scholar] [CrossRef] [PubMed]
  35. Gokcol, C.; Dursun, B.; Alboyaci, B.; Sunan, E. Importance of biomass energy as alternative to other sources in Turkey. Energ. Policy 2009, 37, 424–431. [Google Scholar] [CrossRef]
  36. Campi, P.; Navarro, A.; Palumbo, A.D.; Mastrangelo, M.; Lonigro, A.; Mastrorilli, M. Bioenergy productivity of sugar beet irrigated with reclaimed wastewaters. Ital. J. Agron. 2015, 10, 155–159. [Google Scholar] [CrossRef]
  37. Zema, D.A.; Bombino, G.; Andiloro, S.; Zimbone, S.M. Irrigation of energy crops with urban wastewater: Effects on biomass yields, soils and heating values. Agric. Water Manag. 2012, 115, 55–65. [Google Scholar] [CrossRef]
  38. Monteiro, J.S.T.; Havrland, B.; Ivanova, T. Sweet sorghum (Sorghum bicolor (L.) Moench) bioenergy value–importance for Portugal. Agric. Trop. Subtrop. 2012, 45, 12–19. [Google Scholar] [CrossRef]
  39. Kołodziej, B.; Antonkiewicz, J.; Stachyra, M.; Bielińska, E.J.; Wiśniewski, J.; Luchowska, K.; Kwiatkowski, C. Use of sewage sludge in bioenergy production—A case study on the effects on sorghum biomass production. Eur. J. Agron. 2015, 69, 63–74. [Google Scholar] [CrossRef]
  40. Loomis, R.S.; Williams, W.A. Maximum crop productivity: An estimate. Crop Sci. 1963, 3, 67–72. [Google Scholar] [CrossRef]
  41. Barbanti, L.; Grandi, S.; Vecchi, A.; Venturi, G. Sweet and fibre sorghum (Sorghum bicolor (L.) Moench), energy crops in the frame of environmental protection from excessive nitrogen loads. Eur. J. Agron. 2006, 25, 30–39. [Google Scholar] [CrossRef]
  42. Garofalo, P.; Vonella, A.V.; Ruggieri, S.; Rinaldi, M. Water and radiation use efficiencies of irrigated biomass sorghum in a Mediterranean environment. Ital. J. Agron. 2011, 6, 133–139. [Google Scholar] [CrossRef]
  43. Campi, P.; Navarro, A.; Palumbo, A.D.; Solimando, M.; Lonigro, A.; Mastrorilli, M. Productivity of energy sorghum irrigated with reclaimed wastewaters. Ital. J. Agron. 2014, 9, 115–119. [Google Scholar] [CrossRef]
  44. Habyarimana, E.; Bonardi, P.; Laureti, D.; Di Bari, V.; Cosentino, S.; Lorenzoni, C. Multilocational evaluation of biomass sorghum hybrids under two stand densities and variable water supply in Italy. Ind. Crop Prod. 2004, 20, 3–9. [Google Scholar] [CrossRef]
  45. Habyarimana, E.; Laureti, D.; Di Fonzo, N.; Lorenzoni, C. Biomass production and drought resistance at the seedling stage and in field conditions in sorghum. Maydica 2002, 47, 303–309. [Google Scholar]
  46. Cosentino, S.L.; Mantineo, M.; Testa, G. Water and nitrogen balance of sweet sorghum (Sorghum bicolor moench (L.)) cv. Keller under semi-arid conditions. Ind. Crop Prod. 2012, 36, 329–342. [Google Scholar] [CrossRef]
  47. Lewandowski, I.; Clifton-Brown, J.C.; Andersson, B.; Basch, G.; Christian, D.G.; Jørgensen, U.; Jonesb, M.B.; Richee, A.B.; Schwarzf, K.U.; Tayebid, K.; et al. Environment and harvest time affects the combustion qualities of genotypes. Agron. J. 2003, 95, 1274–1280. [Google Scholar] [CrossRef]
  48. Adler, P.R.; Sanderson, M.A.; Boateng, A.A.; Weimer, P.J.; Jung, H.J.G. Biomass yield and biofuel quality of switchgrass harvested in fall or spring. Agron. J. 2006, 98, 1518–1525. [Google Scholar] [CrossRef]
  49. Barbagallo, S.; Cirelli, G.L.; Marzo, A.; Milani, M.; Toscano, A. Hydraulics behaviour and removal efficiencies in two H-SSF constructed wetlands for wastewater reuse with different operational life. Water Sci. Technol. 2011, 64, 1032–1039. [Google Scholar] [CrossRef] [PubMed]
  50. Valipour, M. Increasing irrigation efficiency by management strategies: Cutback and surge irrigation. ARPN J. Agric. Biol. Sci. 2013, 8, 35–43. [Google Scholar]
  51. American Public Health Association (APHA). Standard Methods for the Examination of Water and Wastewater, 20th ed.; APHA: Washington, DC, USA, 1998. [Google Scholar]
  52. USDA Soil Survey Staff. Keys to Soil Taxonomy, 10th ed.U.S. Department of Agriculture, Soil Survey Staff, Natural Resources Conservation Service: Washington, DC, USA, 2006.
  53. Trouvelot, A.; Kough, J.; Gianinazzi-Pearson, V. Evaluation of VA infection levels in root systems. Research for estimation methods having a functional significance. In Physiological and Genetical Aspects of Mycorrhizae; INRA Press: Paris, France, 1986; pp. 217–221. [Google Scholar]
  54. Meli, S.; Porto, M.; Belligno, A.; Bufo, S.A.; Mazzatura, A.; Scopa, A. Influence of irrigation with lagooned urban wastewater on chemical and microbiological soil parameters in a citrus orchard under Mediterranean condition. Sci. Total Environ. 2002, 285, 69–77. [Google Scholar] [CrossRef]
  55. Wardle, D.A.; Parkinson, D. Interactions between microclimatic variables and the soil microbial biomass. Biol. Fertil. Soils 1990, 9, 273–280. [Google Scholar] [CrossRef]
  56. Van Gestel, M.; Merckx, R.; Vlassak, K. Microbial biomass and activity in soils with fluctuating water contents. Geoderma 1993, 56, 617–626. [Google Scholar] [CrossRef]
  57. Vymazal, J. The use constructed wetlands with horizontal sub-surface flow for various types of wastewater. Ecol. Eng. 2009, 35, 1–17. [Google Scholar] [CrossRef]
  58. Vymazal, J. Constructed wetlands for wastewater treatment. Water 2010, 2, 530–549. [Google Scholar] [CrossRef]
  59. Cirelli, G.L.; Consoli, S.; Di Grande, V.; Milani, M.; Toscano, A. Subsurface constructed wetlands for wastewater treatment and reuse in agriculture: Five years of experiences in Sicily, Italy. Water Sci. Technol. 2007, 56, 183–191. [Google Scholar] [CrossRef] [PubMed]
  60. Amaducci, S.; Monti, A.; Venturi, G. Non-structural carbohydrates and fibre components in sweet and fibre sorghum as affected by low and normal input techniques. Ind. Crop Prod. 2004, 20, 111–118. [Google Scholar] [CrossRef]
  61. Treseder, K.K.; Allen, M.F. Mycorrhizal fungi have a potential role in soil carbon storage under elevated CO2 and nitrogen deposition. New Phytol. 2000, 147, 189–200. [Google Scholar] [CrossRef]
  62. Berruti, A.; Borriello, R.; Orgiazzi, A.; Barbera, A.C.; Lumini, E.; Bianciotto, V. Arbuscular mycorrhizal fungi and their value for ecosystem management. In Biodiversity: The Dynamic Balance of the Planet; Grillo, O., Ed.; InTech: Rijeka, Croatia, 2014; pp. 159–191. [Google Scholar]
  63. Treseder, K.K.; Allen, M.F. Direct nitrogen and phosphorus limitation of arbuscular mycorrhizal fungi: A model and field test. New Phytol. 2002, 155, 507–515. [Google Scholar] [CrossRef]
  64. Garcia, M.O.; Ovasapyan, T.; Greas, M.; Treseder, K.K. Mycorrhizal dynamics under elevated CO2 and nitrogen fertilization in a warm temperate forest. Plant Soil 2008, 303, 301–310. [Google Scholar] [CrossRef]
  65. Johnston, A.E.; Trust, L.; Fellow, S. Efficient use of nutrients in agricultural production systems. Commun. Soil Sci. Plan. 2000, 31, 1599–1620. [Google Scholar] [CrossRef]
  66. Sainju, U.M.; Whitehead, W.F.; Singh, B.P. Carbon accumulation in cotton, sorghum, and underlying soil as influenced by tillage, cover crops, and nitrogen fertilization. Plant Soil 2005, 273, 219–234. [Google Scholar] [CrossRef]
  67. Almodares, A.; Taheri, R.; Chung, M.; Fathi, M. The effect of nitrogen and potassium fertilizers on growth parameters and carbohydrate contents of sweet sorghum cultivars. J. Environ. Biol. 2008, 29, 849–852. [Google Scholar] [PubMed]
  68. Dalla Marta, A.; Mancini, M.; Orlando, F.; Natali, F.; Capecchi, L.; Orlandini, S. Sweet sorghum for bioethanol production: Crop responses to different water stress levels. Biomass Bioenerg. 2014, 64, 211–219. [Google Scholar] [CrossRef]
Figure 1. Precipitation, daily average minimum, and maximum air temperature series: (a) from July 2008 to March 2009 and (b) from July 2009 to March 2010.
Agriculture 06 00067 g001
Figure 2. Interaction of fertilization and harvest date effect on biomass production per plant in the first studied year (a) and interaction of ETc restitutions and harvest date effect on biomass production per plant in the second studied year (b). Different letters indicate significant differences for Fisher LSD test (p < 0.05).
Agriculture 06 00067 g002
Figure 3. Biomass production per ha in the two studied years in relation to the water supplied (a) and the relationship between percentage biomass yield loss and ETc percentage restitution (b). Different letters in Figure 3a indicate significant differences for Fisher LSD test (p < 0.05).
Agriculture 06 00067 g003
Figure 4. Biomass production per ha in the two study years in relation to: (a) fertilization and (b) harvest time. Different letters indicate significant differences for Fisher LSD test (p < 0.05).
Agriculture 06 00067 g004
Figure 5. Interaction of ETc restitutions and fertilization effect on biomass production in the first studied year (a) and interaction of ETc restitutions and harvest date effect on biomass production in the second studied year (b). Different letters indicate significant differences for Fisher LSD test (p < 0.05).
Agriculture 06 00067 g005
Table 1. Main chemical properties of soil (0–30 cm depth) at the study site (mean ± standard deviation).
ParametersUnitsJuly 2008March 2009March 2010
pH 8.13 ± 0.038.27 ± 0.188.30 ± 0.11
ECdS·m−10.25 ± 0.040.25 ± 0.050.25 ± 0.06
Total CaCO3g·kg−153 ± 1155 ± 1756 ± 14
Active CaCO3g·kg−119 ± 220 ± 121 ± 1
OCg·kg−110 ± 19 ± 113 ± 1
TNg·kg−10.74 ± 0.170.93 ± 0.090.65 ± 0.12
C/N 13.7 ± 3.29.3 ± 1.220.1 ± 2.4
EC, electrical conductivity; CaCO3, calcium carbonate; OC, organic carbon; TN, total nitrogen; C/N, carbon:nitrogen ratio.
Table 2. Average constructed wetland (CW) effluents water characteristics during the monitoring period (mean ± standard deviation).
ParametersUnits20082009
pH 7.7 ± 0.37.7 ± 0.1
ECµS·cm−11478 ± 951397 ± 124
BOD5mg·L−110.8 ± 4.414.4 ± 4.0
CODmg·L−120.1 ± 6.827.3 ± 7.6
TSSmg·L−111.0 ± 4.649.8 ± 29.4
TNmg·L−14.6 ± 2.213.8 ± 4.2
TPmg·L−16.8 ± 2.36.7 ± 2.6
EC, electrical conductivity; BOD5, biological oxygen demand; COD, chemical oxygen demand; TSS, total suspended solid; TN, total nitrogen; TP, total phosphorus.
Table 3. Wastewater nitrogen and phosphorus supply (in brackets the percentage of the whole element requirement by the crop).
TreatmentsVegetative Season 2008/2009Vegetative Season 2009/2010
TNTPTNTP
(kg·ha−1)(kg·ha−1)(kg·ha−1)(kg·ha−1)
33% ETc20.7 (17.3%)30.6 (47.1%)20.7 (17.3%)10.1 (15.5%)
66% ETc27.6 (23.0%)40.8 (62.8%)41.4 (34.5%)20.1 (30.9%)
100% ETc32.2 (26.8%)47.6 (73.2%)62.1 (51.8%)30.2 (46.5%)
TN, total nitrogen; TP, total phosphorus; ETc, crop evapotranspiration.
Table 4. Mycorrhizal colonization and arbuscule abundance in sorghum roots.
ParametersTreatments
0 NAMF100 N
F %26.0 a32.5 b41.5 c
A %0 a14.0 b0 a
For each parameter, different letters indicate significant difference by Fisher LSD at p < 0.05. 0 N, non-nitrogen fertilization; AMF, arbuscular mycorrhizal fungi fertilization; 100 N, 100 kg·ha−1 mineral nitrogen fertilization; F %, percentage frequency of mycorrhizae in the root system; A %, percentage arbuscule abundance in the root system.
Table 5. Aboveground biomass and its percentage components per plant during study years.
2008–2009
Culm Dry Weight (g)Leaves Dry Weight (g)Panicle Dry Weight (g)Plant Dry Weight (g)
Fertilization
0 N73.1 (76.2%)b16.6 (17.3%)b6.2 (6.5%)b95.9b
AMF71.7 (74.5%)b18.4 (19.1%)a6.2 (6.4%)b96.3b
100 N90.4 (76.8%)a19.7 (16.7%)a7.7 (6.5%)a117.8a
Irrigation
0% ETc49.4 (73.6%)d13.0 (19.4%)d4.7 (7.0%)c67.1d
33% ETc65.9 (75.3%)c16.5 (18.9%)c5.1 (5.8%)c87.5c
66% ETc91.8 (76.9%)b20.1 (16.8%)b7.5 (6.3%)b119.4b
100% ETc106.6 (76.6%)a23.2 (16.6%)a9.4 (6.8%)a139.2a
Harvesting
I harvest84.7 (68.2%)a29.2 (23.5%)a10.3 (8.3%)a124.3a
II harvest83.6 (82.4%)a13.2 (13.0%)b4.7 (4.6%)b101.4b
III harvest66.9 (79.5%)b12.3 (14.6%)b5.0 (6.0%)b84.2c
2009–2010
Culm Dry Weight (g)Leaves Dry Weight (g)Panicle Dry Weight (g)Plant Dry Weight (g)
Fertilization
0 N139.9 (74.3%)b25.3 (13.4%)a23.0 (12.2%)b188.2b
AMF146.8 (73.9%)b25.5 (12.8%)a26.4 (13.3%)ab198.7ab
100 N166.7 (75.8%)a25.0 (11.4%)a28.2 (12.8%)a219.9a
Irrigation
0% ETc79.9 (67.6%)d19.1 (16.1%)c19.2 (16.3%)b118.2d
33% ETc124.3 (73.8%)c24.0 (14.3%)b20.0 (11.9%)b168.4c
66% ETc167.8 (74.5%)b27.4 (12.2%)ab29.9 (13.3%)a225.1b
100% ETc232.4 (78.2%)a30.7 (10.3%)a34.3 (11.5%)a297.4a
Harvesting
I harvest221.0 (68.8%)a50.7 (15.8%)a49.6 (15.4%)a321.3a
II harvest145.0 (78.3%)b20.8 (11.2%)b19.4 (10.5%)b185.3b
III harvest87.3 (87.2%)c4.3 (4.3%)c8.5 (8.5%)c100.2c
Different letters indicate significant differences for Fisher LSD test (p < 0.05).
Table 6. Average shoots·m−2 in the two studied years in relation to the water supplied and fertilization treatments.
TreatmentsNumber of shoots·m−2
Growing Season 2008/2009Growing Season 2009/2010
0 NAMF100 NAverage0 NAMF100 NAverage
0% ETc10.0 g10.5 g11.5 f10.7 d5.05.55.55.3 d
33% ETc13.5 e14.5 de15.5 d14.5 c6.57.57.57.2 c
66% ETc15.0 d15.2 d18.0 b16.1 b7.58.09.08.2 b
100% ETc16.5 c15.0 d24.5 a18.7 a9.010.010.59.8 a
Average13.7 b13.8 b17.4 a15.17.0 a7.8 b8.1 b7.6
Different letters indicate significant differences for Fisher LSD test (p < 0.05).

