Monitoring and Precision Spraying for Orchid Plantation with Wireless WebCAMs


1
Department of Agricultural Engineering, Rajamangala University of Technology Thanyaburi, Pathumthani 12110, Thailand
2
Department of Food, Agriculture and Bioresources, Asian Institute of Technology (AIT), Pathumthani 12120, Thailand
*
Author to whom correspondence should be addressed.
Agriculture 2017, 7(10), 87; https://doi.org/10.3390/agriculture7100087
Submission received: 7 September 2017
/
Revised: 27 September 2017
/
Accepted: 3 October 2017
/
Published: 11 October 2017
(This article belongs to the Special Issue Smart machines, Remote Sensing, Precision Farming, Processes, Mechatronic, Materials and Policies for Safety and Health Aspects)
Abstract
:Through processing images taken from wireless WebCAMs on the low altitude remote sensing (LARS) platform, this research monitored crop growth, pest, and disease information in a dendrobium orchid’s plantation. Vegetetative indices were derived for distinguishing different stages of crop growth, and the infestation density of pests and diseases. Image data was processed through an algorithm created in MATLAB® (The MathWorks, Inc., Natick, MA, USA). Corresponding to the orchid’s growth stage and its infestation density, varying levels of fertilizer and chemical injections were administered. The acquired LARS images from wireless WebCAMs were positioned using geo-referencing, and eventually processed to estimate vegetative-indices (Red = 650 nm and NIR = 800 nm band center). Good correlations and a clear cluster range were obtained in characteristic plots of the normalized difference vegetation index (NDVI) and the green normalized difference vegetation index (GNDVI) against chlorophyll content. The coefficient of determination, the chlorophyll content values (μmol m−2) showed significant differences among clusters for healthy orchids (R2 = 0.985–0.992), and for infested orchids (R2 = 0.984–0.998). The WebCAM application, while being inexpensive, provided acceptable inputs for image processing. The LARS platform gave its best performance at an altitude of 1.2 m above canopy. The image processing software based on LARS images provided satisfactory results as compared with manual measurements.
1. Introduction
Dendrobium orchids are widely cultivated for both domestic and export markets. In 2015, Thailand exported around 51,811 tons of orchids to the USA, Japan and Italy [1], an increase of 5.05% from the previous year. Orchid exports are likely to grow steadily as demand continues to rise in the world market. To answer the simultaneously rising questions about orchid quality and the competitiveness of this growing market, the farmers are required to have technical expertise as well as skills in efficiently managing expensive inputs. Most growers plant orchids in containers with size 24 × 32 cm. Each container plants four orchids or the equivalent of about 75,000–94,000 plants/ha. Fertilization of orchids is done by spraying at the top of the leaves and at the roots, throughout the plant, except for the flowers. Orchids are fertilized differently at different stages of growth. At the nursery stage, fertilizer 21-21-21 should be interspersed with fertilizer 30-10-10 at the rate of 1.56–2.50 kg/200 L of water/ha every week. At the plantation stage, fertilizer 21-21-21 is interspersed with fertilizer 30-20-10 at the rate of 2.50–3.75 kg/200 L of water/ha every week. At the flowering stage, fertilizer 21-21-21 or 16-21-27 is interspersed with fertilizer 15-30-15 at the rate of 3.75–5 kg/200 L of water/ha every week. At the flower cutting stage, fertilizer 15-30-15 is interspersed with fertilizer 16-21-27 at the rate of 3.12–4.37 kg/200 L of water/ha every week [2].
The production of dendrobium orchids in greenhouses also risks disease and insect pest infestation. Most greenhouses are found to be infested with leaf spot disease or ringworm disease (Leaf Spot) caused by Phyllostictina Pyriformis Cash and Watson, black spot disease caused by Alternaria alternate and Drechslera spp., anthracnose disease caused by Colletotrichum gloeosporioides (Penz.) Sacc., dry rot or wilt disease caused by Fusarium oxysporum Fmoniliforme, soft rot disease caused by Erwinia carotovora (Jones), yellow leaf spots disease caused by Pseudocercospora dendrobii and dry rot disease caused by Sclerotium rolfsii. After correctly identifying the infestation, the correct amount of the chemical must be precisely sprayed at the designated areas to determine the application’s efficiency as well as its production cost. Incorrect application of chemicals would not only result in economic losses, but also cause environmental damage [3,4].
An image processing technique for evaluating and recognizing crops and weeds was employed by the previous study [1,2,5]. They tended to segment crops and weeds from soil (background) in the first step. Segmentation was done by using visible color information or reflection intensity in near-infrared. Information on the variable light conditions should be taken into account to achieve good classification. In the second step, an attempt was made to classify plants as crops or weeds based on their shape, texture and color properties.
In this research, we combine variable rate spraying with the image processing technique using a wireless web camera (WebCAM) to assist in the management of dendrobium orchid plantation facilities. The process directly involves reducing production costs and increasing crop yield per plantation. The objective of this research was to design and fabricate a variable rate spraying application using the image processing techniques of wireless WebCAMs for monitoring crop growth, and infestation by pest and disease in dendrobium orchid plantations.
2. Materials and Methods
2.1. Experimental Set Up and Field Preparation
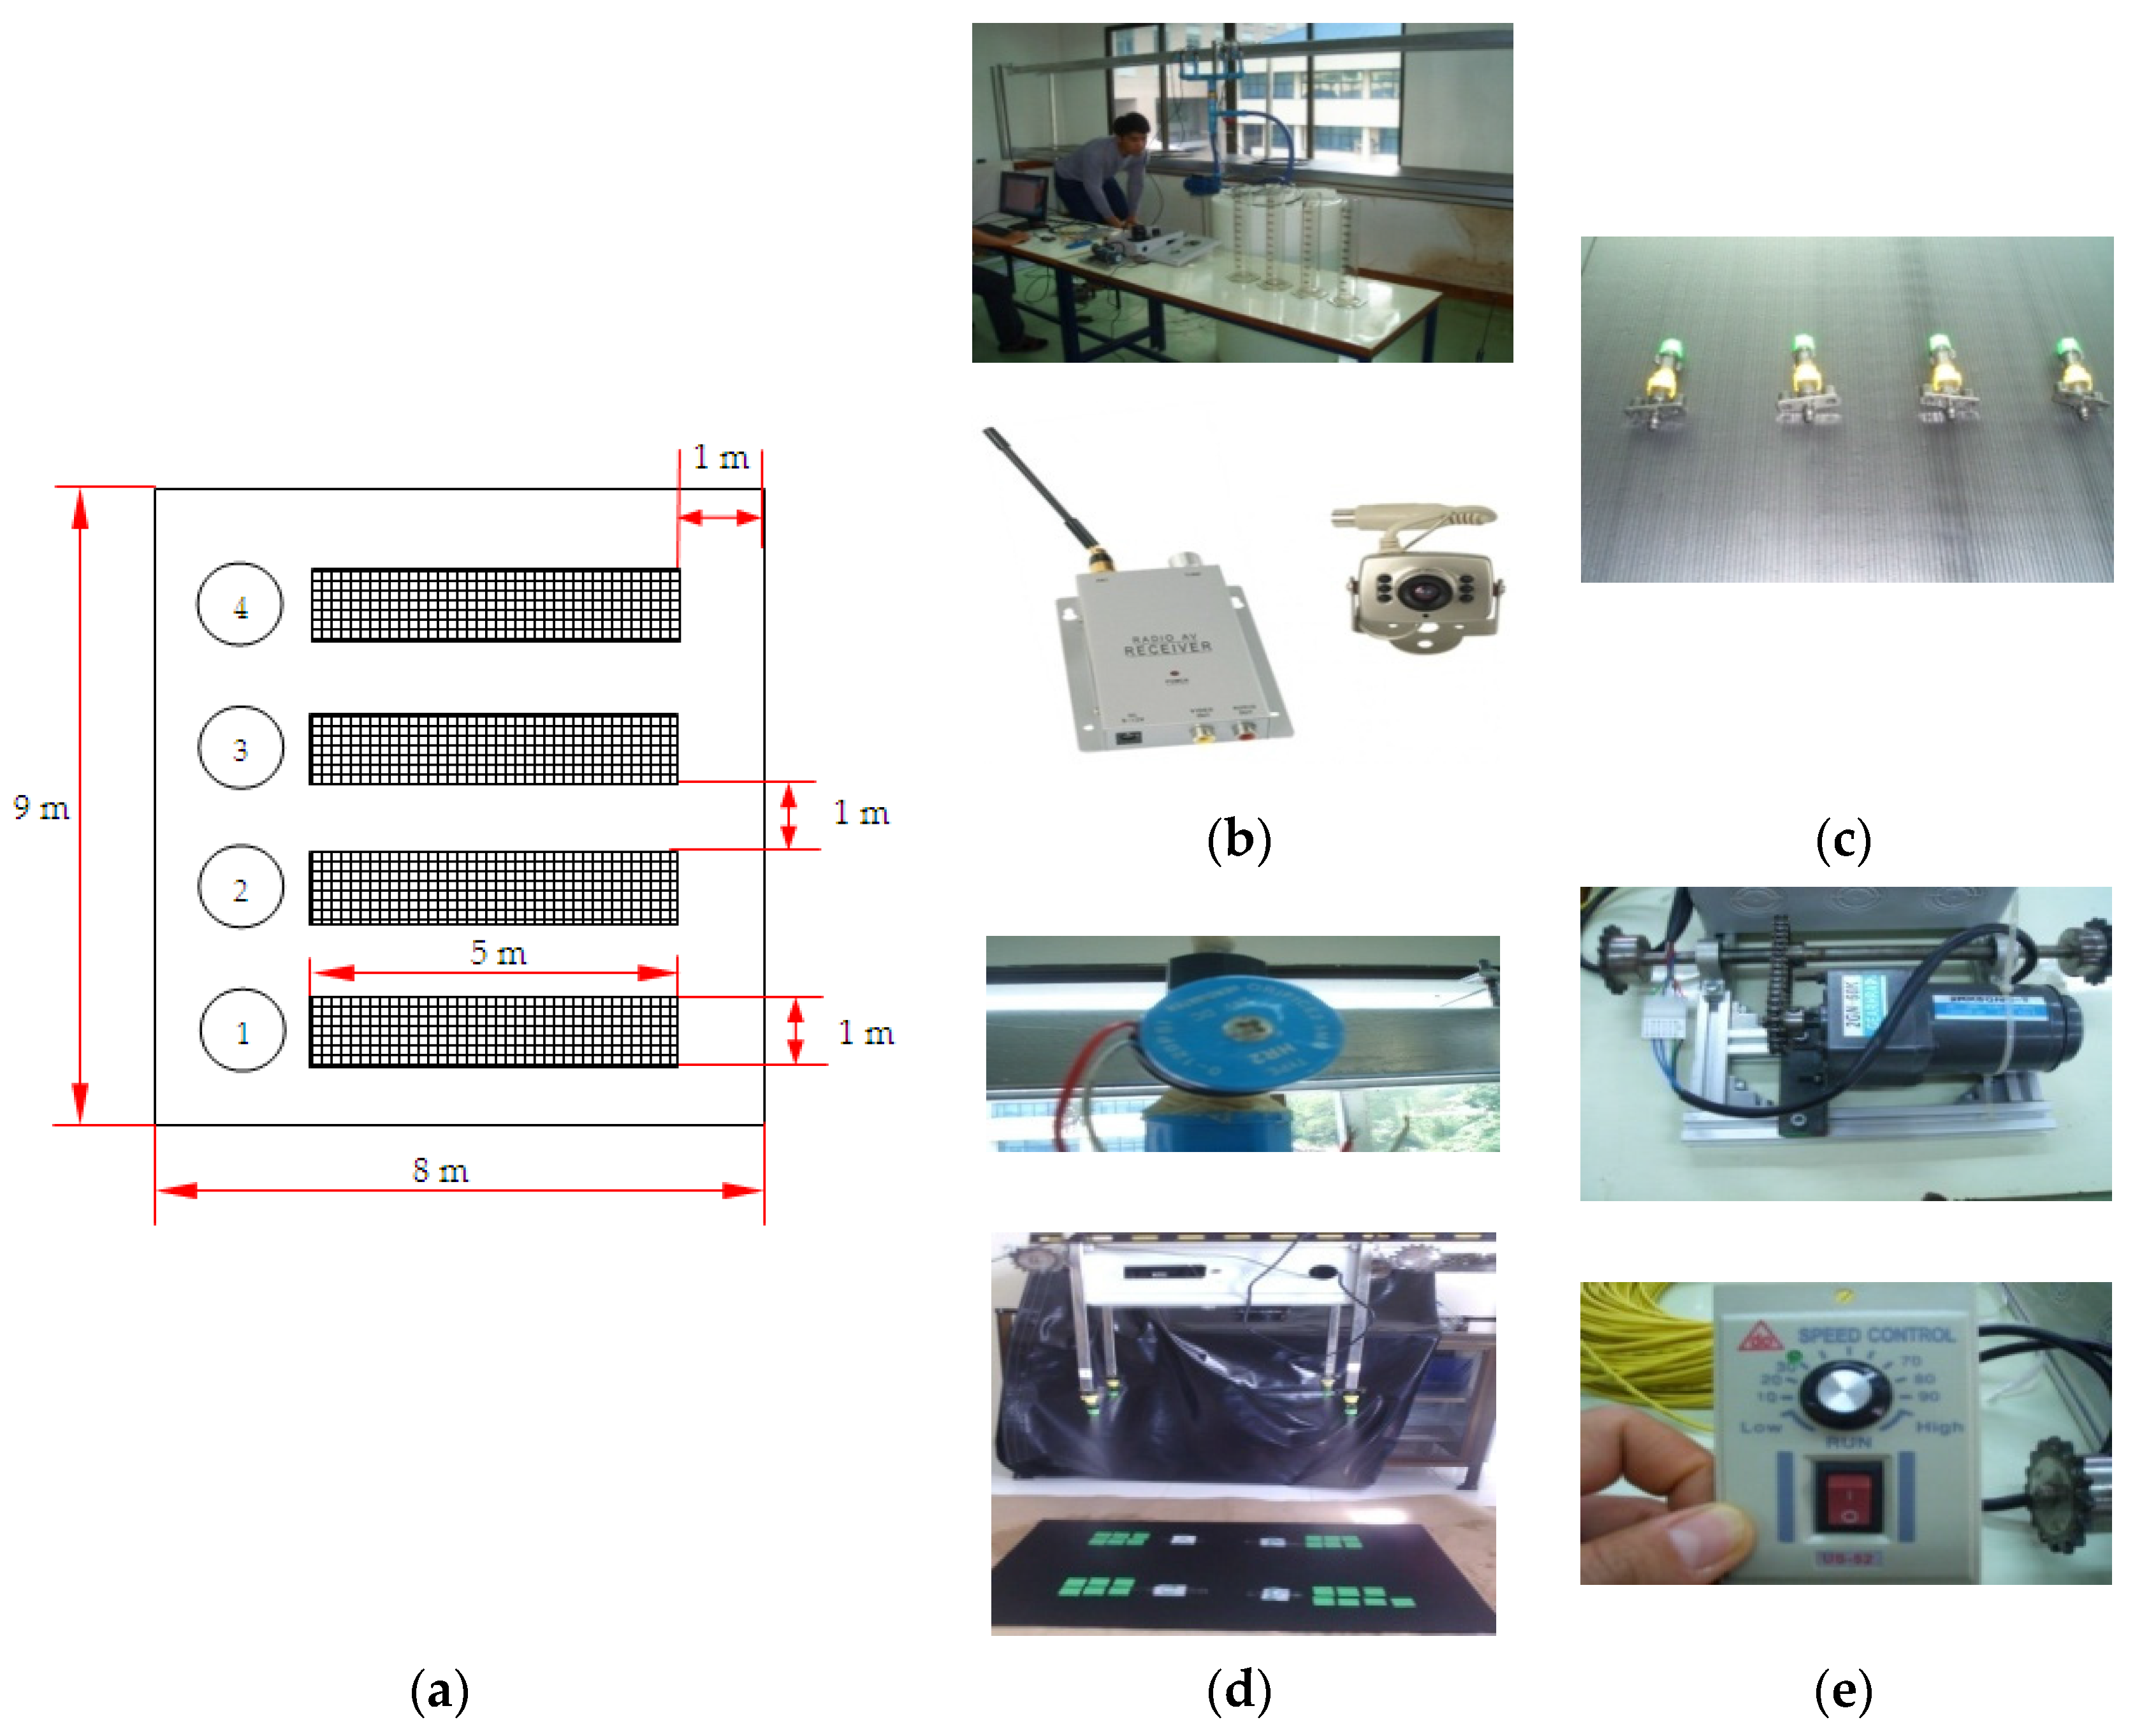
Experiments were conducted in a 72 m2 plastic greenhouse (14.14° N, 101.48° E). There were 12 orchids m−2 inside the greenhouse (Figure 1). Spraying was controlled through a microcontroller by varying pumping pressure and its corresponding volume flow rate (Figure 2). Actual volumes applied were recorded.
2.2. Crop Growth, Pests and Diseases Infestation Monitoring and Spraying Systems
The variable rate fertilizer and chemical injection system precisely moved along the overhead rails above the orchid plantation in greenhouses that were controlled by four wireless WebCAMs, because the best resolution of each wireless WebCAMs was 1 m × 1 m with 1.2 m above the table. The rail bar system height was selected based on an appropriate coverage of the region of interest (ROI) on the table with plants. It was 2 m above the table (1 m × 5 m). The top view of the table inside the greenhouse is shown in Figure 3a. Image data was collected under cloud-free conditions between 10:30 and 12:30 h standard local time. Wireless WebCAMs (Vimicro USB2.0 UVC PC Camera, SWIFT-TECH ELECTRONICS Co. Ltd., Beijing, China) were coupled with a motor (Oriental AC Magnetic Motor 2RK6GN-AMw/2GN60K Gear Head, ORIENTAL MOTOR CO., LTD., Tokyo, Japan ). A prototype of a precision sprayer was separately developed and calibrated for precise fertilizer and chemical injection. Its optimized parameters were the nozzle size and length of the boom arm, the pressure of a suitable pump kit, and an appropriate connection to the control unit for an exact injection quantity per cycle covering the ROI. Later, an algorithm to control volume per working cycle was created. This algorithm was designed on the basis of the plant-to-disease density ratio in terms of pixel areas (pixel by pixel). Finally, field tests were conducted with this automatic pesticide or chemical spraying system, and the prototype was improved until its performance was found to be satisfactory. The key variables that affect the operation of the spraying system were considered to be the relationship between the value of the disease density ratio of plants per area to injection quantity; and the relationship between the spraying frequency with the concentration of dose injected. The spraying system consisted of a series of solenoid valves (Green Water Atlantis Technology (Thailand) Co., Ltd., Nonthaburi, Thailand), an injector (Super products limited series), electric pumps (LEE SAE IMPORT (1975) LIMITED series), a microcontrollers board (Shenzhen Shanhai Technology Ltd., Shenzhen, China), and eight relay modules (Arduitronics CO., Ltd., Bangkok, Thailand) (Figure 3).
The variable rate precision sprayer’s movement on rails above the plantation table in the greenhouse was controlled with wireless WebCAMs. This system was initiated based on digital image data of an orchid taken at nadir by four wireless WebCAMs installed 1 m apart. The acquired images were loaded into specially created image processing software that runs on MATLAB. The image processing software provides the pixel density expressed as the proportional growth rate of the orchids as output. This measured density was then transformed into the spraying duration of fertilizer and chemical at the upper surface of the orchid leaves. These sequences of activities were automatically controlled by the microcontroller (Arduino Uno R3; Shenzhen Shanhai Technology Ltd., Shenzhen, China) (Figure 4).
2.3. Low Altitude Image Data Acquisition and Processing
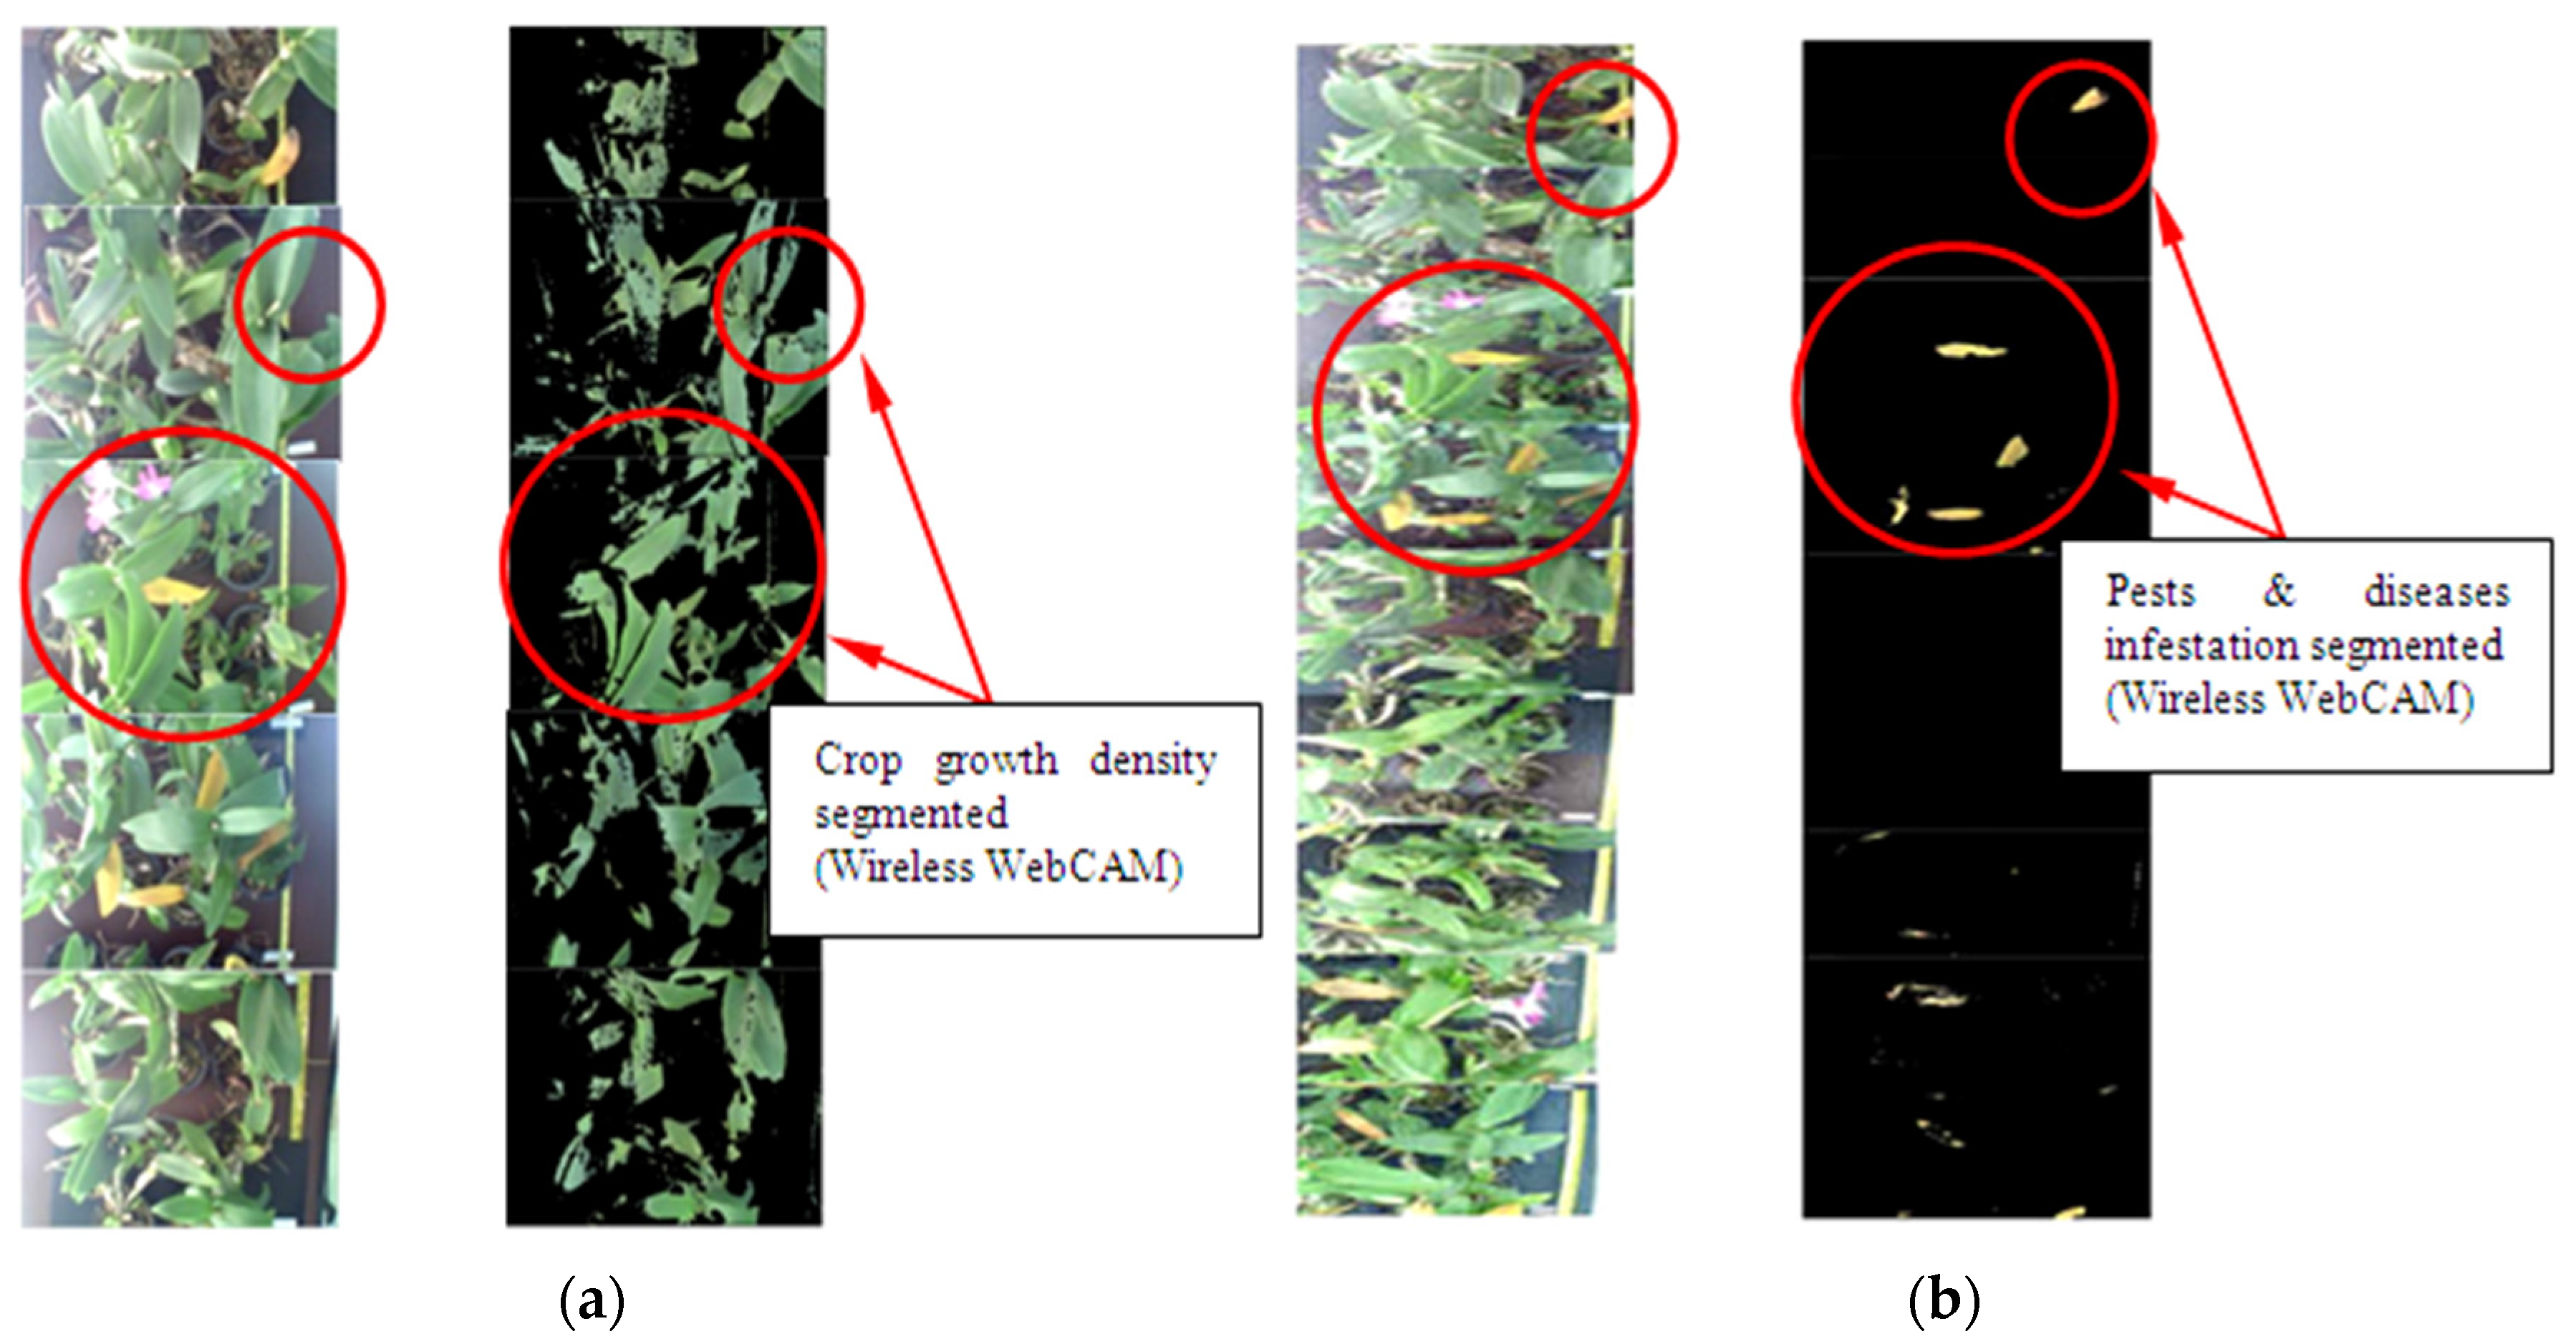
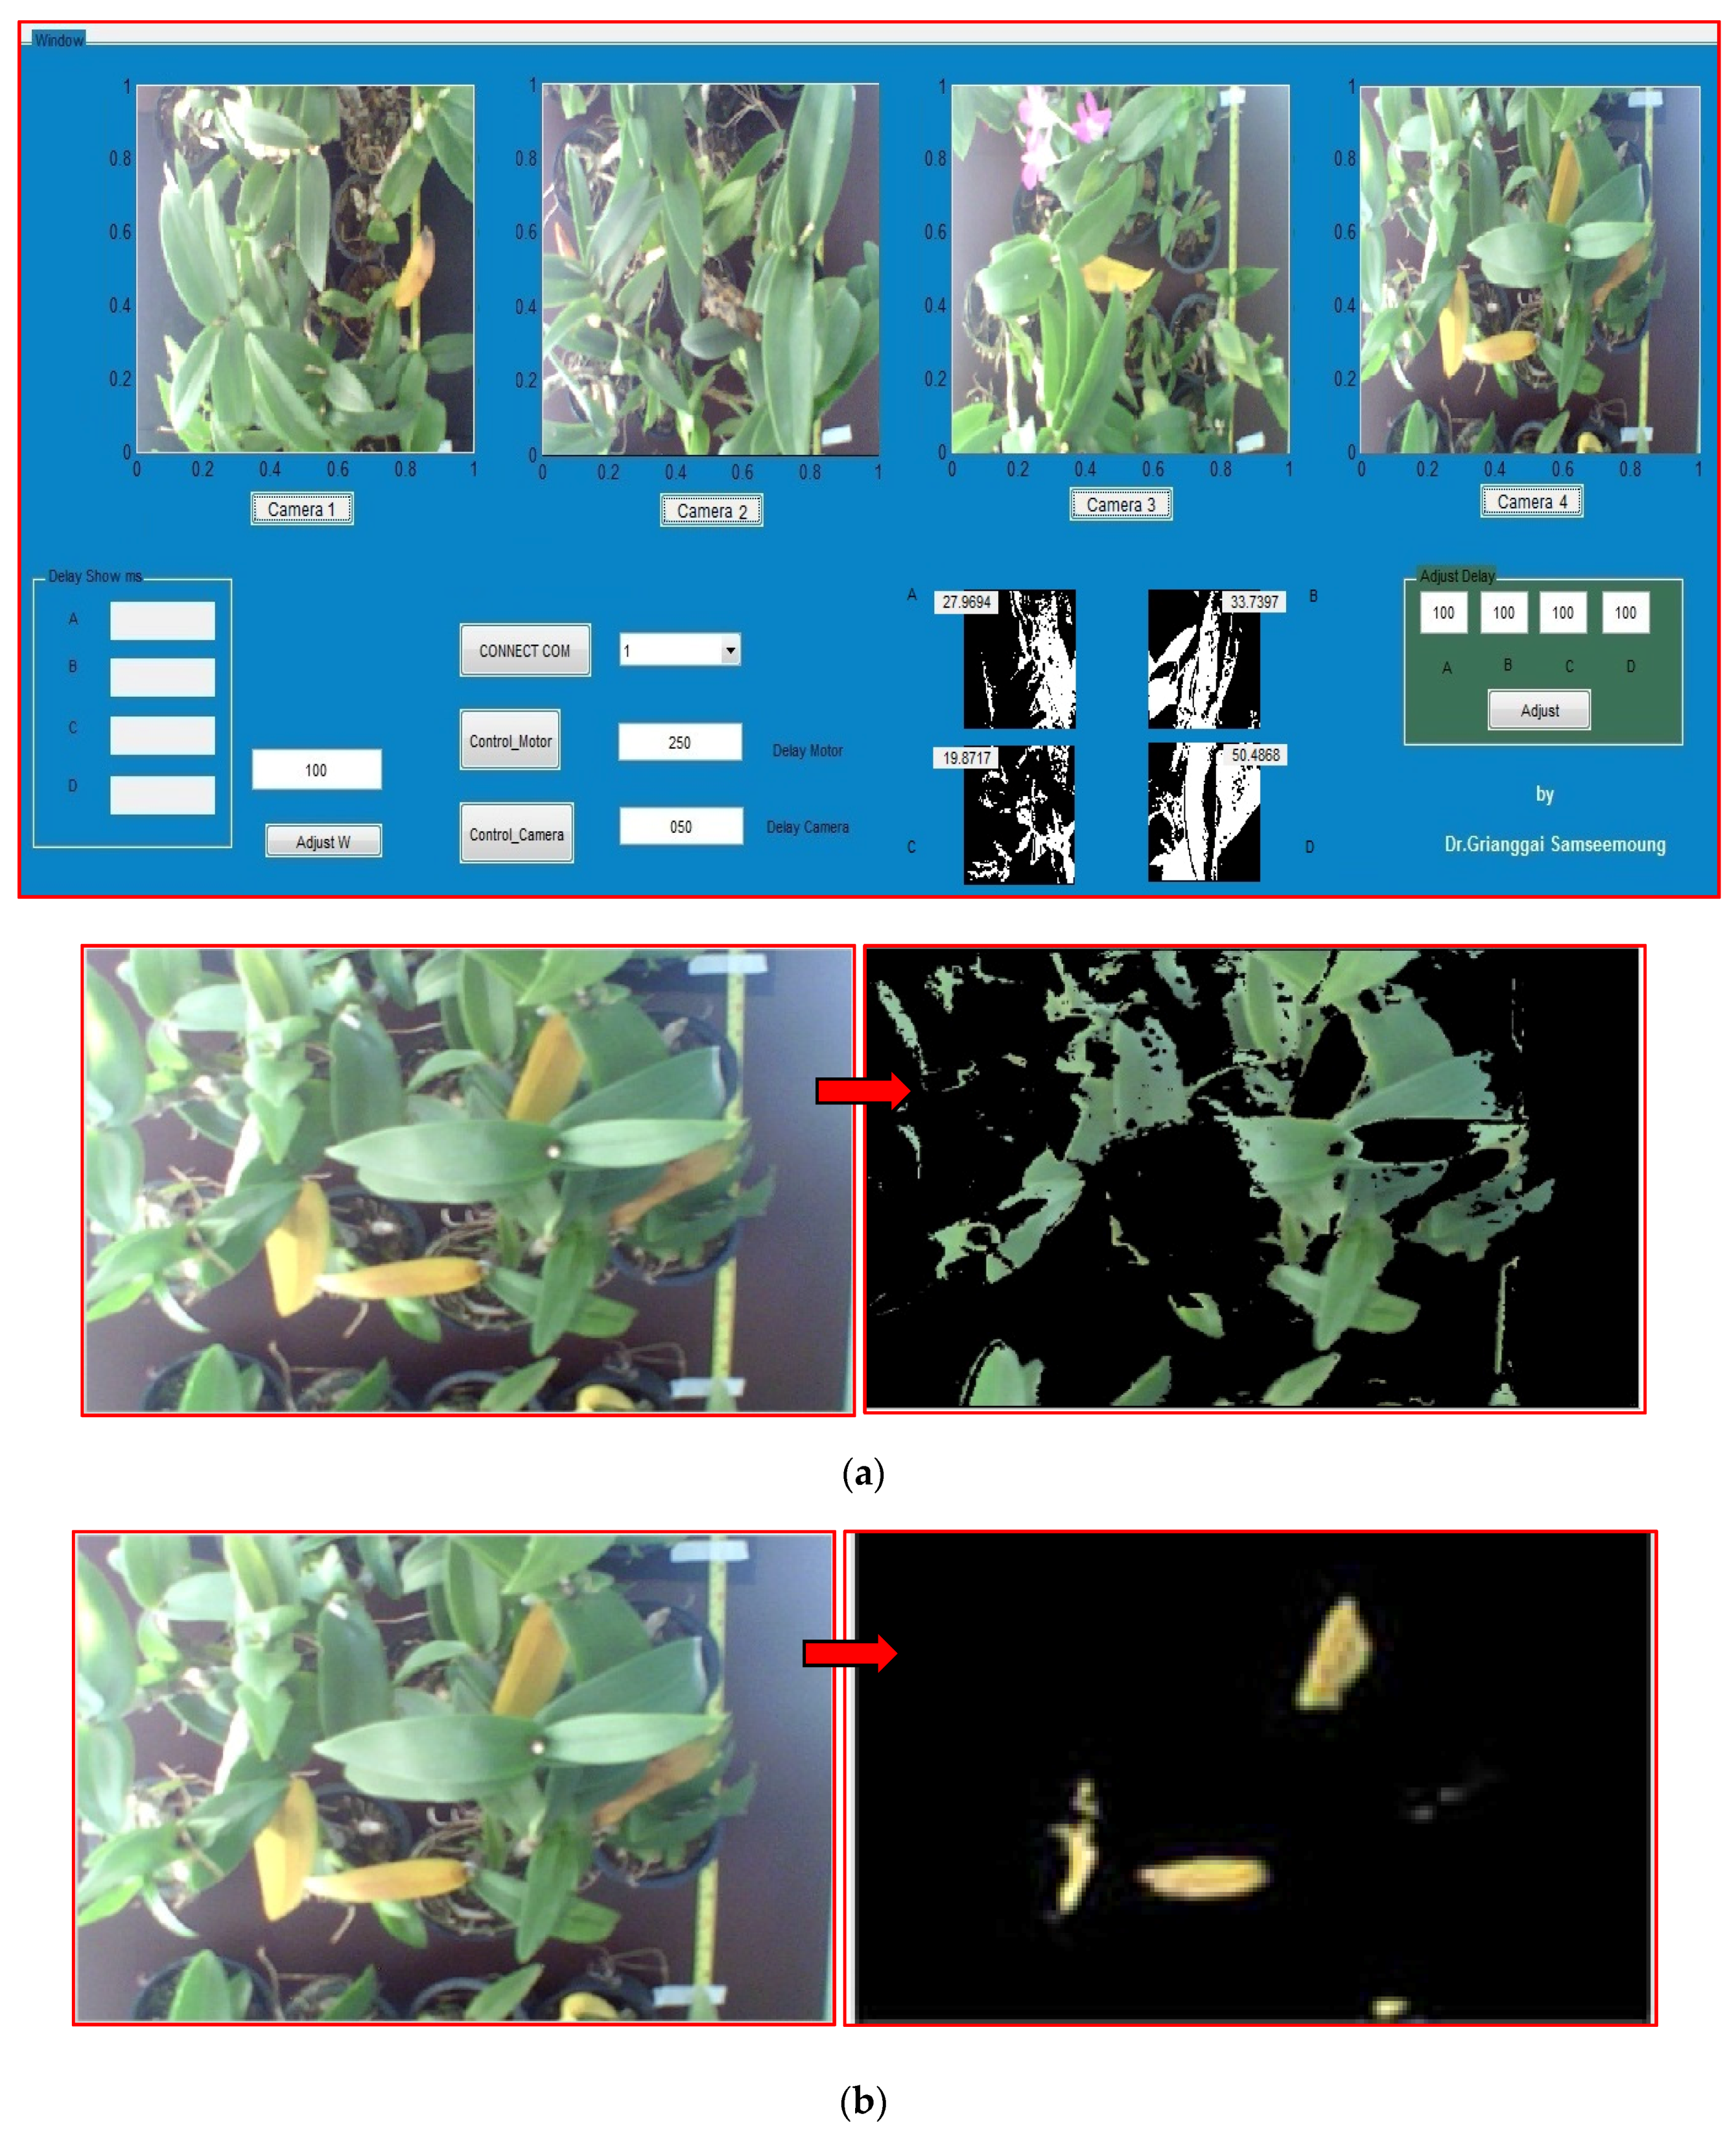
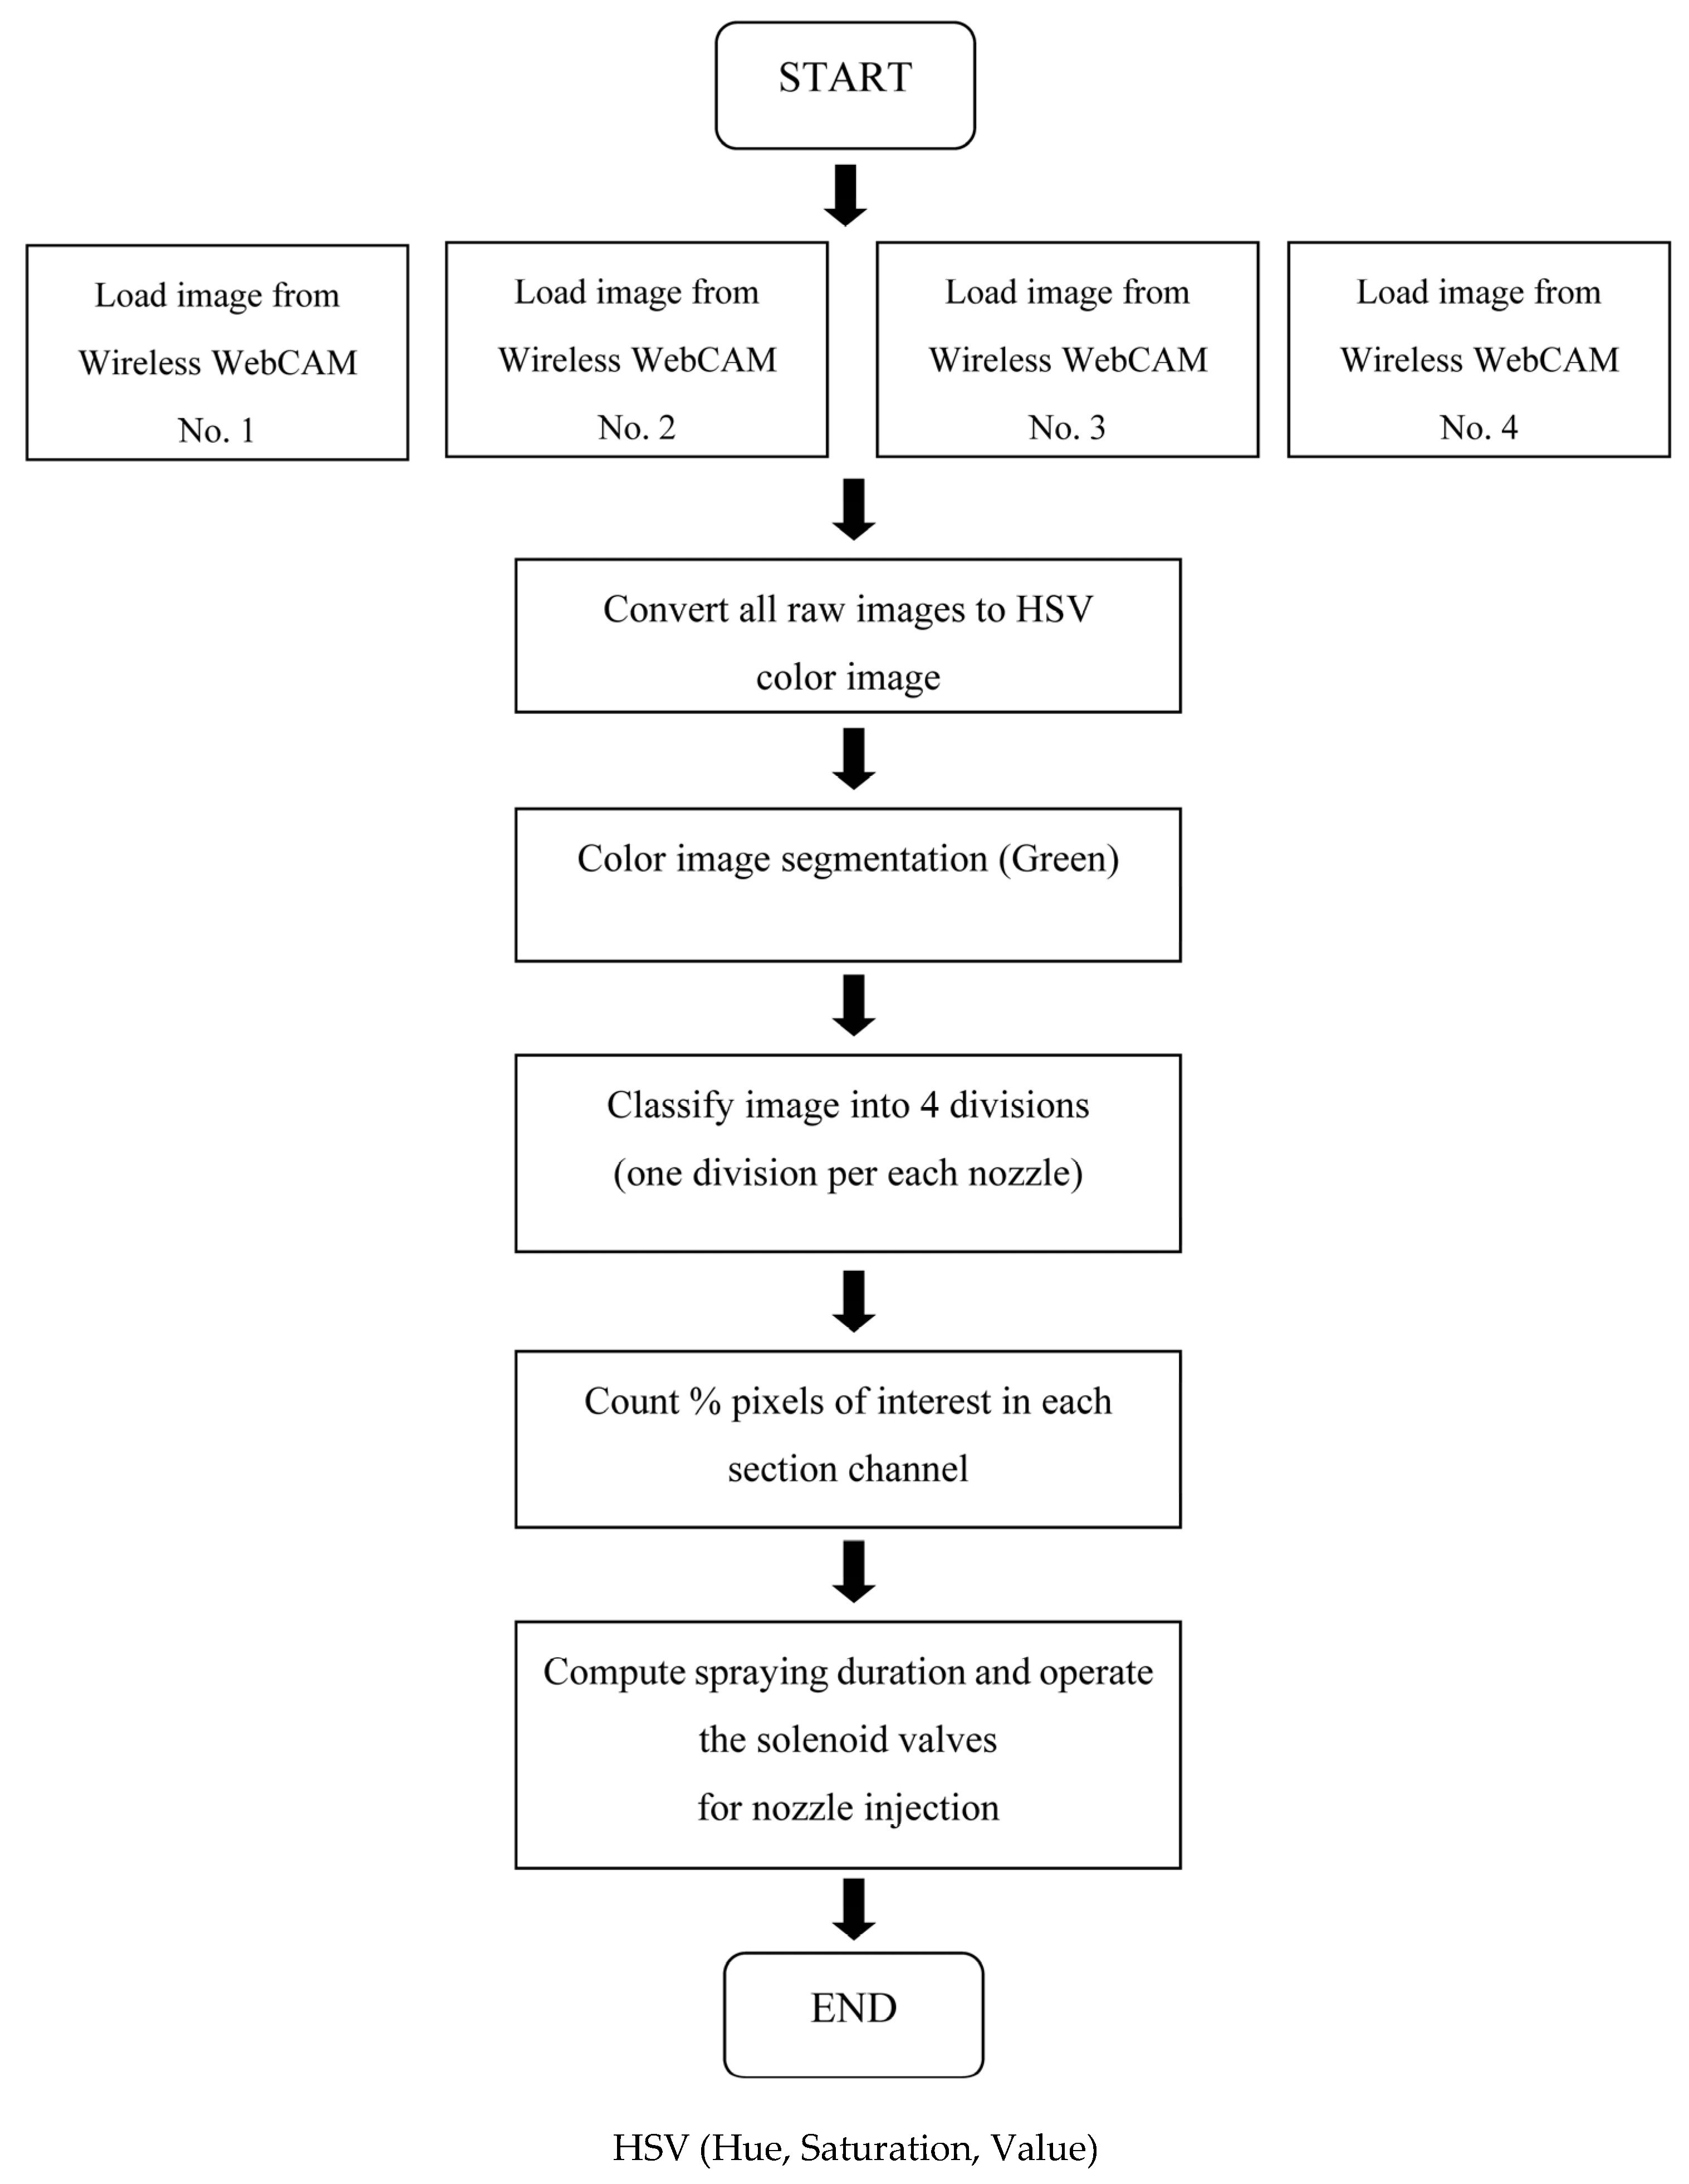
The developed algorithm, which separated the object from its background, was capable of system-specific command batch image processing as shown in Figure 5. An instruction set was developed to download image data from the four wireless WebCAMs that were installed 1 m apart on overhead rails above orchid plantation. A procedure was developed to determine the crop growth stage, divided into four divisions. The surface area of the green leaves was computed by the software. The pixel density of green leaves per unit of surface area was also displayed in real-time to the users. Color thresholding was done to control the time interval and the duration of the spraying, as well as the spraying target corresponding to the proportion of green pixels per area. Instructions were then sent to the solenoid valves to open/close the nozzles. The last image corresponding to the action taken was then saved to hard disk memory (gray and bimodal images) as shown in Figure 6.
2.4. Image Data Calibration
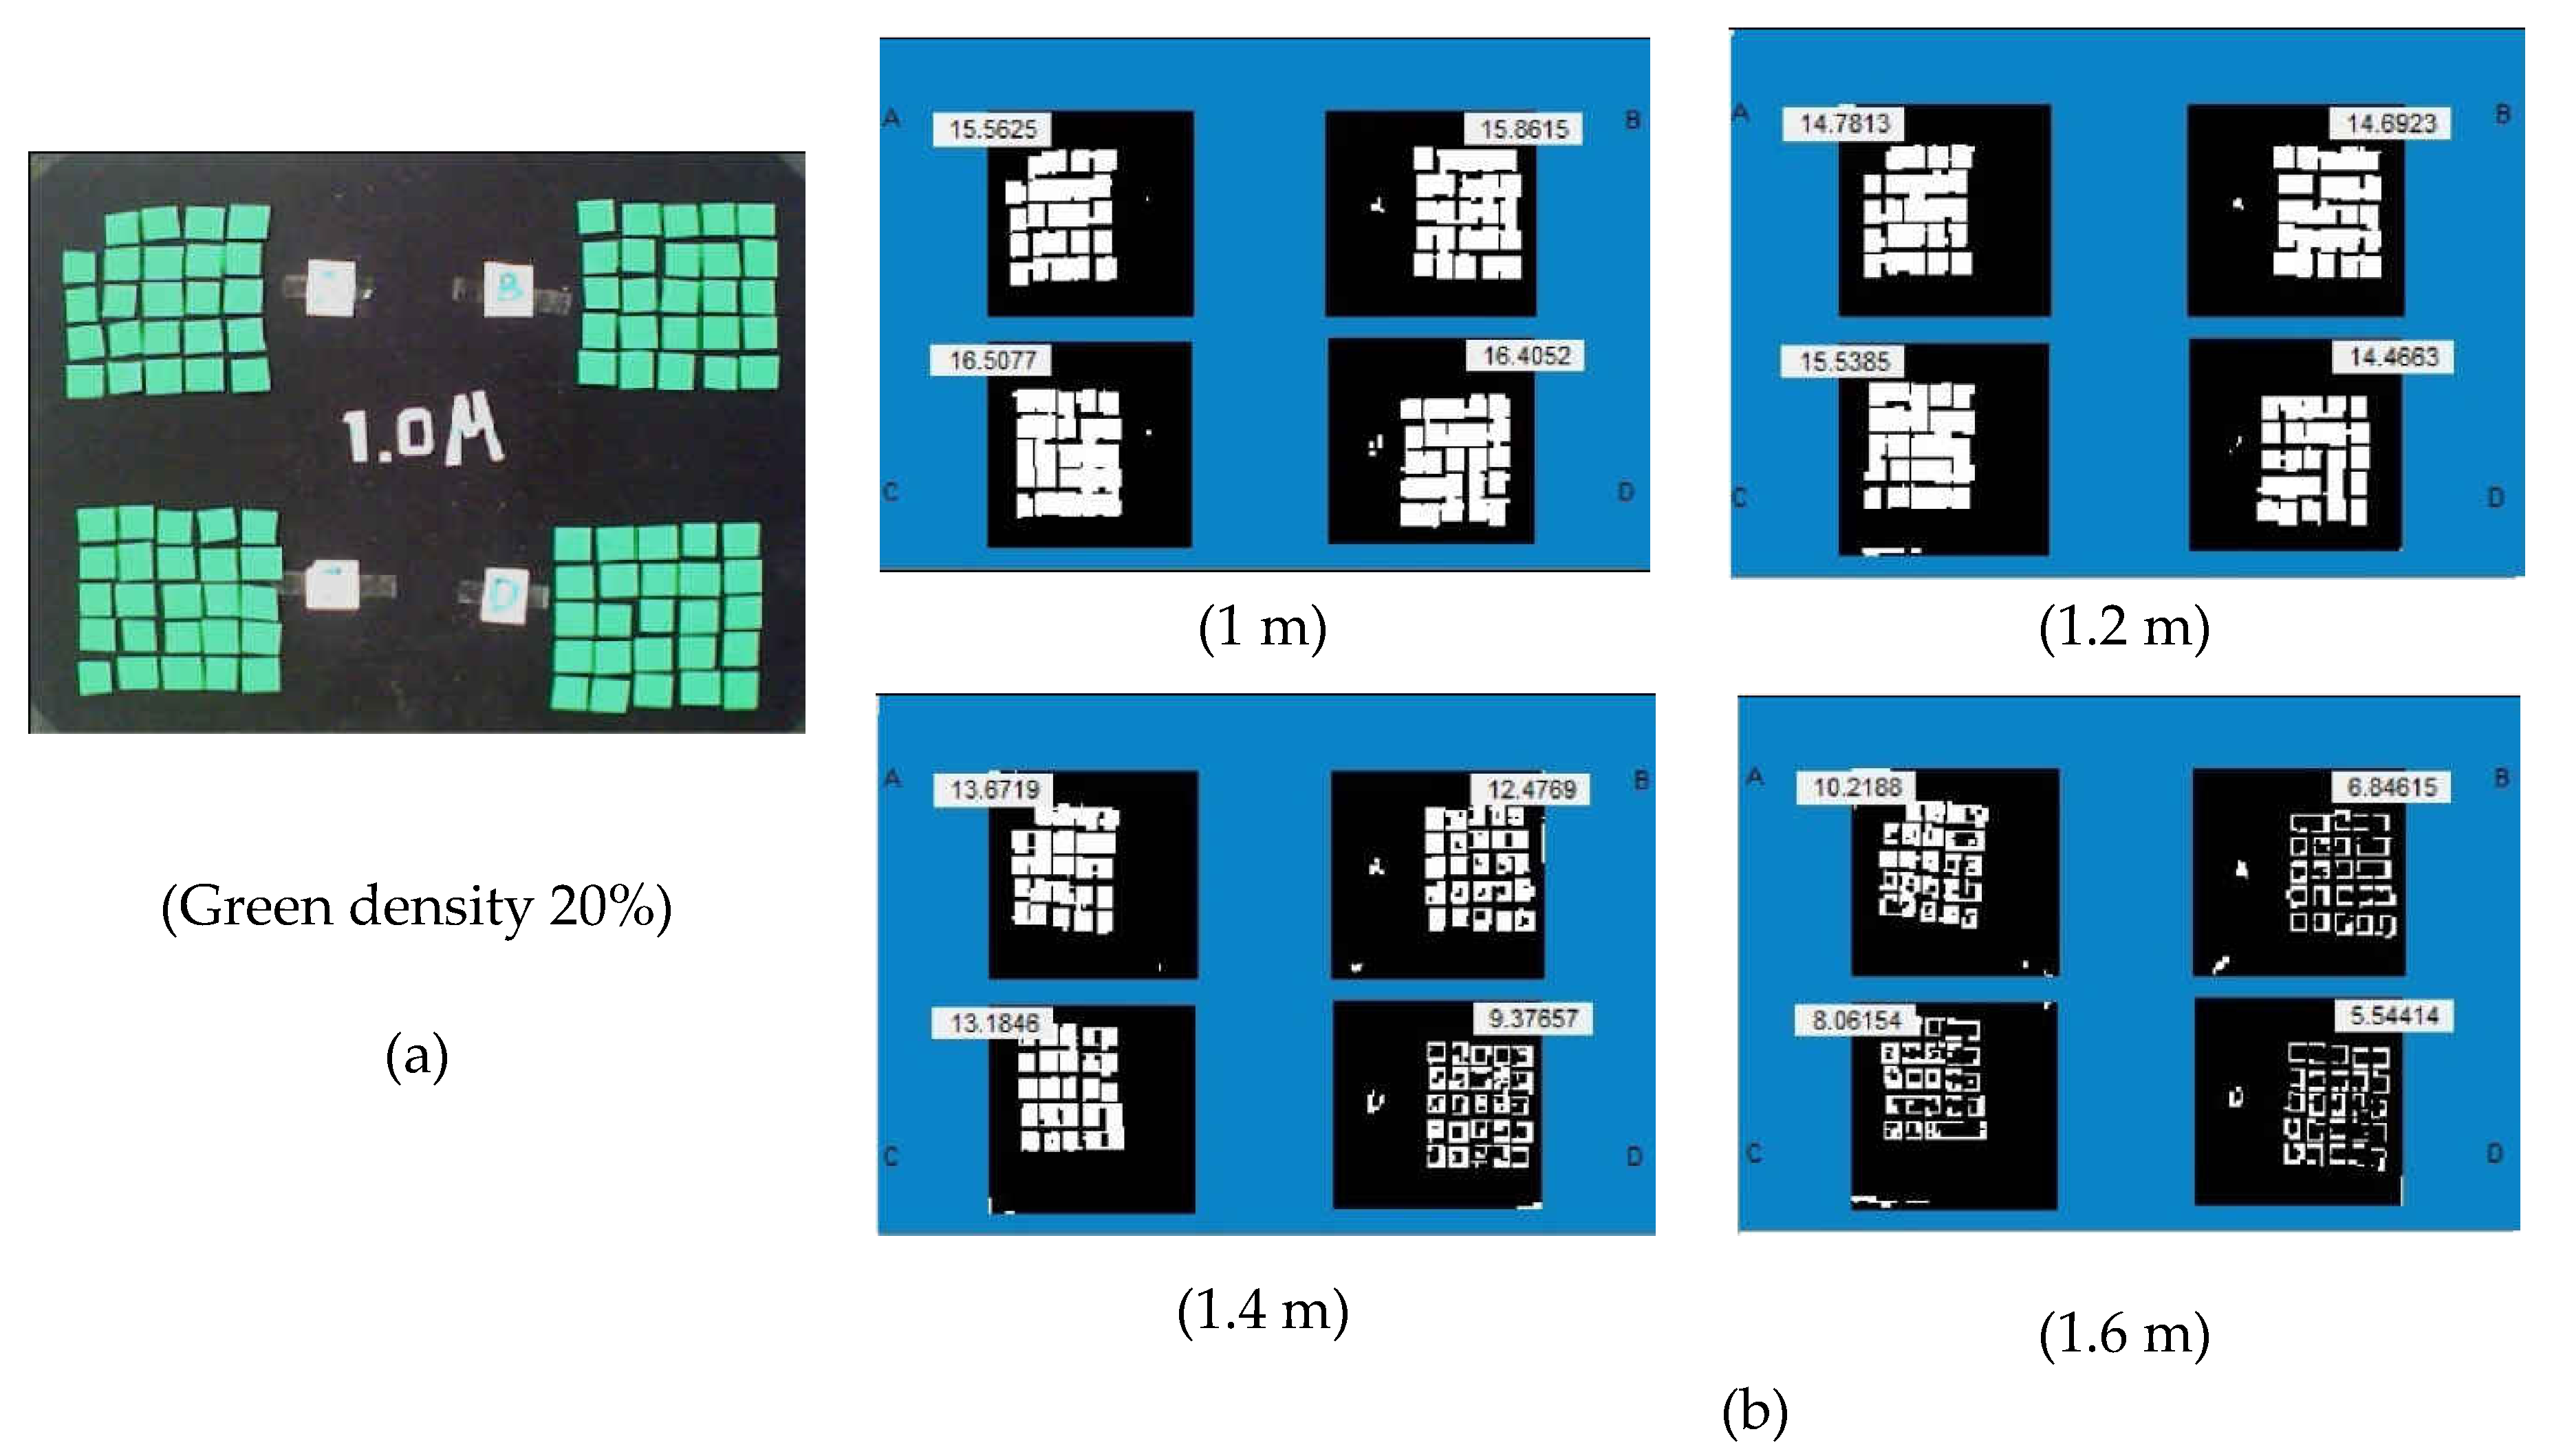
For calibration, the accuracy of a particular set of commands to process the images was assessed using a standard reference frame of 65 cm × 50 cm. Different sheets were kept in the reference frame to represent the growth stage of plants, comprising a group of yellow and green cards of 2.54 cm × 2.54 cm dimensions. Trials were made with sheets of four sample color groups: 5% (24 pieces), 10% (48 pieces), 15% (72 pieces) and 20% (97 pieces) kept at different heights: 1 m, 1.2 m, 1.4 m and 1.6 m. This calibration also included variations in illumination levels with time of the day.
2.5. Statistical Analysis
All measurements were performed in triplicate. The experiment’s data was analyzed by using SPSS 10.0 software (SPSS Inc., Singapore). The experiments were accomplished using a randomized complete block design (RCBD). Analysis of variance (ANOVA) was used to determine significance between treatments, and Duncan’s Multiple Range test (DMRT) was used to compare means at a 95% confidence level.
2.6. Ground Truthing Measurements
Ground truthing measurements were done to understand the relationship between the stages of crop growth, infestation density of pest and disease, illumination levels and the chlorophyll content.
The SKR 1800 illumination sensor (Skye Instruments, Ltd., Powys, UK), measuring prevailing sunlight intensity, was attached to a data logger (SpectroSense-2; Skye Instruments, Powys, UK). During the experiment for calibration and ground trothing, a leaf chlorophyll meter (Minolta SPAD 502; Konica Minolta Sensing Inc., Osaka, Japan) (Table 1) was used to measure the average chlorophyll content (expressed as SPAD values) of an aged leaf, a young leaf, a young leaf infested with pests or diseases, and an aged leaf infested with pests or diseases. The units for the Minolta SPAD-502 meter can be used to express leaf chlorophyll by the following equation [4]:
where M is the leaf chlorophyll meter reading (digital number) and Chl is the chlorophyll content in μmol m−2.
The green normalized differential vegetation index (GNDVI) values were estimated in this research to establish its association with different growth stages of dendrobium orchid plants. The GNDVI, based on the greenness level, representing the chlorophyll content as determined by the radiance at the leaf surface, is a significant indicator for distinguishing among young and aged, or healthy and infected orchids. The GNDVI is estimated [5] as follows:
where ρNIR is the reflectance value for the near infrared band and ρG is the reflectance value for the green band.
Tests were also conducted to observe the effect of the heights of the wireless WebCAMs on the proportion of pixel density that can be effectively detected. Furthermore, tests were conducted to determine the relationship between the height with the distribution of liquid fertilizer and chemical spraying.
For every altitude tested, the spraying quantities were varied at 20 cc, 60 cc and 100 cc. The variable rate sprayer was tested on the top of the orchid leaves surface with four levels of nozzle heights, i.e., 25 cm, 35 cm, 45 cm and 55 cm. The distribution of fertilizer and chemical spraying was observed for different combinations.
3. Results
3.1. Calibration of Variable Rate Spraying System
The image data acquisition and processing system using wireless WebCAMs was calibrated against the known values of color densities with green, yellow and brown colors, at different altitudes (1 m, 1.2 m, 1.4 m, 1.6 m). The color density of the sample sheets was varied at 5% (24 pieces), 10% (48 pieces), 15% (72 pieces) and 20% (97 pieces) for the three colors.
These color shades used for calibration are representative of the top surface area of orchids that grow in greenhouses (Figure 7). Table 2 shows the effect of height on image processing accuracy from wireless WebCAMs. An altitude of 1 m–1.2 m can be considered as having acceptably high accuracy in image processing data.
3.2. Estimation of Leaf Chlorophyll Content with Vegetation Index
The GNDVI value significantly correlated with the leaf chlorophyll; a higher GNDVI value corresponded to higher leaf chlorophyll. The coefficient of determination was (R2) 0.985 for a healthy dendrobium orchid (Aged) and 0.870 for a healthy dendrobium orchid (Young) (Figure 8).
The leaf chlorophyll values were in the range of 493–959 μmol m−2 for a healthy dendrobium orchid (Aged) and 275–580 μmol m−2 for a healthy dendrobium orchid (Young).
In relation to the proportion of color pixel density, the effect of the observation altitude was evaluated (Table 3). Results showed that 1 m–1.2 m altitude is suitable for acquiring images from WebCAMs with 5% and 10% density of orchids. Whereas, at 15% and 20% density of orchids, the height of 1.2 m is suitable.
The effect of spraying height on chemicals/pesticides at a scatterable distance of spraying was significant at 95% confidence level. The higher height obviously had a wider/scattered footprint of spraying. The best spraying accuracy of injection was at the height of 0.25 m, which corresponds to the prevention of fertilizer and the loss of chemicals/pesticides.
3.3. Crop Growth Status Monitoringand Application Map
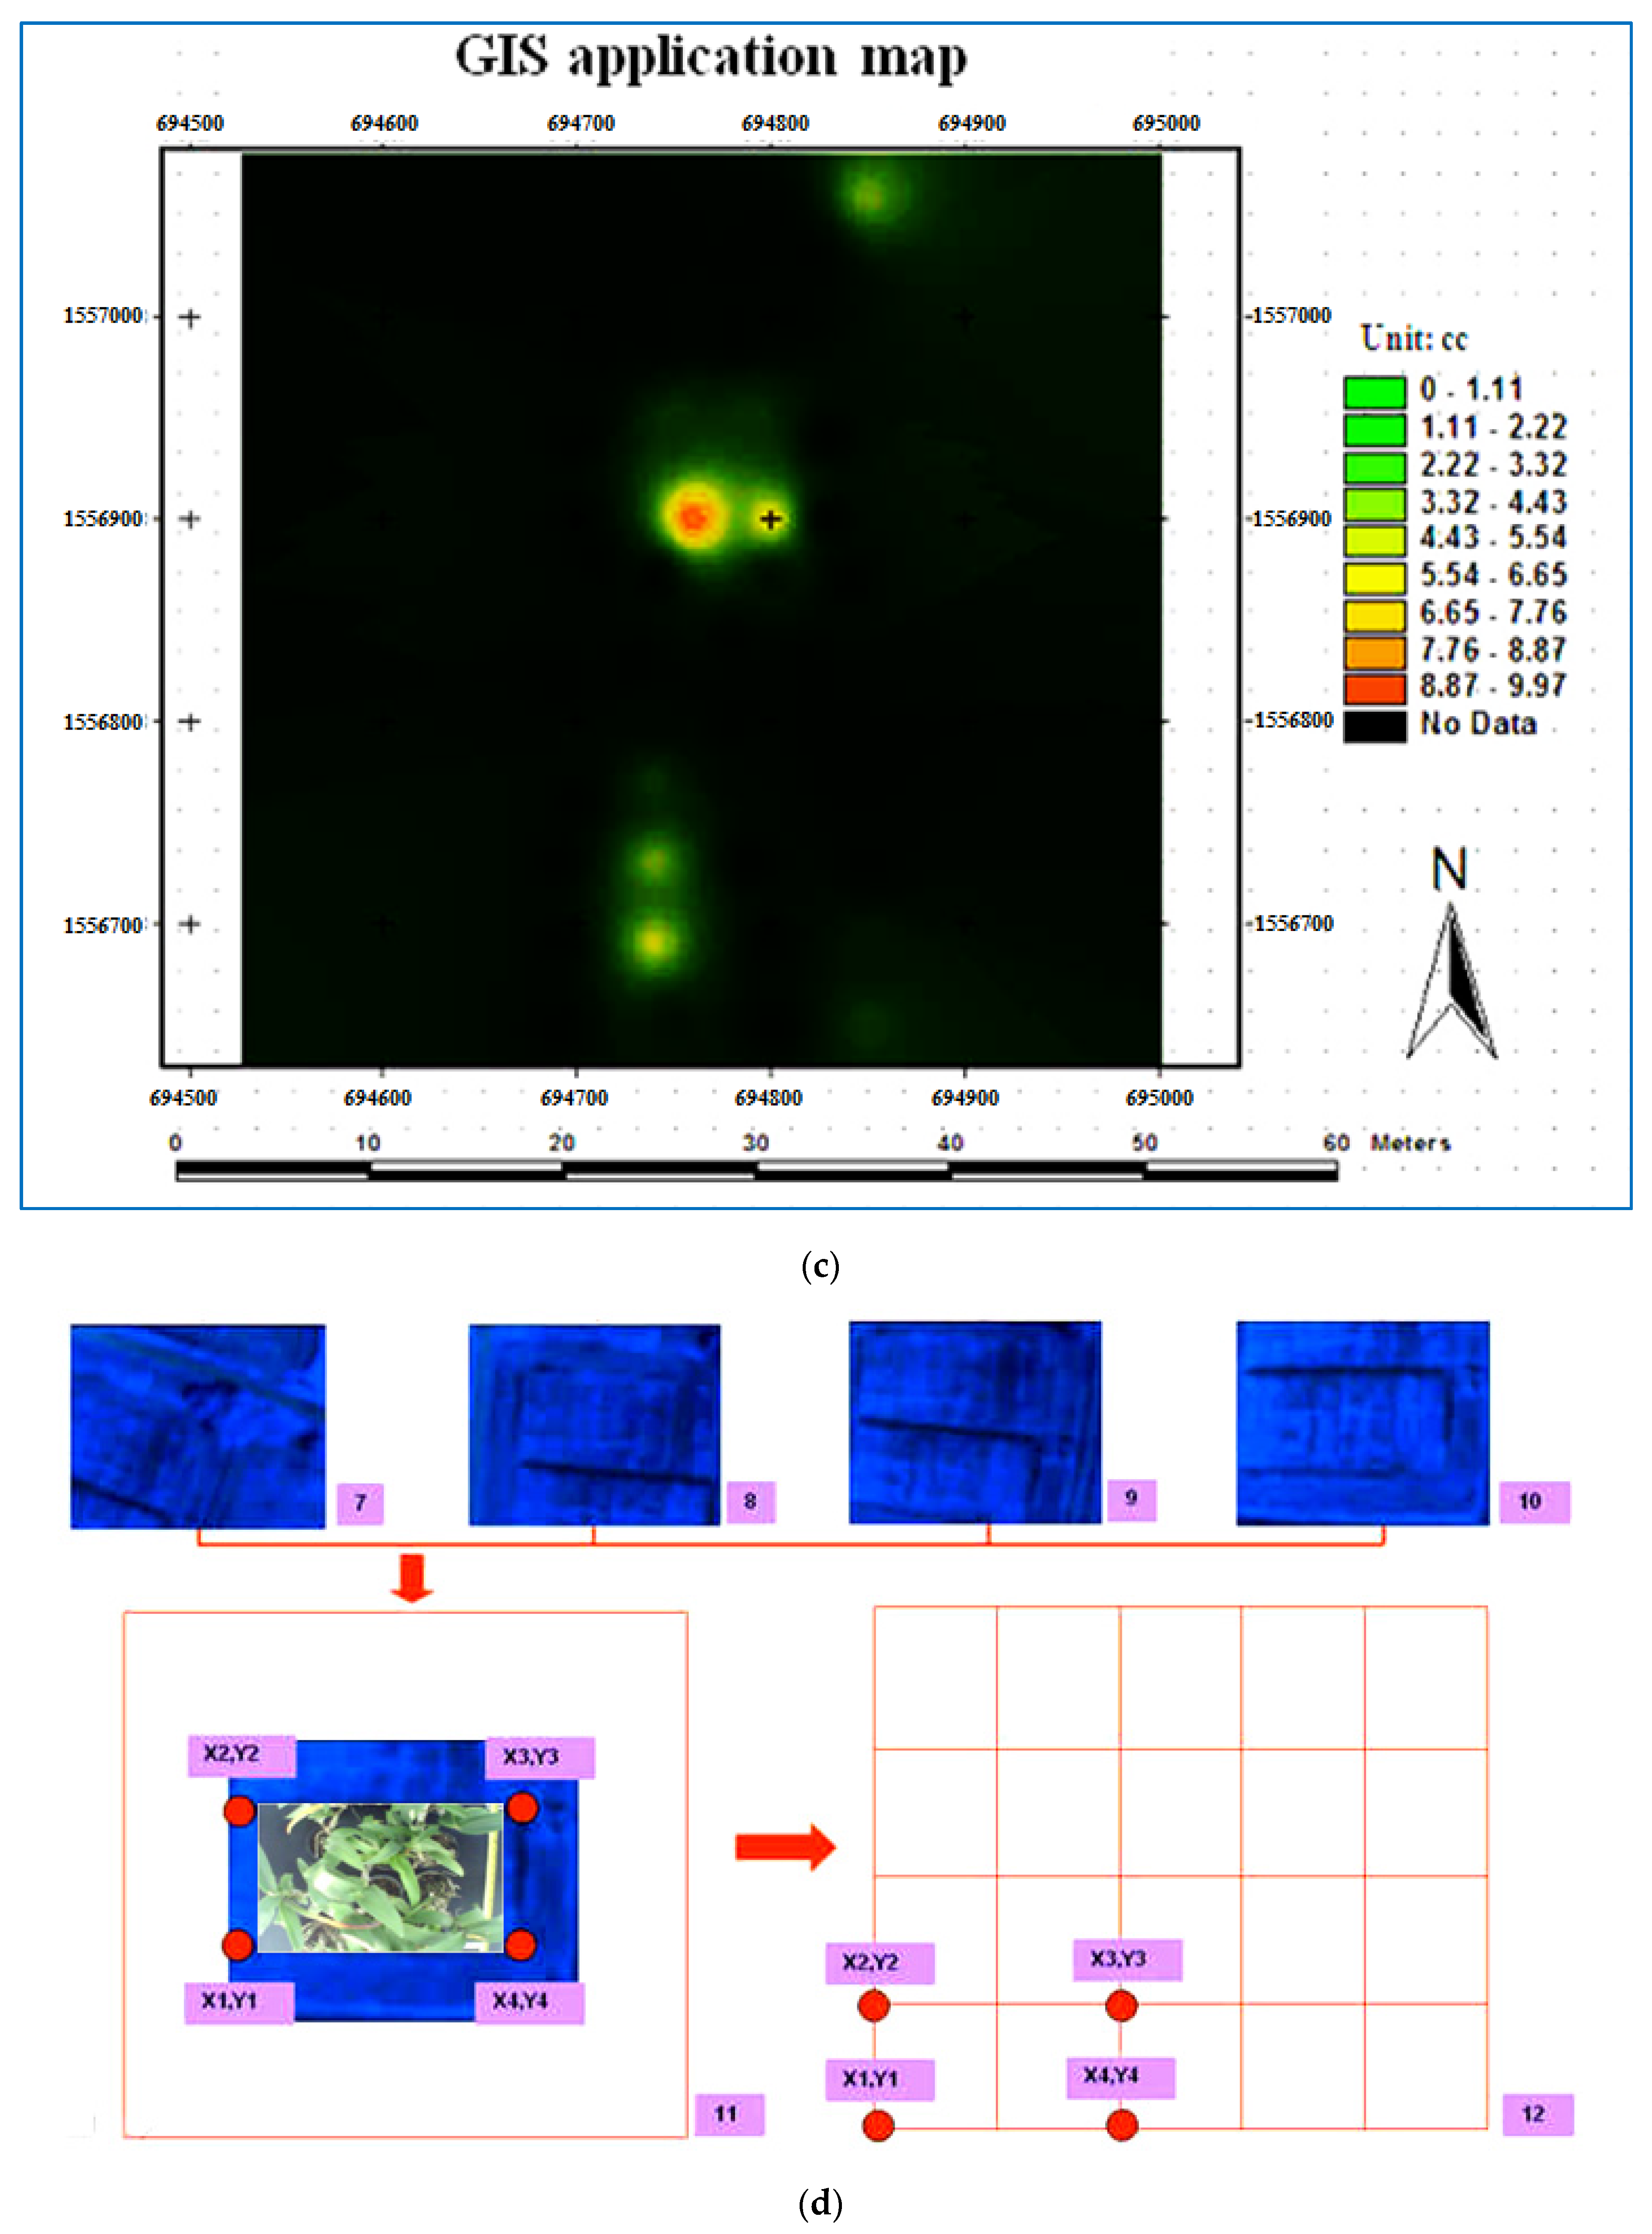
Image data acquired from the wireless WebCAMs was processed to create an application map in GIS for variable rate spraying (Figure 9), in order to provide an inexpensive solution for making future plantation facility management decisions. The system provides near real-time output, thus enabling farmers to take quick actions before severe plant damage. The plot-based images acquired by four wireless WebCAMs were associated with the information from the global positioning system (GPS) receiver (24 point coordinates). In the mechanism of converting images into the geographic information system (GIS) application map, each frame of the image was combined into a small area by using location markers, i.e., coordinate (Xi,Yi) for that area. ArcView® GIS program (Version 3.2a, Environmental Systems Research Institute, Inc., Redlands, CA, USA) was used to mask images and to trim excess areas beyond the ground margins. The altitude corrections for the images were also done beforehand. The true ground coordinates, used as the reference points, were further used to combine all the images into a matrix, as shown in Figure 9d. After all the reference images were pasted into the matrix, a combined image mosaic was obtained and then successfully converted into GIS application map layers.
4. Discussion
The data presented in Table 1, Table 2 and Table 3 was derived from the results of the research to acquire and process image data using wireless WebCAMs based on laboratory and field tests [3,6,7,8,9]. These results were primarily linked to improved image processing accuracy (see Materials and methods section).
If the data is completed correctly, the developed system can be specified with an altitude of 1 m–1.2 m being considered as having acceptably high accuracy in image processing data [7], and for acquiring images from wireless WebCAMs with 5% and 10% density of orchids. A higher GNDVI value corresponded to a higher leaf chlorophyll [8], and the coefficient of determination was 0.985 (R2) for a healthy dendrobium orchid (Aged) and 0.870 for a healthy dendrobium orchid (Young); the leaf chlorophyll values were in the range of 493–959 μmol m−2 for a healthy dendrobium orchid (Aged) and 275–580 μmol m−2 for a healthy dendrobium orchid (Young). The image data acquired from the wireless WebCAMs was processed to create an application map in GIS for variable rate spraying [1,2,4,5] in terms of the big data knowledge for agriculture.
Young healthy dendrobium orchids showed lower integrity with the R2 value than aged healthy dendrobium orchids; although significant error could be due to smaller canopies resulting in an uncovered cultivated surface. The wireless WebCAMs images provide near-real-time and sufficiently precise results in order to develop vegetation indices and to discriminate between infected crops, regardless of their growth stage when compared to other techniques. This methodology would be useful to medium-to-large scale dendrobium orchid growers and it showed the potential scope for application to other crops [2].
5. Conclusions
The variable rate sprayer using wireless WebCAMs was developed and tested for the precise control of pesticides and chemicals in the greenhouse. The wireless WebCAMs have their best accuracy at a height of 1.2 m for digital image processing. The chlorophyll content values (μmol m−2) according to t-test showed notable differences among clusters for healthy orchids (R2 = 0.985–0.992) and for infested orchids (R2 = 0.984–0.998). The image processing software based on LARS images provided satisfactory results compared with a manual measurement. The system quality was acceptable when established by the software and compared with the calibration data. The calibration data was generated at the different altitude levels of 1 m, 1.2 m, 1.4 m and 1.6 m, and the density of sample sheets of 5%, 10%, 15% and 20%, respectively. The accuracy of the image processing was found to be most effective at a height of 1.2 m.
This research could be used to form a database for the further adoption of technology with respect to the variable rate spraying application in dendrobium orchid plantations. Image processing techniques are used to increase the precision of controlling the rates of pesticide or chemicals in greenhouses.
Acknowledgements
The research team would like to thank the RMUTT annual government statement of expenditure in 2015 from Rajamangala University of Technology Thanyaburi, PathumThani, who supported the budget funds, equipment and personnel in place to prepare the test in this research; comments in the report are reflected in the research grants and Rajamangala University of Technology Thanyaburi is not always in agreement.
Author Contributions
Grianggai Samseemoung designed and conceived the experiment. Peeyush Soni carried out the field work. Chaiyan Sirikul analyzed the data. Grianggai Samseemoung, Peeyush Soni and Chaiyan Sirikul drafted the article thanks to additional funding from Rajamangala University of Technology. Thanyaburi was the project leader.
Conflicts of Interest
The authors declare no conflict of interest.
Abbreviations
| Hectare | ha |
| Kilogram | kg |
| Kilowatt | kW |
| Kilowatt-hour | kWh |
| Liter | L |
| Meter | m |
| Revolutions per minute | rpm |
| Square | sq. |
| Volt | V |
| Watt | W |
References
- Samseemoung, G.; Soni, P.; Jayasuriya, H.P.W.; Salokhe, V.M. Oil palm pest infestation monitoring and evaluation by helicopter-mounted, low altitude remote sensing platform. J. Appl. Remote Sens. 2011, 5, 053540. [Google Scholar] [CrossRef]
- Samseemoung, G.; Soni, P.; Jayasuriya, H.P.W.; Salokhe, V.M. Application of low altitude remote sensing (LARS) platform for monitoring crop growth and weed infestation in a soybean plantation. Precis. Agric. 2012, 13, 611–627. [Google Scholar] [CrossRef]
- Putra, B.T.W.; Soni, P. Evaluating NIR-Red and NIR-Red edge external filters with digital cameras for assessing vegetation indices under different illumination. Infrared Phys. Technol. 2017, 81, 148–156. [Google Scholar] [CrossRef]
- Markwell, J.; Osterman, J.; Mitchell, J. Calibration of the Minolta SPAD-502 leaf chlorophyll meter. Photosynth 1995, 46, 467–472. [Google Scholar] [CrossRef] [PubMed]
- Stafford, J.V.; Benloch, J.V. Machine assisted detection of weeds and weed patches. In Proceedings of the First European Conference on Precision Agriculture; BIOS Scientific Publishers Limited: Oxford, UK, 1997; pp. 511–518. [Google Scholar]
- Dasari, M.; Friedman, L.; Jesberger, J.; Stuve, T.A.; Finding, R.L.; Swales, T.P.; Schulz, S.C. A magnetic resonance imaging study of thalamic area in adolescent patients with either schizophrenia or bipolar disorder as compared to healthy controls. Psychiatry Res. Neuronimaging 1999, 91, 155–162. [Google Scholar] [CrossRef]
- Putra, B.T.W.; Soni, P. Enhanced Broadband Greenness in Assessing Chlorophyll a and b, Carotenoid, and Nitrogen in Robusta Coffee Plantations using a Digital Camera. Precis. Agric. 2017. [CrossRef]
- Chaisattapagon, C.; Zhang, N. Effective criteria for weed identification in wheat fields using machine vision. Trans. ASAE 1995, 38, 965–974. [Google Scholar] [CrossRef]
- Franz, H.; Armanini, M.P. Characterization of a multi-component receptor for GDNF. Nature 1996. [Google Scholar] [CrossRef]
Figure 1.
Experimental set up and field preparation, (a) Greenhouse; (b) Orchid plants; (c) Minolta SPAD 502 Meter (Konica Minolta Sensing Inc., Osaka, Japan) measuring plant leaves; (d) Calibration of volume flow rate control; (e) SKR 1800 (Skye Instruments, Ltd., Powys, UK) illumination sensor.
Figure 1.
Experimental set up and field preparation, (a) Greenhouse; (b) Orchid plants; (c) Minolta SPAD 502 Meter (Konica Minolta Sensing Inc., Osaka, Japan) measuring plant leaves; (d) Calibration of volume flow rate control; (e) SKR 1800 (Skye Instruments, Ltd., Powys, UK) illumination sensor.
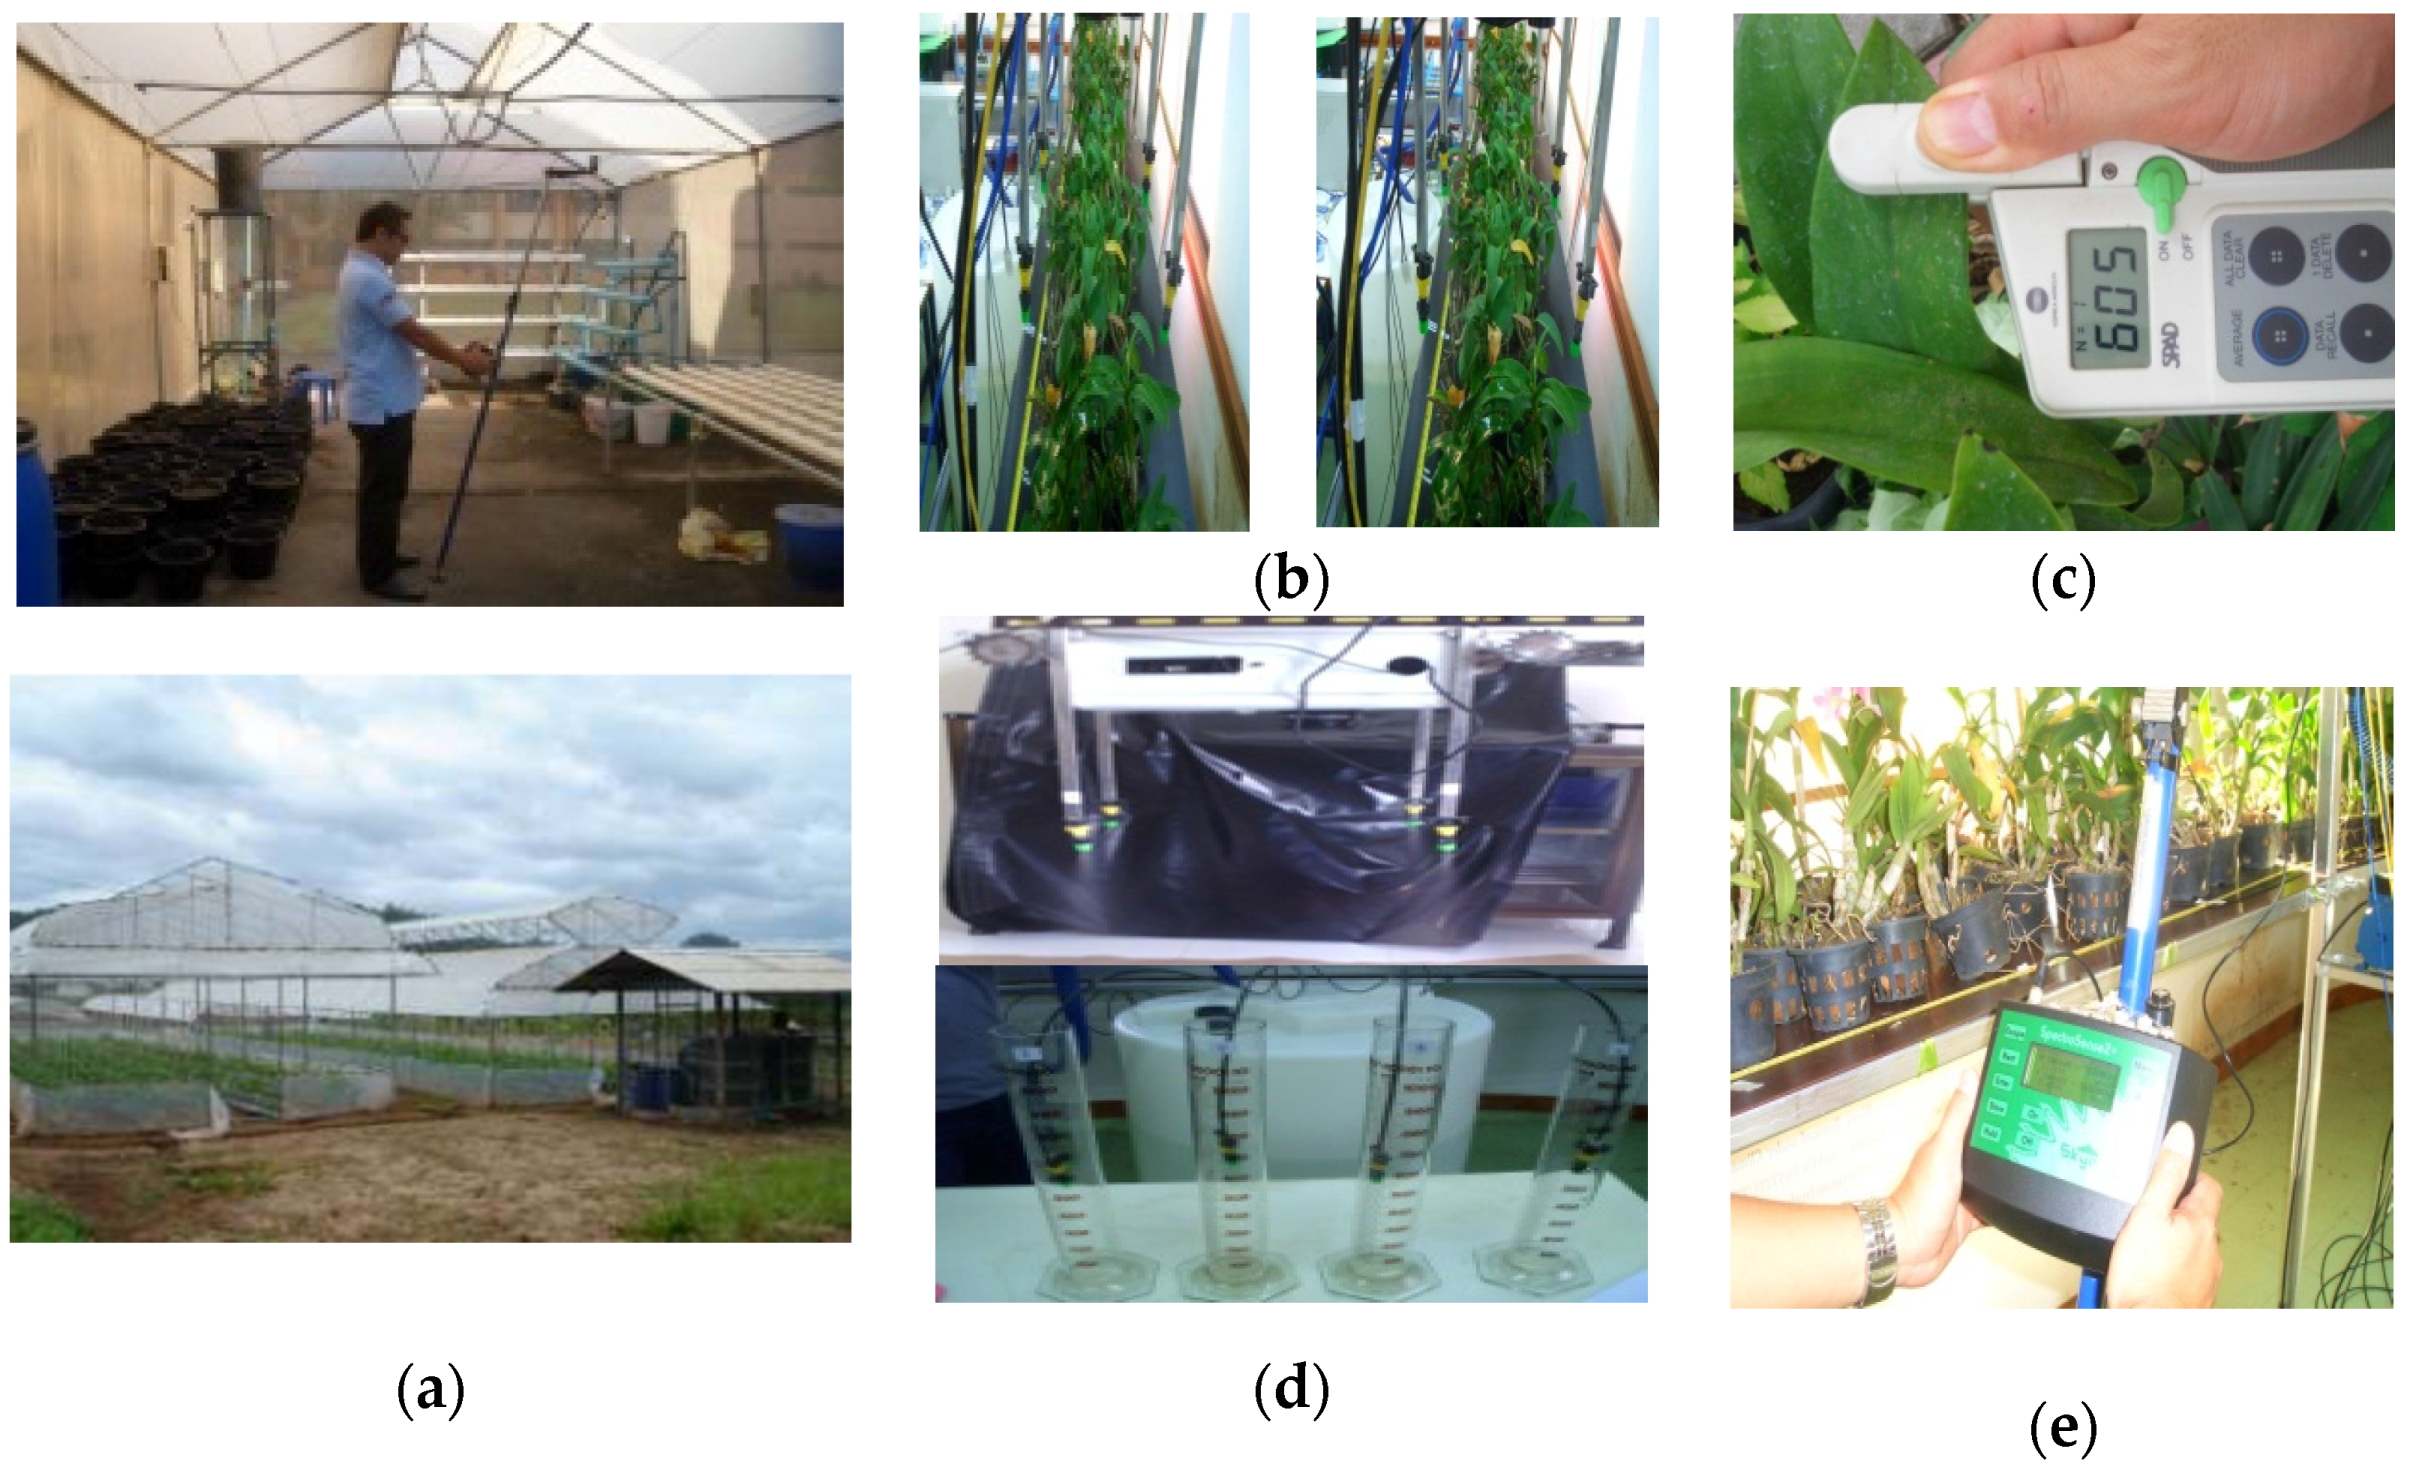
Figure 2.
Variable rate spraying system with flow-based control.

Figure 3.
Specifications of the variable rate application spraying system: (a) Experimental layout of orchids inside the greenhouse; (b) A double row bar with a carrier controller and wireless WebCAM with a receiver; (c) Microcontroller with various sensors and nozzles; (d) Solenoid valve; (e) Gear motor and voltage adapter (220 VAC to 24 VDC, 5 A).

Figure 4.
Variable rate spraying system with automatic direct fertilizer injection.
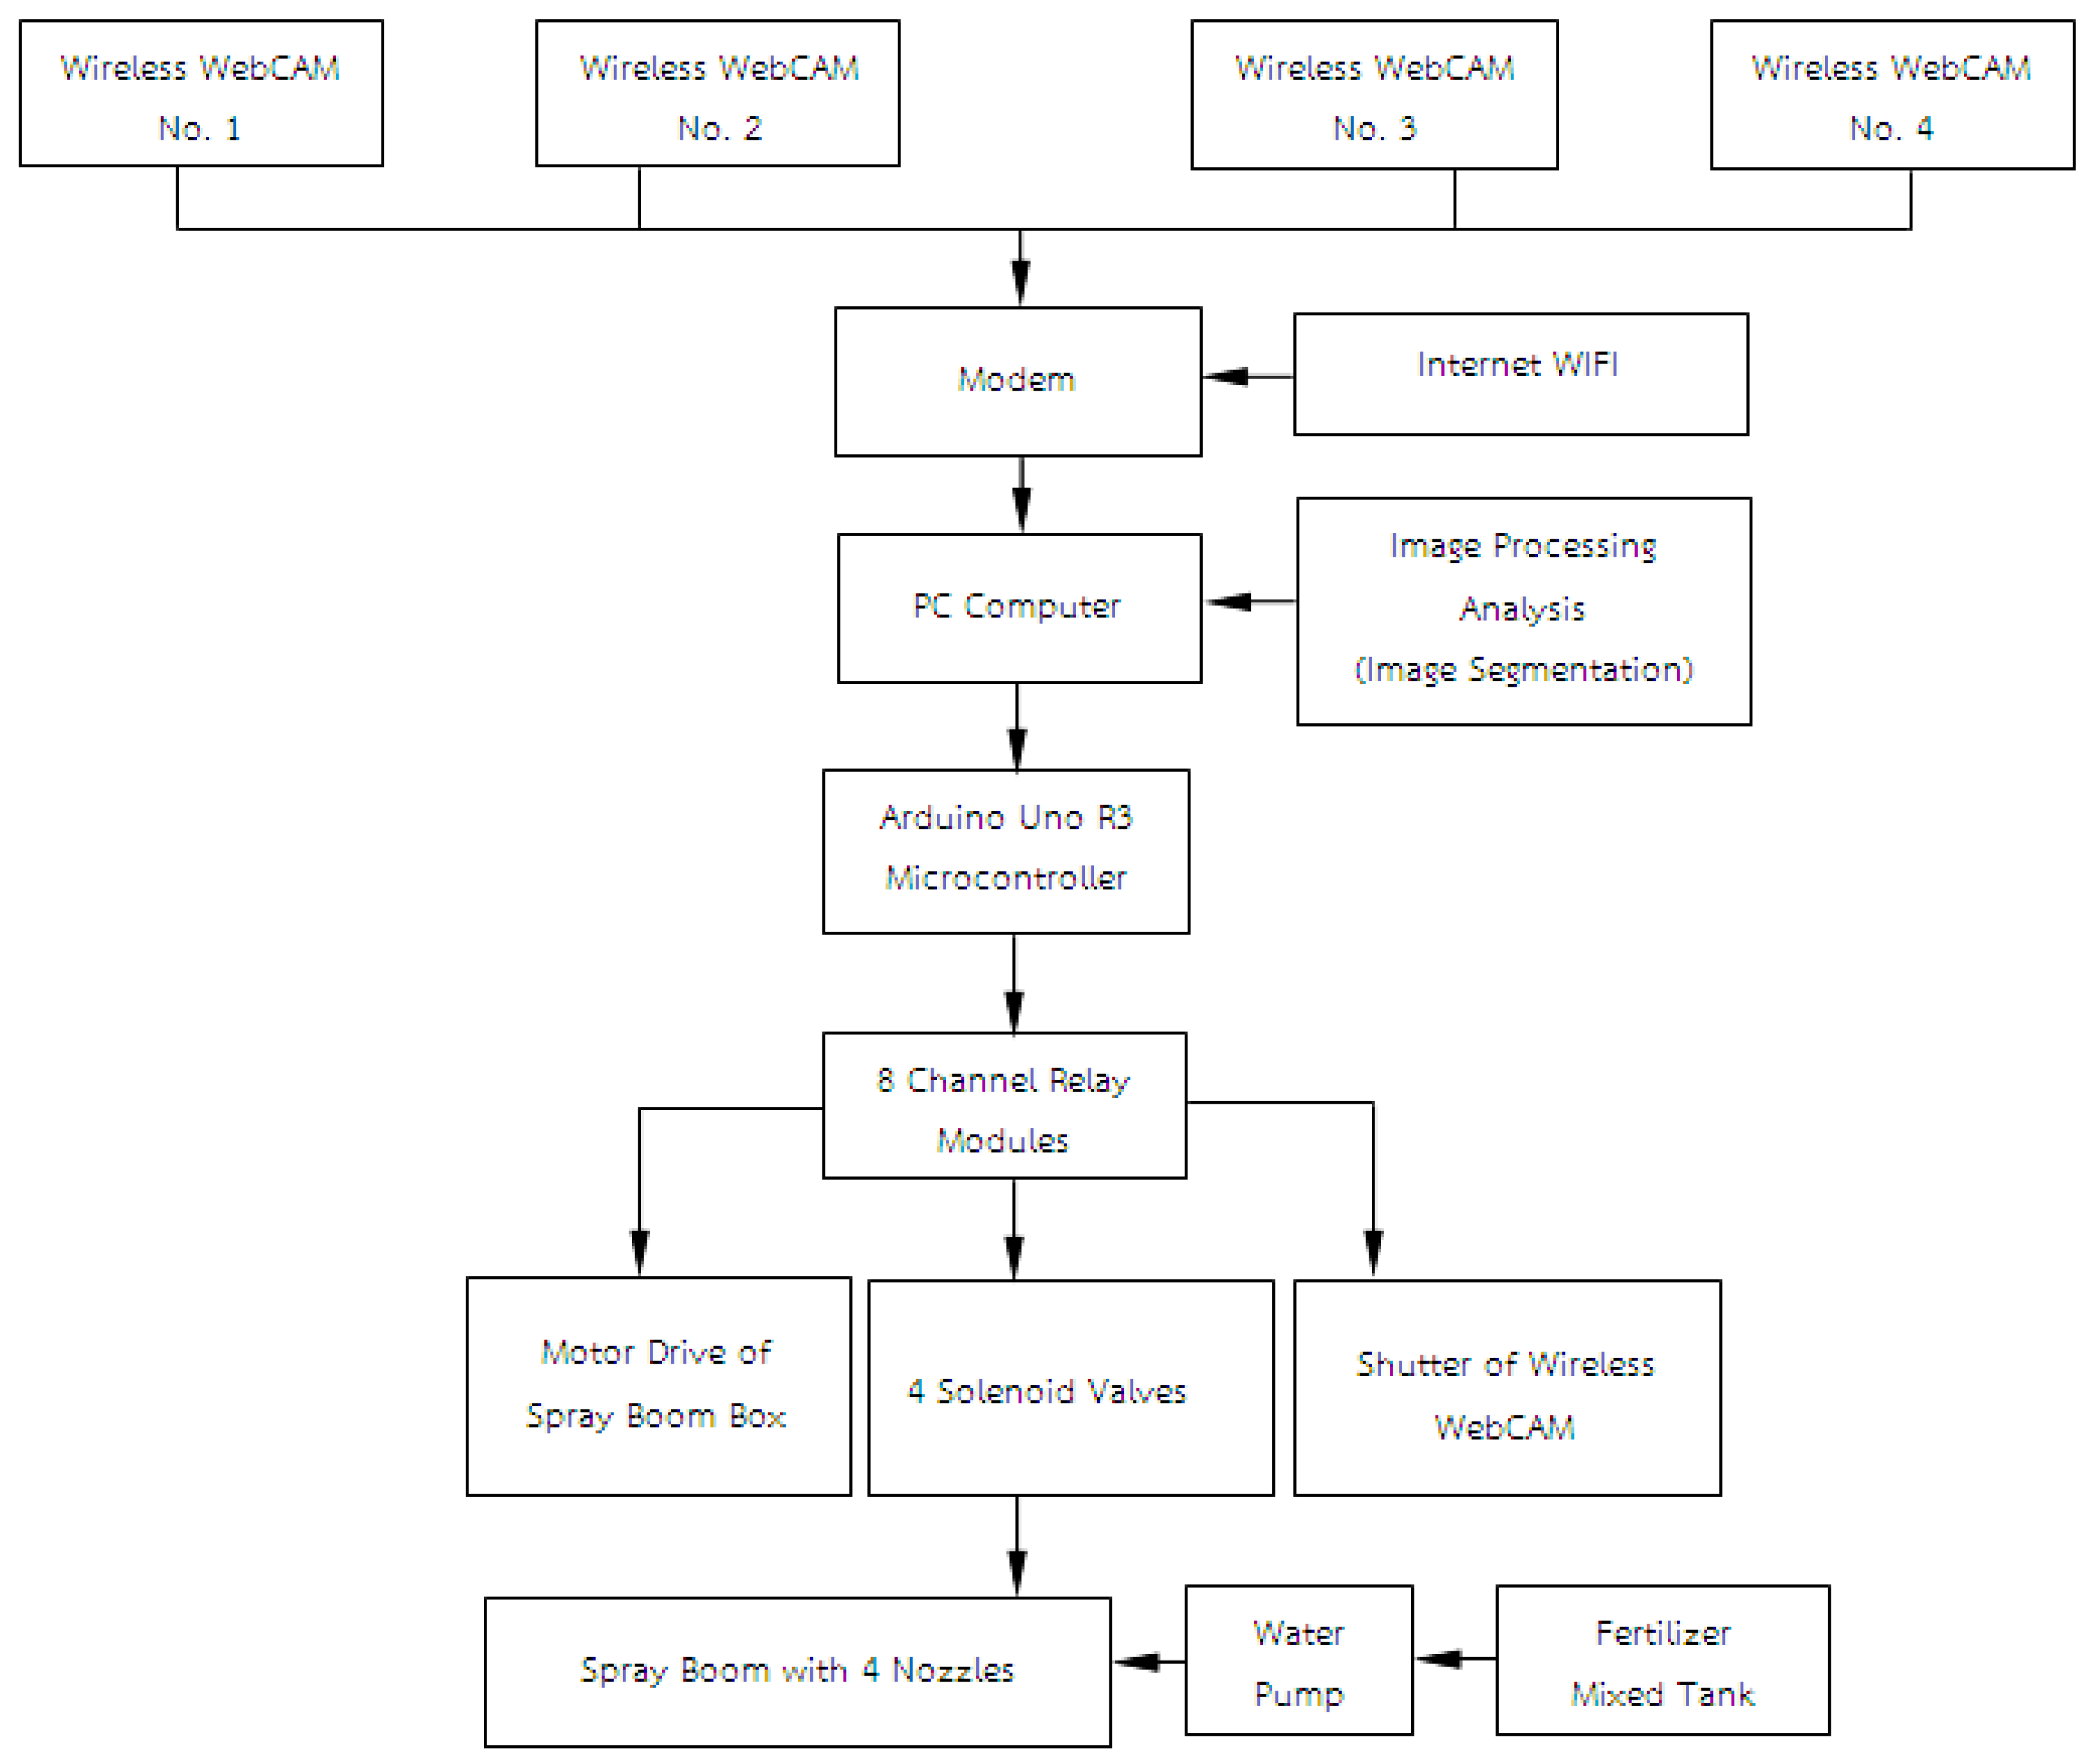
Figure 5.
Image processing software with green color thresholding: (a) Plant growth stage determination by segmentation; (b) Infested area segmentation for target detection.
Figure 5.
Image processing software with green color thresholding: (a) Plant growth stage determination by segmentation; (b) Infested area segmentation for target detection.

Figure 6.
Functioning of the image processing software.

Figure 7.
(a) Image processing calibration from wireless WebCAMs; (b) green color density 20% image segmented at different heights.
Figure 7.
(a) Image processing calibration from wireless WebCAMs; (b) green color density 20% image segmented at different heights.

Figure 8.
Leaf chlorophyll content estimation from leaf reflectance (green normalized differential vegetation index—GNDVI) for aged and young orchids (healthy).
Figure 8.
Leaf chlorophyll content estimation from leaf reflectance (green normalized differential vegetation index—GNDVI) for aged and young orchids (healthy).
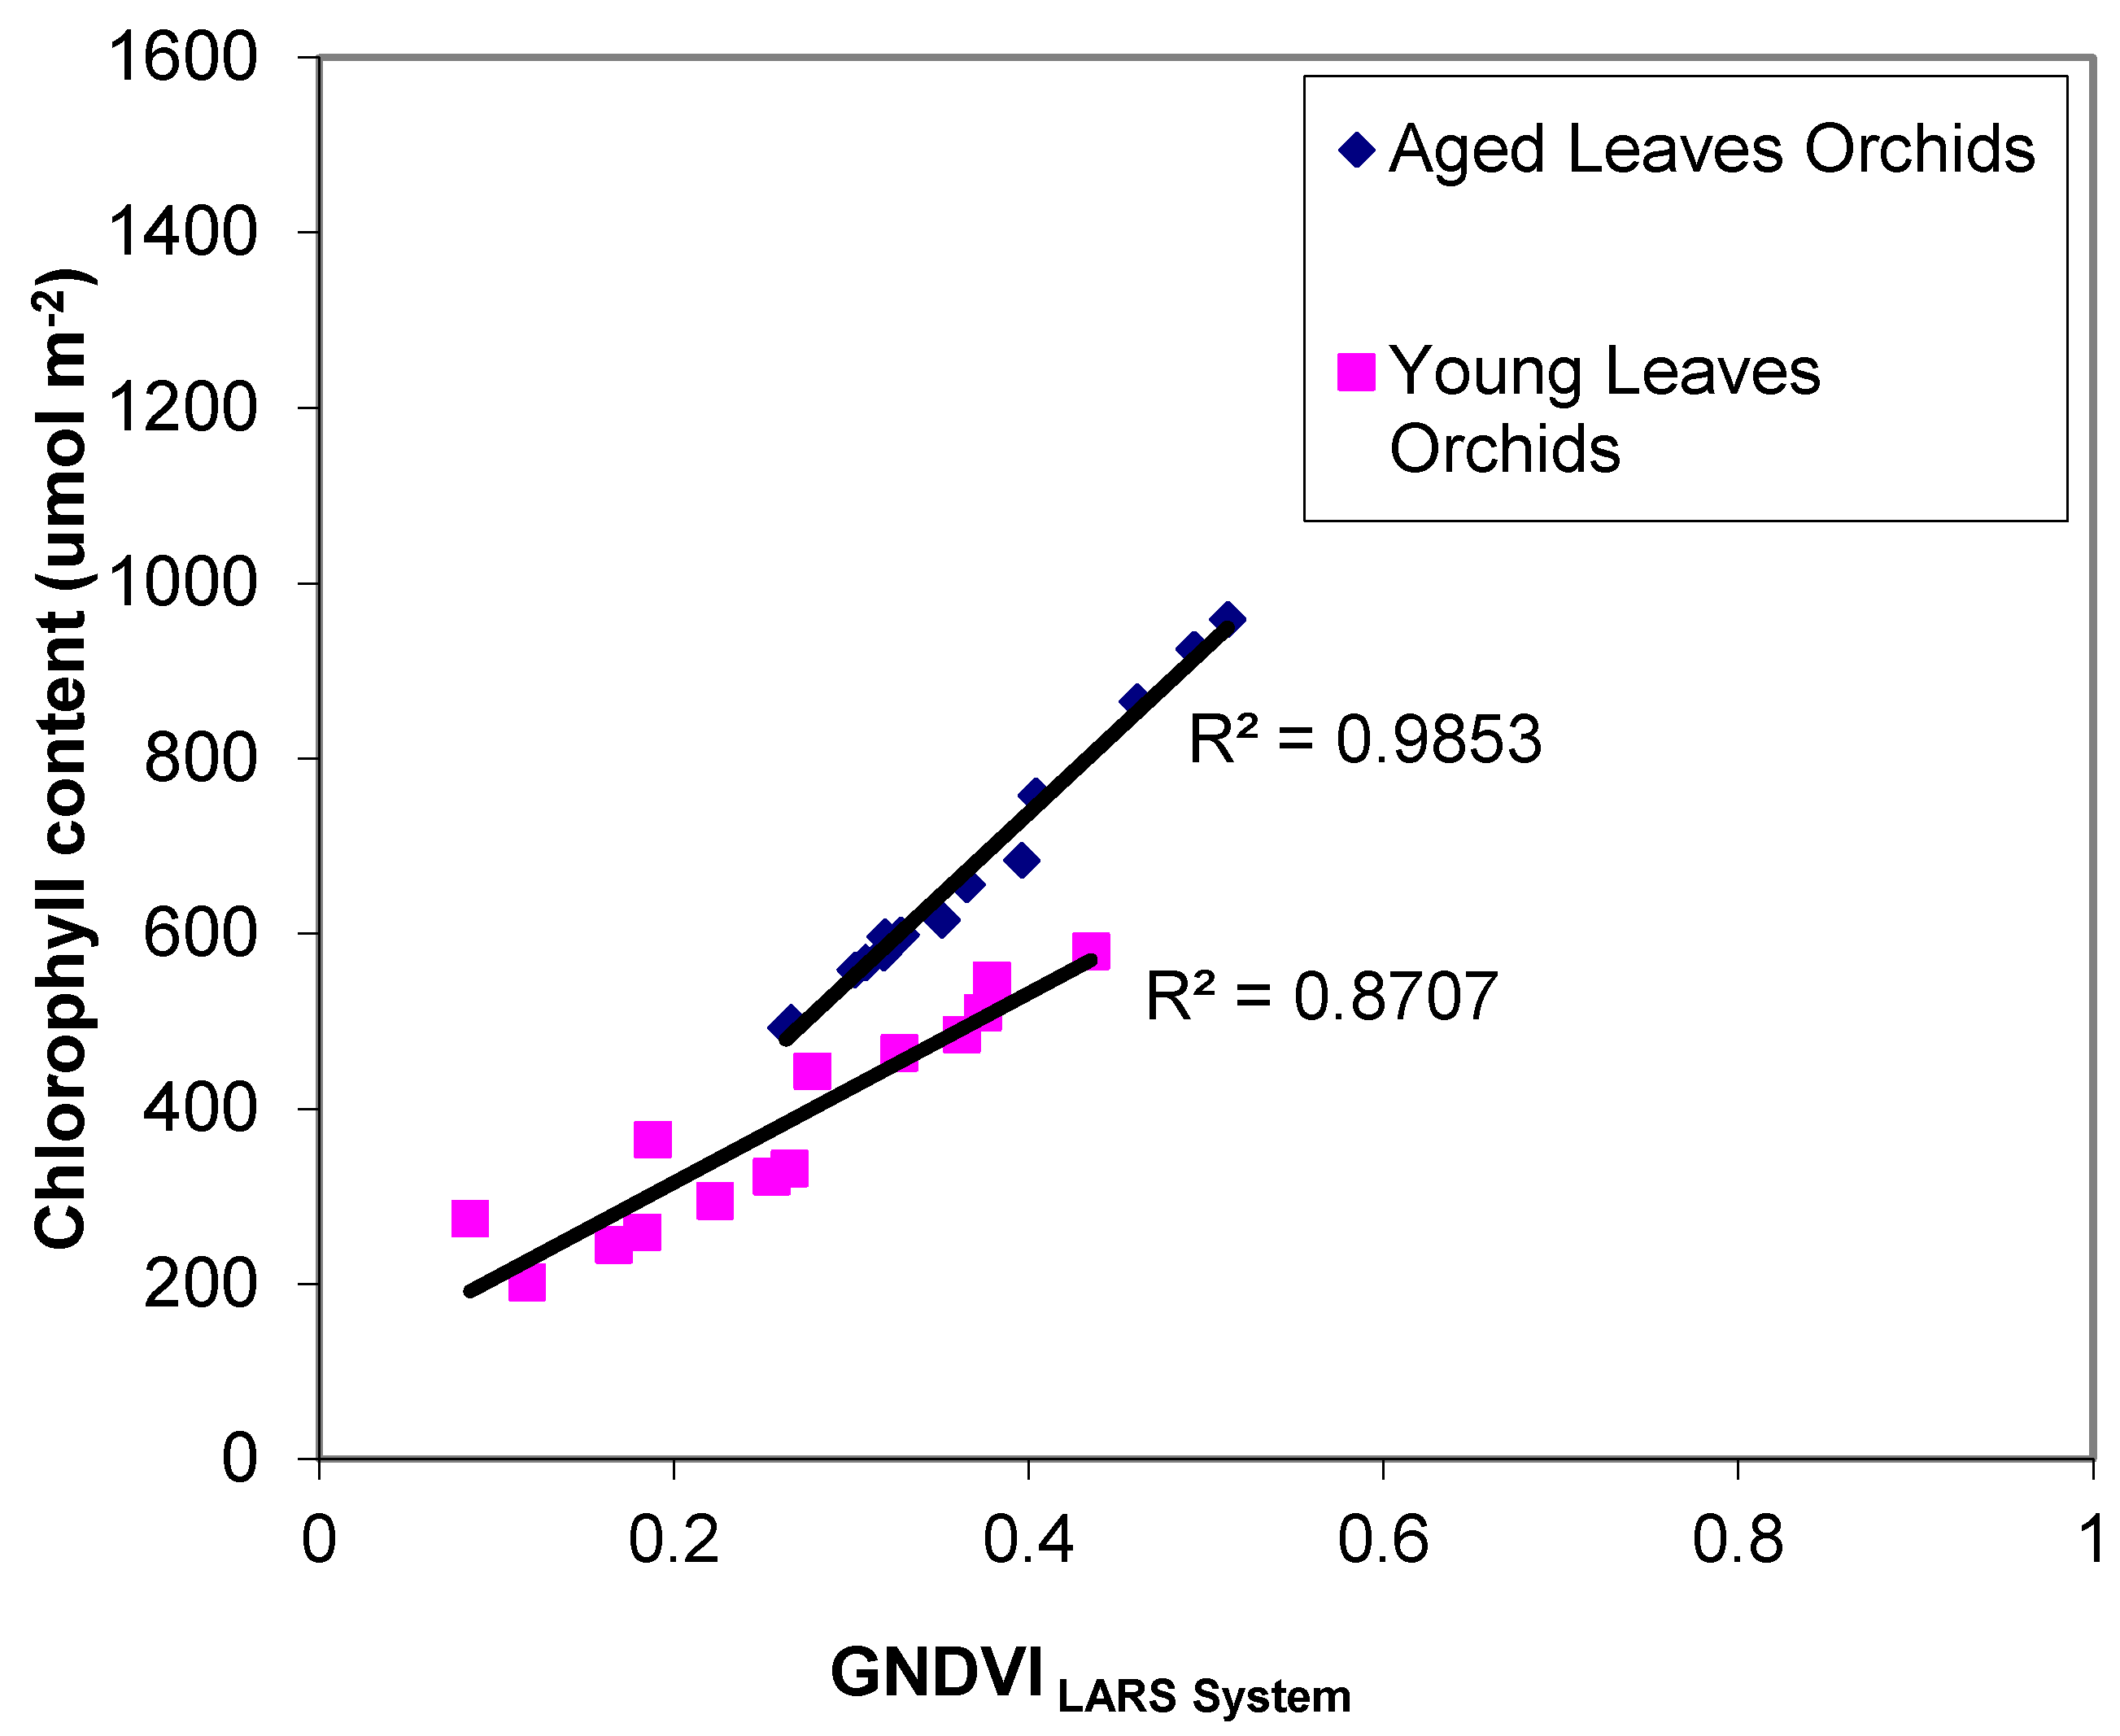
Figure 9.
GIS application maps for crop status monitoring and spraying (a) The crop growth density segmented from wireless WebCAMs, (b) The infestation of pest and diseases segmented from wireless WebCAMs, (c) GIS application map (units are cc.), (d) The combination of plot-based images of wireless WebCAMs.

Table 1.
Specifications * of the sensors used in this research.
| Wireless WebCAMsVimicro USB2.0 UVC PC Camera (SWIFT-TECH ELECTRONICS Co. Ltd., Beijing, China) | Chlorophyll Meter (Minolta SPAD 502 Meter; Konica Minolta Sensing Inc., Osaka, Japan) | Illumination Sensor SKR-1800 (Spectrum Technology Inc., Powys, PA, USA) | Microcontroller Board Arduino Uno R3 (Shenzhen Shanhai Technology Ltd., Shenzhen, China) | ||||
|---|---|---|---|---|---|---|---|
| Feature | Value | Feature | Value | Feature | Value | Feature | Value |
| Image size resolution | 2.0 to 6.0 Mega pixels | Type | Hand held meter | Range | Two channels each between 400–1050 nm | Type | Microcontroller ATmega328 |
| Ground pixel size | 10X real-time digital zoom | Measuring sample | Crop leaves | Construction | Dupont “Delrin” acrylic | Operating Voltage | 5 V |
| Spectral bands | RGB (Red, Green, Blue) | Measuring system | Optical density difference | Filters | Metal interference | Input Voltage (limits) | 6–20 V |
| Lens type | VGA format frame rate up to 30 fps | Measuring area | 2 mm × 3 mm | Detectors | GaP, GaAsP, or silicon | Digital I/O Pins | 14 |
| Mostly used | Hold true for laptop and desktop PC | Data memory | 30 data points | Cable | Screened. 7-4-C military specification 3m standard length | Analog Input Pins | 6 |
| Triggering | Manual/Optional by software | Accuracy | +/− 1.0 SPAD unit reading | Temperature Range | −25 °C to +75 °C (for a fixed PVC cable) | DC Current per I/O Pins | 40 mA |
* As claimed by the respective manufacturer.
Table 2.
The effect of wireless WebCAMs altitude on the accuracy of image data acquisition with different colors and densities.
Table 2.
The effect of wireless WebCAMs altitude on the accuracy of image data acquisition with different colors and densities.
| Simulated Stage of Crop Growth and Infestation | Altitude Levels (m) | |||
|---|---|---|---|---|
| 1 | 1.2 | 1.4 | 1.6 | |
| 1. Green color | ||||
| 5% | 4.340 a | 3.995 a | 3.756 a | 3.410 a |
| 10% | 8.365 d,e | 7.813 c,d | 6.604 b,c | 4.476 a |
| 15% | 12.400 f | 11.284 f | 9.515 e | 5.721 b |
| 20% | 16.084 g | 14.869 g | 12.178 f | 7.667 c,d |
| 2. Yellow color | ||||
| 5% | 2.837 a | 4.491 b | 4.097 b | 4.260 b |
| 10% | 7.816 d | 7.970 d | 6.724 c | 6.750 c |
| 15% | 10.926 f | 10.760 f | 9.411 e | 8.522 d |
| 20% | 14.048 h | 12.457 g | 11.947 g | 10.884 f |
| 3. Brown color | ||||
| 5% | 4.756 b | 4.786 b | 4.182 b | 2.264 a |
| 10% | 8.241 d,e | 9.244 e,f | 7.402 d | 5.228 b,c |
| 15% | 11.097 g | 11.644 g | 8.888 e,f | 6.186 c |
| 20% | 14.068 h | 14.809 h | 11.901 g | 9.432 f |
Means in a column and row followed by the same letter within a color group are not significantly different at 0.05 significant levels according to Duncan’s Multiple Range Test.
Table 3.
Effect of spraying height on spray application.
| Volume Flow Rate, L/min | Spraying Height, m | Pesticide or Chemical Scatterable Distance, m |
|---|---|---|
| 0.02 at pressure 1 bar | 0.25 | 0.220 a |
| 0.35 | 0.235 a | |
| 0.45 | 0.255 b | |
| 0.55 | 0.280 c | |
| 0.06 at pressure 1 bar | 0.25 | 0.325 a |
| 0.35 | 0.360 b | |
| 0.45 | 0.375 b | |
| 0.55 | 0.467 c | |
| 0.11 at pressure 1 bar | 0.25 | 0.530 a |
| 0.35 | 0.635 b | |
| 0.45 | 0.722 c | |
| 0.55 | 0.817 d |
Means in a column followed by the same letter within a flow rate group are not significantly different at 0.05 significant levels according to Duncan’s Multiple Range Test.
© 2017 by the authors. Licensee MDPI, Basel, Switzerland. This article is an open access article distributed under the terms and conditions of the Creative Commons Attribution (CC BY) license (http://creativecommons.org/licenses/by/4.0/).
Share and Cite
MDPI and ACS Style
Samseemoung, G.; Soni, P.; Sirikul, C. Monitoring and Precision Spraying for Orchid Plantation with Wireless WebCAMs. Agriculture 2017, 7, 87. https://doi.org/10.3390/agriculture7100087
AMA Style
Samseemoung G, Soni P, Sirikul C. Monitoring and Precision Spraying for Orchid Plantation with Wireless WebCAMs. Agriculture. 2017; 7(10):87. https://doi.org/10.3390/agriculture7100087
Chicago/Turabian StyleSamseemoung, Grianggai, Peeyush Soni, and Chaiyan Sirikul. 2017. "Monitoring and Precision Spraying for Orchid Plantation with Wireless WebCAMs" Agriculture 7, no. 10: 87. https://doi.org/10.3390/agriculture7100087
Note that from the first issue of 2016, this journal uses article numbers instead of page numbers. See further details here.