
Efflux of Soil Nitrous Oxide from Applied Fertilizer Containing Organic Materials in Citrus unshiu Field in Southwestern Japan

Abstract
:
1. Introduction
2. Materials and Methods
2.1. Study Site
2.2. Treatments and Management Practices
2.3. Measurement of Soil Nitrous Oxide and Carbon Dioxide Emission and Calculation of Emission Factor
2.4. Measurements of Mineral Nitrogen Leaching from Surface Soil
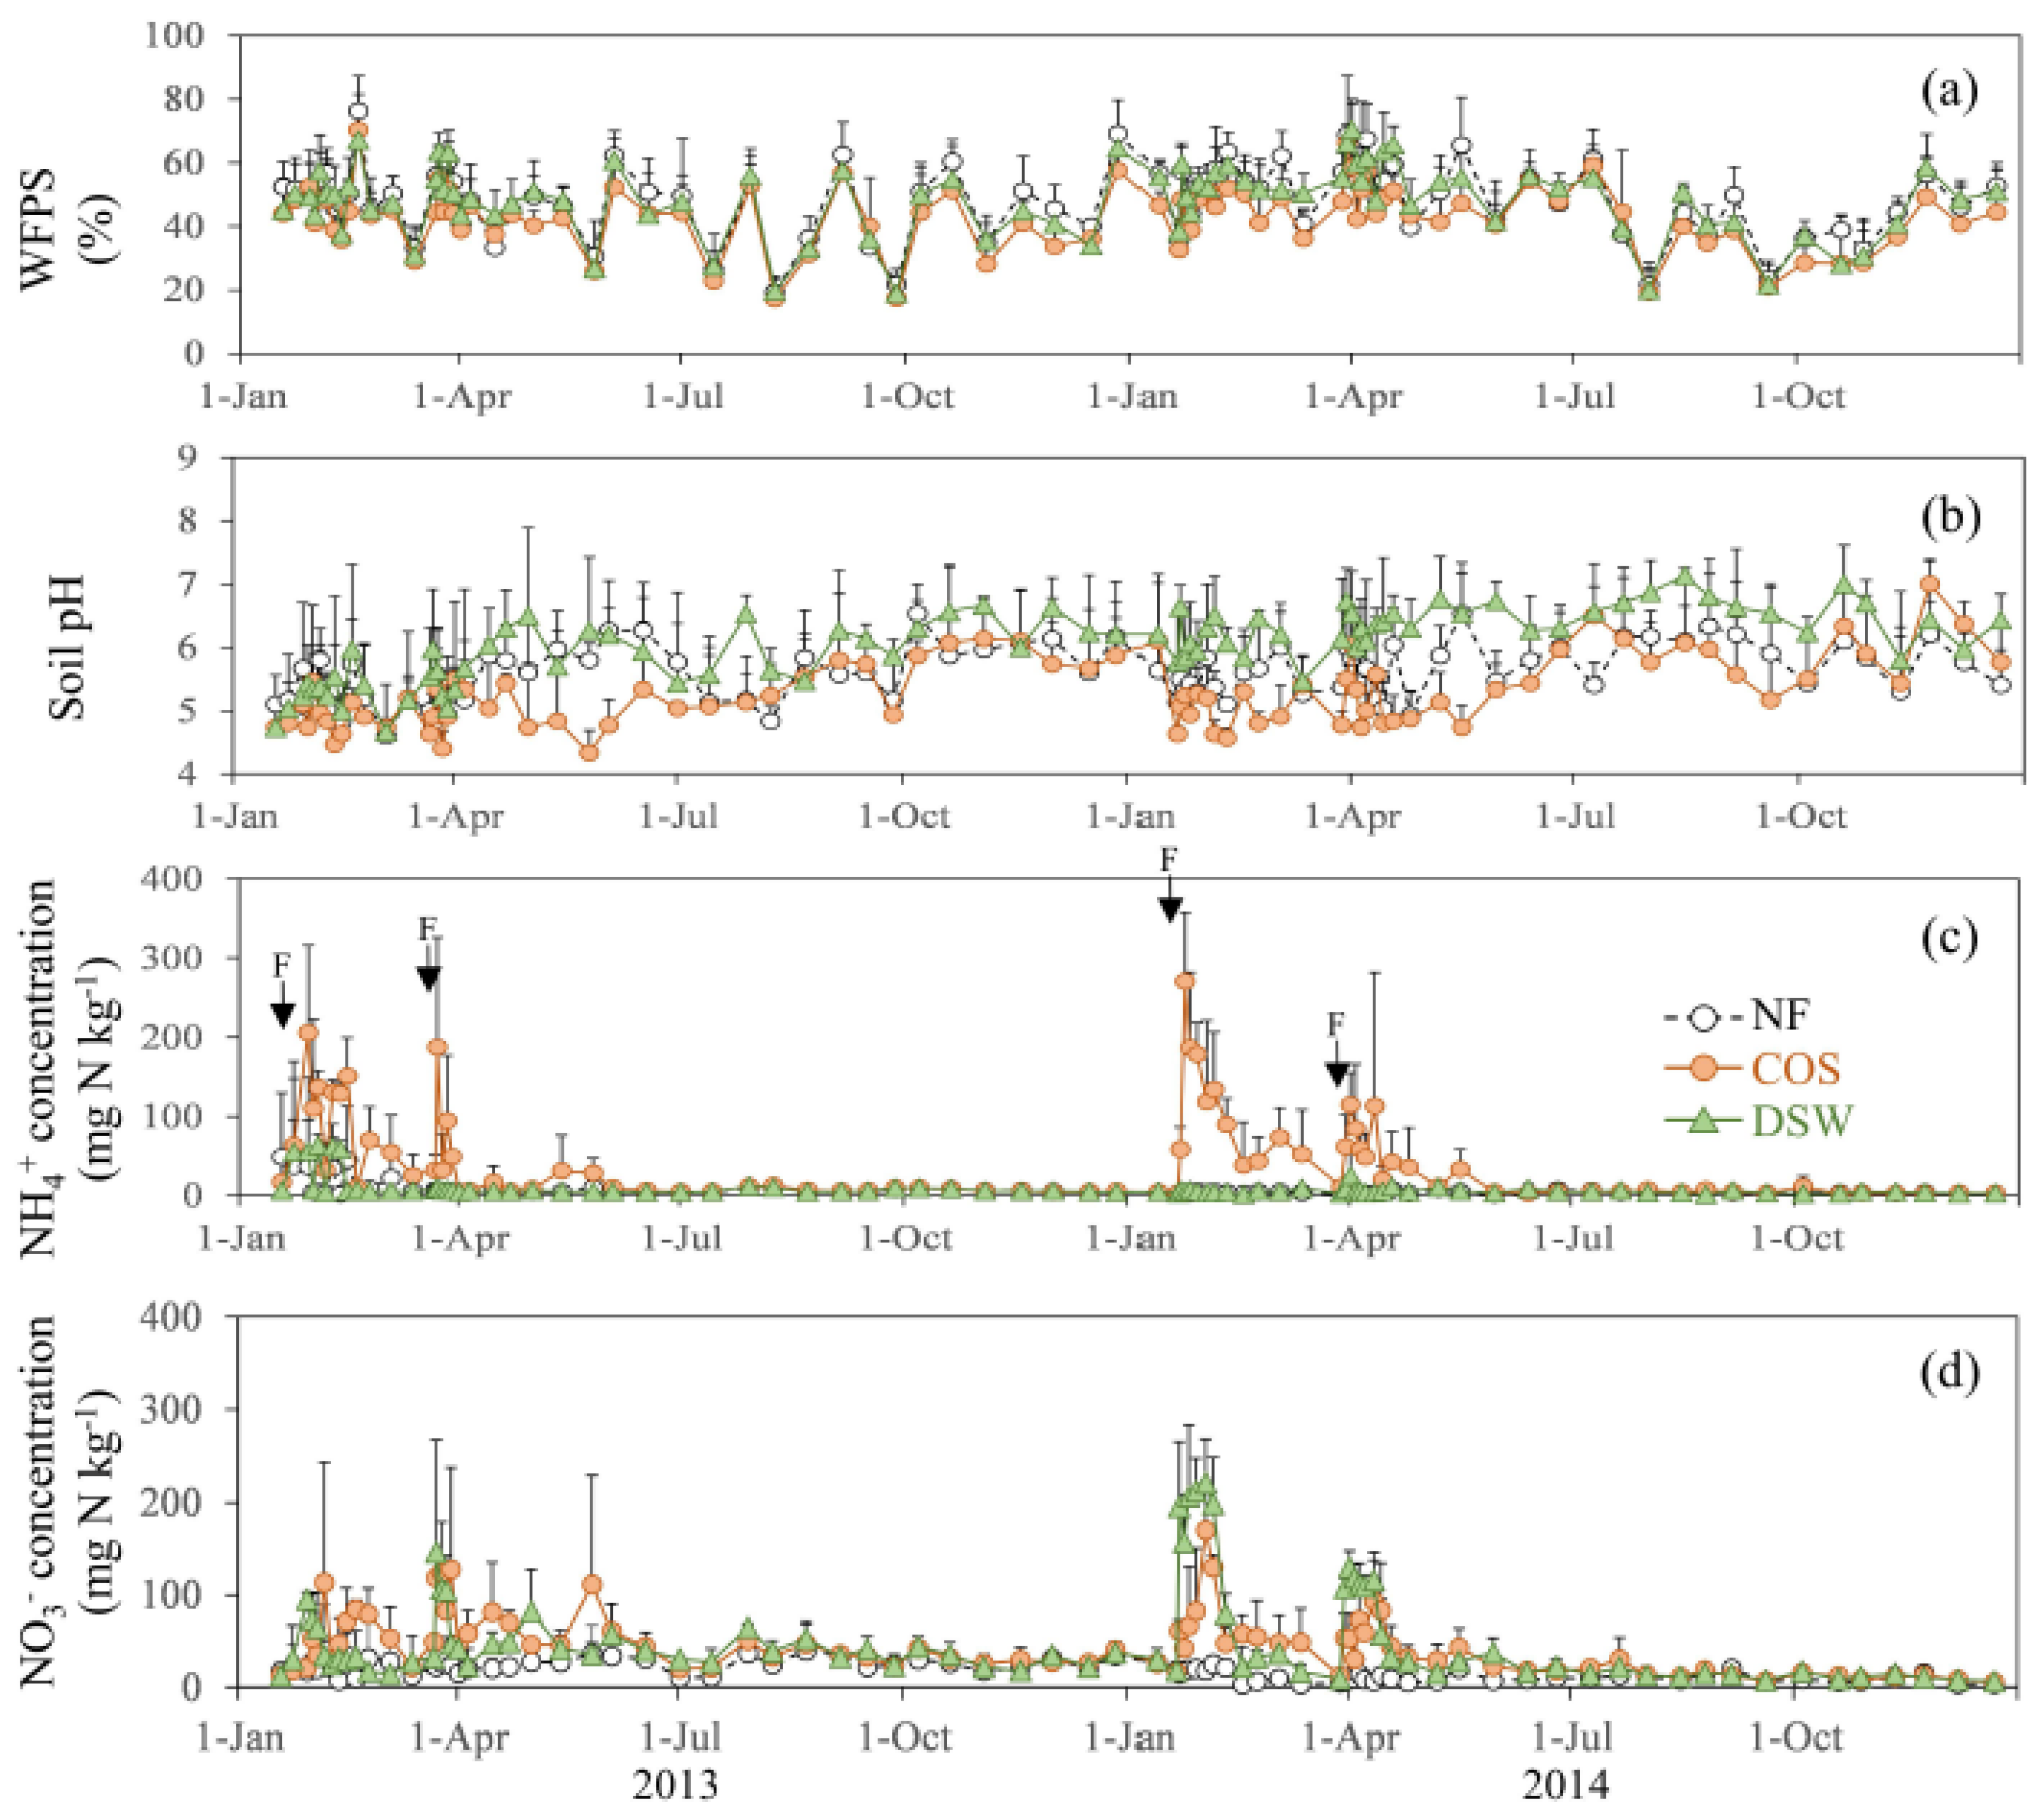
2.5. Ancillary Measurements
2.6. Ancillary Measurements
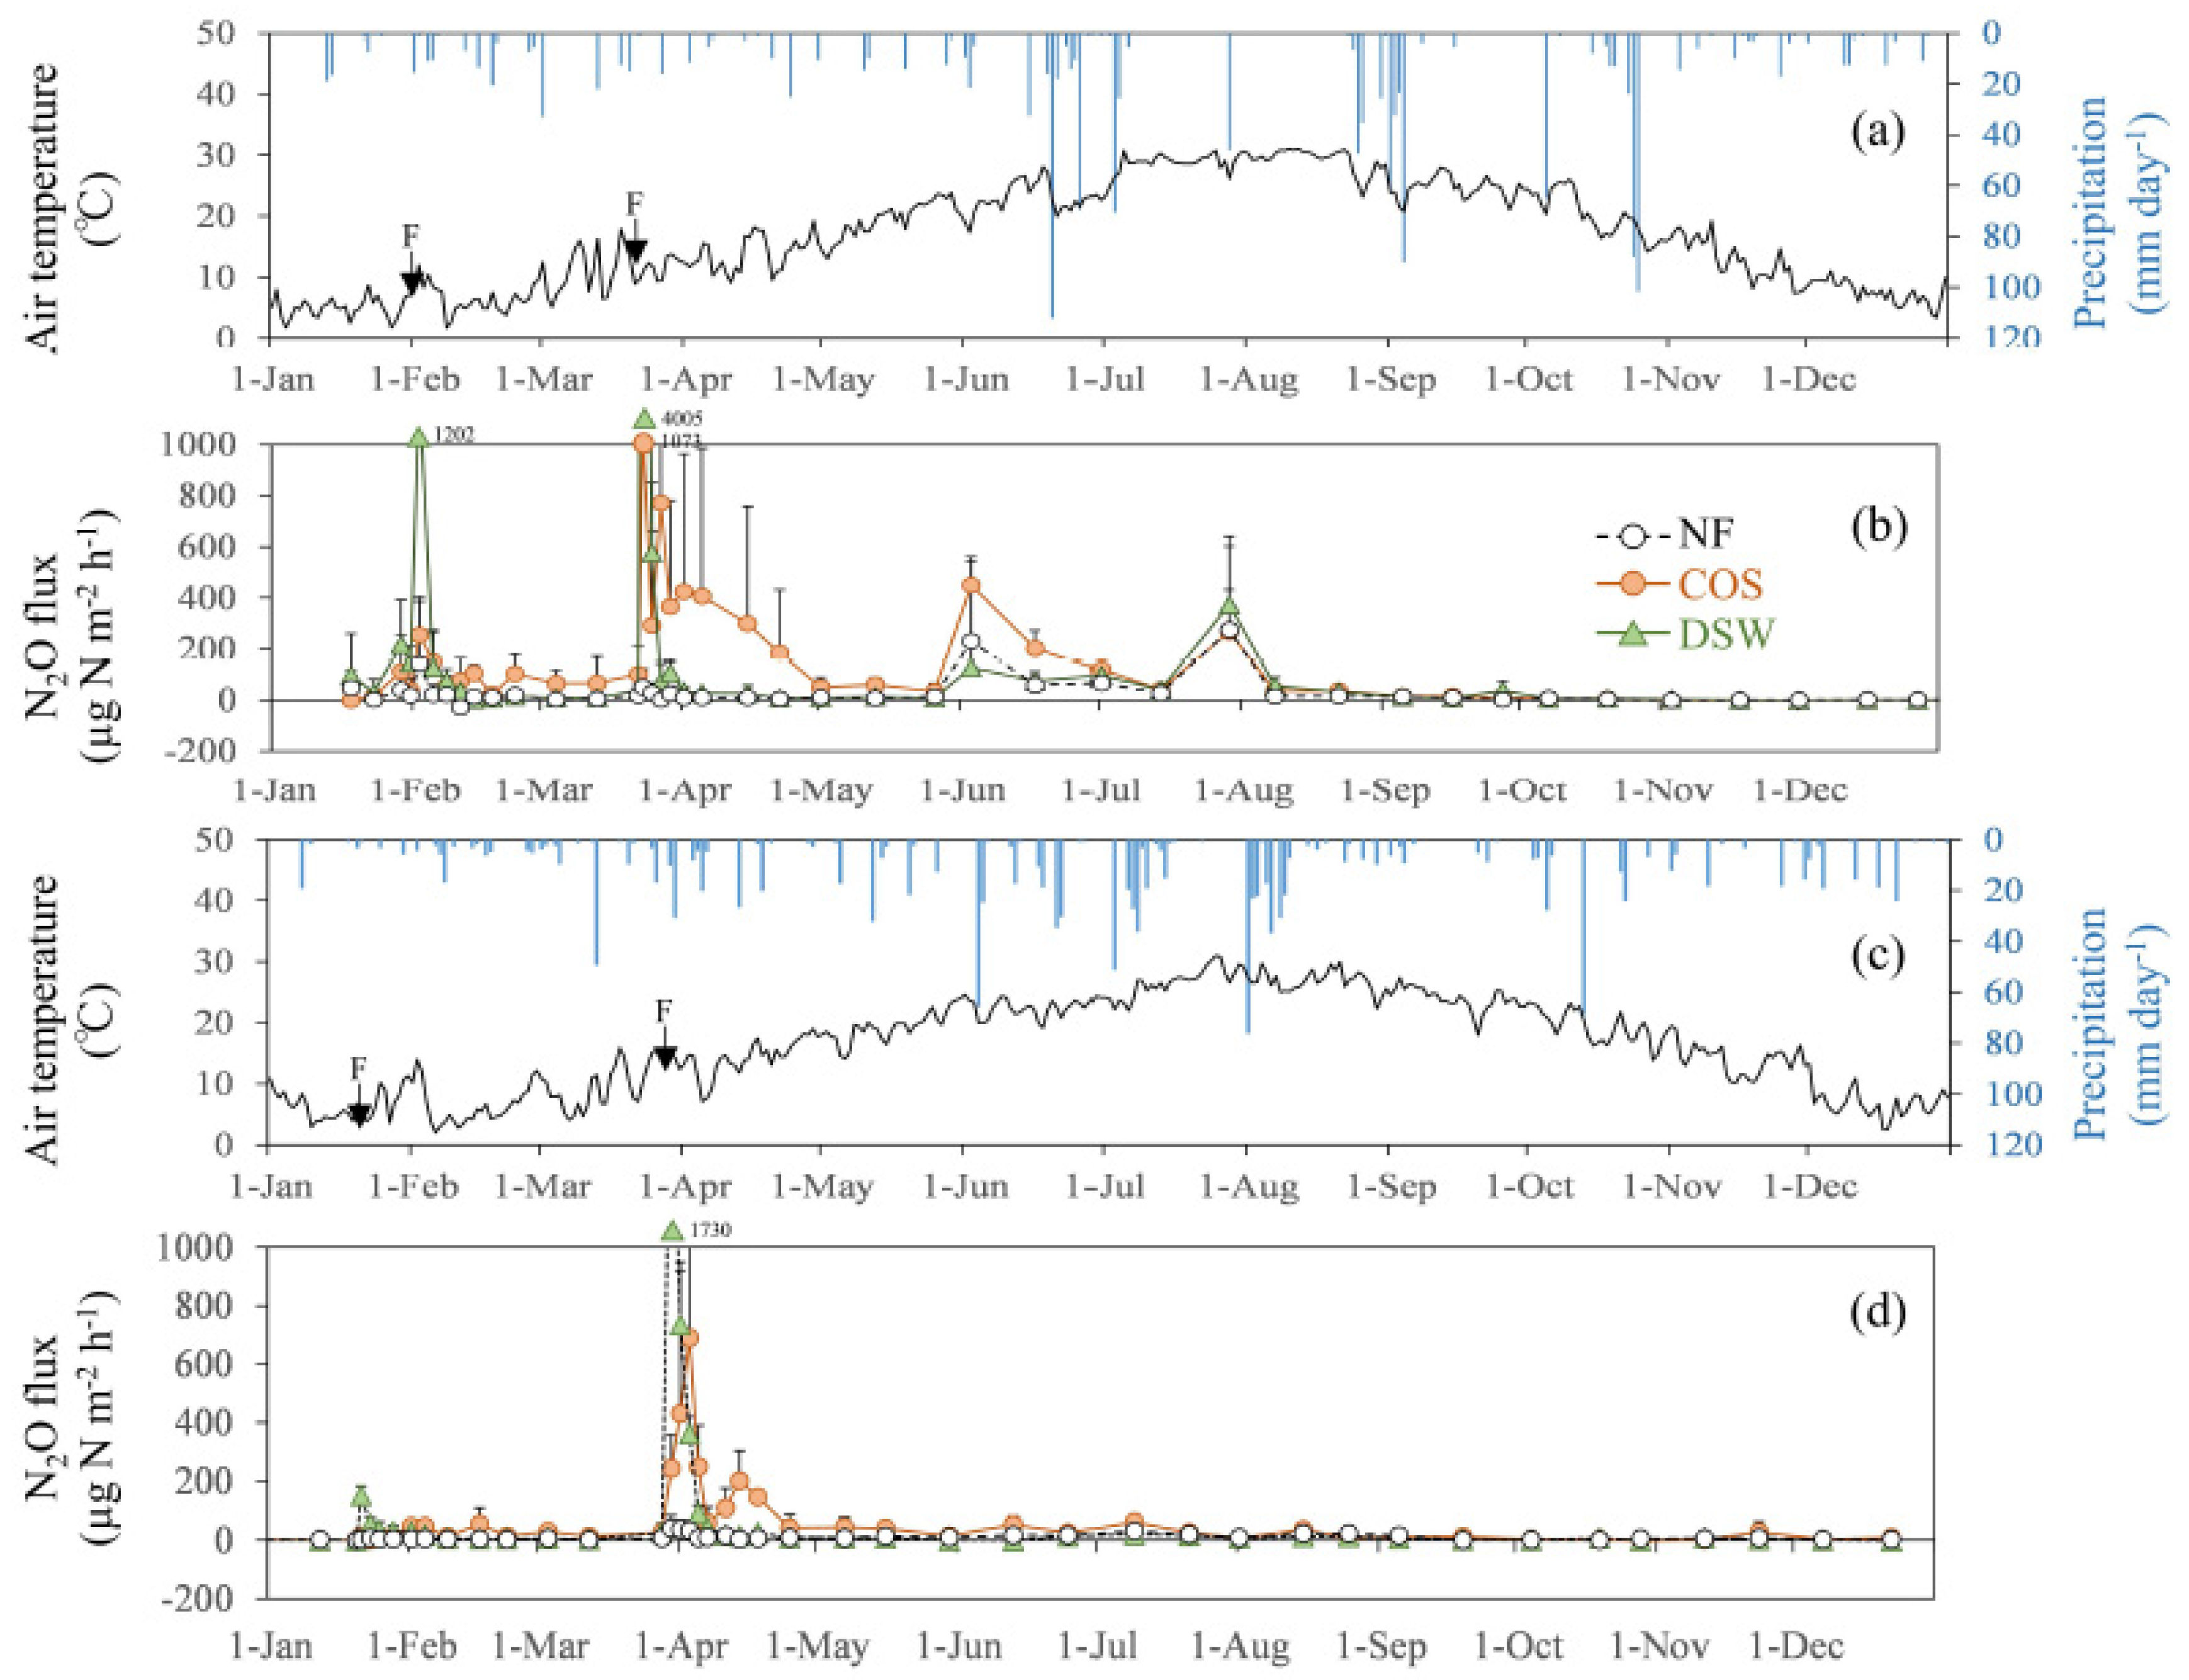
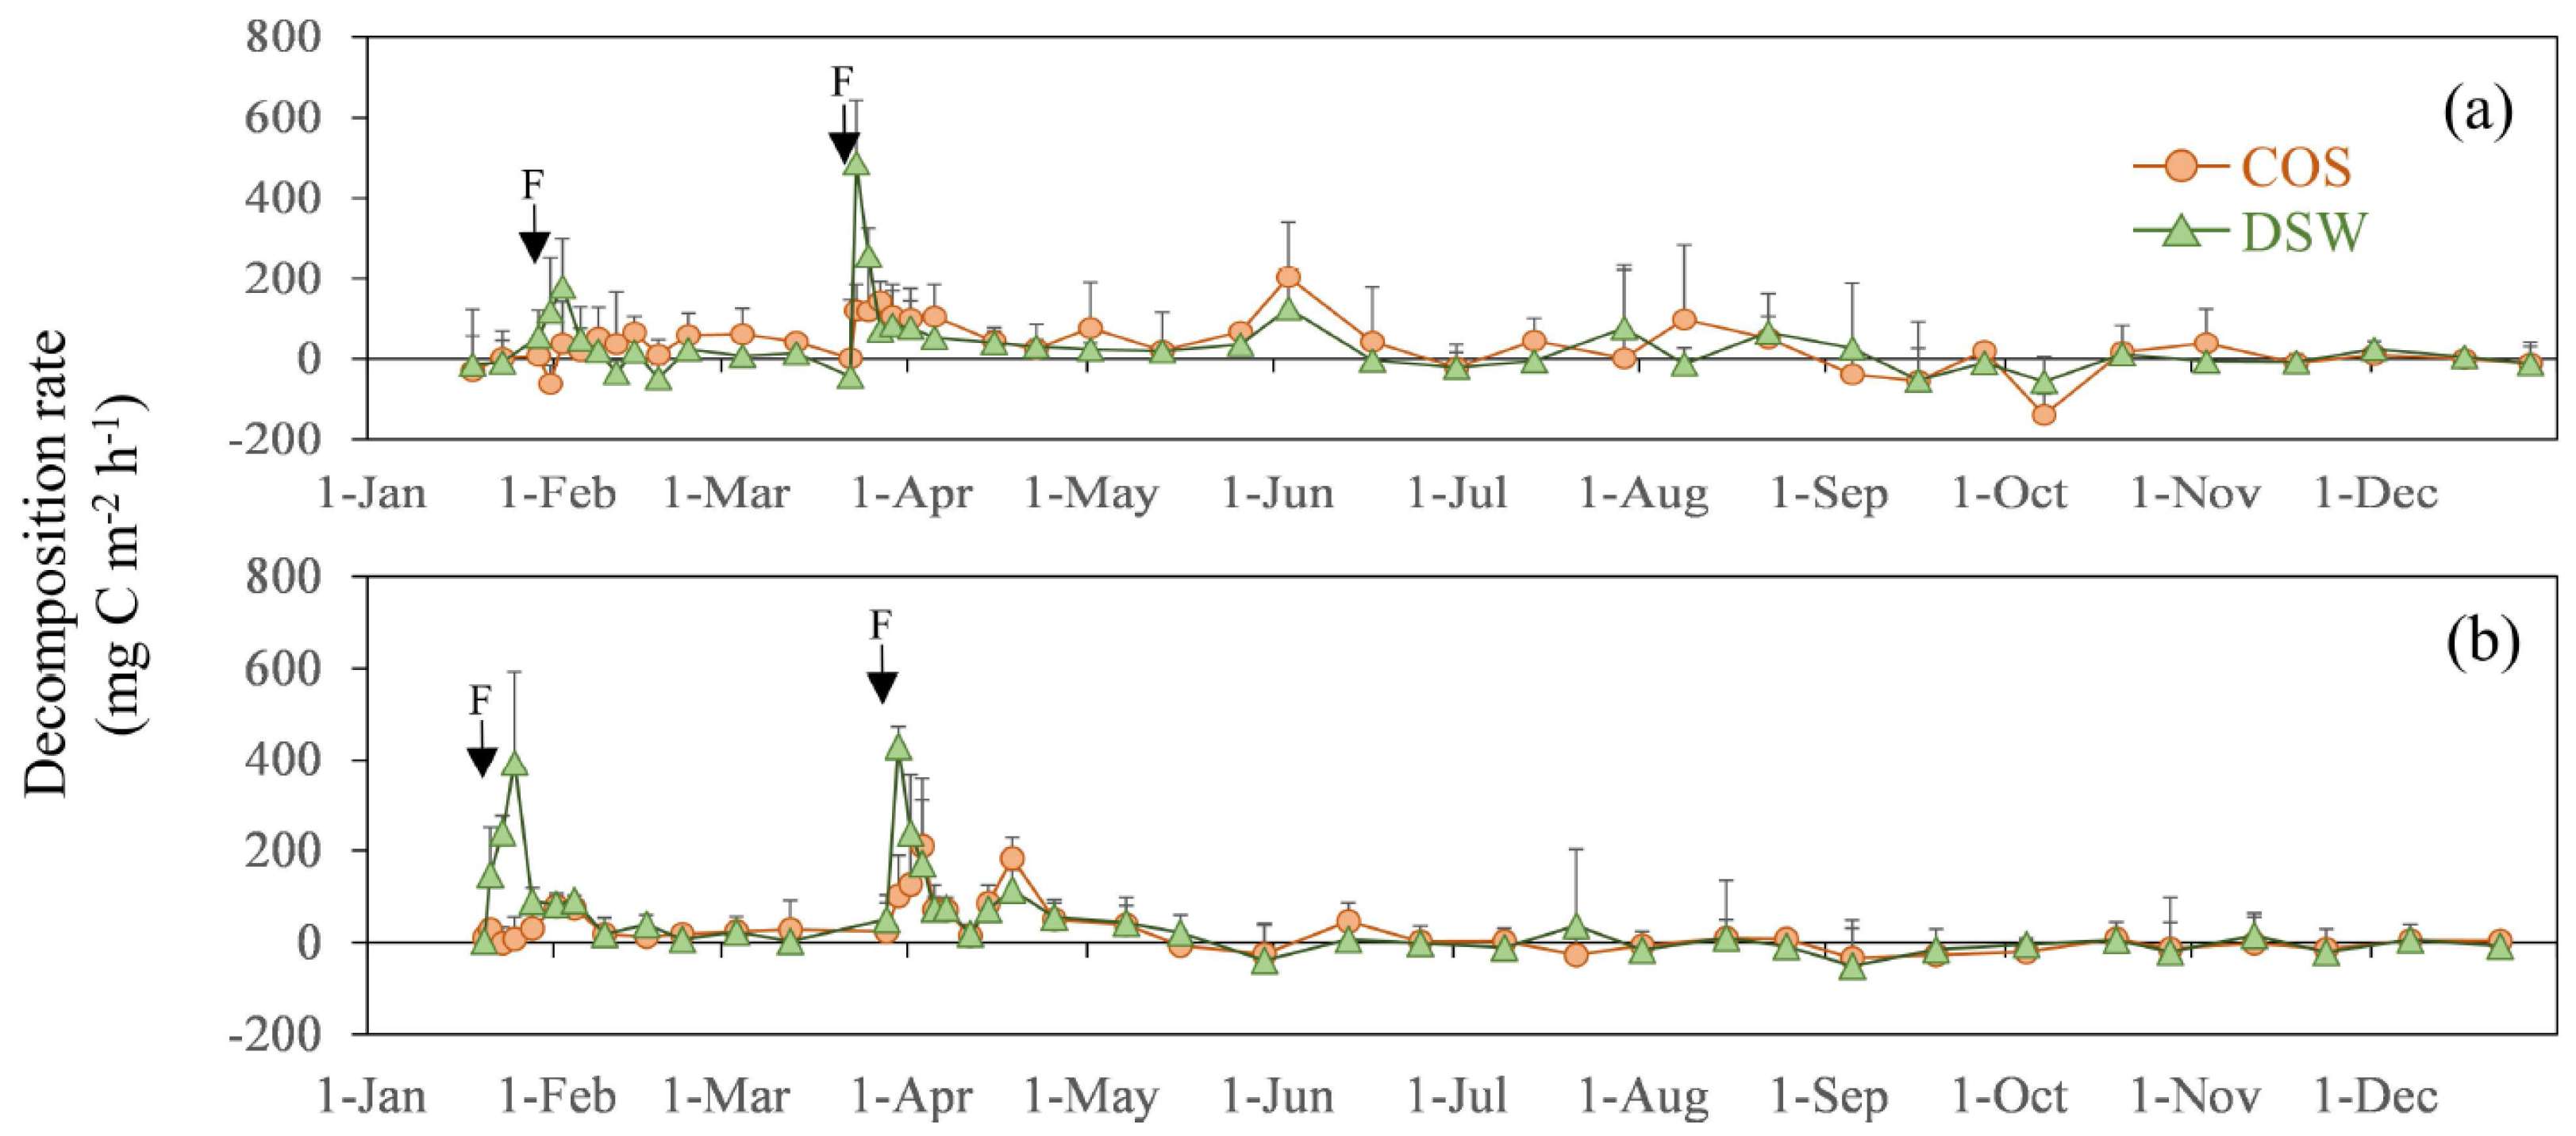
3. Results
4. Discussion
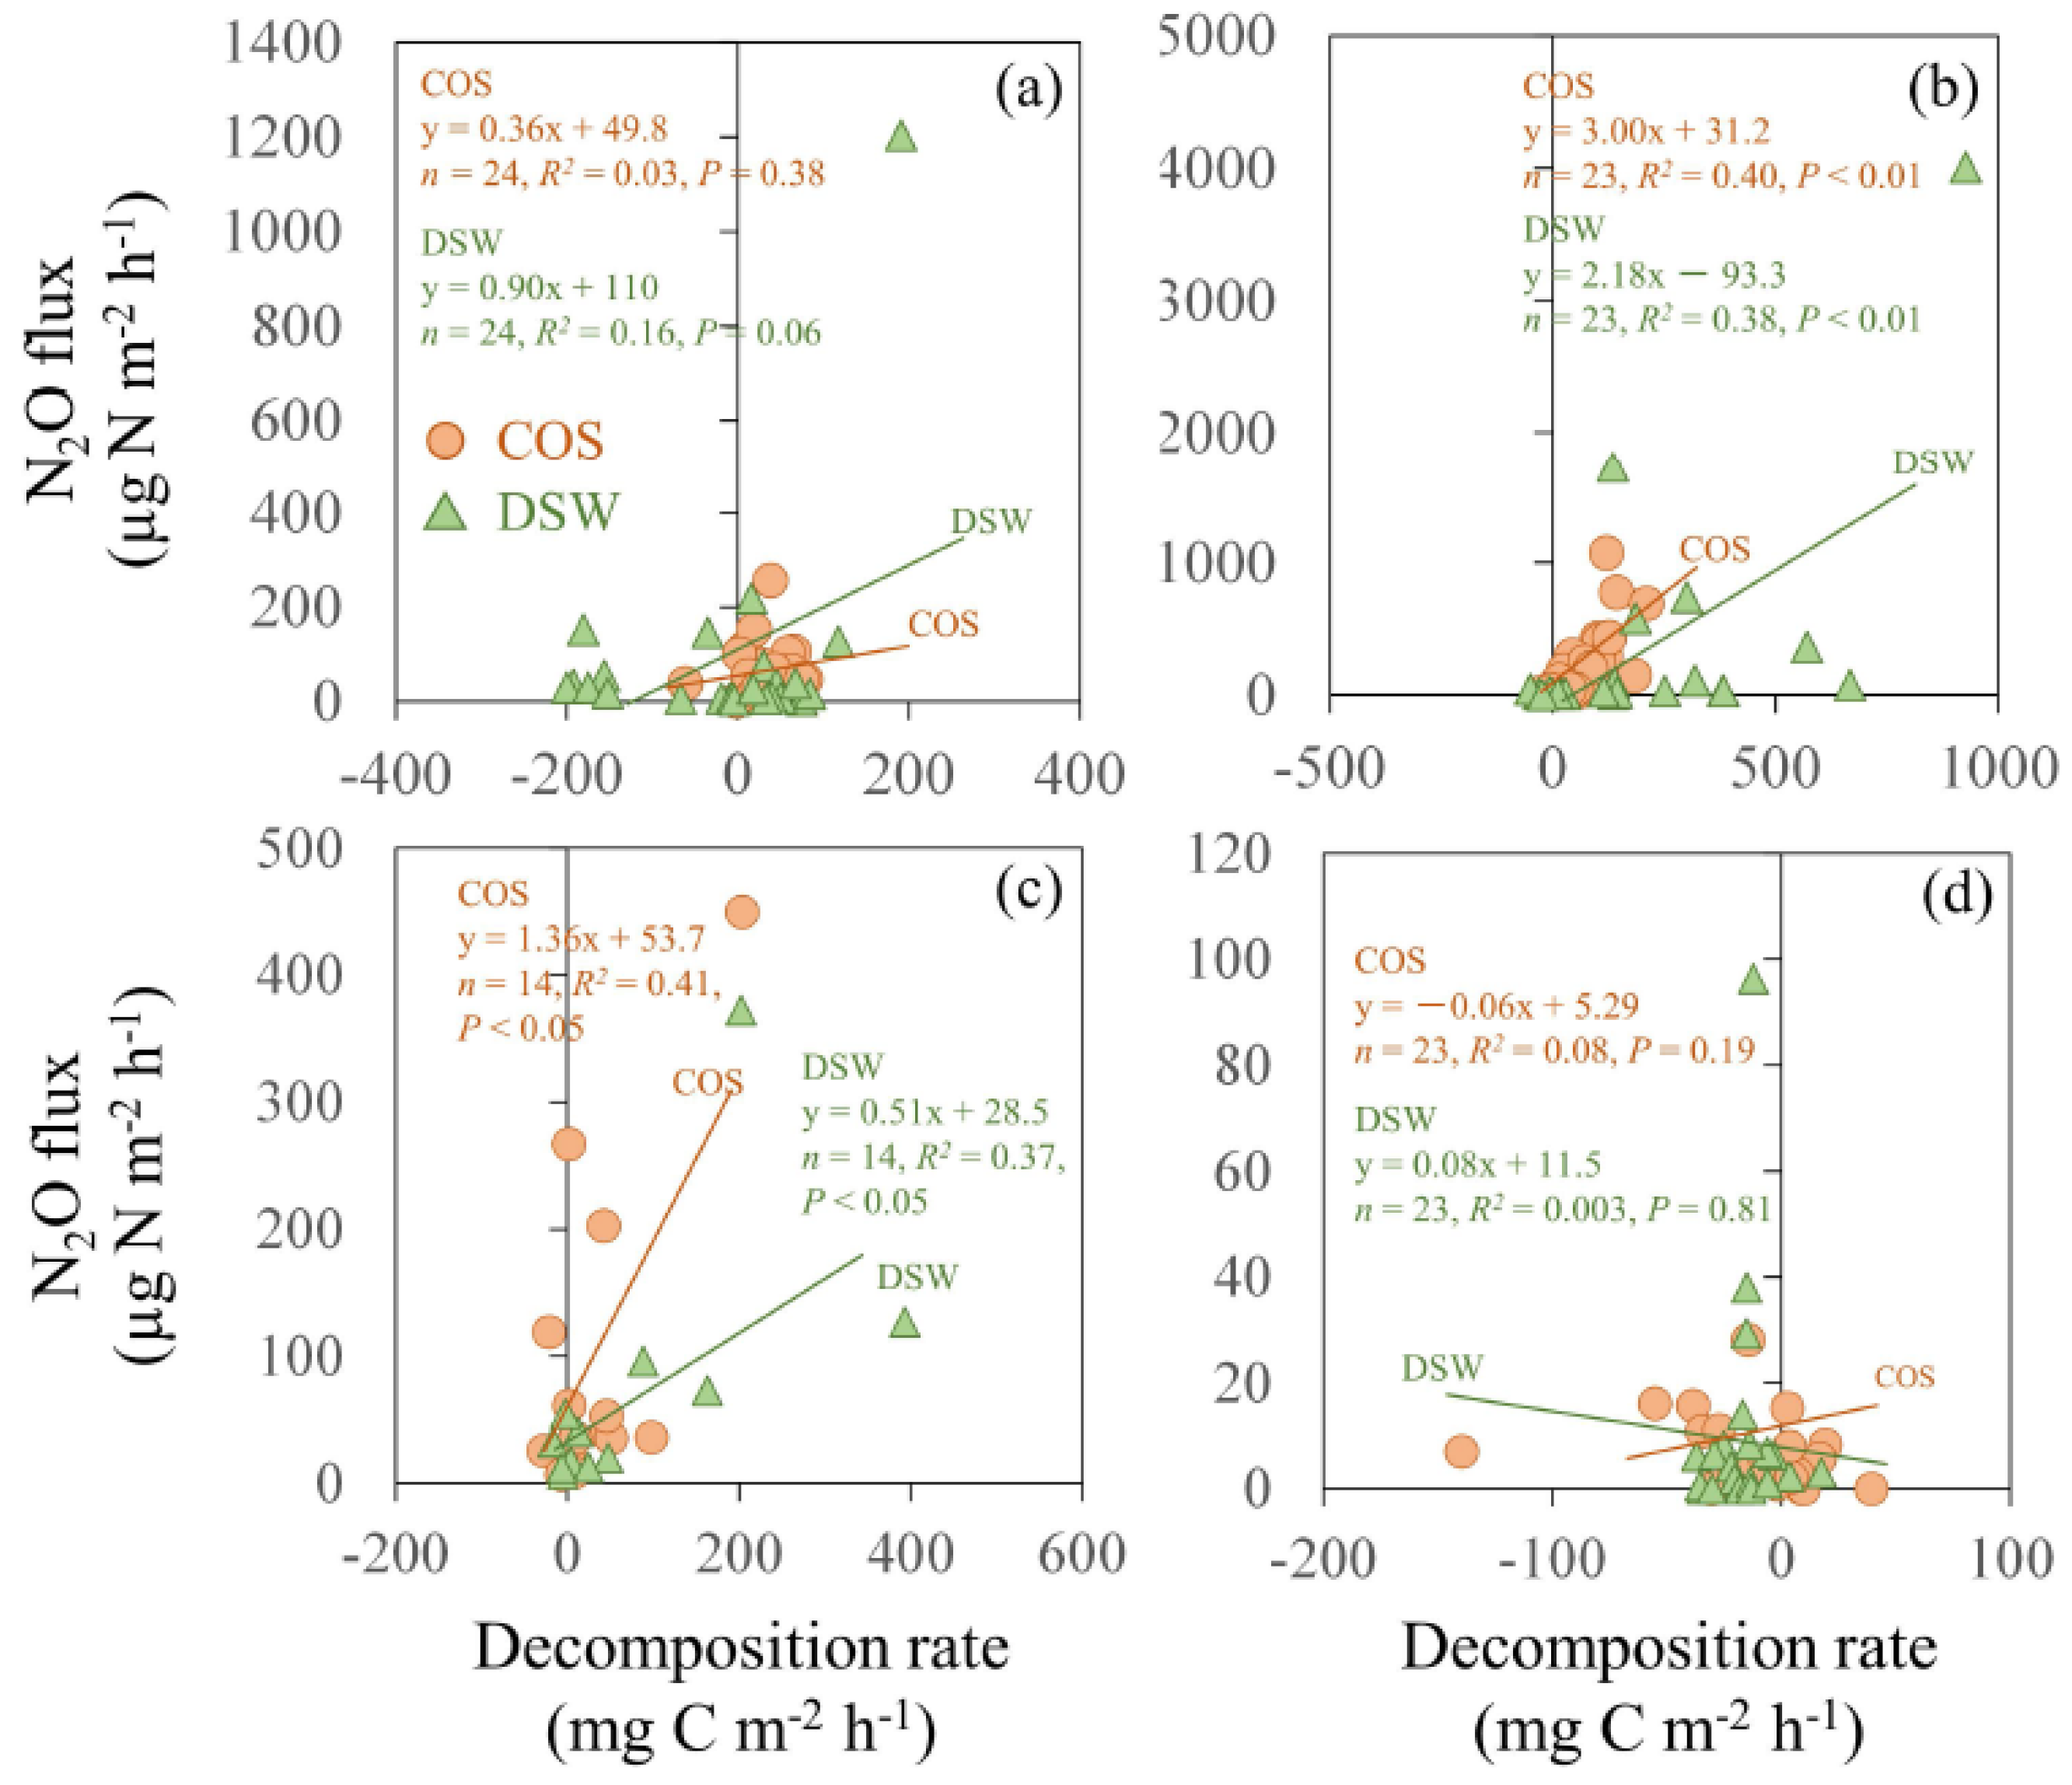
4.1. Controlling Factor of N2O Emissions in Citrus Orchard Fields
4.2. N2O Emissions from COS and DSW
5. Conclusions
Acknowledgments
Author Contributions
Conflicts of Interest
References
- Intergovernmental Panel on Climate Change (IPCC). Intergovernmental Panel on Climate Change (IPCC). The physical science basis: Anthropogenic and natural radiative forcing. In Climate Change 2013; Myhre, G., Shindell, D., Eds.; Cambridge University Press: Cambridge, UK, 2013. [Google Scholar]
- Mosier, A.R. Soil processes and global change. Biol. Fertil. Soils. 1998, 27, 221–229. [Google Scholar] [CrossRef]
- Reay, D.D.; Davidson, E.A.; Smith, K.A.; Smith, P.; Melillo, J.M.; Dentener, F.; Crutzen, P.J. Global agriculture and nitrous oxide emissions. Nat. Clim. Chang. 2012, 2, 410–416. [Google Scholar] [CrossRef]
- Butterbach-Bahl, K.; Baggs, E.M.; Dannenmann, M.; Kiese, R.; Zechmeister-Boltenstem, S. Nitrous oxide emissions from soils: How well do we understand the processes and their controls? Philos. Trans. R. Soc. B 2013. [Google Scholar] [CrossRef] [PubMed]
- Wrange, N.; Velthof, G.L.; Van Beusichem, M.L.; Oenema, O. Role of nitrifier denitrification in the production of nitrous oxide. Soil Biol. Biochem. 2001, 33, 1723–1732. [Google Scholar] [CrossRef]
- Akiyama, H.; Uchida, Y.; Tago, K.; Hoshino, Y.T.; Shimomura, Y.; Wang, Y.; Hayatsu, M. Effect of dicyandiamide and polymer coated urea applications on N2O, NO and CH4 fluxes from Andosol and Fluvisol fields. Soil Sci. Plant Nutr. 2015, 61, 541–551. [Google Scholar] [CrossRef]
- Fernández, F.G.; Terry, R.E.; Coronel, E.G. Nitrous oxide emissions from anhydrous ammonia, urea, and phlymer-coated urea in Illinois cornfields. J. Environ. Qual. 2015, 44, 415–422. [Google Scholar] [CrossRef] [PubMed]
- Li, C.; Frolkng, S.; Butterbach-Bahl, K. Carbon sequestration in arable soils is likely to increase nitrous oxide emissions, offsetting reductions in climate radiative forcing. Clim. Chang. 2005, 72, 321–338. [Google Scholar] [CrossRef]
- Lal, R. Soil carbon sequestration to mitigate climate change. Geoderma 2004, 123, 1–22. [Google Scholar] [CrossRef]
- Okuda, H.; Noda, K.; Sawamoto, T.; Tsuruta, H.; Hirabayashi, T.; Yonemoto, J.Y.; Yagi, K. Emission of N2O and CO2 and uptake of CH4 in soil from a Satsuma mandarin orchard under mulching cultivation in central Japan. J. Jpn. Soc. Hort. Sci. 2007, 76, 279–287. [Google Scholar] [CrossRef]
- Toma, Y.; Oomori, S.; Maruyama, A.; Ueno, H.; Nagata, O. Effect of the number of tillage in fallow season and fertilizer type on greenhouse gas emission from a rice (Oryza sativa L.) paddy field in Ehime, southwestern Japan. Soil Sci. Plant Nutr. 2016, 53, 198–205. [Google Scholar] [CrossRef]
- Oomori, S.; Toma, Y.; Nagta, O.; Ueno, H. Effects of bamboo biochar application on global warming in paddy fields in Ehime prefecture, Southern Japan. Soil Sci. Plant Nutr. 2016, 63, 1–8. [Google Scholar] [CrossRef]
- Toma, Y.; Takakai, F.; Darung, U.; Kuramochi, K.; Limin, S.H.; Dohong, S.; Hatano, R. Nitrous oxide emission derived from soil organic matter decomposition from tropical agricultural peat soil in central Kalimantan, Indonesia. Soil Sci. Plant Nutr. 2011, 57, 436–451. [Google Scholar] [CrossRef]
- Angers, D.G.; Recous, S. Decomposition of wheat straw and rye residues as affected by particle size. Plant Soil 1997, 189, 197–203. [Google Scholar] [CrossRef]
- Toma, Y.; Hatano, R. Effect of crop residue C:N ratio on N2O emissions from Gray Lowland soil in Mikasa, Hokkaido, Japan. Soil Sci. Plant Nutr. 2007, 53, 198–205. [Google Scholar] [CrossRef]
- Pampolino, M.F.; Urushiyama, T.; Hatano, R. Detection of nitrate leaching through bypass flow using pan lysimeter, suction cup, and resin capsule. Soil Sci. Plant Nutr. 2000, 46, 703–711. [Google Scholar] [CrossRef]
- Doane, T.A.; Horwáth, W.R. Spectrophotometric determination of nitrate with single reagent. Anal. Lett. 2003, 36, 2713–2722. [Google Scholar] [CrossRef]
- Kusa, K.; Sawamoto, T.; Hu, R.; Hatano, R. Comparison of N2O and CO2 concentrations and fluxes in the soil profile between Gray Lowland soil and Andisol. Soil Sci. Plant Nutr. 2010, 56, 186–199. [Google Scholar] [CrossRef]
- Toma, Y.; Inoue, K.; Nagata, O.; Ohkubo, N.; Yamauchi, T.; Kouno, T.; Ueno, H. Effects of summer application of distilled silage waste on soil greenhouse gas emissions in Citrus unshiu Marcow. “Aoshima-unsyu” field. Bull. Exp. Farm Fac. Agric. Ehime Univ. 2015, 37, 1–14. [Google Scholar]
- Akiyama, H.; Tsuruta, H. Effect of chemical fertilizer form on N2O, NO and NO2 fluxes from Andisol field. Nutr. Cycles Agroecosys 2002, 63, 219–230. [Google Scholar] [CrossRef]
- Yang, M.; Fang, Y.; Sun, D.; Shi, Y. Efficiency of two nitrification inhibitors (dicyandiamide and 3,4-dimethypyrazole phosphate) on soil nitrogen transformations and plant productivity: A meta-analysis. Sci. Rep. 2016, 6, 22075. [Google Scholar] [CrossRef] [PubMed]
- Akiyama, H.; Yan, X.; Yagi, K. Estimations of emission factors for fertilizer-induced direct N2O emissions from agricultural sols in Japan: Summary of available data. Soil Sci. Plant Nutr. 2006, 52, 774–787. [Google Scholar] [CrossRef]
- Koga, N.; Tsuruta, H.; Sawamoto, T.; Nishimura, S.; Yagi, K. N2O emission and CH4 uptake in arable fields managed under conventional and reduced tillage cropping systems in northern Japan. Glob. Biogeochem. Cycles 2004, 18, GB4025. [Google Scholar] [CrossRef]
- Shimizu, M.; Hatano, R.; Arita, T.; Kouda, Y.; Mori, A.; Matsuura, S.; Niimi, M.; Jin, T.; Desyatkin, A.R.; Kawamura, O.; et al. The effect of fertilizer and manure application on CH4 and N2O emissions from managed grasslands in Japan. Soil Sci. Plant Nutr. 2013, 59, 69–86. [Google Scholar] [CrossRef]
- Bouwman, A.F. Direct emission of nitrous oxide from agricultural soils. Nutr. Cycles Agroecosys 1996, 46, 53–70. [Google Scholar] [CrossRef]


| Depth | Bulk Density | Soil Texture | Total Carbon | Total Nitrogen | C:N Ratio | CEC § | ||
|---|---|---|---|---|---|---|---|---|
| Sand | Silt | Clay | ||||||
| (cm) | (g·cm−3) | (%) | (g·kg−1) | (cmolc·kg−1) | ||||
| 0–7 | 1.34 | 57.3 | 12.6 | 30.1 | 22.2 | 2.71 | 8.23 | 11.8 |
| 7–25 | 1.41 | 47.9 | 15.7 | 36.4 | 8.73 | 1.15 | 7.60 | 11.1 |
| 25–62 | 1.42 | 42.5 | 16.8 | 40.8 | 9.07 | 1.09 | 8.30 | 11.7 |
| 62–71 | 1.41 | 38.6 | 17.4 | 44.1 | 10.8 | 1.35 | 7.97 | 12.9 |
| 71–100 | 1.50 | 40.5 | 15.3 | 44.2 | 3.29 | 0.48 | 6.96 | 9.74 |
| Year | ||
|---|---|---|
| 2013 | 2014 | |
| Water content (%) | 69.4 | 64.4 |
| Total carbon (g C L−1) | 149 | 146 |
| Total nitrogen (g N L−1) | 17.3 | 20.2 |
| C:N ratio | 8.62 | 7.21 |
| Ammonium content (g N L−1) | 0.13 | 2.44 |
| Nitrate content (g N L−1) | 12.9 | 18.4 |
| Total phosphorus (g P L−1) | 0.81 | 1.40 |
| Total potassium (g K L−1) | 18.6 | 20.1 |
| Total calcium (g Ca L−1) | 20.4 | 17.8 |
| Total sodium (g Na L−1) | 0.52 | 6.9 |
| Year | Treatment | Soil N2O Emission (kg N ha−1·period−1) | EF (%) | ||||
|---|---|---|---|---|---|---|---|
| F1 | F2 | S | Other | Annual | |||
| 2013 | COS | 1.17 ± 0.78 | 3.49 ± 4.49 | 3.39 ± 0.93 | 0.23 ± 0.02 | 8.28 ± 6.01 | 2.95 ± 1.62 |
| DSW | 1.31 ± 1.15 | 2.04 ± 0.93 | 2.37 ± 1.03 | 0.35 ± 0.14 | 6.07 ± 3.09 | 1.80 ± 2.42 | |
| NF | 0.23 ± 0.47 | 0.18 ± 0.16 | 2.02 ± 2.22 | 0.18 ± 0.15 | 2.61 ± 2.99 | nc | |
| 2014 | COS | 0.39 ± 0.18 | 1.62 ± 1.01 | 0.66 ± 0.19 | 0.21 ± 0.12 | 2.89 ± 1.36 | 1.09 ± 0.80 |
| DSW | 0.27 ± 0.03 | 1.56 ± 0.27 | 0.23 ± 0.13 | 0.11 ± 0.09 | 2.16 ± 0.46 | 0.56 ± 0.22 | |
| NF | 0.07 ± 0.06 | 0.18 ± 0.12 | 0.39 ± 0.12 | 0.41 ± 0.47 | 0.78 ± 0.32 | nc | |
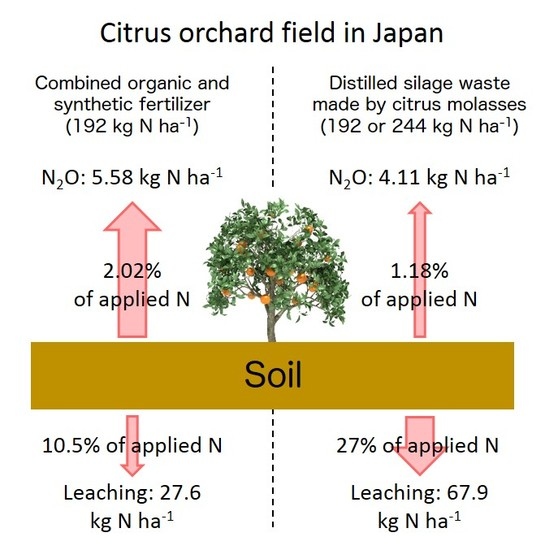
| Average | COS | 0.78 ± 0.66 | 2.56 ± 3.09 | 2.03 ± 1.61 | 0.22 ± 0.08 | 5.58 ± 4.89 | 2.02 ± 1.53 |
| DSW | 0.79 ± 0.93 | 1.80 ± 0.67 | 1.30 ± 1.34 | 0.23 ± 0.17 | 4.11 ± 2.91 | 1.18 ± 1.68 | |
| NF | 0.15 ± 0.31 | 0.18 ± 0.13 | 1.20 ± 1.67 | 0.29 ± 0.34 | 1.70 ± 2.15 | nc | |
| Treatment | ns | ns | ns | ns | ns | ns | |
| Year | p < 0.05 | ns | p < 0.01 | ns | p < 0.05 | ns | |
| Treatment × Year | ns | ns | ns | ns | ns | ns | |
| Year | Mineral N Leaching | N Reaching Rate | |||
|---|---|---|---|---|---|
| (kg N ha−1) | (%) | ||||
| NF | COS | DSW | COS | DSW | |
| 2013 | 7.65 (95.7) | 20.7 (96.9) | 47.2 (98.7) | 6.87 | 20.6 |
| 2014 | 7.25 (95.6) | 34.5 (90.2) | 88.7 (99.0) | 14.2 | 33.4 |
| Average | 7.45 (95.7) | 27.6 (93.6) | 67.9 (98.8) | 10.5 | 27.0 |
| Season | Treatment | n | Factor 1 | Factor 2 | Factor 3 | Constant | p | ||||||
|---|---|---|---|---|---|---|---|---|---|---|---|---|---|
| PRC | RPRC | PRC | RPRC | PRC | RPRC | ||||||||
| F1 | COS | 24 | NS | ||||||||||
| DSW | 24 | NH4+ | 6.70 | 0.57 | −1.06 | <0.01 | |||||||
| NF | 24 | NS | |||||||||||
| F2 | COS | 23 | NH4+ | 4.09 | 0.68 | 78.0 | <0.001 | ||||||
| DSW | 23 | NO3− | 12.2 | 0.56 | −516 | <0.01 | |||||||
| NF | 23 | NS | |||||||||||
| S | COS | 14 | NO3− | 6.21 | 0.76 | ST | −21.5 | 0.47 | 470 | <0.001 | |||
| DSW | 14 | NO3− | 4.17 | 0.76 | −64.0 | <0.01 | |||||||
| NF | 14 | NO3− | 3.94 | 0.55 | WFPS | 2.75 | 0.45 | −134 | <0.05 | ||||
| Other | COS | 23 | NS | ||||||||||
| DSW | 23 | NS | |||||||||||
| NF | 23 | NH4+ | 0.99 | 0.92 | ST | 0.45 | 0.32 | WFPS | 0.29 | 0.29 | −17.7 | <0.001 | |
© 2017 by the authors. Licensee MDPI, Basel, Switzerland. This article is an open access article distributed under the terms and conditions of the Creative Commons Attribution (CC BY) license ( http://creativecommons.org/licenses/by/4.0/).
Share and Cite
Toma, Y.; Higuchi, T.; Nagata, O.; Kato, Y.; Izumiya, T.; Oomori, S.; Ueno, H. Efflux of Soil Nitrous Oxide from Applied Fertilizer Containing Organic Materials in Citrus unshiu Field in Southwestern Japan. Agriculture 2017, 7, 10. https://doi.org/10.3390/agriculture7020010
Toma Y, Higuchi T, Nagata O, Kato Y, Izumiya T, Oomori S, Ueno H. Efflux of Soil Nitrous Oxide from Applied Fertilizer Containing Organic Materials in Citrus unshiu Field in Southwestern Japan. Agriculture. 2017; 7(2):10. https://doi.org/10.3390/agriculture7020010
Chicago/Turabian StyleToma, Yo, Takeshi Higuchi, Osamu Nagata, Yasuhiko Kato, Tooru Izumiya, Shingo Oomori, and Hideto Ueno. 2017. "Efflux of Soil Nitrous Oxide from Applied Fertilizer Containing Organic Materials in Citrus unshiu Field in Southwestern Japan" Agriculture 7, no. 2: 10. https://doi.org/10.3390/agriculture7020010