Article

Suppression of CH4 Emission by Rice Straw Removal  and Application of Bio‐Ethanol Production Residue  in a Paddy Field in Akita, Japan

Faculty of Bioresource Sciences, Akita Prefectural University, 241‐438 Aza Kaidobata‐Nishi, Shimoshinjo Nakano, Akita 010‐0195, Japan
*
Author to whom correspondence should be addressed.
Agriculture 2017, 7(3), 21; https://doi.org/10.3390/agriculture7030021
Submission received: 6 February 2017 / Accepted: 6 March 2017 / Published: 8 March 2017
(This article belongs to the Special Issue C and N Cycling and Greenhouse Gas Emissions in Agroecosystem)

Abstract

:
To elucidate the effects of rice straw removal and rice straw-based bio-ethanol production residue application on rice growth and methane (CH4) emission from a paddy field, a lysimeter experiment with three treatments (application of rice straw after harvesting (the rice-straw plot); removal of rice straw and the application of bio-ethanol production residue (the Et-residue plot); removal of rice straw (the no-application plot)) was conducted over three years. Though the grain yields in the Et-residue and no-application plots tended to be slightly higher than that in the rice-straw plot, there were no significant differences among the plots (530–546 g·m−2). Suppression of CH4 emission by the treatments was found clearly in the early part of the growing season. The total CH4 emissions during the rice-growing season (unit: g·C·m−2·period−1) followed the order of the no-application plot (11.9) < the Et-residue plot (14.6) < the rice-straw plot (25.4), and a significant difference was found between the no-application and rice-straw plots. Consequently, bio-ethanol production from rice straw and a following application of its residue to paddy fields is considered to be a promising technology which can obtain new sustainable energy and suppress CH4 emission without any inhibition on rice growth.

1. Introduction

Following rapid increases in the global energy demand in recent years, biofuel production has increased in response to increasing efforts to achieve independence from fossil fuels and mitigate global warming. For example, global bio-ethanol production increased three-fold over the four years from 2003 to 2007 [1]. Currently, Brazil and the United States are the major producers bio-ethanol, and their primary feedstocks are sugar cane and corn starch, respectively [2]. Bio-ethanol production using those food materials as feedstock has disadvantages, such as competition with the increasing global food demand. Therefore, interest in bio-ethanol production from biomass resources other than food materials, such as crop residues (i.e., agricultural waste), grasses, and woody biomass, have increased recently [3]. In particular, studies examining the production of second-generation bio-ethanol from lignocellulosic biomass have been strongly promoted.
In Japan, rice straw after harvesting is expected to be a potent feedstock for bio-ethanol production. Formerly, most rice straw was harvested with rice grain and carried out from paddy fields to use as bedding straw for livestock. The used rice straw was composted and then returned to rice paddy fields. However, after the 1960s, most rice straw was directly returned to rice paddy fields just after harvesting due to the spread of combine harvesters [4,5]. MAFF [5] estimated that approximately 80% of rice straw across Japan is currently burned or incorporated into the soil without any utilization for livestock. Based on this value, Ueda [6] estimated that the net bio-ethanol production potential of Japan from rice straw amounts to 0.78% of its gasoline consumption.
The removal of rice straw from rice paddy fields could have a substantial influence on the growth of rice plants, the soil, and the environment. In poorly drained paddy fields in cool-temperate regions, rice straw application to fields could cause immediate, extreme soil reduction after puddling, the generation of organic acid, and the immobilization of fertilized nitrogen, resulting in the inhibition of early rice growth. These effects are considered to be especially strong in cool years (e.g., [7,8]). Therefore, the removal of rice straw from those paddy fields is expected to improve the early growth of rice.
Rice straw applied to paddy fields provides a substrate for the production of methane (CH4), a major greenhouse gas derived from agriculture. Rice straw applied to paddy fields significantly contributes to CH4 emissions from paddy fields in the early part of the growing season [9,10]. It has been frequently reported that no application of rice straw to paddy fields (i.e., removal from paddy fields after harvest) significantly reduces CH4 emissions during the rice growing season compared to rice straw application (e.g., [9,10,11,12,13]). In the short term, the removal of rice straw from poorly drained paddy fields in cool-temperate regions is likely to have positive effects, such as increasing rice plant growth and decreasing CH4 emissions. However, repeated removal of rice straw from the field might have negative effects, such as decreased soil fertility and soil carbon storage (e.g., [14,15]).
In the process of bio-ethanol production from rice straw, by-products such as lignin-based residue and vinasse are also produced. Their application to agricultural fields to return nutrients to the soil is considered to be a possible way to use these by-products. Although the effects of vinasse application to agricultural fields on crops, soils, and surrounding environments have been studied (e.g., [16]), reports evaluating the effects of residue application to agricultural fields, especially paddy fields, have been very few. Nishimura et al. [17] conducted incubation and column experiments and reported that the application of bio-ethanol production residue to rice paddy soil increased the productions of carbon dioxide (CO2) and CH4 in the soil and CH4 flux from the soil surface.
To establish sustainable nutrient cycling and management for the conservation of soil fertility in bio-ethanol production from rice straw, its effects on crop growth, soil, and the environment should be evaluated comprehensively. Consequently, the objective of this study was to quantitatively evaluate the effects of rice straw removal and bio-ethanol production residue application on rice growth and CH4 emission from a paddy field on gley lowland soil in a snowy cool-temperate region under field conditions by assuming the use of rice straw as a feedstock for bio-ethanol.

2. Materials and Methods

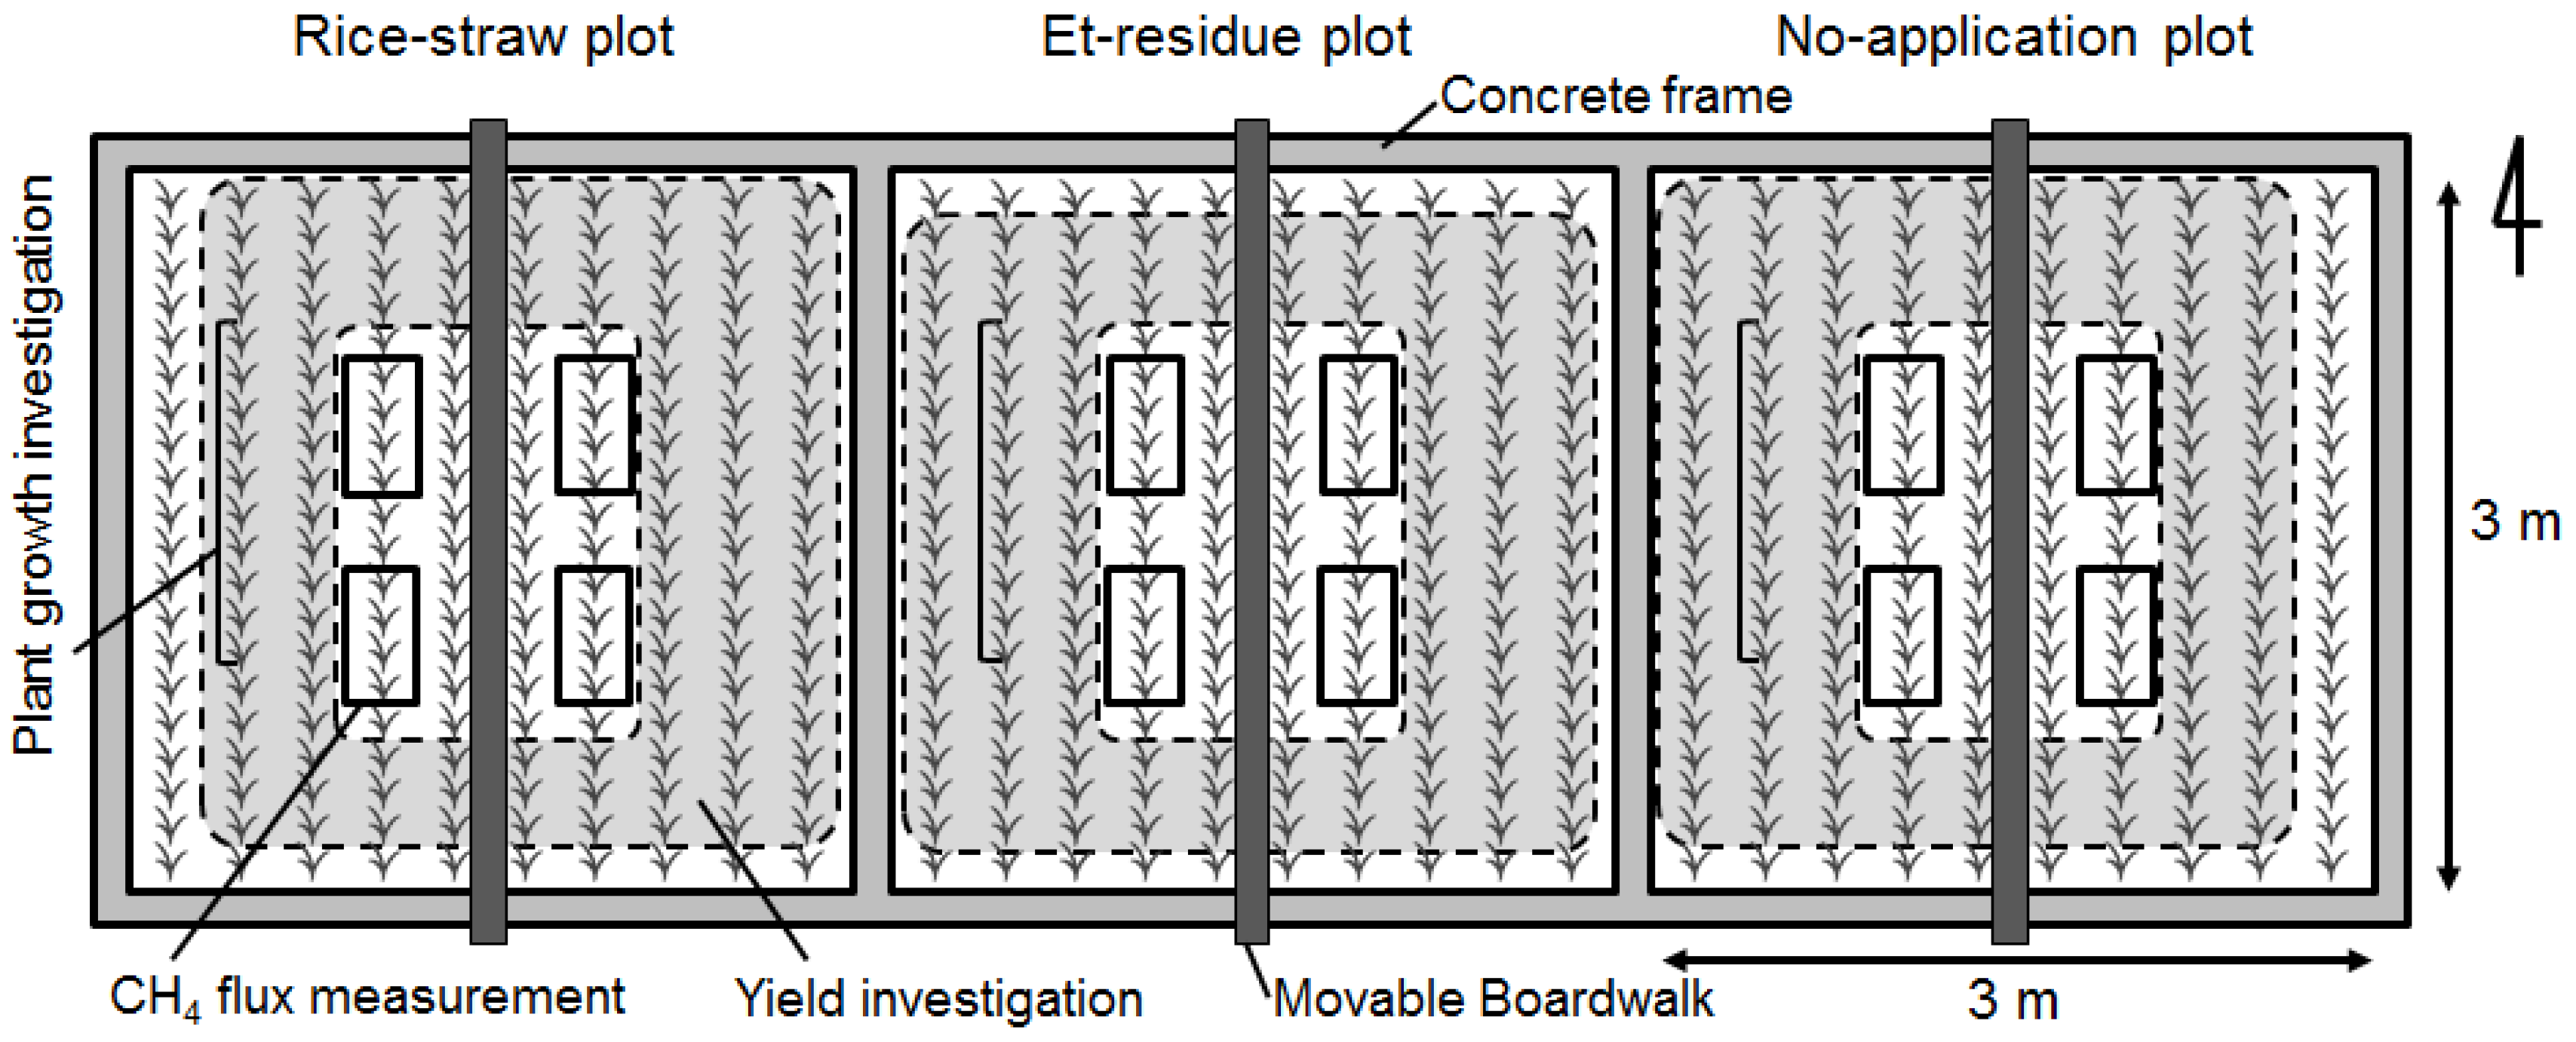
2.1. Experimental Conditions

Lysimeter experiments were conducted at the Field Education and Research Center, Faculty of Bioresource Sciences, Akita Prefectural University, located in Hachirogata polder (40°00′ Ν, 139°57′ Ε). The mean annual temperature and precipitation for this region (measured by the automated meteorological data acquisition system (AMeDAS) of Japan Meteorological Agency located adjacent to the experimental field over a 30-year period, 1981–2010) are 11.0 °C and 1367 mm, respectively. The air temperature data shown in this paper was also obtained from the AMeDAS.
Three lysimeter plots made of concrete (9 m2 in area and 150 cm in depth per plot) were constructed in 2009 (Figure 1). Each plot was filled with gley lowland soil (Eutric Fluvisols [18], 0–60 cm in depth) obtained from the surface layer (0–10 cm) of a continuous rice paddy field in the center, sand (60–90 cm), and crushed stone (90–150 cm). Drainage pipes were buried at the bottom of the crushed stone layer in each plot.
The chemical properties of the studied soil (obtained from 0–10 cm depth after uniform rice cultivation in 2009) were as follows: pH (H2O), 7.9; total nitrogen, 2.3 g·kg−1; total carbon, 23.1 g·kg−1; C/N ratio, 10.0; cation exchange capacity, 28.5 cmolC·kg−1; available phosphorus (Truog-P), 130 mg·P2O5·kg−1. The soil pH in this region is generally high due to a large calcium supply from shells which had occurred in the lake (Hachirogata) before reclamation.
In 2009, uniform cultivation of rice was conducted at the lysimeter plots after its construction. Thereafter, this study was conducted in 2010 to 2013 for four years. Throughout the study, the same lysimeter plot was used for each treatment. Because the timing for rice straw and bio-ethanol production residue application in 2012 (spring in current year) differed from those in three other years (2010, 2011, and 2013, autumn in each previous year), results in 2012 were excluded from the analysis in this study and only cultivation managements were described.
In 2009, rice (Oryza sativa L. cv. “Akitakomachi”) was cultivated in three lysimeter plots according to conventional cultivation management in this region. For details, see the description in Section 2.2. The cultivation managements in 2009 were almost similar with those in 2010 except for application of rice straw and bio-ethanol production residue. In that season, a significant difference in rice growth among the plots was not observed. The rice aboveground biomass (straw and grain) was removed from the field at the harvest stage in 2009.
After the harvest in 2009, three treatments were conducted on the plots (rice-straw plot, Et-residue plot, and no-application plot). In the rice-straw plot, the harvested rice straw was applied to the same plot. In the Et-residue plot, the harvested rice straw was removed, and bio-ethanol production residue was applied (Figure S1). The residue used in this experiment was derived from the process of alkaline treatment of rice straw followed by cellulose and hemi-cellulose saccharization to sugars (i.e., pentose and hexose) by enzymes in the test apparatus for bio-ethanol production by Company A. Currently, this technology is at the experimental stage owing to its high cost of straw collection and enzymes for the cellulose and hemi-cellulose saccharization. In the no-application plot, only the removal of rice straw was performed. The contents of elements and carbon fractions in the rice straw and bio-ethanol production residue and their application rates to each experimental plot are shown in Table 1. Assuming full application by a combine harvester, 600 g·m−2 (510 g·DW·m−2) of rice straw was applied. Similarly, 600 g·m−2 (360 g·DW·m−2) of bio-ethanol production residue was applied by assuming full application of the residue derived from 600 g·m−2 of rice straw. The total nitrogen content and the application rate of bio-ethanol production residue were higher than those of rice straw because the residue contains nitrogen derived from enzymes used in the cellulose and hemi-cellulose saccharization in the process of bio-ethanol production. Nitrogen mineralization rate of the bio-ethanol production residue estimated by an incubation experiment under flooded condition for 0, 20, and 120 days (25 °C) was 7.3%, 19.7%, and 23.1%, respectively (Figure S2). Besides, the carbon contents and application rates of hemi-cellulose and cellulose fraction, main substrate for CH4 production in the bio-ethanol production residue were lower than those in the rice straw owing to the saccharization process.
Similar treatments were also conducted in the same plots after rice harvesting in 2010 and 2012. The treatments were not conducted after rice harvesting in 2011 and was conducted before rice cultivation (middle March) in 2012 alternatively.

2.2. Rice Cultivation

Cultivation managements of the studies followed local conventions. In the harvesting stage (early October) of each previous year (2009 to 2012), all aboveground biomass except for stubble (approximately 5 cm from the soil surface) was removed from the plots. In early November, 600 g·m−2 of rice straw cut into 10-cm lengths by assuming combine harvesting and bio-ethanol production residue was scattered on the soil surface of the rice straw and Et-residue plots, respectively, except for 2011 (as described above, those were scattered middle march of the next year (2012) alternatively). In late April of the next year, all the plots were plowed to a depth of 15 cm using a small rotary tiller, and the rice straw and residue was incorporated into the soil. Because the incorporation of rice straw in autumn just after application (scattered by combine harvesting) is difficult due to heavy rain at the period followed by deterioration of field condition, incorporation in the next spring is popular in the studied region. To compare the effect on methane emission and plant growth with rice straw, application and incorporation of bio-ethanol production residue was also conducted at the same time with rice straw. In early May of each year, chemical fertilizer was applied as basal dressing to each plot at a rate of 5 g·m−2 for N (as urea), P2O5, and K2O, respectively. Several days later, the fields were flooded and puddled. Approximately 35-day-old rice seedlings (Oryza sativa L. cv. Akitakomachi) were transplanted to the lysimeters by hand, with four seedlings per hill in late May (19 May for 2010 and 2011, 21 May for 2012 and 2013). The hills and rows were 16 and 30 cm apart, respectively, at a density of 20.8 hills·m−2. On 14 July (56 days after transplanting (DAT)) in the first year (2010), 2 g·N·m−2 of urea was top-dressed at each plot. In other years, top-dressing of N fertilizer was not conducted according to judge by growth diagnosis.
Mid-season drainage was conducted during late June to early August according to plant growth and field moisture condition (18 to 28 July in 2010 (60–70 DAT), 18 July to 5 August in 2011 (60–78 DAT), 6 to 13 July in 2012 (46–53 DAT), and 26 June to 3 July in 2013 (36–43 DAT)). In every year, intermittent drainage was carried out after the mid-season drainage. Thereafter, final drainage was carried out in late August or early September (1 September, 5 September, 25 August, and 29 August for 2010, 2011, 2012, and 2013, respectively). Harvest was carried out in late September or early October (1 October, 3 October, 22 September, and 20 September for 2010, 2011, 2012, and 2013, respectively).

2.3. Growth and Yield Investigations of Rice Plants

The number of tillers of the hills was counted six or seven times during the growing period. A continuous set five (in 2010) or ten (in 2011 and 2013) rice hills at each plot were chosen for the investigation. The number of tillers at 84, 86, and 79 DAT corresponds to the number of panicles in 2010, 2011, and 2013, respectively.
At the harvest stage (see Section 2.2; 135, 137 and 122 DAT for 2010, 2011 and 2013, respectively), 120 or 72 rice hills (for 2010 and 2011 or 2013, respectively) were harvested from each plot to investigate the yield. After air-drying for approximately three weeks, threshing, and wind selection, the unhulled rice was hulled and then put through a 1.85-mm sieve to remove any immature kernels. The moisture content of the hulled rice was measured using a rice/wheat grain moisture tester (Riceter m2, KETT Electric Laboratory, Tokyo, Japan), and the weight of the hulled rice (i.e., brown rice yield) was converted to that with 15% moisture content. Using the hulled rice, 1000-kernel weight was also investigated (except for 2011). At the harvesting stage, four moderately-grown rice hills at each plot were also corrected and other yield components (number of spikelets per panicle and percentage of filled spikelets) were investigated (except for 2010).

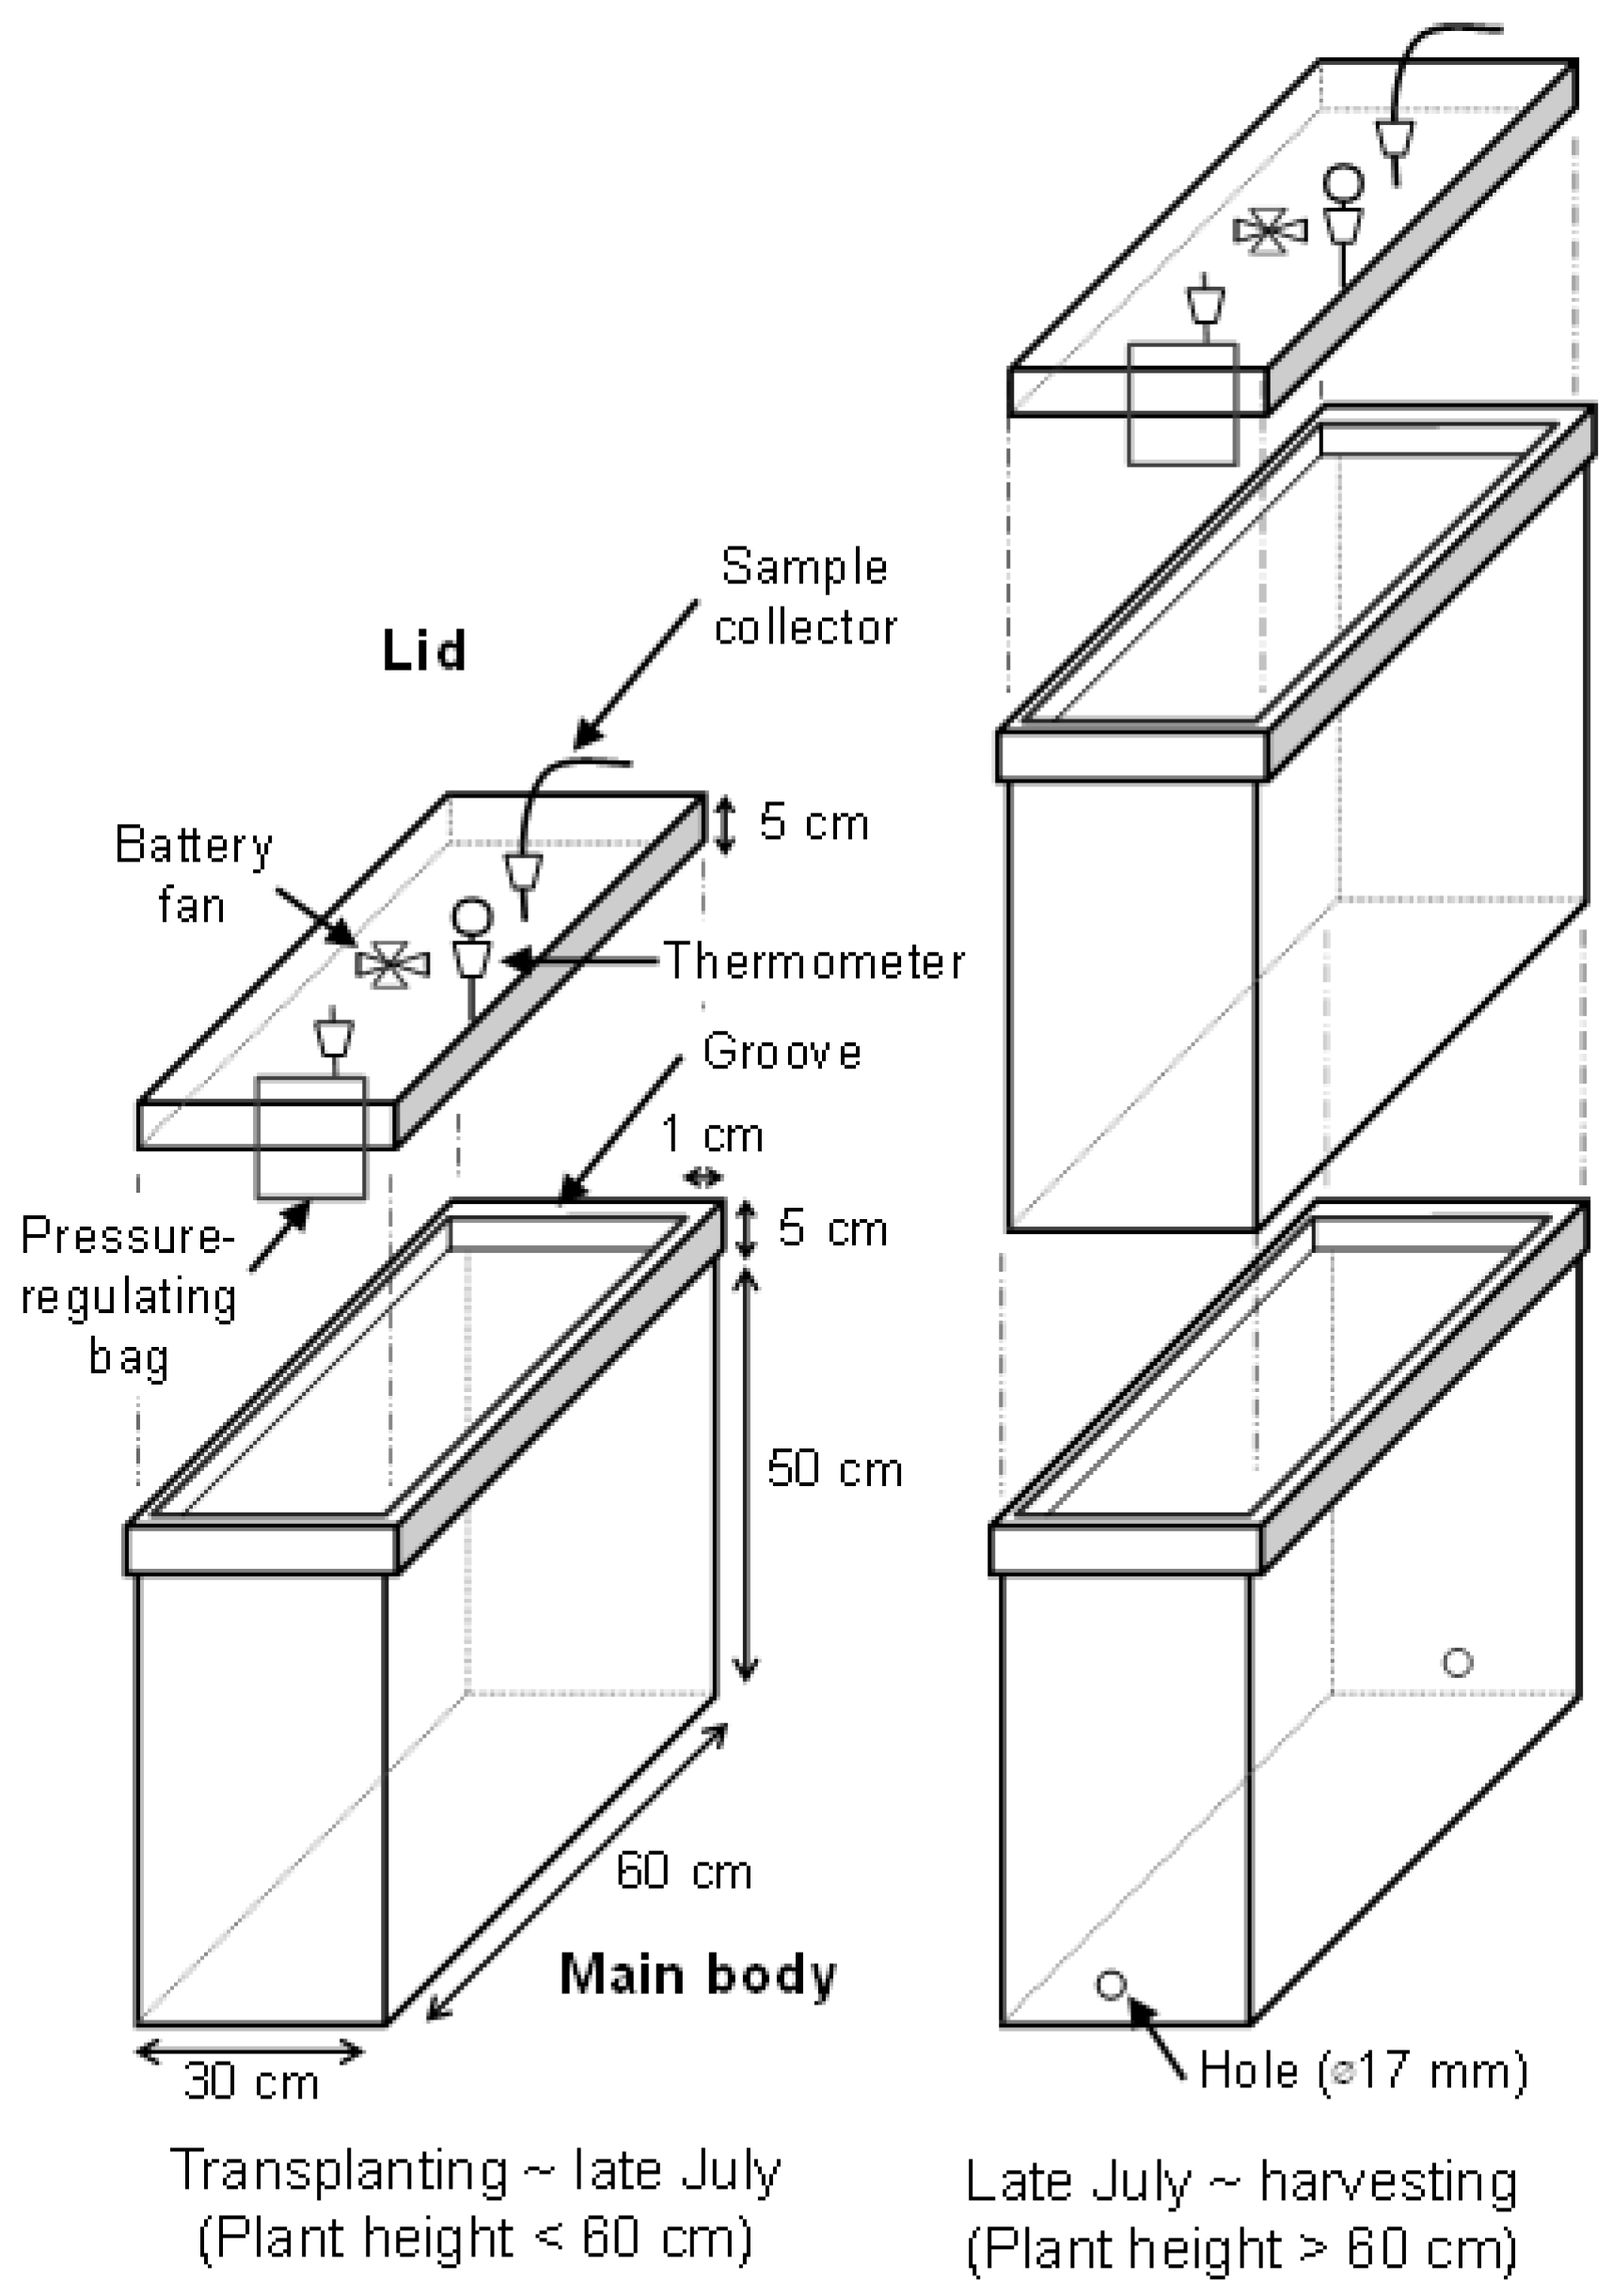
2.4. CH4 Flux Measurement

The CH4 flux was measured once a week using a closed-chamber method (modified Minami and Yagi [22] and Yagi and Minami [13]) during the growing season (20 May to 4 October in 2010, 1 June to 28 September in 2011, and 22 May to 20 September in 2013). The flux measurement was conducted with three replicates in 2010 and four replicates in 2011 and 2013 per plot (Figure 1).
A transparent acryl chamber consisted of a rectangular main body (30 cm × 60 cm × 50 cm, length × width × height), and a detachable lid was used for CH4 flux measurements (Figure 2). The main body had a groove on top for inserting the lid, which was filled with water to seal it during the flux measurement. The lid was equipped with a fan to circulate air inside the chamber, a gas-sampling tube, an inflatable plastic bag to control the air pressure inside the chamber, and a thermometer. During the flux measurements, each chamber covered four hills of rice.
To accommodate rice growth, the chamber height was set to 1.0 m by stacking the two main bodies of the chamber after the middle of July. In 2011 and 2013, the lower main bodies of the chamber were placed in the field throughout the period from the middle of July to the end of the measurement to prevent soil disturbance and injury of the rice plants inside the chamber by repeated of placement and removal of the chamber at each measurement. To ensure water exchange between the inside and outside of the chamber, two holes, 17 mm in diameter, were created at the bottom of both sides of the lower chamber. The holes were closed by silicon rubber stoppers during the flux measurement. No effects of long-term chamber placement on rice plant growth at the measurement points were observed.
Approximately 10 min after placing the chamber at the soil surface of the measurement point, the chamber was sealed by inserting the lid into the groove of the chamber. CH4 flux measurements were started one minute after sealing. At 0, 10, and 20 min after starting measurement, a 20-mL gas sample inside the chamber was taken in a 10-mL evacuated glass vial with a butyl rubber septum using a syringe. The air temperature inside each chamber and the chamber height (from the top of the chamber to the water or soil surface) were measured during each gas sampling to calculate the gas flux.
The soil redox potential (Eh) was measured using platinum-tipped electrodes and a portable Eh meter (PRN-41, Fujiwara Scientific Company Co. Ltd., Tokyo, Japan). After rice transplanting, the electrodes were inserted into the soil at a 5-cm depth in triplicate and kept in place throughout the rice-growing season. Soil Eh measurements were conducted on each day that the gas flux measurement was conducted. To avoid any disturbance during the flux measurements, all operations were performed from a movable boardwalk placed on concrete frame of the lysimeter at each measurement (Figure 1).
The CH4 concentration in the gas sample was analyzed using a gas chromatograph (GC-14B, Shimadzu, Kyoto, Japan) equipped with a flame ionization detector. CH4 flux was calculated by a linear regression. A positive flux indicates a net CH4 emission from the paddy field, and a negative flux indicates a net uptake. To calculate the total CH4 emission during the rice growing period, the daily fluxes were integrated by linear interpolation.

2.5. Statistical Analyses

The differences in rice yield, yield components and total CH4 emission (before or after mid-season drainage and rice growing season) were compared by repeated measures analysis of variance (ANOVA) by assuming year as replicate (n = 3) followed by a Bonferroni test. For all statistical analyses, Excel Statistics 2008 (SSRI, Tokyo, Japan) was used.

3. Results

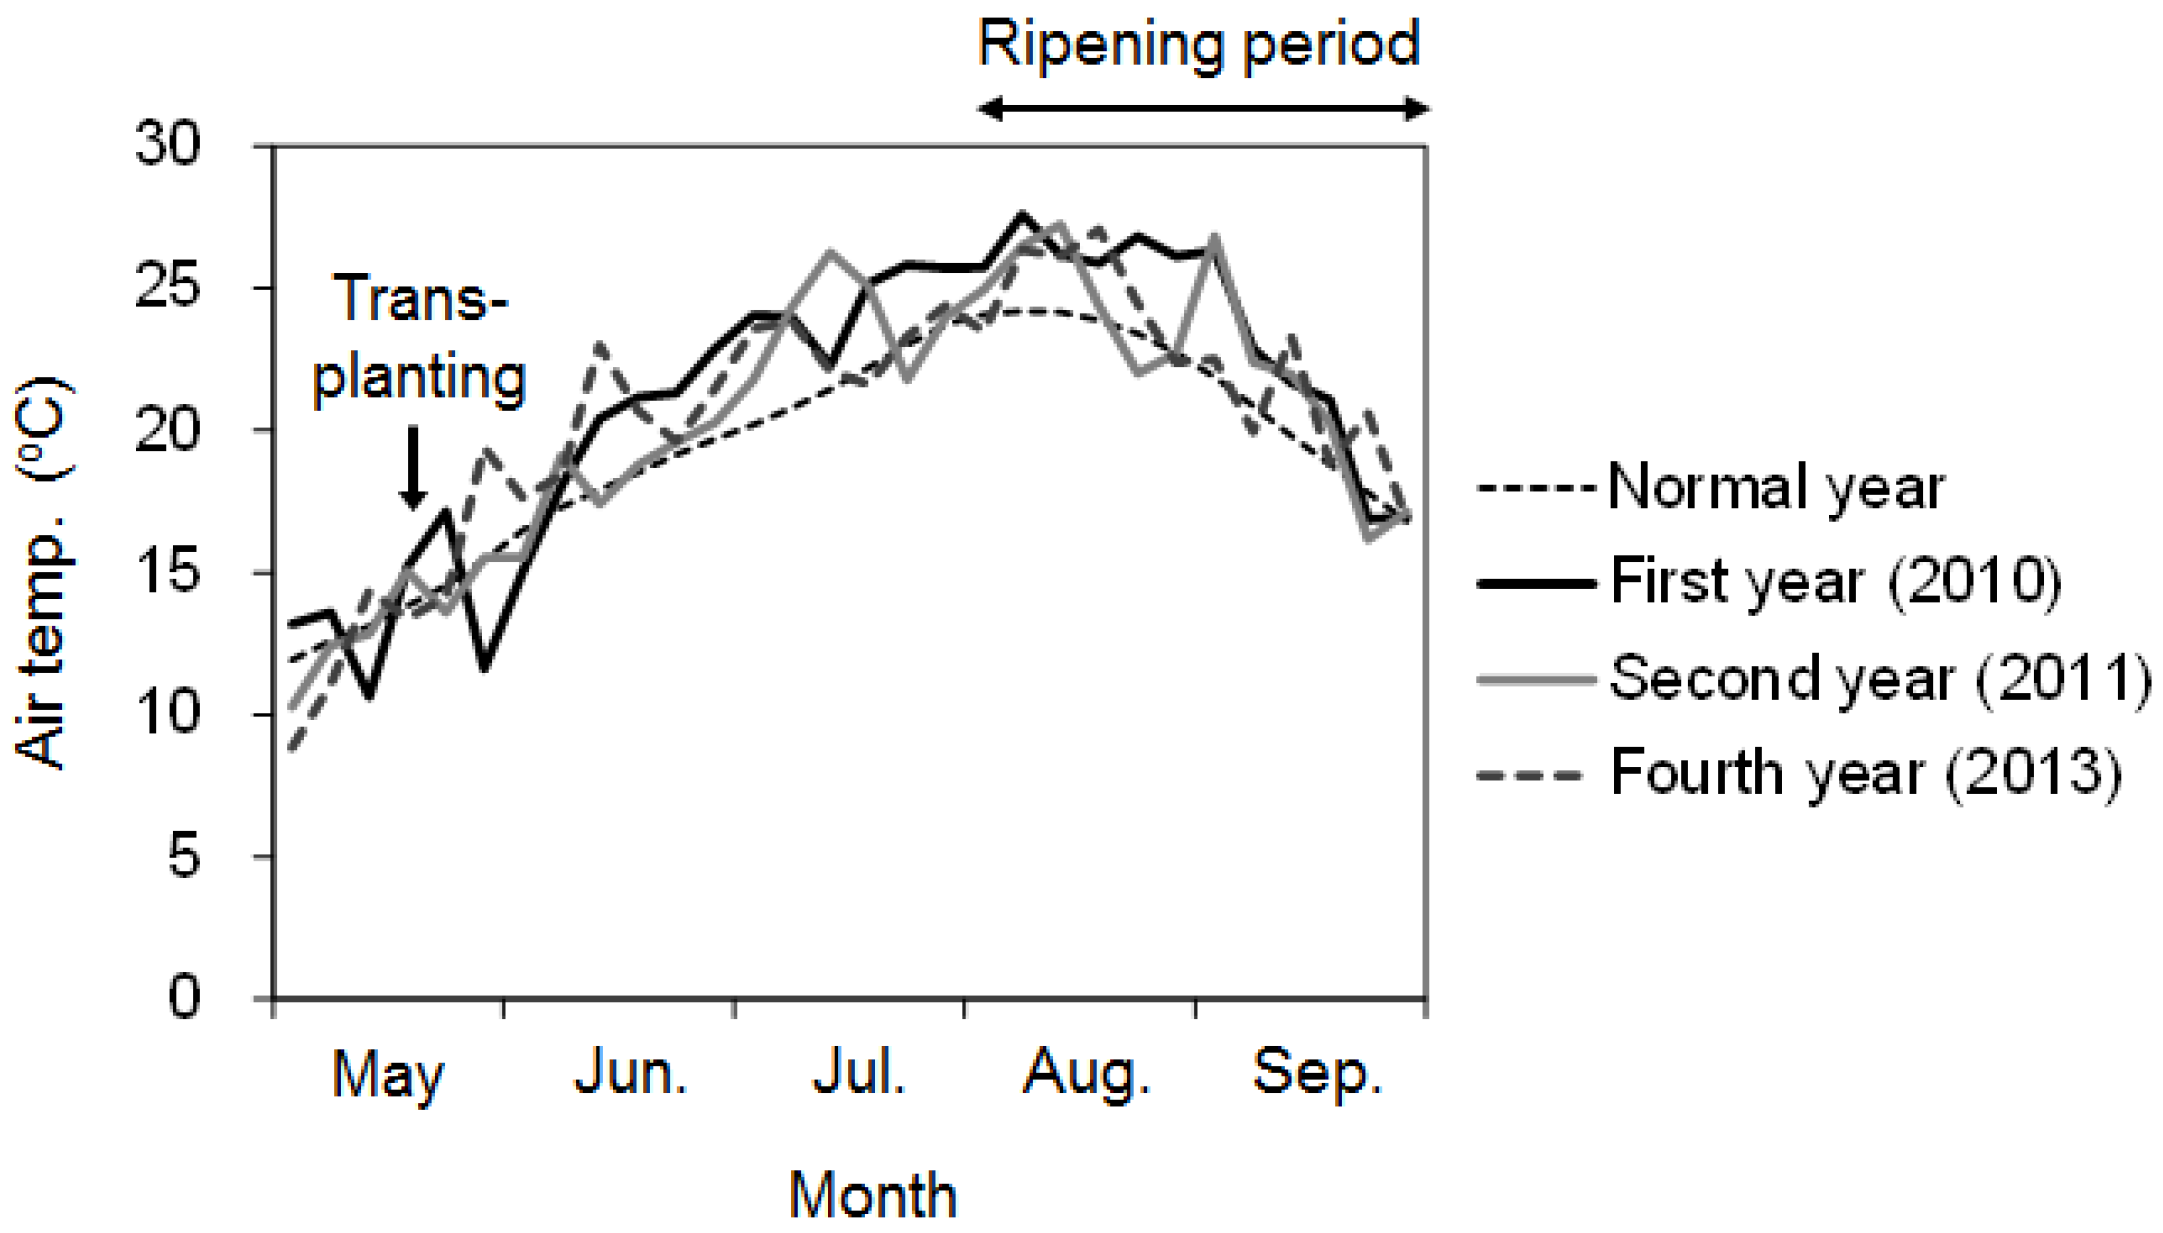
3.1. Air Temperature

The time evolution of average air temperature during the growing period (May–September) is shown in Figure 3. In the first year (2010), the air temperature was lower than that in the normal year (recent 30-year average) from the end of May to the beginning of June. From the middle of June to the end of July, it was 2–3 °C higher than the normal temperature. The mean monthly air temperature in June and July was 1.6 °C and 2.6 °C higher than normal, respectively. The high temperature trend also continued throughout the ripening period, and the mean monthly air temperature in August and September were 2.6 °C and 1.6 °C higher than normal, respectively. In the second year (2011), the air temperature immediately after transplanting was lower than that in the first year, and the air temperature was below 15 °C for several consecutive days. Thereafter, it was also lower than in the first year and similar to the normal value. Although the mean monthly air temperature in June, July, and August was 2.0 °C, 0.9 °C, and 1.3 °C higher than the normal value, respectively, these temperatures were still lower than that in the first year. In the fourth year (2013), the air temperature was 0.9–5.1 °C (2.5 °C in average) higher than that in the normal year from the end of May to the early July. Thereafter, the mean monthly air temperature in July, August, and September was 1.2 °C, 0.9 °C, and 1.0 °C higher than normal value, respectively.

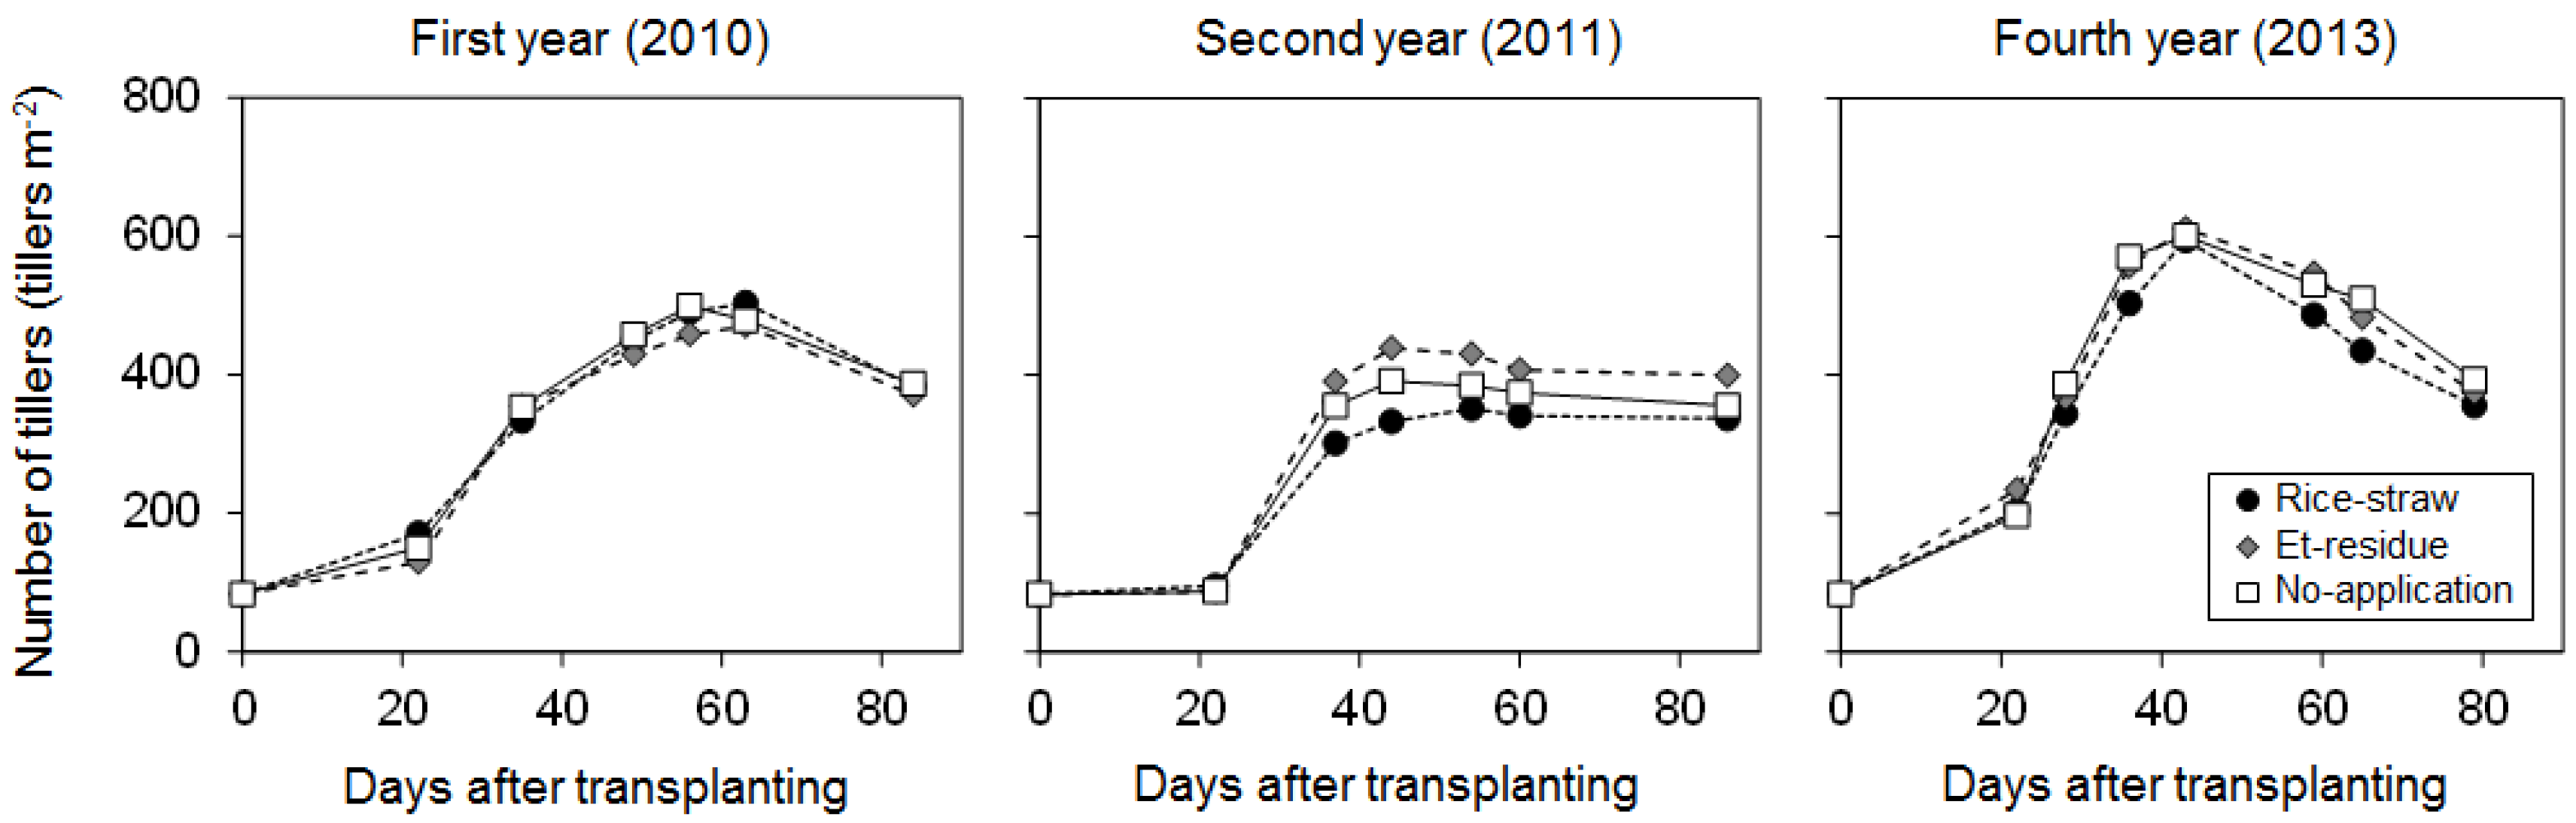
3.2. Number of Tillers and Grain Yield

The time evolution of the number of tillers is shown in Figure 4. At the beginning of growing season (22 DAT), tillering was observed in the first and fourth years, and was rarely observed in the second year due to the low temperature (<15 °C) just after transplanting and following delayed rooting. In all year, the number of tillers increased and peaked at 44–63 DAT. Thereafter, the numbers of tillers decreased at 79–84 DAT. Though the maximum numbers of tillers followed the order of second year < first year < the fourth year, the numbers of panicles did not differ significantly among the year. Consequently, the percentages of productive stems followed the order of the fourth year (61%–65%) < first year (76%–79%) < second year (91%–96%). In the first and fourth years, the number of tillers during the growing period did not differ among the plots. In the second year, the number of tillers during the growing period followed the order of the rice-straw plot < no-application plot < Et-residue plot.
The grain yield and yield components for three years are shown in Table 2. In the first year, though the numbers of panicles were similar among the plots, the grain yield (brown rice yield) followed the order of the rice-straw plot < the Et-residue plot < the no-application plot. In the second year, though the numbers of panicles followed the order of the rice-straw plot < the no-application plot < the Et-residue plot, the grain yields were similar among the plots. The difference in the number of panicles was compensated partly by an increase in the spikelet number per panicle in the order of the Et-residue plot < the no-application plot < the rice-straw plot. In the fourth year, the number of panicles in the no-application plot was the highest among the plots. While, the spikelet number per panicle in the no-application plot was lowest among the plots. As a result, the total number of spikelets and grain yield followed the order of the no-application plot < the rice-straw plot < the Et-residue plot. For three years average, though the number of panicles and grain yield in the plots with removal of rice straw in the previous crop (i.e., the Et-residue and no-application plots) tended to be slightly higher than those in the rice-straw plots, there were no significant differences among the plots.

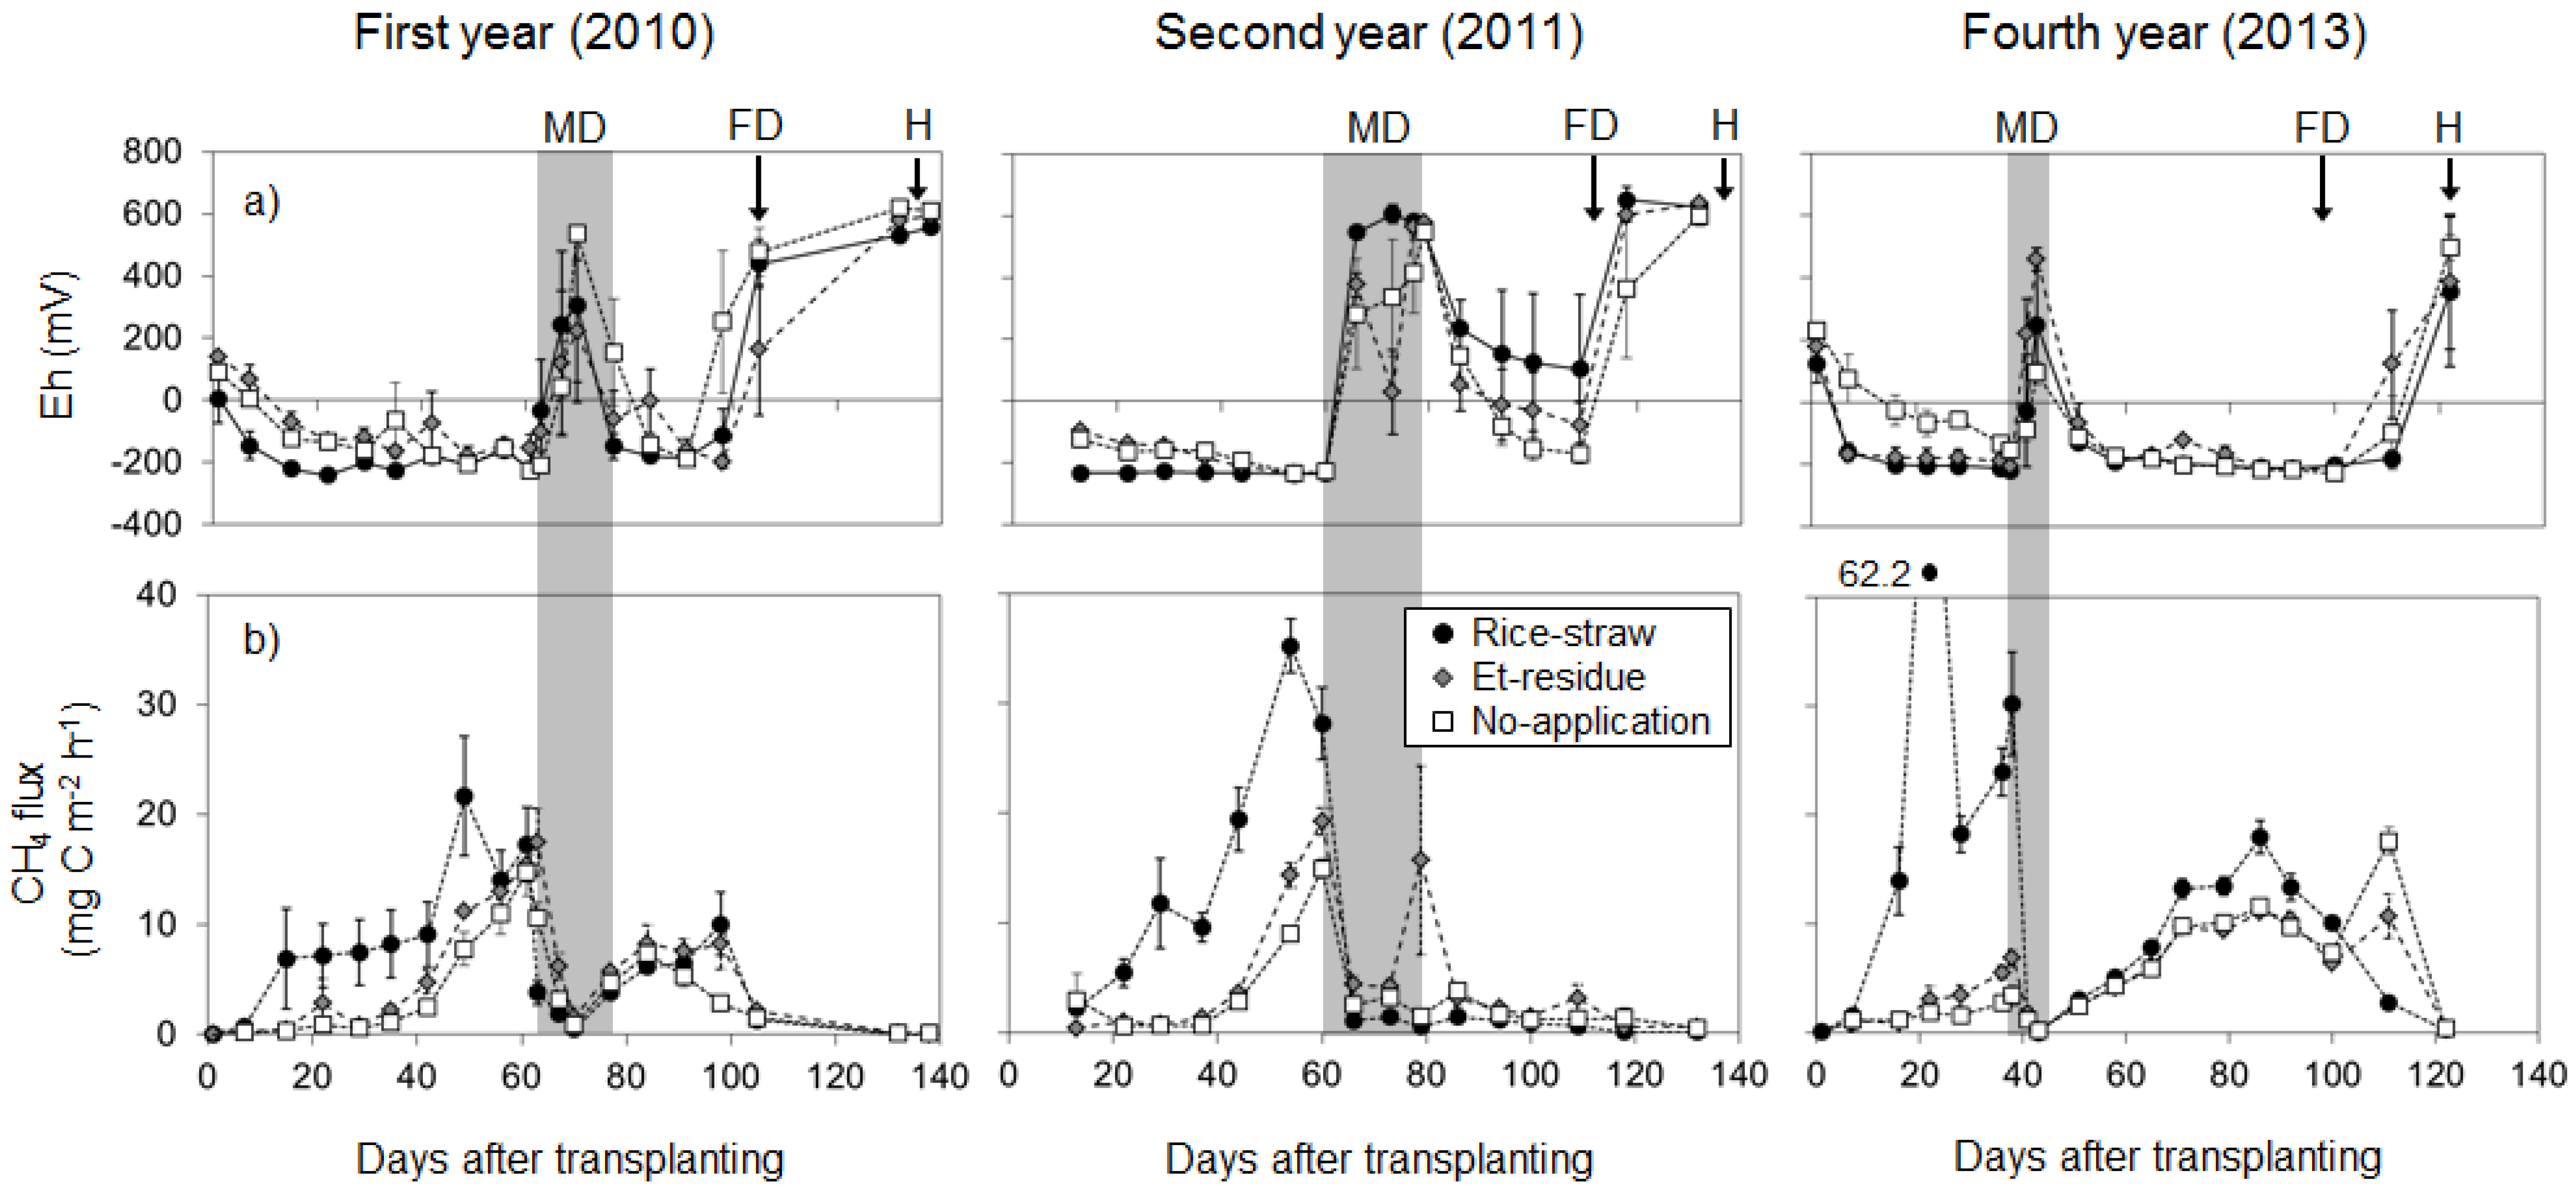
3.3. Soil Eh and CH4 Flux

The time evolution of the soil Eh and CH4 flux is shown in Figure 5. In all years, the soil Eh in the rice-straw plot began to decrease rapidly just after transplanting and then remained stable at approximately −200 mV until the beginning of the mid-season drainage. In contrast, the soil Eh in the Et-residue and no-application plots gradually decreased after transplanting except for the Et-residue plot in the fourth year. The soil Eh in all plots increased to positive values during the mid-season drainage and then immediately decreased to approximately −200 mV after the mid-season drainage finished except for the rice-straw and Et-residue plots in the second year. The soil Eh in all plots increased again after the final drainage.
In all years, the CH4 fluxes in the rice-straw plot began to increase immediately after transplanting and remained higher than those from the other two plots until the beginning of the mid-season drainage. The CH4 fluxes in the Et-residue and no-application plots began to increase at around 40 DAT except for the fourth year with an early start of mid-season drainage (36 DAT). The CH4 fluxes in all plots immediately decreased to nearly zero following the mid-season drainage.
In the first and fourth years, the CH4 fluxes in all plots increased again with decreasing Eh after the end of the mid-season drainage to the final drainage. During the period, although the CH4 fluxes from the rice-straw plot were higher than those from the other two plots, the difference in CH4 fluxes between the rice-straw and other two plots were not large compared to that observed before the mid-season drainage. In the second year, significant CH4 emissions were rarely observed during the period from the mid-season drainage to harvest, except for the Et-residue plot just after the end of the mid-season drainage (79 DAT).
Total CH4 emissions during the rice-growing season were divided into the two period (i.e., before or after the beginning of mid-season drainage) (Table 3). For the three years’ average, the total CH4 emission before the beginning of mid-season drainage was significantly (p < 0.05) higher from the rice-straw plot (15.7 ± 3.8 g·C·m−2·period−1) than those from the other two plots (4.1 ± 1.9 and 2.8 ± 1.5 g·C·m−2·period−1 for the Et-residue and no-application plots, respectively). The rates of decrease in total CH4 emission before the beginning of mid-season drainage compared to the rice-straw plot were 74% and 82% for the Et-residue and no-application plots, respectively. Though the inter-annual variation in total CH4 emission after the beginning of mid-season drainage was relatively large compared to that before the beginning of mid-season drainage, the three years’ average of the total CH4 emission did not differ significantly among the plots (9.1 to 10.6 g·C·m−2·period−1). The total CH4 emissions during the rice-growing season followed the order of the no-application plot (11.9 ± 4.8 g·C·m−2·period−1) < the Et-residue plot (14.6 ± 1.8 g·C·m−2·period−1) < the rice-straw plot (25.4 ± 8.7 g·C·m−2·period−1), and a significant difference (p < 0.05) was found between the no-application and rice-straw plots. The rates of decrease in total CH4 emission during the rice-growing period compared to the rice-straw plot were 42% and 53% for the Et-residue and no-application plots, respectively.

4. Discussion

4.1. Effects on Rice Growth

In poorly drained paddy fields in cool-temperate regions, the removal of rice straw from the previous year from the fields is expected to improve the early growth of rice. However, the positive effect of the treatment on the number of tillers was observed in the second year only (Figure 4). There was a possibility that negative effect of organic acid derived from rice straw on the early growth of rice [8] was negligible with high soil pH in the studied field. Moreover, the additional nitrogen derived from the bio-ethanol production residue might have resulted in the higher numbers of tillers in the Et-residue plot compared to the no-application plot. Because ca. 20% of the applied nitrogen derived from the residue (i.e., 2.2 g·N·m−2) was easily mineralized nitrogen (Figure S2), enhancement of rice growth might be greater especially in the early stage of rice growth. However, the positive effect of bio-ethanol production residue on early growth was not found in every year. It might be due to mineralization and leaching of applied nitrogen during a fallow season.
On the other hand, positive effect of bio-ethanol production residue application on the grain yield was not found clearly in this study. Mineralization of nitrogen derived from the residue during the late stage of rice growth was considered to be small (Figure S2). The grain yields in the rice-straw and Et-residue plots in the first year were lower compared to that in the no-application plot in the same year and those in the all plots in the other two years (Table 2). Because there were no significant differences in the numbers of tillers among the plots throughout the growing period in the first year (Figure 4), the decrease in grain yield in the two plots was likely not caused by the inhibition of the early growth. Though there was no clear evidence due to lack of yield components data in the first year, inhibition of rice ripening by the high air temperature [23] from August to September (especially mean air temperature for 20 days from rice flowering (around 77 DAT): 26.6 °C, Figure 3) may have been more severe for the two plots. The low 1000-kernel weights in the first year (19.9 to 20.7 g) compared to those in the fourth year (22.0 to 22.3 g) could support the inference (Table 2).

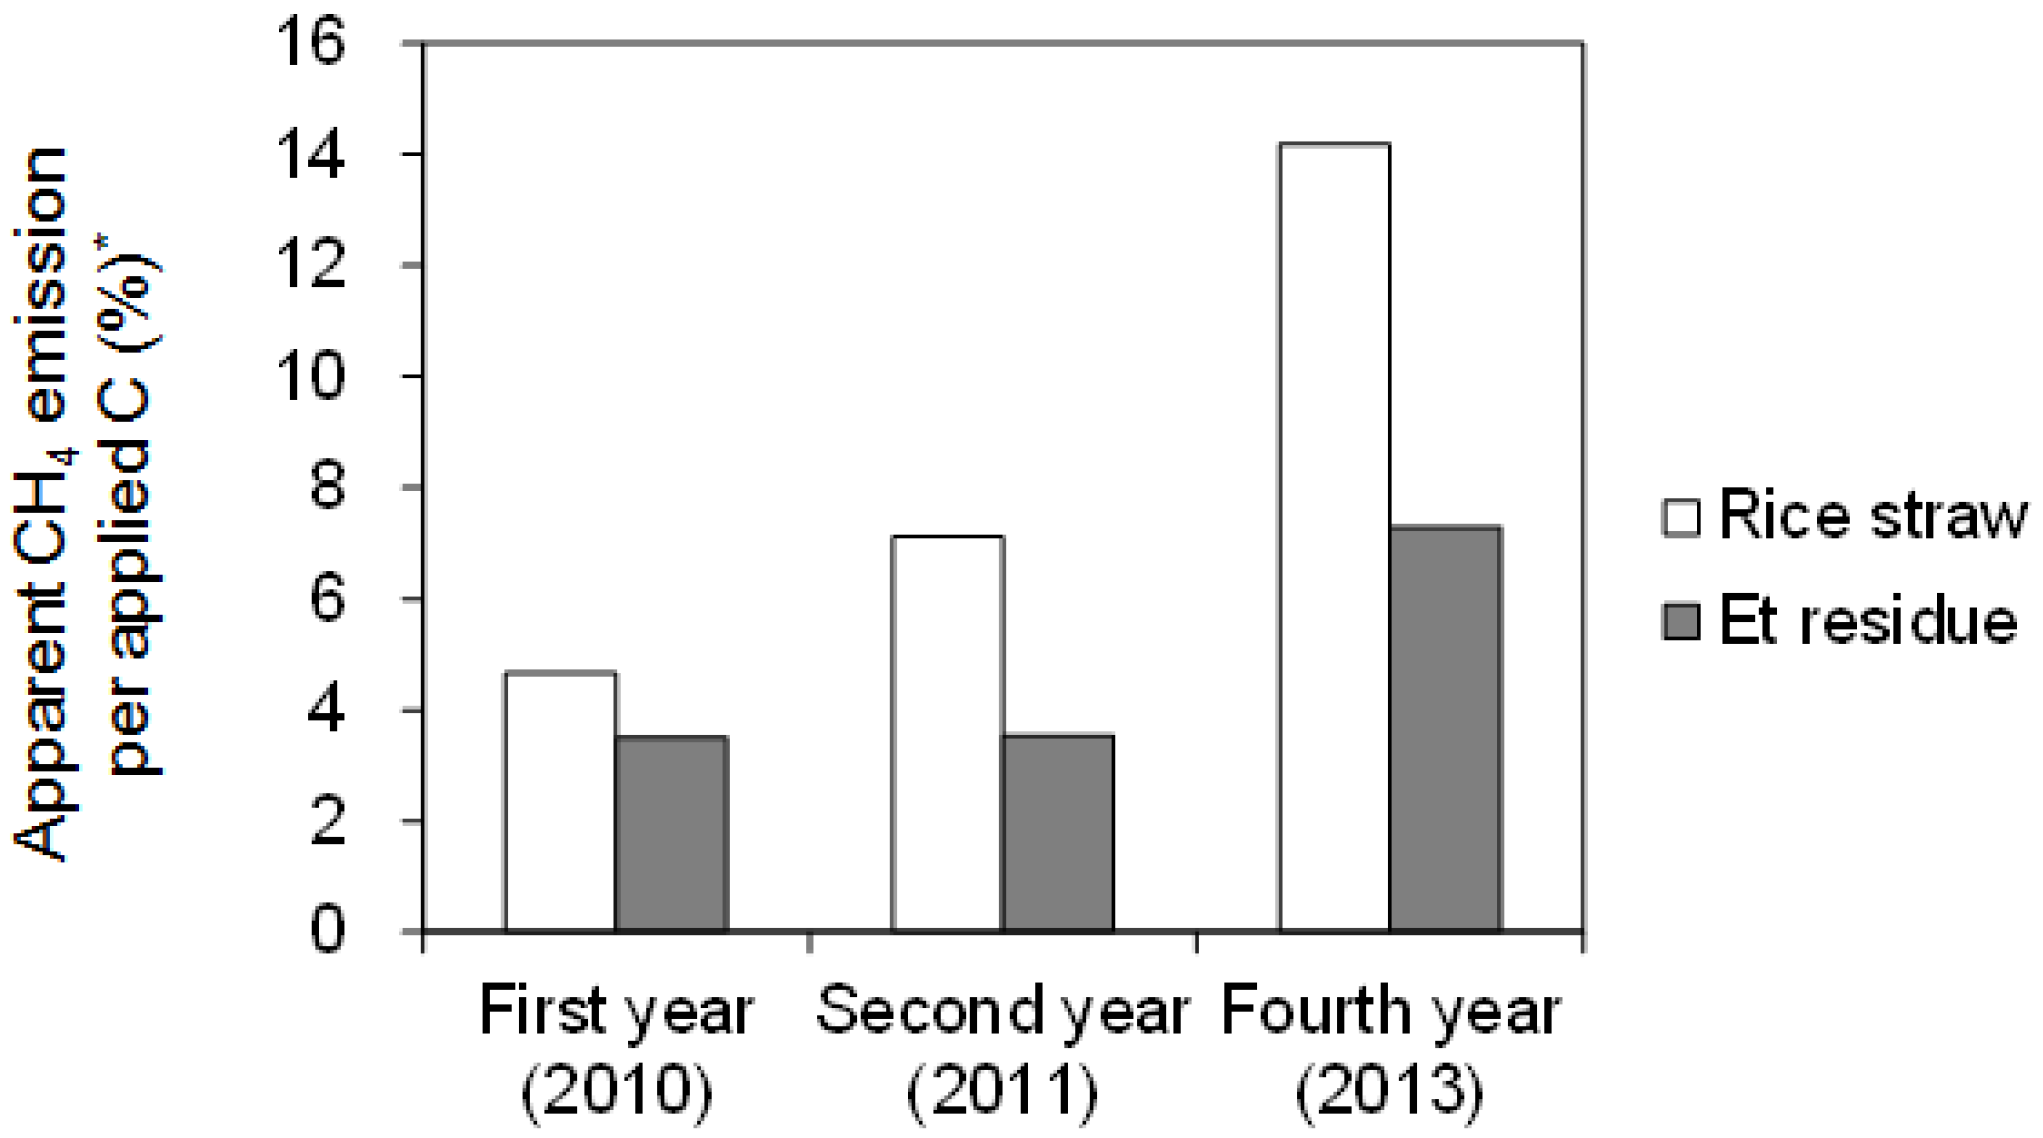
4.2. Effects on CH4 Emission

Mitigation options for CH4 emissions from rice paddy fields include water management (e.g., [24,25,26]); paddy-upland rotation [27]; field management, such as underdraining [28,29]; and the application of soil amendments (e.g., [30]).
The management of organic matter is also an important factor for controlling CH4 emissions from paddy fields. In particular, it has been frequently reported that the application of rice straw to paddy fields increases CH4 emissions (e.g., [9,10,11,12,13]). Therefore, the promotion of the oxidative decomposition of rice straw in and out of the field is important for reducing CH4 emissions. Yagi and Minami [13] and Miura [20] reported that CH4 emissions from paddy fields could be reduced by the removal of rice straw and its return to the field after composting.
In this study, although an increase in CH4 emissions following the application of bio-ethanol production residue compared to the no-application treatment was observed, as reported from a column experiment with a residue produced by a process similar to that in this study by Nishimura et al. [17], the rice straw removal and application of bio-ethanol production residue reduced CH4 emissions by 42% compared to the conventional rice straw application. The reduction in CH4 emissions could be mainly attributed to the decrease in the content and application rate of carbon through the process of bio-ethanol production from rice straw (Table 1). Moreover, the change in the composition of carbon in rice straw related to CH4 production could also contribute to the reduction in CH4 emissions observed in this study. Hemi-cellulose and cellulose are major substrates for CH4 contained in rice straw in large amounts [9,20]. In the process of bio-ethanol production from rice straw, hemi-cellulose and cellulose in rice straw are removed after saccharization, while more highly resistant carbon—such as that in lignin—remains, and its proportion in residue increases (Table 1). The apparent CH4 emission factor (i.e., CH4 emission rate per applied carbon) calculated to evaluate the contribution of applied carbon in rice straw and bio-ethanol production residue to CH4 production was lower in the bio-ethanol production residue (3.5% to 7.3%) than in the rice straw (4.7% to 14.1%) (Figure 6). This tendency coincided with the change in composition of rice straw carbon by the process of bio-ethanol production (i.e., decrease in content of cellulose and hemi-cellulose).
The difference in CH4 emissions between the rice-straw plot and the other two plots was especially large in the early part of the growing season (i.e., before the beginning of mid-season drainage). This finding agreed with previous reports that the contribution of applied rice straw to CH4 emissions from paddy fields is quite large in the early part of the growing season [9,10]. Before the beginning of mid-season drainage in the fourth year, CH4 flux from the rice-straw plot was higher than those in the other two years due to high air temperature from the end of May to the early July, while CH4 fluxes from the Et-residue and no-application plots were similar to those in the other two years (Figure 5). Therefore, the suppression effect of bio-ethanol production residue application on the CH4 emission, especially for the early part of the growing season could become larger in a hot year. In the fourth year, high air temperature during the period of tiller development (mainly in June) also increased the numbers of tillers rapidly, resulting in advance of mid-season drainage (Figure 4 and Figure 5). As a result, total CH4 emissions before the beginning of mid-season drainage in the fourth year was comparable with that in the second year. However, in the fourth year, second development of reduced conditions followed by an increase in CH4 flux occurred during a long intermittent irrigation period after the advanced mid-season drainage (Figure 5), resulting in higher total CH4 emissions during the rice-growing period compared to those in the other two years (Table 3).
In the first and second years, trends in CH4 fluxes among the plots were consistent with those in Eh, that is, lower Eh and higher CH4 flux than those in other two plots (Figure 5). In the fourth year, however, CH4 flux from the Et-residue plot was low as with that from the no-application plot, in spite of its low soil Eh as with that in the rice-straw plot. Although the reason for the difference among the years was not clear, it might be due to the high content of sugars which can enhance soil reduction [20] and low content of cellulose and hemi-cellulose, substrates for CH4 production (Table 1).
Spike peak of CH4 flux from the rice-straw plot was observed at 20 DAT in 2013. Validity of the flux was confirmed by its low standard error (7.2 with four replications). It could be attributed to the extreme high air temperature around the day (12 June, Figure 3).

4.3. Possible Choices of Timing for Et-Residue Application and Incorporation

Though the application and incorporation of bio-ethanol production residue in autumn after rice harvesting and next year’s spring, respectively (for the reason, see Section 2.2), incorporation in autumn just after application might suppress more CH4 emission by promoting aerobic decomposition of applied residue as in the cases of rice straw reported in previous studies (e.g., [11,20]). On the other hand, application timing of bio-ethanol production residue could be chosen freely rather than rice straw which scattered by combine harvesting in autumn. To increase the effect of bio-ethanol production residue on rice growth as nitrogen fertilizer, it is considered that application and incorporation of the residue in the next year’s spring (i.e., just before rice cultivation) is a promising practice, which can reduce the loss of nitrogen in residue by mineralization and leaching during a fallow season. As noted above, enhancement of rice growth by the residue application could be greater especially in the early stage of rice growth as with basal application of nitrogen fertilizer. Though the practice (application in spring) could lead to reduction of nitrogen fertilizer application, it could have a risk for increasing CH4 emission owing to insufficient aerobic decomposition of the residue. Therefore, for the choice of timing of bio-ethanol production residue application and incorporation, attention should be paid for the trade-off between CH4 emission and plant growth.

4.4. Possible Issues Involved with Long-Term Application of Et-Residue

In this study, rice straw removal and bio-ethanol production residue application to lysimeters over four years occasionally improved the early growth of rice without any remarkable inhibition and reduced the emission of CH4, a significant greenhouse gas emitted from rice paddy fields. However, the long-term application of bio-ethanol production residue could cause an increase in the carbon pool in soil organic matter, followed by an increase in CH4 emission derived from soil organic matter. Because the application of the bio-ethanol production residue for the four consecutive years did not increase the soil carbon content (data not shown) and CH4 emission (Table 3), so-called “carry-over effect” was not observed in this study. Hereafter, the effect of further long-term application on soil fertility, rice growth, and greenhouse gas emission with more long should be evaluated.
Following rice straw removal at harvesting, nutrients such as nitrogen, potassium, and silica are removed from the paddy fields. Therefore, the long-term removal of rice straw could decrease the fertility of paddy soil, negatively affecting rice growth. The application of bio-ethanol production residue to paddy fields provides at least as much nitrogen and silica as is removed via rice straw removal and is considered to be effective in the conservation of soil fertility. Itoh et al. [14] reported that the long-term (30 consecutive years) removal of rice straw had not decreased rice yield compared to rice straw application at an experimental paddy field located in the same area as this study (Hachirogata polder). They attributed this finding to the high availability of nitrogen, potassium, and silica in the reclaimed soil derived from bottom sediments in the Hachirogata Lake. However, they also reported that the long-term removal of rice straw decreased the extractable potassium, available nitrogen, and available silica in the soil. Therefore, rice straw removal from soils with low fertility, unlike those at the studied site, should be conducted with careful attention to changes in soil fertility.
Because more than 75% of nitrogen in the bio-ethanol production residue is considered to be hardly decomposable nitrogen, in the Et-residue plot, a significant amount of organic nitrogen derived from bio-ethanol production residue could be accumulated in the soil with continuous application. Although the accumulated nitrogen is not considered to be mineralized in a short-period (i.e., at least within a year after application), they could be mineralized in a long-period and could increase soil nitrogen availability. The expected increase in soil nitrogen availability can cause both positive and negative effects on rice cultivation. The increase in nitrogen supply can lead to reduction of nitrogen fertilizer application. While, if the nitrogen is supplied in excess, it may cause rice lodging, a decline in disease and pest resistance, and a decline in the quality of brown rice, among other issues. Consequently, the effect of the treatment on rice growth along with changing soil nitrogen availability should be studied over a multiple-year timespan.

4.5. Issues to Solve for the Practical Use of This Technology

As noted above, technology of bio-ethanol production has issues of its high cost, especially for enzyme for saccharization [31]. To solve the issues, technical breakthrough for improving the production efficiency including genetic manipulation of enzyme production yeast is considered to be essential. In addition, reduction of cost for feedstock supply (i.e., collection, transport, and storage of rice straw) is also required.

5. Conclusions

In a paddy field on gley lowland soil in a snowy cool-temperate region, rice straw removal and bio-ethanol production residue application to paddy fields for four years did not inhibit rice growth and reduce CH4 emissions. Although the effect of the treatment on rice yield was not clear, there was a possibility that improvement effect on the early growth of rice could be found. Although the carbon derived from bio-ethanol production residue could be a substrate for CH4 production, its potential was considered to be less than that of rice straw. Consequently, bio-ethanol production from rice straw and following application of its residue to paddy fields is considered to be a promising technology which can obtain new sustainable energy and suppress CH4 emission without any inhibition on rice growth.

Supplementary Materials

The following are available online at www.mdpi.com/2077-0472/7/3/21/S1, Figure S1: Ethanol production residue used to this study (left) and the experimental plot after scattering the residue (right), Figure S2: Nitrogen (N) mineralization rate of the bio-ethanol production residue used in this study. Mineralized N was evaluated as ammonium–N released by an incubation mixed with soil (150 mg N 100g−1 dry soil) under flooded condition. N mineralization rate was calculated by dividing the amount of mineralized N by the amount of applied N. The measured value was fitted with the following equation based on kinetics analysis. N = N0(1-exp[kt]) + I; where N, N mineralization rate (%); N0, rate of potentially mineralizable N (%); k, rate constant (day−1); t, time (day), I, rate of initially mineralized N (%).

Acknowledgments

We are deeply thankful to the staff members of the Center of Field Education and Research, Faculty of Bioresource Sciences, Akita Prefectural University for their support in the management of the experimental field. We would also like to thank Yoshinori Miura (Fukushima Prefecture) for providing the analytical method of carbon fraction.

Author Contributions

Yoshihiro Kaneta and Ken-ichiro Nagahama conceived and designed the experiments; Fumiaki Takakai, Jota Ichikawa, Masato Ogawa, and Saki Ogaya performed the experiments; Fumiaki Takakai and Masato Ogawa analyzed the data; Kentaro Yasuda and Yukiya Kobayashi contributed cultivation and measurements in the lysimeter; Fumiaki Takakai wrote the paper; Kentaro Yasuda, Yoshihiro Kaneta, and Takashi Sato gave many constructive comments on this manuscript.

Conflicts of Interest

The authors declare no conflict of interest.

References

  1. OECD (Organization for Economic Cooperation and Development)-IEA (International Energy Agency). Good Practice Guidelines: Bioenergy Project Development and Biomass Supply; OECD-IEA: Paris, France, 2007. [Google Scholar]
  2. Balat, M.; Balat, H. Recent trends in global production and utilization of bio-ethanol fuel. Appl. Energy 2009, 86, 2273–2282. [Google Scholar] [CrossRef]
  3. Sarkar, N.; Ghosh, S.K.; Bannerjee, S.; Aikat, K. Bioethanol production from agricultural wastes: An overview. Renew. Energy 2012, 37, 19–27. [Google Scholar] [CrossRef]
  4. Kubota, M. Reasonable application of rice straw to wet and semiwet paddy fields with heavy clay soil in Niigata. J. Niigata Agric. Exp. Stn. 1992, 39, 1–87. (In Japanese) [Google Scholar]
  5. Livestock Department, MAFF (Ministry of Agriculture, Forestry and Fisheries of Japan). Current Status of Rice Straw 2005. Available online: http://www.maff.go.jp/j/chikusan/souti/lin/l_siryo/koudo/h170906/pdf/ref_data01.pdf (accessed on 7 March 2017). (In Japanese)
  6. Ueda, T. Feasibility study on producing domestic biofuels from agricultural biomass in Japan. Tech. Rep. Natl. Inst. Rural Eng. Jpn. 2011, 211, 131–151. [Google Scholar]
  7. Maeda, K. Quantitative estimation of behavior of nitrogen applied to paddy field. Bull. Natl. Agric. Res. Cent. 1983, 1, 121–192. [Google Scholar]
  8. Tanno, F.; Kameyama, K.; Sekiya, S. Effect of straw application under low soil temperature on the growth of rice plants and the dynamic behavior of nutrients in the soil. Bull. Fukushima Prefect. Agric. Exp. Stn. 1990, 29, 1–13. (In Japanese) [Google Scholar]
  9. Watanabe, A.; Katoh, K.; Kimura, M. Effect of rice straw application on CH4 emission from paddy fields. II. Contribution of organic constituents in rice straw. Soil Sci. Plant Nutr. 1993, 39, 707–712. [Google Scholar] [CrossRef]
  10. Watanabe, A.; Yoshida, M.; Kimura, K. Contribution of rice straw carbon to CH4 emission from rice paddies using 13C-enriched rice straw. J. Geophys. Res. 1998, 103, 8237–8242. [Google Scholar] [CrossRef]
  11. Goto, E.; Miyamori, Y.; Hasegawa, S.; Inatsu, O. Reduction effects of accelerating rice straw decomposition and water management on methane emission from paddy fields in a cold distinct. Jpn. J. Soil Sci. Plant Nutr. 2004, 75, 191–201. (In Japanese) [Google Scholar]
  12. Watanabe, A.; Katoh, K.; Kimura, M. Effect of rice straw application on CH4 emission from paddy fields. I. Effect of weathering of rice straw in the field during off-crop season. Soil Sci. Plant Nutr. 1993, 39, 701–706. [Google Scholar] [CrossRef]
  13. Yagi, K.; Minami, K. Effect of organic matter application on methane emission from some Japanese paddy fields. Soil Sci. Plant Nutr. 1990, 36, 599–610. [Google Scholar] [CrossRef]
  14. Itoh, C.; Shibuya, T.; Kobayashi, H. Effect of long-term nutrient subtractive condition and organic matter application on paddy soil in Hachirogata polder II. Annual changes of soil chemical properties and rice yield in paddy field from which rice straw was continuously removed after rice harvest. Tohoku Agric. Res. 2009, 62, 43–44. (In Japanese) [Google Scholar]
  15. Shirato, Y.; Yagasaki, Y.; Nishida, M. Using different versions of the Rothamsted Carbon model to simulate soil carbon in long-term experimental plots subjected to paddy–upland rotation in Japan. Soil Sci. Plant Nutr. 2011, 57, 597–606. [Google Scholar] [CrossRef]
  16. Chen, Y.; Shiono, T. A study on the effect of applying vinasse from bio-ethanol production to farmland on leaching and physical and chemical properties of soil. Tech. Rep. Natl. Inst. Rural Eng. Jpn. 2011, 211, 153–169. (In Japanese) [Google Scholar]
  17. Nishimura, T.; Shinohara, T.; Imoto, H.; Miyazaki, T. Production of CH4 and CO2 following application of residue from a bio-ethanol plant to paddy field. In Proceedings of the Annual Meeting of the Japanese Society of Irrigation, Drainage and Rural Engineering, Tsukuba, Japan, 4–6 August 2009; pp. 832–833. (In Japanese)
  18. FAO (Food and Agriculture Organization of the United Nations)-UNESCO (the United Nations Educational, Scientific and Cultural Organization). Soil Map of the World, Revised Legend; World Soil Resources Report 60; FAO: Rome, Italy, 1990. [Google Scholar]
  19. Kanke, B. Application of the proximate analysis to soil saccharides. Jpn. J. Soil Sci. Plant Nutr. 1987, 58, 556–560. (In Japanese) [Google Scholar]
  20. Miura, Y. Rice straw management for mitigation of methane emission from paddy field. Spec. Bull. Fukushima Prefect. Agric. Exp. Stn. 2003, 7, 1–38. (In Japanese) [Google Scholar]
  21. Waksman, S.A.; Stevens, K.R. Acritical study of the methods of determining the nature and abundance of soil organic matter. Soil Sci. 1930, 30, 67–116. [Google Scholar] [CrossRef]
  22. Minami, K.; Yagi, K. Method for measuring methane flux from rice paddies. Jpn. J. Soil Sci. Plant Nutr. 1988, 59, 458–463. (In Japanese) [Google Scholar]
  23. Morita, S. Prospect for developing measures to prevent high temperature damage to rice grain ripening. Jpn. J. Crop Sci. 2008, 77, 1–12. (In Japanese) [Google Scholar] [CrossRef]
  24. Itoh, M.; Sudo, S.; Mori, S.; Saito, H.; Yoshida, T.; Shiratori, Y.; Suga, S.; Yoshikawa, N.; Suzue, Y.; Mizukami, H.; et al. Mitigation of methane emissions from paddy fields by prolonging midseason drainage. Agric. Ecosyst. Environ. 2011, 141, 359–372. [Google Scholar] [CrossRef]
  25. Minamikawa, K.; Sakai, N. The practical use of water management based on soil redox potential for decreasing methane emission from a paddy field in Japan. Agric. Ecosyst. Environ. 2006, 116, 181–188. [Google Scholar] [CrossRef]
  26. Yagi, K.; Tsuruta, H.; Kanda, K.; Minami, K. Effect of water management on methane emission from a Japanese rice paddy field: Automated methane monitoring. Glob. Biogeochem. Cycles 1996, 10, 255–267. [Google Scholar] [CrossRef]
  27. Kumagai, K.; Konno, Y. Methane Emission from Rice Paddy Fields after Upland Farming. Jpn. J. Soil Sci. Plant Nutr. 1998, 69, 333–339. (In Japanese) [Google Scholar]
  28. Furukawa, Y.; Shiratori, Y.; Inubushi, K. Depression of methane production potential in paddy soils by subsurface drainage systems. Soil Sci. Plant Nutr. 2008, 54, 950–959. [Google Scholar] [CrossRef]
  29. Shiratori, Y.; Watanabe, H.; Furukawa, Y.; Tsuruta, H.; Inubushi, K. Effectiveness of a subsurface drainage system in poorly drained paddy fields on reduction of methane emissions. Soil Sci. Plant Nutr. 2007, 53, 387–400. [Google Scholar] [CrossRef]
  30. Furukawa, Y.; Inubushi, K. Evaluation of slag application to decrease methane emission from paddy soil and fate of iron. Soil Sci. Plant Nutr. 2004, 50, 1029–1036. [Google Scholar] [CrossRef]
  31. Roy, P.K.; Tokuyasu, T.; Orikasa, N.; Shiina, T. A review of life cycle assessment (LCA) of bioethanol from lignocellulostic biomass. JARQ 2012, 46, 41–57. [Google Scholar] [CrossRef]
Figure 1. Layout drawing of experimental plots (In the case of 2011). Boardwalks were placed just for each flux measurement.
Agriculture 07 00021 g001
Figure 2. Schematic of the chamber used in this study.
Agriculture 07 00021 g002
Figure 3. Time evolution of air temperature during the rice growing period for three years. The normal year is the average of the values for the past 30 years (1981–2010). The average values of every five days are shown.
Agriculture 07 00021 g003
Figure 4. Time evolution of number of tillers in the first year (2010), second year (2011) and fourth year (2013). The number of tillers at 84 DAT in the first year, 86 DAT in the second year and 79 DAT in the fourth year corresponds to the numbers of panicles.
Agriculture 07 00021 g004
Figure 5. Time course of soil Eh at 5 cm depth (a) and CH4 flux (b) during the rice growing period. Bars indicate standard errors. FD, final drainage; H, Harvesting; MD, mid-season drainage.
Agriculture 07 00021 g005
Figure 6. Apparent CH4 emission factor (CH4 emission rate derived from organic carbon application) for rice straw and bio-ethanol production residue. * Calculated by the following equation: (each plot’s CH4 emission—no-application plot’s CH4 emission)/each plot’s applied C × 100.
Agriculture 07 00021 g006
Table 1. Contents of elements and carbon fractions in rice straw and bio-ethanol production residue and their application rates to each experimental plot (average for four years).
EelementContent (%, Dry) Application Rate (g·m−2)
Rice StrawEt ResidueRice Straw Et Residue §
Total N (nitrogen)1.13.05.510.8
Total P (phosphorus)0.150.0380.760.14
Total K (potassium)2.00.1310.00.45
Silica (SiO2)15.620.88075
Total C (carbon)37.536.2191130
Total Ca (calcium) 0.22-0.78
pH-3.9--
(Carbon fraction)
Lipids1.00.94.93.1
Sugars5.19.425.833.9
Hemi-cellulose14.77.675.127.5
Cellulose14.87.575.727.1
Residue (mainly lignin)2.010.710.038.7
Except for pH; 600 g·FW·m−2 (15% moisture, 510 g·DW·m−2) was applied; § 600 g·FW·m−2 (40% moisture, 360 g·DW·m−2) was applied; Contents of each carbon fraction were determined according to the sequential extraction methods by Kanke [19] and Miura [20], a modification of Waksman and Stevens [21], as follows. Lipids: extracted by benzen-ethanol, Sugars: extracted by boiled water, Hemi-cellulose: extracted by 2% HCl, Cellulose: extracted by 80% H2SO4.
Table 2. Grain yield and yield component for three years.
YearPlotNumber of PaniclesNumber of Spikelets per PanicleTotal Number of SpikeletsFilled Spikelets1000-Kernel Weight Grain Yield (Brown Rice)
(m−2) (×103 m−2)(%)(g)(g·m−2)
First year (2010)Rice-straw plot383 19.9463
Et-residue plot370ND ND ND 20.7488
No-application plot387 20.2542
Second year (2011)Rice-straw plot33794.629.479.8 568
Et-residue plot39983.231.782.3ND 554
No-application plot35686.831.282.5 561
Fourth year (2013)Rice-straw plot35679.528.386.922.3560
Et-residue plot37481.230.485.122.0597
No-application plot39367.926.792.222.1532
Average §Rice-straw plot35887.028.983.421.1530
Et-residue plot38182.231.183.721.4546
No-application plot37977.328.987.321.2545
The moisture contents were adjusted to 15%; ND: Not determined; § There were no significance differences among the plots by repeated measures ANOVA by assuming year as replicate (p > 0.05, n = 3 for number of panicles and grain yield, n = 2 for number of spikelets per panicle, total number of spikelets, filled spikelets and 1000-kernel weight).
Table 3. Total CH4 emissions during the rice-growing period for three years.
YearPlotCH4 Emission (g·C·m−2)
Before Mid-Season DrainageAfter Mid-Season DrainageTotal (Rice-Growing Period)
First year (2010) Rice-straw plot11.4 ± 6.57.8 ± 1.819.1 ± 8.3
Et-residue plot4.8 ± 0.610.0 ± 0.714.8 ± 0.2
No-application plot3.1 ± 1.17.1 ± 1.810.2 ± 3.0
Second year (2011) Rice-straw plot18.5 ± 4.83.3 ± 0.621.8 ± 5.4
Et-residue plot5.5 ± 0.87.3 ± 2.812.8 ± 3.4
No-application plot4.1 ± 1.04.1 ± 1.18.2 ± 1.5
Fourth year (2013) Rice-straw plot17.1 ± 4.018.2 ± 2.235.3 ± 5.6
Et-residue plot1.9 ± 1.314.4 ± 1.416.3 ± 2.5
No-application plot1.2 ± 0.716.2 ± 0.517.4 ± 0.3
Average Rice-straw plot15.7 ± 3.8 b (100)9.7 ± 7.6 a (100)25.4 ± 8.7 b (100)
Et-residue plot4.1 ± 1.9 a (26)10.6 ± 3.6 a (108)14.6 ± 1.8 a,b (58)
No-application plot2.8 ± 1.5 a (18)9.1 ± 6.3 a (94)11.9 ± 4.8 a (47)
Values represent mean ± standard deviation (n = 3 for first year and n = 4 for second and fourth year); Values represent mean ± standard deviation for three years and values within a column followed by different letters significantly among the plots (Repeated measures ANOVA by assuming year as replicate, p < 0.05, n = 3). Values in parentheses show index estimated by assuming the rice-straw plot’s CH4 emission as 100 (i.e., each plot’s CH4 emission/rice-straw plot’s CH4 emission × 100).

