Article

Influence of Composted Dairy Manure and Perennial Forage on Soil Carbon and Nitrogen Fractions during Transition into Organic Management

1
USDA-ARS, Central Great Plains Research Station 40335 Co. Rd. GG, Akron, CO 80720, USA
2
Department of Soil and Crop Sciences, Colorado State University, 1170 Campus Delivery, Fort Collins, CO 80523-1170, USA
3
College of Food, Agricultural and Environmental Sciences, Ohio State University, OARDC, 1680 Madison Ave, Wooster, OH 44691, USA
*
Author to whom correspondence should be addressed.
Agriculture 2017, 7(5), 37; https://doi.org/10.3390/agriculture7050037
Submission received: 27 February 2017 / Revised: 3 April 2017 / Accepted: 17 April 2017 / Published: 25 April 2017
(This article belongs to the Special Issue C and N Cycling and Greenhouse Gas Emissions in Agroecosystem)

Abstract

:
Composted dairy manure (CDM) is among the management practices used in transitioning from a conventional to an organic agricultural system. The objectives of this study are to evaluate the impact of several organic nitrogen (N) sources on: (i) soil organic C (SOC) and soil total N (STN) content; (ii) soil C and N distribution among soil fractions; and (iii) N mineralization. This study was initiated in 2007 on a recently renovated alfalfa (Medicago sativa L.) field located at the Agricultural Research, Development and Education Center near Fort Collins, Colorado. The soil type is a Fort Collins loam (fine-loamy, mixed, superactive, mesic Aridic Haplustalfs). Alfalfa and sainfoin (Onobrychis viciifolia Scop.) were interseeded with the grass mixtures as organic N sources. Three grass treatments were established with and without alfalfa or sainfoin. The CDM was also applied to the grass and to grass-alfalfa mixture at a rate of 22.4 Mg ha−1 in 2008 and at rates of 0, 11.2, and 22.4 Mg ha−1 in 2009. Soil samples were collected from the 0–5 cm and 5–10 cm depths in the fall of 2008 and 2009. Throughout the study period, SOC and STN were significantly influenced by depth, but not by treatment combinations. Averaged across the treatments, SOC was greater by 13.7% in 2008 and 24.2% in 2009 at 0–5 than the 5–10 cm depth. Similarly, STN was significantly higher by approximately 9.4% at 0–5 cm in 2008 and 18.7% in 2009 compared with the 5–10 cm depth. The C and N parameters studied and their distributions among various fractions (mineralizable, slow, and resistant) were influenced by the C and N contents of the added CDM. The low C and N contents of the CDM added in the second year of the study did not contribute to soil C and N build-up. The results generated from this study supported our hypothesis because the quality of CDM addition highly influenced C and N distribution among different fractions. Overall, for a transitioning system, CDM should to be added based on the manure-N content to ensure an adequate amount of N addition. To fully evaluate treatment benefits, a longer study period would be required to allow for system adjustment.

1. Introduction

Worldwide and in the United States, the demand for organic crop production, certified organic land, and organic livestock production has been increasing since the 1990’s [1,2]. Organic milk production, specifically, is one of the fastest growing segments of organic production along with certified organic pasture for dairy cows [3]. In fact, certified farmland in the United States has increased by approximately 77% from 1992 (215,313 ha) to 2011 (930,020 ha), with an estimated 34,570 ha of organic pasture in the state of Colorado [1]. A 36-month transition period is required to convert from a conventional to organic system, before milk production can be certified as organic, during which the pasture and cropland providing dairy inputs must be managed organically [3,4]. In the meantime, the dairy cow’s health and consumption must be managed organically during the last 12 months of the 3-year period [3]. In the grazing system, dairy cows must graze organically managed grass which provides an average of not less than 30% of their dry matter (DM) intake over the course of a 120 day grazing season [5].
During the transition period from a conventional to an organic system and thereafter, nutrient additions need to be organic sources [5]. The use of organic amendments, such as manure or compost, is a common practice to meet N needs for plant production in organic systems [6,7]. Nitrogen is one of the most limiting nutrients for plant production. Mixing legumes with grasses is also a common practice due to a legume’s ability to fix atmospheric N for their use, with small amounts of the fixed N becoming available to the grasses over time [8]. In perennial grass-legume mixtures, the amount of N-fixation and legume biomass turnover may not be enough to meet the grasses’ N requirement throughout the growing season. To maintain perennial grass growth and production, slow N release throughout the growing season is required [9]. Therefore, the addition of fresh or composted manure to the grass mixtures or grass-legume mixtures can provide the gradual N release needed to sustain forage production and maintain perennial forage yields [9].
Therefore, it is important to predict N mineralization or the mineralizable (labile) fraction from soil organic matter (SOM), or organic amendments are needed to improve N management in these organic systems [10,11]. Evaluation of soil N mineralization, the process through which soil organic N is converted to inorganic N, is important to assess the soil N or organic amendment-N supplying capacity that is necessary for grass production. Throughout the grass growing season, composted manure and SOM will mineralize at different rates depending on environmental conditions and soil water content. In organic farming, the variable N mineralization rate may not meet the grasses’ N needs throughout the growing season. It has been previously documented that SOM is a heterogeneous mixture of organic material varying in structure, stability, nutrient content, and bioavailability, with turnover times (mineralization rate) that range from days to years and even millennia [12,13,14]. The heterogeneity of SOM can be characterized by defining several C and N fractions [15]. Generally, SOM fractions consist of labile or active, slow, and resistant fractions depending on turnover rate and degree of stabilization [12,16,17,18]. The active and a portion of the slow fraction are easily degradable by soil microorganisms with short turnover times [17,19,20] and can be used to partially or fully meet grass N needs. Therefore, the active fraction of SOM is very sensitive and can be used as an indicator of changes in soil management [20]. By contrast, the resistant fraction of SOM will remain in soil for hundreds of years and can contribute to SOM storage [20,21].
Soil N contributions from SOM have not been studied intensively during the transition from conventional to organic management. Therefore, studies are needed nationwide to improve our knowledge of soil C and N fractionation and contributions during and after the transition period from traditional to an organic system. This study was conducted to evaluate the influence of three organic N sources including two forage legumes (alfalfa, Medicago sativa L., and sainfoin, Onobrychis viciifolia Scop.) and composted dairy manure (CDM) applied at different rates on: (i) soil organic carbon (SOC) and soil total nitrogen (STN); (ii) soil C and N distribution among different fractions; and (iii) N mineralization through short-term incubation. We hypothesized that CDM carbon (C) and nitrogen (N) content applied at different rates could enhance SOC and STN and affect their distribution among the various soil fractions compared with C and N input from legume forage biomass.

2. Materials and Methods

2.1. Site Description

The study was established in the fall of 2007 on an alfalfa field located in north-central Colorado at the Agricultural Research Development and Education Center (ARDEC), Colorado State University near Fort Collins Colorado. The study is located at 40°39′6″ N, latitude and 104°59′57″ W longitude with an elevation of approximately 1554 m above sea level. The research site is within a semiarid climate with annual precipitation of approximately 330; 88% of this precipitation occurs from April to October. The mean (30 years) average temperature ranges from −1 °C in January to approximately 23 °C in July [22]. The soil series is Fort Collins clay loam (fine-loamy, mixed, superactive, mesic Aridic Haplustalfs) with a slope of 0 to 3% [23].
Alfalfa was grown on the study site from 2003 to 2007 before the initiation of the current study. Detailed site management is reported in Hurisso et al. [24]. Briefly, in the summer of 2007, the alfalfa was killed by incorporating it with a moldboard plow to a soil depth of 20 cm; then, the field was clean-tilled by disking several times and blanketed with an application of composted dairy manure (CDM) at approximately 22.4 Mg CDM ha−1. The CDM contained approximately 0.62% total N and 7.4% C and was broadcast on the entire field and incorporated into the soil by disking. In early September of 2007, two grass mixes or a monoculture of tall fescue (Festuca arundinacea Schreb.) were seeded with a no-till drill (Model 3P605NT, Great Plains Mfg., Inc., Salina, KS, USA) fitted with a cone seeder attachment (Kincaid Equipment Manufacturing, Haven, KS, USA) and set at a 17-cm row spacing. The two grass mixtures were comprised of either Hybrid Wheatgrass-Tall Fescue-Hybrid Brome (HWG-TF-HB) or Orchardgrass-Meadow Brome-Smooth Brome (OG-MB-SB) in addition to Tall Fescue (TF) grass treatment alone. Plots receiving a legume treatment as a nitrogen source were simultaneously planted with one of two legumes: alfalfa or sainfoin. The grass and legume species, varieties, and seedling rates are reported in Table 1.
In April 2008, all plots except those planted to grass-legume mixtures received a second CDM application at 22.4 Mg ha−1 (with approximately 1.1% total N and 9.1% C). Visual observation of legumes indicated that alfalfa and sainfoin survival was inadequate probably due to competition with the grasses as well as some winterkill. Therefore, the legumes were over seeded into the grasses again in March of 2009. In October 2008, the grass mixture plots were split into three sub-plots that received the following rates of the CDM: 0, 11.2, and 22.4 Mg CDM ha−1 (with approximately 0.29% total N and 3.6% C). In this study, application rates of the CDM were similar to what is normally used in the region where the study is located. The area surrounding the research plots did not receive any CDM and was considered as the control (no N added). The control area was seeded to the grass mixture (Table 1) that consisted of Orchardgrass-Meadow Brome-Smooth Brome (OG-MB-SB). The study site, including the border, control plots, was irrigated once or twice per week, as needed, with a linear move sprinkler. The plots were harvested five to six times per year. Detailed baseline data for this study site and the CDM properties are reported in Hurisso et al. [24]. The plots were 3 m wide by 12 m long. The experimental design of the study was randomized complete block with a split-plot treatment arrangement; the blocks were replicated three times. The main plot treatments were the TF grass and two grass mixtures, OG-MB-SB and HWG-TF-HB (Table 1). The subplot represents the N sources, comprised of two legumes, sainfoin and alfalfa, composted manure (CDM), and the combination of alfalfa and CDM for a total of 12 treatments replicated 3 times. In 2009, the CDM treatment was further split into three rates of 0, 11.2, and 22.4 Mg ha−1 for a total of 18 treatments replicated 3 times.

2.2. Soil Sampling

Soil samples were collected in March 2008 from the 0–20 cm depth, before the treatments were established, to evaluate initial soil characteristics. The initial soil analysis revealed that the SOM, by loss on ignition, was 2.4%, extractable nitrate–N (NO3–N) was 15.4 mg kg−1, Olsen P was 29 mg kg−1, soil pH was 8.3, and soil EC was 0.4 dS m−1 [24]. Soil samples for the current study were collected on 29 September 2008 and 4 September 2009. A composite sample consisting of three 2.5-cm dia. cores was collected from the 0–5 and 5–10 cm depths of each plot using an Oakfield hand probe (Forestry Supplies, Inc., Jackson, MS, USA). Soil samples were collected diagonally to the edge of the plot. The three composite soil samples, for each depth, were mixed thoroughly to homogenize the sample, air dried, ground to pass through 2-mm sieves, and stored at room temperature until analysis.

2.3. Soil Total Carbon and Nitrogen

The soil pH at this study site was 8.3, which indicated the presence of inorganic C. Thus, soil organic C was evaluated using the dry combustion method described by Nelson and Sommers [25]. The principle of this method is based on oxidation of organic C and thermal decomposition of carbonate minerals in a medium-temperature resistance furnace. The liberated CO2 was then measured spectrophotometrically. Total C and N were determined by direct combustion (950 °C) using a LECO TruSpec CN analyzer (Leco Corp., St. Joseph, MI, USA). Air-dried soils were ground to a fine powder using mortar and pestle, and about 0.2 g of ground soil was analyzed for total C and N content.

2.4. Mineralizable (Active) Carbon and Nitrogen Fractions

To evaluate soil mineralizable (active) forms of C and N, a short-term aerobic laboratory incubation was conducted for 28 days at 25 °C under a soil water content of −0.033 MPa [26,27]. The 8-mm sieved and air-dried soil was conditioned to a water content of 0.21 g H2O g−1 soil (approximately −0.033 MPa) by gradually adding an appropriate amount of deionized (DI) water before the incubation [28]. The rewetting procedure was performed for each sample by placing 100 g of air-dried soil into a 10 cm tall × 10 cm dia. plastic specimen cup (Fisher Scientific, Pittsburgh, PA, USA) of known weight. The gravimetric soil water content for each air-dried sample was evaluated, and the amount of DI water needed to adjust the air-dried soil to the 0.21 g H2O g−1 soil was calculated accordingly. Half of the water required was added gently and evenly over the soil surface using a syringe. The soils were stored in a cooler at 4 °C for two days to let the water equilibrate throughout the entire soil volume. After two days, the sample was taken out of the cooler and mixed by gently swirling the specimen cup horizontally. The other half of the water required was added gently to the sample as previously mentioned before returning the soils to the cooler for another two days. After two days, the soil samples were taken out of the cooler and mixed gently as mentioned previously. The gravimetric soil water content was determined by weight loss at 105 °C for 24 h.
Mineralizable C was determined using the static sealed chamber method to evaluate CO2 evolution for the 28-day incubated soil [26,27]. In short, 40 g of recently wetted soil (0.21 g H2O g−1 soil) associated with each treatment was added to a 170 mL specimen cup and placed in an approximately 1-L (the volume of each canning jar was measured precisely) wide mouth canning jar containing 20 mL of water. The initial weight of the cup + soil for each treatment was recorded before incubation. The water was added to the jar to keep the chamber environment moist and minimize soil moisture loss. The canning jar lids were fitted with rubber stoppers to allow for CO2 headspace sampling. The canning jars containing soil samples were incubated in a dark room at 25 ± 1 °C for 28 days. In order to correct for the ambient CO2 in the laboratory atmosphere, four jars without soil (only an empty cup and 20 mL water) were incubated as controls.
Headspace CO2 was sampled at 2, 5, 7, 10, 14, 21, and 28 days after initiation of incubation from each jar using a series A-2 Pressure-Lok precision analytical syringe (VICI Precision Sampling Inc., Baton Rouge, LA, USA). In order to assure a representative sample due to the fact that CO2 is heavier than air, the air inside the jar was mixed with a 50-mL syringe 4–6 times prior to headspace sampling. The concentration of CO2-C was measured using a LI-COR IRGA, i.e., infrared CO2 gas analyzer (LI-6252, LICOR, Lincoln, NE, USA). After the headspace gas was sampled, the soils were aerated for 10 min (by removing the jar lids) to allow equilibration with the atmosphere. Before closing the jar lids, the water in each jar was replaced with 20 mL of fresh deionized water. The weight of the cup + soil was adjusted to the initial weight by adding a few drops of deionized water to the soil sample if needed.
The potential mineralizable C for each soil sample was calculated using the first-order mineralization model. The Marquardt option of SAS PROC NLIN, a nonlinear curve fitting procedure (SAS Institute, Cary, NC, USA) proposed by [29,30], was used as follows:
Cm = C0 (1 − e−kt)
where Cm is mineralized C (g C kg−1); C0 is potentially mineralizable C (g C kg−1); k is a rate constant (day−1); and t is time (day). In this study, the C0 was considered the active C mineralizable fraction as reported by [18].
Soil inorganic N was evaluated at 0 and 28 days of laboratory incubation by extracting 15-g subsamples of moist soil with 75 mL of 2 M KCl and shaking for 30 min [31]. The supernatant was filtered through a Whatman No. 42 filter paper (Fisher Scientific, Fair Lawn, NJ, USA) and stored at −20 °C in a freezer until analysis. Two days before analysis, the frozen samples were thawed by moving them to a refrigerator (4 °C) and were analyzed using a colorimetric autoanalyzer (Flow Solution IV, O-I-Analytical) for NH4-N and NO3-N [32]. Soil inorganic N concentrations were expressed on an oven-dry basis. Net N mineralization was estimated by the following equation as reported by [33]:
Net N mineralization = (NH4+-N + NO3-N)t28 − (NH4+-N + NO3-N)t0
where t28 represents inorganic N measured after 28 days of incubation, and t0 represents inorganic N measured at the initial stage before the incubation. Net N mineralization was not considered the active fraction, but rather a fast N fraction because only two data points were measured and the potential mineralizable N was not calculated using the first-order mineralization model as previously recommended by [18].

2.5. Resistant Soil C and N Fraction

Resistant C and N were determined by the acid hydrolysis method [34]. A 0.5-g sample of sieved (2 mm), air-dried soil was refluxed at 95 °C for 16 h in 25 mL of 6 M HCl. After refluxing, the suspension was filtered and washed with deionized water over a glass-fiber filter. The residue was oven-dried at 60 °C and weighed. C and N contents in the residue were determined by the dry combustion method using a LECO TruSpec CN analyzer (Leco Corp., St. Joseph, MI, USA). The hydrolyzability of samples is expressed as the percentage of non-hydrolyzable C or N (%NHC or %NHN). This was calculated using the equation reported by [18], which accounts for incomplete recovery during filtration and the mass loss of the sample during hydrolysis:
% NHC , % NHN = ( C , N ( g ) Sample ( kg ) ) after × mass after mass before ( C , N ( g ) Sample ( kg ) ) before × 100
where NHC and NHN represent nonhydrolyzed C and N, respectively, and mass represents soil mass before and after the acid hydrolysis procedure.

2.6. Intermediate (Slow) Soil C and N Fraction

Intermediate C, also known as the slow C fraction, was determined by calculation based on the following equation reported by [18]:
Slow C = 100% (organic) C − % (resistant + active) C fractions
In this study, the slow N fraction was not evaluated because we were unable to evaluate the potential mineralizable N (active fraction). Therefore, the slow and active N fractions were combined as one fraction and calculated as
(Slow + Active) N = 100% (total N) − % (resistant) N fraction

2.7. Statistical Analysis

Differences in C and N fractions (i.e., total, resistant, slow, and mineralizable) within and between soil depths, and among grass mixes and N-sources were analyzed using a split-plot randomized complete block design, with grass mixes as the whole plot factor and N source (CDM rate and legume species) as the sub-plot factor. The sampling depth was considered as the sub-subplot factor. To evaluate the main effects of the grass mixture and its interactions, an analysis of variance (ANOVA) F-test was used. Mean separation (LSMEANS) and ANOVA PROC Mixed was used for analysis of variance and mean separation differences [35]. The effect of treatment combinations (grass mixture and N source) on soil properties was considered as a fixed effect while replication was considered a random effect. The control treatment was not included in the statistical analysis because it was not randomized within the experimental plots. Unless noted otherwise, all results were considered significantly different at p < 0.05.

3. Results and Discussion

3.1. Soil Organic C (SOC) and Soil Total N (STN)

Soil organic C and total N content were significantly different between the two soil depths, but the treatment effects and the interactions between treatment and soil depth were not significantly different for both sampling periods (Table 2 and Table 3). These results indicate that the addition of the CDM did not increase the amount of the SOC or STN compared to the forage legume N sources. The short duration of study could be the reason for the lack of treatment effects on SOC and STN in this system undergoing transition to organic management. Averaged across the treatments, SOC at the 0–5 cm soil depth was significantly greater in 2008 (by 13.7%) and in 2009 (by 24.2%) compared with SOC at the 5–10 cm soil depth. Similarly, STN at the 0–5 cm depth was significantly higher by approximately 9.4% in 2008 and by 18.7% in 2009, than at the 5–10 cm soil depth. The larger amounts of the SOC and STN observed in the surface 0–5 cm compared with the subsurface 5–10 cm soil depth was probably related to the combination of the CDM application on the soil surface and no-tillage following application in these perennial forage systems. In this study, the cumulative effect of three CDM additions in 2009 compared with two CDM additions in 2008 in combination with no-tillage following application contributed to the SOC and STN differences between depths and time. Increasing the SOC and STN with CDM additions in the surface 0–5 cm compared with the 5–10 cm depth was expected due to the fact that the CDM is rich in nutrients that will contribute to increases in soil C and N content [36,37,38].
The differences in the SOC and STN that we observed between the soil depths studied (0–5 and 5–10 cm) were approximately 2-fold higher in 2009 (Table 3) compared with 2008 (Table 2). This difference was probably related to the low amount of the SOC and STN observed in the 5–10 cm depth and the number of surface applications of CDM before sampling in 2009 (Table 2 and Table 3). In the 5–10 cm depth, the SOC and STN were greater in 2008 than in 2009 by 13% and 15%, respectively. The high amount of the SOC and STN observed in 2008 in the 5–10 cm depth could be related to alfalfa incorporation in 2007, before the initiation of the study. By contrast, in 2009, the replenishment of the SOC and STN at the 5–10 cm depth was associated with soluble C and N leached from CDM added to the surface in fall of 2008. However, since the study was irrigated, soil C and N could have leached below the measured depth of 5–10 cm. Nevertheless, in the 0–10 cm depth, the SOC and STN contents were greater in 2008 than in 2009 by an average of 8% and 9%, respectively. This difference in SOC and STN between sampling periods was probably related to low CDM quality added in 2009 (0.29% total N and 3.6% C) compared with 2008 (1.1% total N and 9.1% C) and to the mineralizable C and N that could be leached below the 10-cm sampling depth due to irrigation.

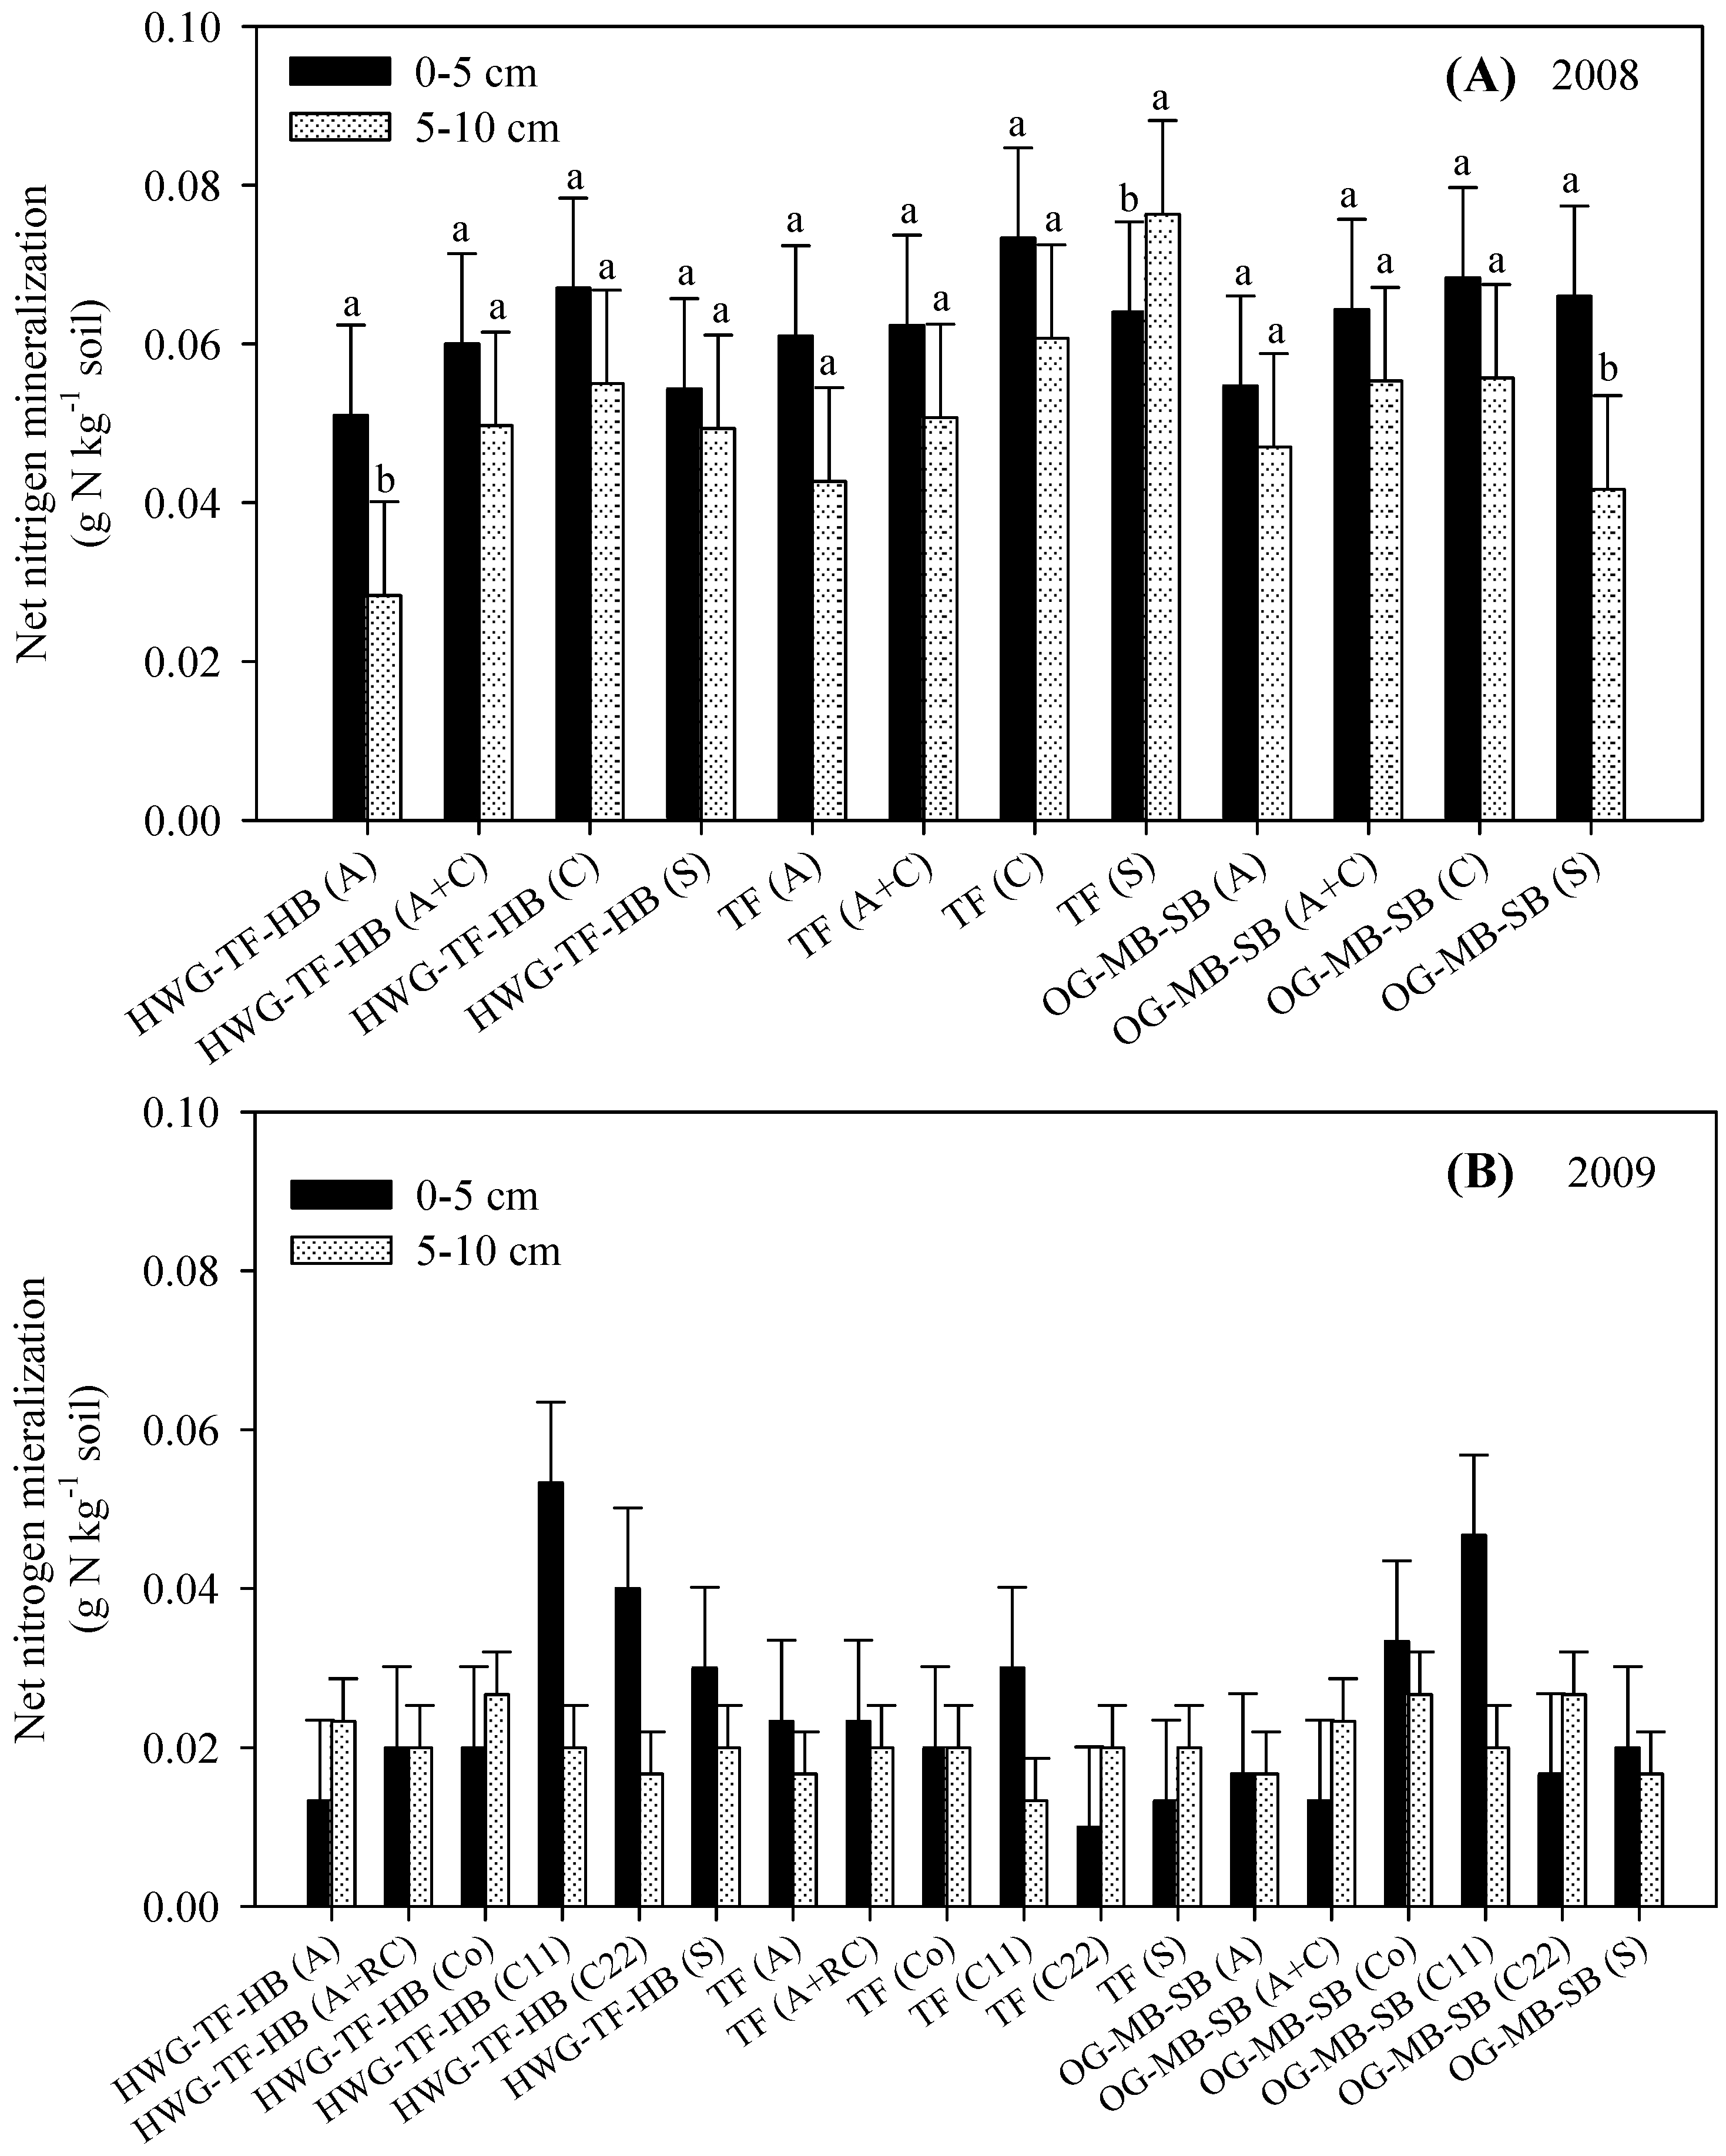
3.2. Net Nitrogen Mineralization (Nmin)

Net N mineralization (Nmin) represents the amount of N that can be mineralized within a defined period of time under specific incubation conditions [14,39]. In this study, the Nmin represents the easily degradable N sources, which are considered part of the active N fraction because of the short-term incubation (28 days). The Nmin was significantly influenced by soil depth in 2008, but not in 2009 (Figure 1). Averaged across the treatments and sampling periods, net Nmin was approximately 19% higher in the surface 0–5 cm compared with the 5–10 cm depth. The large amount of the Nmin at the surface could be related to the combination of surface CDM addition and no-tillage. This observation was supported by significant amounts of the SOC and STN observed in the surface soil compared with the subsurface soil depth (Table 2 and Table 3). Across depths, the Nmin was approximately 2.5 fold greater in 2008 compared with 2009. This was probably related to the larger amounts of the SOC and STN measured and the larger C and N contents in the CDM amendment in 2008 compared with 2009. In this study, the Nmin at the 0–10 cm represented 3.3% of the STN in 2008 and 1.4% in 2009. These results indicate that although the Nmin represents a small percentage of the STN, it is the soil N fraction that provides the necessary N for grass growth. Previous research from this study site reported by Hurisso et al. [40] showed that field N mineralization declined in 2009, which was related to the low C and N contents associated with the CDM amendment in 2009 compared with 2008. Overall, the C and N content of CDM added during this study period influenced the Nmin under controlled laboratory conditions and the field N mineralization that was reported by Hurisso et al. [40].

3.3. Potential Mineralizable C (Co) and Mineralization Rate Constant (kc)

The soil and organic amendment C content, substrate quality, and degree of decomposition influence soil C mineralization [10,41,42,43] and the mineralization rate constant [41,44,45,46]. In this study, the Co was not significantly influenced by treatments in either sampling period (Table 4 and Table 5). These results indicate that the CDM amendments at any rate and in either year did not significantly increase Co compared with other N sources (such as forage legume: alfalfa and sainfoin). However, the Co was significantly influenced by depth where the Co was greater in the surface 0–5 cm compared with the 5–10 cm depth (Table 4 and Table 5). Averaged across treatments, the Co in 2008 was significantly greater in the surface 0–5 cm by approximately 39% compared with the subsurface 5–10 cm (Table 4). The higher Co observed in the surface 0–5 cm was possibly related to the surface application of CDM, i.e., approximately 22.4 Mg ha−1 in the spring of 2007 and 2008 with C contents of 74 and 91 g kg−1 CDM, respectively. The Co in 2009 was also greater by approximately 56% in the surface 0–5 cm compared with the subsurface 5–10 cm (Table 5). Similar to the SOC, the Co amount was higher in 2008 by approximately 45% at 0–5 cm and by 61% at 5–10 cm compared with 2009 (Table 4 and Table 5). The differences in the Co between sampling periods were probably related to the low C content associated with the CDM amendment in 2009 compared with 2008. The possible leaching of soluble CDM compounds below 10 cm due to irrigation could also contribute to the differences in the Co observed between the sampling periods. The greater amount of the Co observed in the surface 0–5 cm was probably related to the high amount of the SOC observed at the surface compared to the subsurface 5–10 cm (Table 2 and Table 3). At the 0–10 cm depth, the Co represented approximately 8.8% of the SOC in 2008 and approximately 4.5% in 2009. The higher proportion of the Co to SOC reflects the higher C concentration and less degraded CDM applied in 2008 compared with 2009. Overall, the CDM-C content and the degree of decomposition influenced the Co at 0–10 cm where it was approximately 51% higher in 2008 compared with 2009.
Similar to Co, the mineralization rate constant (kc) was not influenced by treatment, but it was significantly influenced by depth only in 2009 (Table 4 and Table 5). The kc in 2009 was greater by approximately 15% at 5–10 cm compared with the 0–5 cm depth (Table 5). The high kc corresponded to the low Co associated with the 5–10 cm compared with the 0–5 cm depth. At the 0–10 cm depth, the kc was approximately 61% lower in 2008 compared with 2009. The increase in the Co and decrease in the kc observed suggest a higher C concentration and a lower decomposition rate in 2008 compared with 2009. These results also indicate different substrate quality and C concentration associated with the CDM applied throughout the study period.

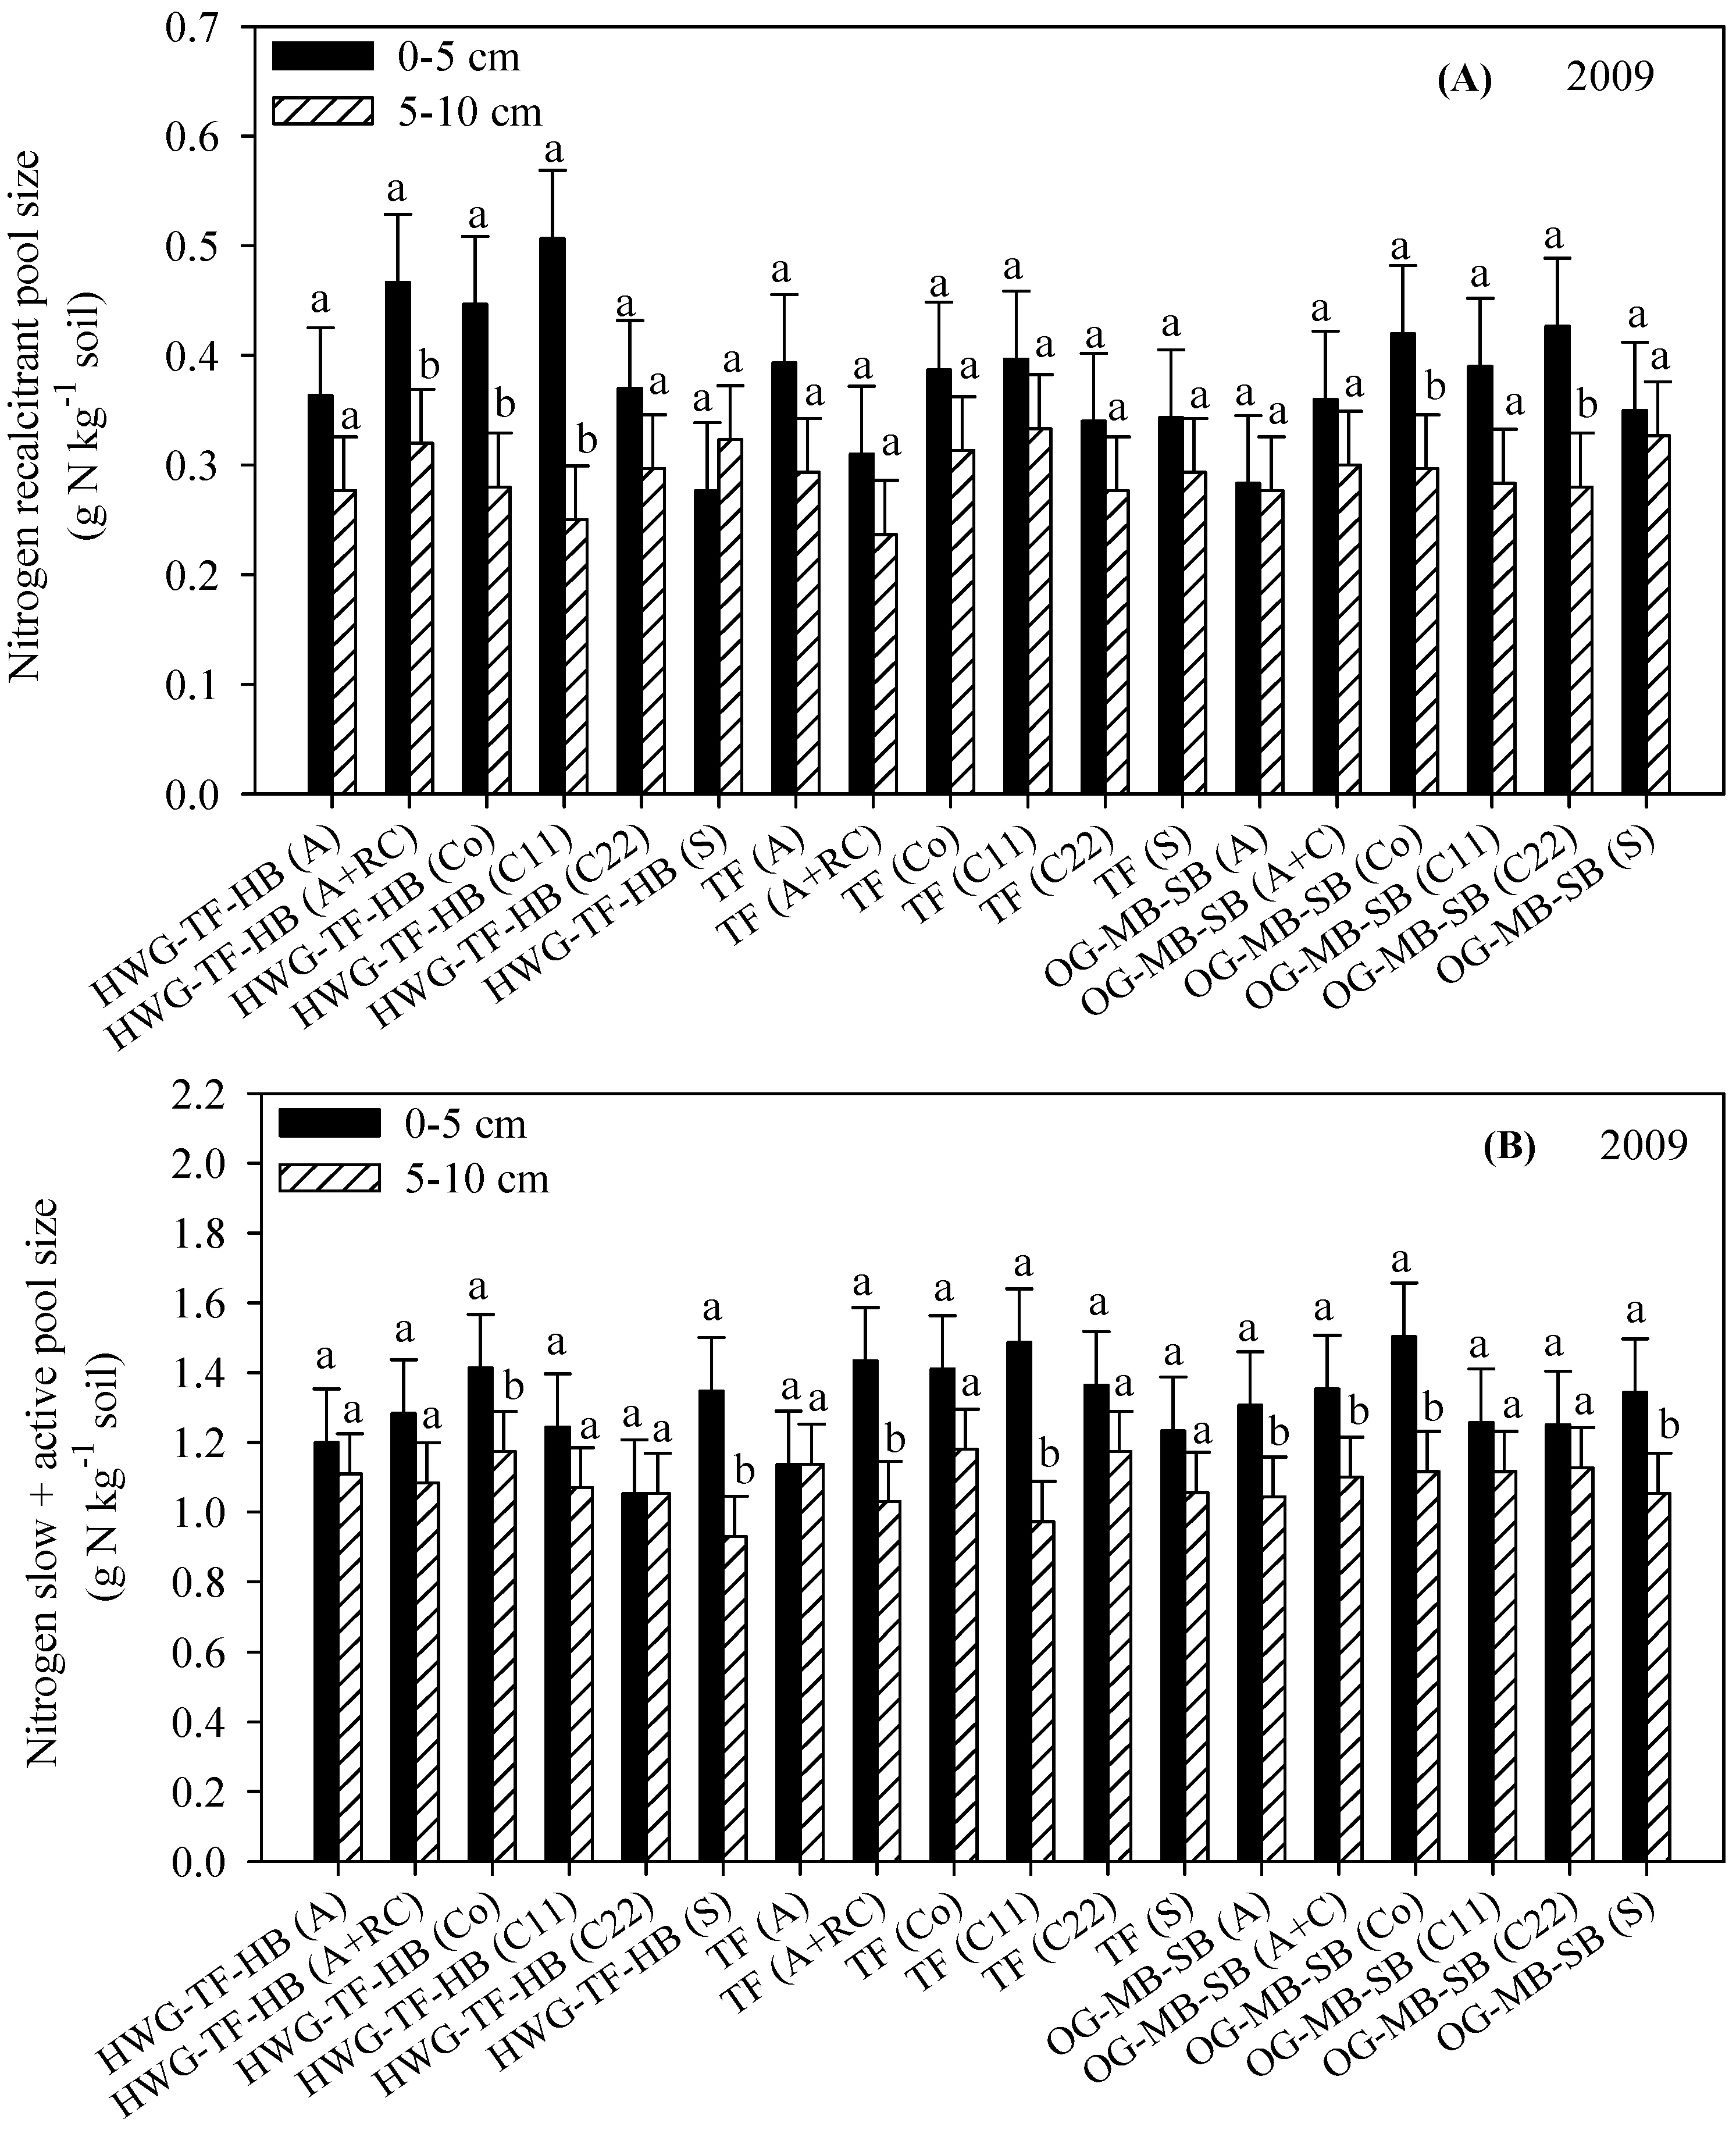
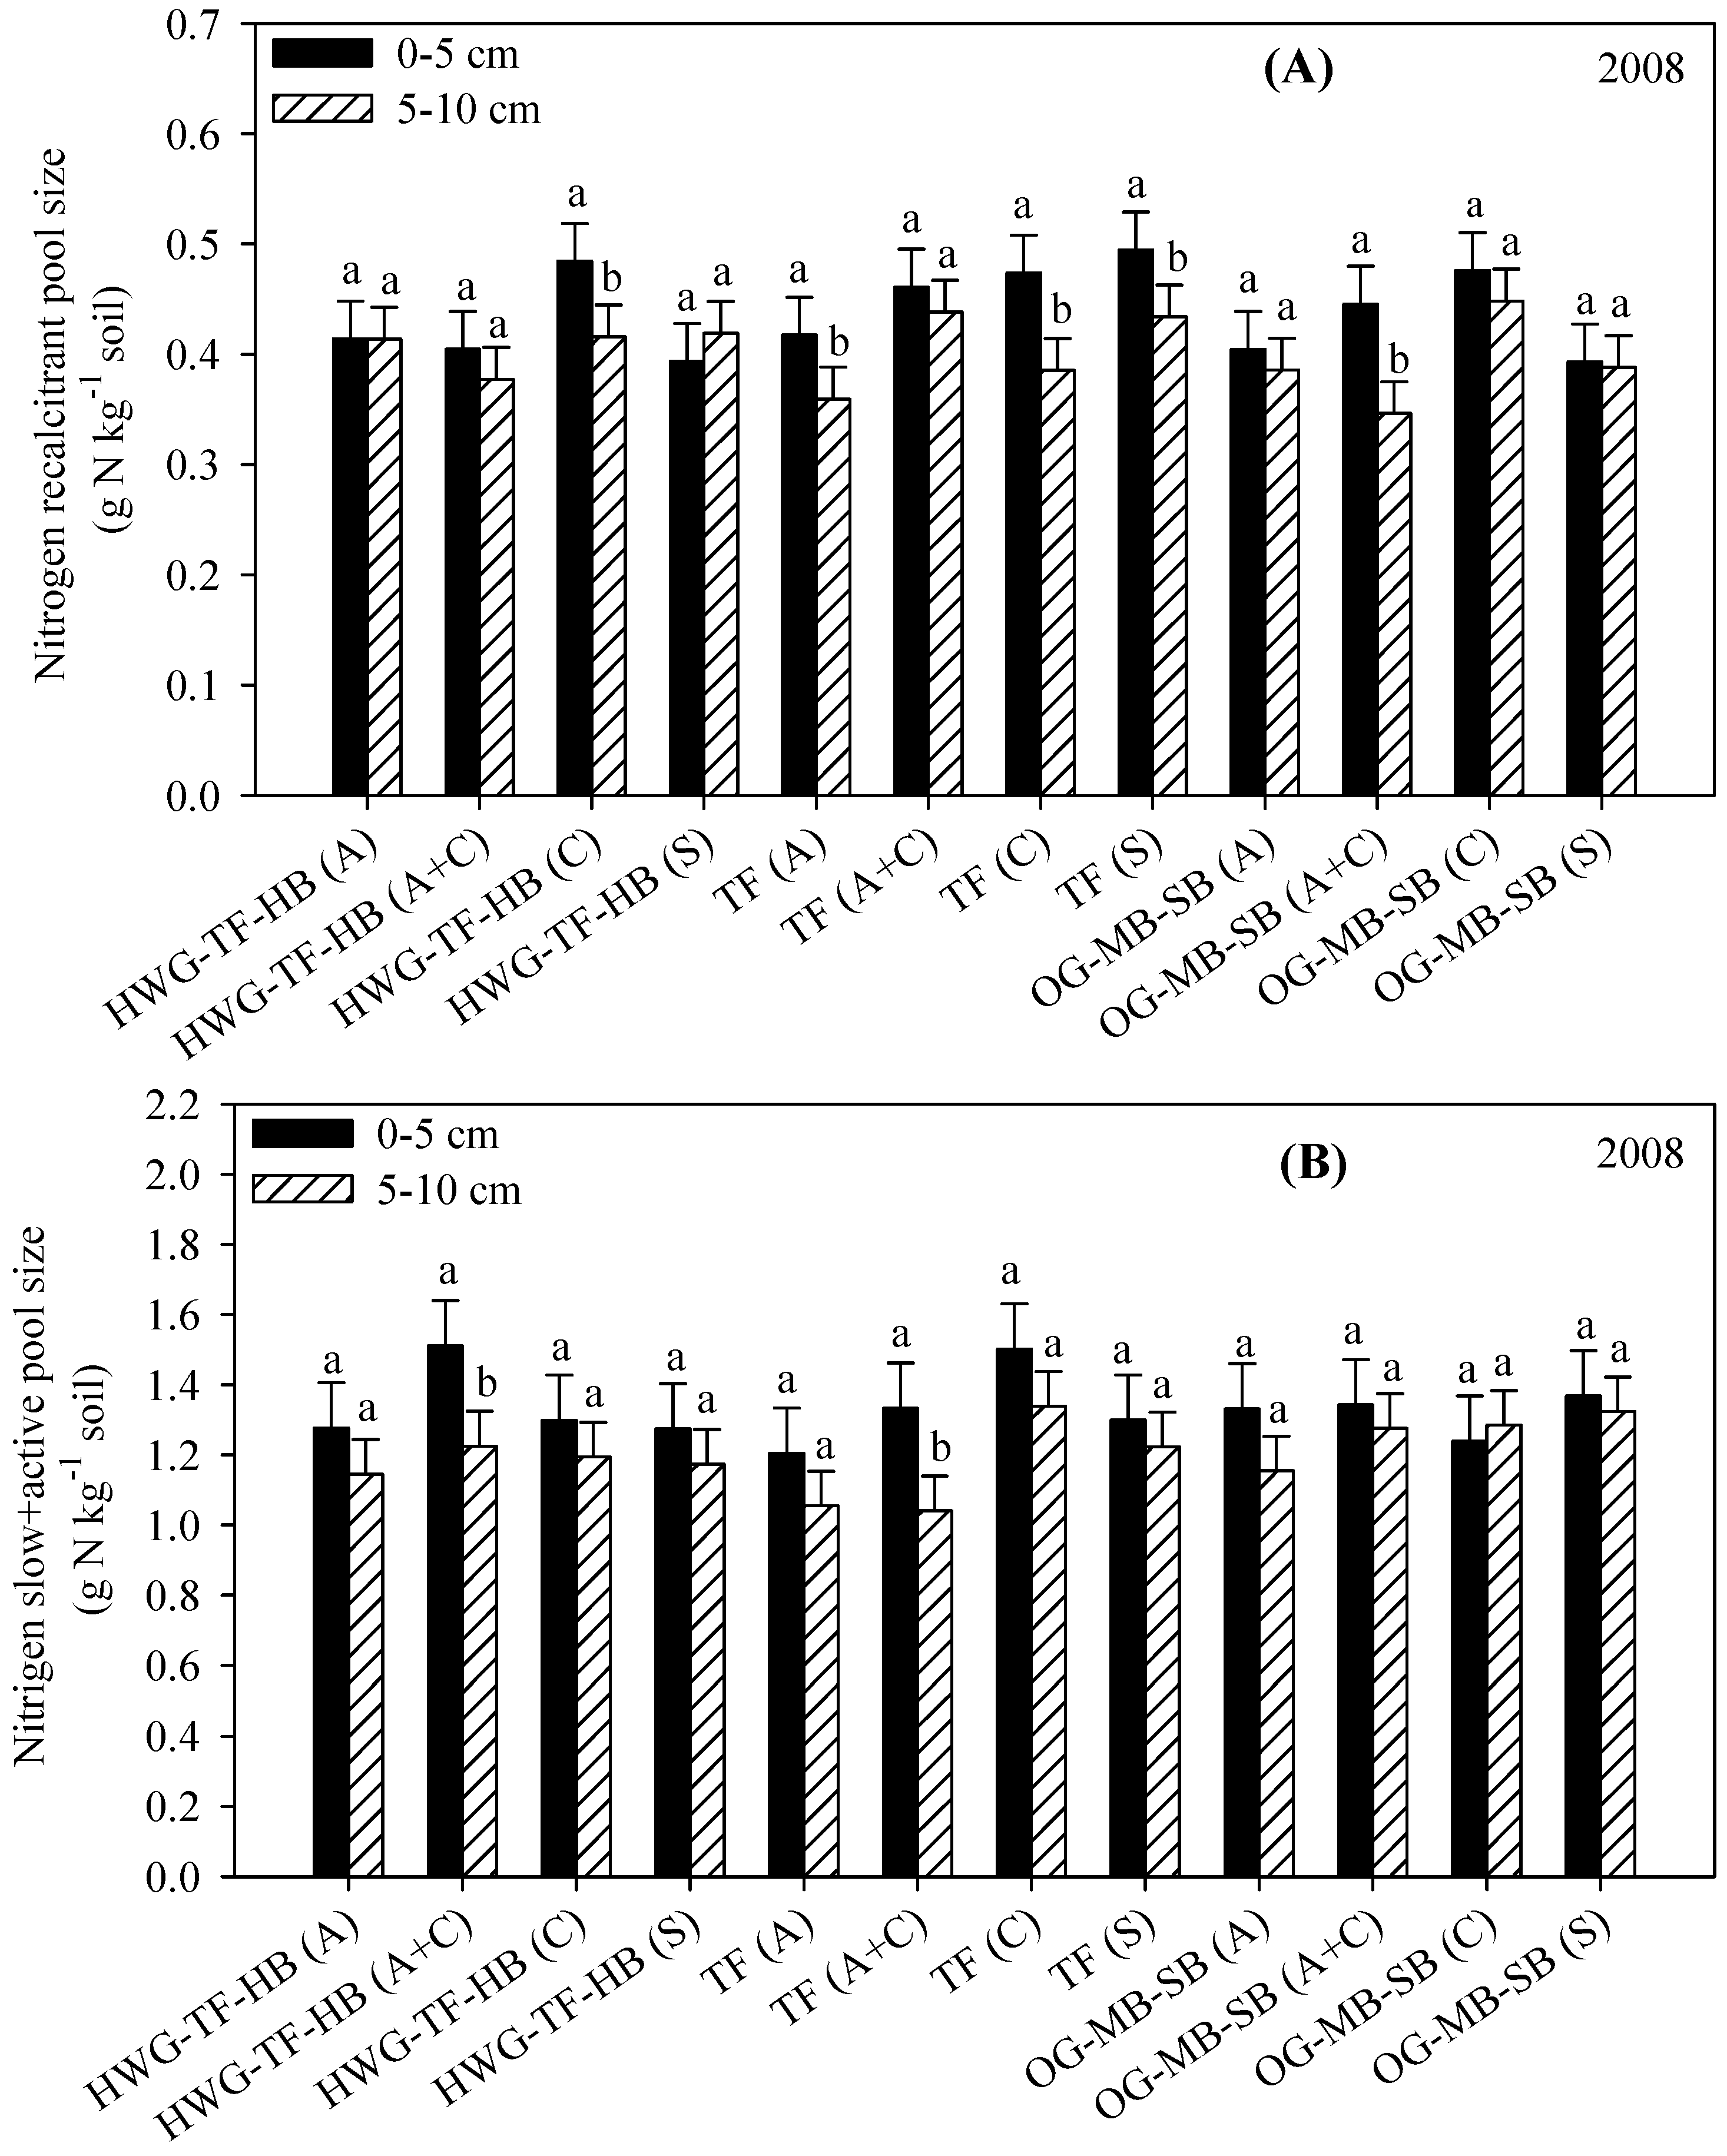
3.4. Resistant (Acid Hydrolysis) and Slow Soil C and N Fractions

The resistant C (Cr) and N (Nr) fractions were chemically evaluated as the residual (nonhydrolyzed) product of acid hydrolysis similar to the approach previously reported by [17,18,47]. The slow C (Cs) fraction was evaluated using Equation (4) whereas the slow + active N (Na+s) fraction was evaluated using Equation (5). The Cr and Cs fractions were significantly influenced by depth in both years (Table 6 and Table 7). In 2008, higher amounts of the Cr and Cs fractions were observed, approximately 11%, at 0–5 cm compared with the 5–10 cm depth (Table 6). A similar pattern between depths with the Cr and Cs fractions was observed in 2009, but with a higher magnitude (Table 7). At the 0–5 cm depth, in 2009, the Cr fraction was higher by approximately 19% while the Cs fraction was approximately 26% higher compared with the 5–10 cm depth (Table 7).
Similarly, the resistant (Nr) fraction was significantly affected by depth in both years (Figure 2A and Figure 3A). A 9% larger Nr fraction was observed in the 0–5 cm depth in 2008 compared to the 5–10 cm depth. In 2009, the Nr fraction was approximately 23% higher at 0–5 cm compared with the 5–10 cm depth. The cumulative effect of the third addition of the CDM before the 2009 sampling period could have contributed to increase the differences in the Cr and Cs fractions and the Nr fraction between the depths studied compared with the two CDM additions that occurred before the 2008 sampling period. The degree of CDM decomposition and the low C and N content of the CDM added in 2009 compared with 2008 could have contributed to the increase in the Cr, Cs, and Nr fractions in the surface 0–5 cm compared with 5–10 cm depth. In addition, irrigation in combination with adequate summer temperatures for microbial decomposition could have also contributed to the increase in the Cr, Cs, and Nr fractions as the mineralization rate of C and N accelerated [48,49] before our field sampling in 2008 and 2009. The no-tillage management practices could also have contributed to the increase in soil C and N fractions in the surface 0–5 cm compared to the 5–10 cm depth due to the exposure of the CDM to irrigation water and ambient summer temperatures. Overall, analysis of our data indicated that soil organic matter decomposition increased in the surface layer and, therefore, increased the accumulation of the Cr, Cs, and Nr fractions compared with the subsurface layer. The differences in decomposition rates between the two studied layers were related to soil temperature, the SOM amount, the C and N content, and types of C such as lignin [17,48,49].
Within the 0–10 cm depth, the Cr fraction represented 40%–41% of total organic C content for both sampling periods (Table 6 and Table 7). Similarly, the Nr fraction represented 22%–25% of the STN content for both sampling periods (Figure 2 and Figure 3). In general, the soil Cr and Nr fractions are fairly stable because non-hydratable materials such as lignin associated with CDM addition, plant residue, and roots are likely to contribute to this fraction, and it has been assumed that this fraction may stay in soil for more than 500 years [17,18,47,48,49]. Although the combination of the Cs and Co (active C) fractions represented approximately 59%–60% of total C, the C distribution between these two fractions changed with sampling period. In this study, the Cs fraction represented approximately 50% in 2008 and 55% in 2009 of total organic C, whereas the Co fraction represented approximately 9% in 2008 and 4.5% in 2009 of total C. These results indicate that the Cs and Co fractions could contribute to the changes in soil C amount and distribution among different fractions as soil and environmental conditions change. The acceleration in the decomposition of the labile fraction associated with the SOM may cause an increase in the resistant C fraction and change in the redistribution of soil C among the fractions [17]. Overall, these data supported our hypothesis that the C and N content of the CDM influenced the C and N distribution among the different fractions.

3.5. Relationship between Soil C and N Fractions

The SOC was significantly correlated with the Co and Cs, but not with the Cr in 2008. However, the SOC was significantly correlated with all the C fractions in 2009 (Table 8). These results indicate that changes in the SOC were sensitive to changes in the amounts of soil Co and Cs fractions in 2008 and sensitive to the changes in all three C fractions (Co, Cs, and Cr) in 2009. These results also indicate that the Co measured after 28 days of incubation was a valuable tool to evaluate short-term changes in the OC in this study environment and management system.
The STN was significantly correlated with the Nmin and Na+s at 0–5 and 5–10 cm in both years, but not with the Nr (Table 9). No correlation was performed between the Nmin and Na+s because the Nmin is part of the Na+s. These results indicate that changes in the STN significantly change the Nmin, and short-term changes in the STN can be evaluated with soil Nmin measurements. These results also indicate that changes in the STN and Nmin were not sensitive to changes in the Nr. In the 0–10 cm depth, the Nmin of STN was approximately 55% in 2008 and approximately 13.6% in 2009 (data not shown). The high ratio of the Nmin to STN in 2008 was probably related to the alfalfa residue mixing and high N content associated with the CDM. These results also supported our hypothesis that organic amendment quality can influence the STN and N in various fractions.

4. Conclusions

Transitioning from conventional forage production system to an organic management system using legumes or CDM as plant nutrient sources requires more than two years to detect the treatment effects on the STN, SOC, and their distribution among different soil organic matter fractions. The soil C and N parameters were significantly different at different soil depth. In this perennial grass, no-till system, all the study parameters were significantly higher in the 0–5 cm soil depth compared with the 5–10 cm soil depth. The C and N content of the CDM addition also influenced soil C and N parameters and their distribution among various fractions. The STN and SOC were highly and significantly correlated with mineralizable and slow fractions, but were not correlated with the recalcitrant fraction. The changes in STN and SOC were apparently highly influenced by the easily mineralizable soil C and N fractions. The low-quality manure added in the second year of the study did not contribute to soil C and N buildup. Our results supported our hypothesis that the C and N content of the added CDM strongly influenced the C and N distribution among different C and N fractions. However, our results did not support the second part of our hypothesis regarding the multiple CDM applications for improving soil C and N and their distribution, which could be related to either (1) the short-term study duration, i.e., two years, or (2) the low C and N amounts in the CDM added in the second year. Therefore, for such a system in transitioning to organic management system, we recommend that (1) the CDM be added based on manure N content and not on total manure amounts to ensure adequate N addition and (2) a longer time be allowed for the system to adjust to the new management system before evaluating treatment benefits.

Acknowledgments

Funds for this project were provided by Aurora Organic Dairy and the Colorado Agricultural Experiment Station.

Author Contributions

Joe E. Brummer and Jessica G. Davis conceived and designed the experiments; Dwi Widiastuti and Tunsisa T. Hurisso performed the field experiments; Dwi Widiastuti performed the laboratory experiments and analyzed the samples; Jessica G. Davis contributed reagents/materials/analysis tools; Maysoon M. Mikha analyzed the data and wrote the paper.

Conflicts of Interest

The authors declare no conflict of interest. The funding sponsors had no role in the design of the study; in the collection, analyses, or interpretation of data; in the writing of the manuscript, and in the decision to publish the results.

References

  1. Economic Research Service. Table 2, Unites State Certified Organic Farmland Acreage, Livestock Numbers, and Farm Operations. Table 4, Certified Organic Producers, Pasture, and Cropland. Number of Certified Operations, by State, 2000–2011. Total Acreage of Certified Organic Pasture and Cropland by State, 1997 and 2000–2011; USDA, Economic Research Service: Washington, DC, USA, 2013. Available online: http://www.ers.usda.gov/data-products/organic-production.aspx (accessed on 24 October 2013).
  2. Sacco, D.; Moretti, B.; Monaco, S.; Grignani, C. Six-year trasition from conventional to organic farming: Effects on crop production and soil quality. Eur. J. Agron. 2015, 69, 10–20. [Google Scholar] [CrossRef]
  3. McBride, W.D.; Greene, C. Characteristics, Costs, and Issues for Organic Dairy Farming; Economic Res. Rep. 82; USDA-Economic Research Service: Washington, DC, USA, 2009. Available online: https://www.ers.usda.gov/webdocs/publications/err82/11004_err82_1_.pdf?v=41079 (accessed on 19 April 2017).
  4. Lui, K.; Hammermeiste, A.M.; Warman, P.R.; Drury, C.F.; Martin, R.C. Assessing soil nitrogen availability in contrasting cropping system at the end of transition to organic production. Can. J. Soil Sci. 2011, 91, 493–501. [Google Scholar]
  5. U.S. Department of Agriculture; National Organic Program. Title 7 Code of Federal Regulations, Part 205; USDA: Washington, DC, USA, 2016. Available online: http://www.ecfr.gov (accessed on 9 May 2016).
  6. Cusick, P.R.; kelling, K.A.; Powell, J.M.; Munoz, G.R. Estimates of residual dairy manure nitrogen availability using various techniques. J. Environ. Qual. 2006, 35, 2170–2177. [Google Scholar] [CrossRef] [PubMed]
  7. Endelman, J.B.; Reeve, J.R.; Drost, D.T. A new decay series for organic crop production. Agron. J. 2010, 102, 457–463. [Google Scholar] [CrossRef]
  8. Cook, J.L.; Brummer, J.E.; Meiman, P.L.; Gourd, T. Colorado Forage Guide Bulletin # 563A, Colorado State University, 2014. Available online: http://www.ext.colostate.edu/sam/forage-guide.pdf (accessed on 19 April 2017).
  9. Lynch, D.H.; Voroney, R.P.; Warman, P.R. Nitrogen availability from composts for humid region perennial grass and legume-grass forage production. J. Environ. Qual. 2004, 33, 1509–1520. [Google Scholar] [CrossRef]
  10. Antil, R.S.; Bar-Tal, A.; Fine, P.; Hadas, A. Predicting nitrogen and carbon mineralization of composted manure and sewage sludge in soil. Compost Sci. Util. 2011, 19, 33–43. [Google Scholar] [CrossRef]
  11. Ros, G.H.; Temminghoff, E.J.M.; Hoffland, E. Nitrogen mineralization: A review and meta-analysis of the predictive value of soil test. Eur. J. Soil Sci. 2011, 62, 162–173. [Google Scholar] [CrossRef]
  12. Wander, M. Soil organic matter fractions and their relevance to soil function. In Soil Organic Matter in Sustainable Agriculture; Magdoff, F., Weil, R.R., Eds.; CRC Press: Boca Raton, FL, USA, 2004; pp. 67–102. [Google Scholar]
  13. Davidson, E.A.; Janssens, J.A. Temperature sensitivity of soil carbon decomposition and feedbacks to climate change. Nature 2006, 440, 165–173. [Google Scholar] [CrossRef] [PubMed]
  14. Ros, G.H.; Hanegraaf, M.C.; Hoffland, E.; van-Riemsdijk, W.H. Predicting soil N mineralization: Relavence of organic matter fractions and soil properties. Soil Biol. Biochem. 2011, 43, 1714–1722. [Google Scholar] [CrossRef]
  15. Olk, D.C.; Gregorich, E.G. Overview of the symposium proceedings, Meaningful pools in determining soil carbon and nitrogen dynamics. Soil Sci. Soc. Am. J. 2006, 70, 967–974. [Google Scholar] [CrossRef]
  16. Smith, P.; Smith, J.U.; Powlson, D.S.; McGill, W.B.; Arah, J.R.M.; Chertov, O.G.; Coleman, K.; Franko, U.; Frolking, S.; Jenkinson, D.S.; et al. A comparison of the performance of nine soil organic matter models using datasets from seven long-term experiments. Geoderma 1997, 81, 153–225. [Google Scholar] [CrossRef]
  17. Collins, H.P.; Elliott, E.T.; Paustian, K.; Bundy, L.G.; Dick, W.A.; Hunggins, D.R.; Smucker, A.J.M.; Paul, E.A. Soil carbon pools and fluxes in long-term corn belt agroecosystems. Soil Biol. Biochem. 2000, 32, 157–168. [Google Scholar] [CrossRef]
  18. Paul, E.A.; Morris, S.J.; Conant, R.T.; Plante, A.F. Does the acid hydrolysis-incubation method measure meaningful soil organic carbon pool? Soil Sci. Soc. Am. J. 2006, 70, 1023–1035. [Google Scholar] [CrossRef]
  19. Belay-Tedla, A.; Zhou, X.; Su, B.; Wan, S.; Luo, Y. Labile, recalcitrant, and microbial carbon and nitrogen pools of tallgrass prairie soil in the US Great Plains subjected to experimental warming and clipping. Soil Biol. Biochem. 2009, 41, 110–116. [Google Scholar] [CrossRef]
  20. Jha, P.; De, A.; Lakaria, B.J.; Biswas, A.K.; Singh, M.; Reddy, K.S.; Rao, A.S. Soil carbon pools, mineralization and flexes associated with land use changes in vertisols of the central India. Natl. Acad. Sci. Lett. 2012, 35, 475–483. [Google Scholar] [CrossRef]
  21. Dungait, J.A.J.; Hopkins, D.W.; Gregory, A.S.; Whitmore, A.P. Soil organic matter turnover is governed by accessibility not recalcitrance. Glob. Chang. Biol. 2012, 18, 1781–1796. [Google Scholar] [CrossRef]
  22. National Climatic Data Center. 2005. Available online: http://www.ncdc.noaa.gov/cdo-web/datasets/ANNUAL/stations/COOP:053005/detail (accessed on 19 April 2017).
  23. National Resources Conservation Service (NRCS). Fort Collins Series. Available online: https://soilseries.sc.egov.usda.gov/OSD_Docs/F/FORT_COLLINS.html (accessed on 19 April 2017).
  24. Hurisso, T.T.; Davis, J.G.; Brummer, J.E.; Stromberger, M.E.; Mikha, M.M.; Haddix, M.L.; Booher, M.R.; Paul, E.A. Rapid changes in microbial biomass and aggregate size distribution in response to changes in organic matter management in grass pasture. Geoderma 2013, 193, 68–75. [Google Scholar] [CrossRef]
  25. Nelson, D.W.; Sommers, L.E. Total carbon, organic carbon, and organic matter. In Methods of Soil Analysis; Part 3: Chemical Methods-SSSA Book Series No. 5; Sparks, D.L., Page, A.L., Helmke, P.A., Loeppert, R.H., Soltanpour, P.N., Tabatabai, M.A., Johnston, C.T., Sumner, M.E., Eds.; SSSA Inc.: Madison, WI, USA, 1996; pp. 961–1010. [Google Scholar]
  26. Franzluebbers, A.J.; Haney, R.L.; Honeycutt, C.W.; Schomber, H.H.; Hons, F.M. Flush of carbon dioxide following reweting of dried soil relates to active organic pools. Soil Sci. Soc. Am. J. 2000, 64, 613–623. [Google Scholar] [CrossRef]
  27. Mikha, M.M.; Rice, C.W. Tillage and manure effects on soil and aggregate-associated carbon and nitrogen. Soil Sci. Soc. Am. J. 2004, 68, 809–816. [Google Scholar] [CrossRef]
  28. Mikha, M.M.; Rice, C.W.; Milliken, G.A. Carbon and nitrorgen mineralization as affected by drying and wetting cycles. Soil Biol. Biochem. 2005, 37, 339–347. [Google Scholar] [CrossRef]
  29. Stanford, G.; Smith, S.J. Nitrogen mineralization potentials of soil. Soil Sci. Soc. Am. Proc. 1972, 36, 465–472. [Google Scholar] [CrossRef]
  30. Molina, J.A.E.; Clapp, E.C.; Larson, W.E. Potential mineralizable nitrogen in soil: The simple exponential model does not apply for the first 12 weeks of incubation. Soil Sci. Soc. Am. J. 1980, 44, 442–443. [Google Scholar] [CrossRef]
  31. Davidson, E.A.; Eckert, R.W.; Hart, S.C.; Firestone, M.K. Direct extraction of microbial biomass nitrogen from forest and grassland soils of California. Soil Biol. Biochem. 1989, 21, 773–778. [Google Scholar] [CrossRef]
  32. Bundy, L.G.; Meisinger, J.J. Nitrogen availability indices. In Methods of Soil Analysis; Part 2: Microbiological and Biochemical Properties-SSSA Book Series No. 5; Weaver, R.W., Angle, S., Bottomley, P., Bezdicek, D., Smith, S., Tabatabai, A., Wollum, A., Eds.; SSSA Inc.: Madison, WI, USA, 1994; pp. 951–984. [Google Scholar]
  33. Hart, S.C.; Stark, J.M.; Davidson, E.A.; Firestone, M.K. Nitrogen mineralization, immobilization, and nitrification. In Methods of Soil Analysis; Part 2: Microbiological and Biochemical Properties-SSSA Book Series No. 5; Weaver, R.W., Angle, S., Bottomley, P., Bezdicek, D., Smith, S., Tabatabai, A., Wollum, A., Eds.; SSSA Inc.: Madison, WI, USA, 1994; pp. 985–1018. [Google Scholar]
  34. Plante, A.F.; Conant, R.T.; Paul, E.A.; Paustian, K.; Six, J. Acid hydrolysis of easily dispersed and microaggregate-derived silt- and clay-sized fractions to isolate resistant soil organic matter. Eur. J. Soil Sci. 2006, 57, 456–467. [Google Scholar] [CrossRef]
  35. SAS Institute. SAS/STAT User’s Guide; Version 9.3; SAS Inc.: Cary, NC, USA, 2010. [Google Scholar]
  36. Fan, J.; Ding, W.; Xiang, J.; Qin, S.; Zhang, J.; Ziadi, N. Carbon sequestration in an intensively cultivated candy loam soil in the north China plain as affected by compost and inorganic fertilizer application. Geoderma 2014, 230, 22–28. [Google Scholar] [CrossRef]
  37. Kaur, T.; Brar, B.S.; Dhillo, N.S. Soil organic matter dynamics as affected by long-term use of organic and inorganic fertilizers under maize-wheat cropping system. Nutr. Cycl. Agroecosyst. 2008, 81, 59–69. [Google Scholar] [CrossRef]
  38. Mikha, M.M.; Hergert, G.W.; Benjamin, J.G.; Jabro, J.D.; Nielsen, R.A. Long-term manure impacts on soil aggregates and aggregate-associated carbon and nitrogen. Soil Sci. Soc. Am. 2015, 79, 626–636. [Google Scholar] [CrossRef]
  39. McDonald, N.T.; Watson, C.J.; Lalor, S.T.J.; Laughlin, R.J.; Wall, D.P. Evaluation of soil test for predicting nitrogen mineralization in temperate grassland soils. Soil Sci. Soc. Am. 2014, 78, 1051–1064. [Google Scholar] [CrossRef]
  40. Hurisso, T.T.; Davis, J.G.; Brummer, J.E.; Stromberger, M.E.; Mikha, M.M.; Booher, M.R. Short-term nitrogen mineralization during transition from conventional to organic management is unchanged by composted dairy manure addition in perennial forage. Org. Agric. 2012, 2, 219–232. [Google Scholar] [CrossRef]
  41. Saviozzi, A.; Vanni, G.; Cardelli, R. Carbon mineralization kinetics in soils under urban environment. Appl. Soil Ecol. 2014, 73, 64–69. [Google Scholar] [CrossRef]
  42. Dind, X.; Han, X.; Liang, Y.; Qiao, Y.; Li, L.; Li, N. Changes in soil organic carbon pools after 10 years of continue manuring combined with chemical fertilizer in a Mollisol in China. Soil Tillage Res. 2012, 122, 36–41. [Google Scholar]
  43. Cavalli, D.; Bechini, L.; Gallina, P.M. Measurinh and modeling soil carbon respiration following repeated dairy slurry application. Soil Sci. Soc. Am. 2014, 78, 1414–1425. [Google Scholar] [CrossRef]
  44. Mikha, M.M.; Rice, C.W.; Benjamin, J.G. Estimating soil mineralizable nitrogen under different management practices. Soil Sci. Soc. Am. 2006, 70, 1522–1531. [Google Scholar] [CrossRef]
  45. Rabbi, S.M.F.; Wilson, B.R.; Lockwood, P.V.; Daniel, H.; Young, I.M. Soil organic carbon mineralization rates in aggregates under contrasting land uses. Geoderma 2014, 216, 10–18. [Google Scholar] [CrossRef]
  46. En, C.; Al-Kaisi, M.M.; Liange, W.; Changhuuan, D.; Deti, X. Soil organic carbon mineralization as affected by cyclical temperature fluctuation in a Karst region of southwestern China. Pedosphere 2015, 25, 512–523. [Google Scholar]
  47. Paul, E.A.; Morris, S.J.; Bohm, S. The determination of soil C pools sizes and turnover rates: Biophysical fractionation and traces. In Assessment Methods Soil Carbon; Kimble, J.M., Follett, R.F., Stewart, B.A., Eds.; CRC Press: Boca Raton, FL, USA, 2001; pp. 193–205. [Google Scholar]
  48. Collins, H.P.; Smith, J.L.; Fransen, S.; Alva, A.K.; Kruger, C.E.; Granatstein, D.M. Carbon sequestration under irrigated switchgrass (Panicum virgatum L.) production. Soil Sci. Soc. Am. J. 2010, 74, 2049–2058. [Google Scholar] [CrossRef]
  49. Kendall, R.A.J.; Long, D.S.; Collins, H.P.; Pierce, F.J.; Chatterjee, A.; Smith, J.L.; Young, S.L. Soiln carbon dynamics of transition to pasific northwest cellulosic ethanol feedstock production. Soil Sci. Soc. Am. 2015, 79, 272–281. [Google Scholar] [CrossRef]
Figure 1. Soil net nitrogen mineralization as influenced by different grasses and nitrogen treatments for 2008 (A) and 2009 (B) at 0–5 and 5–10 cm soil depths. Grasses: HWG-TF-HB = Hybrid Wheatgrass-Tall Fescue-Hybrid Brome; TF = Tall Fescue; and OG-MB-SB = Orchard grass-Meadow Brome-Smooth Brome. Nitrogen sources: A = alfalfa; A + C = combination of alfalfa + composted dairy manure at 22 Mg ha−1; A + RC = combination of alfalfa + residual composted dairy manure; Co represents no composted dairy manure; C11 = composted dairy manure at 11.2 Mg ha−1; C22 = composted dairy manure at 22.4 Mg ha−1; and S = sainfoin. The different lowercase letters represent significant differences between the depths studied within each year (p < 0.05). Error bars represent the standard error of the mean.
Agriculture 07 00037 g001
Figure 2. The 2008 soil resistant nitrogen pool (A) and the combination of slow + active nitrogen pools (B) as influenced by different grasses and nitrogen treatments at 0–5 and 5–10 cm soil depths. Grasses: HWG-TF-HB = Hybrid Wheatgrass-Tall Fescue-Hybrid Brome; TF = Tall Fescue; and OG-MB-SB = Orchard grass-Meadow Brome-Smooth Brome. Nitrogen sources: A = alfalfa; A + C = the combination of alfalfa + composted dairy manure at 22.4 Mg ha−1; C = composted dairy manure at 22.4 Mg ha−1; and S = sainfoin. The different lowercase letters represent significant differences between depths within each treatment and nitrogen pool (p < 0.05). Error bars represent the standard error of the mean.
Agriculture 07 00037 g002
Figure 3. The 2009 soil recalcitrant nitrogen pool (A), and the combination of slow + active nitrogen pools (B) influenced by different grasses and nitrogen treatments at 0–5 and 5–10 cm depth. The HW-TF-HR represents Hybrid Wheatgrass-Tall Fescue-Hybrid Brome; TF represent Tall Fescue grass; OG-MB-SB represents Orchard grass-Meadow Brome-Smooth Brome. The nitrogen sources were (A) represent alfalfa (legume); (A + RC) represents the combination of alfalfa + residual compost dairy manure; (Co) represents no compost addition; (C11) represents compost dairy manure addition at 11.2 Mg ha−1; (C22) represents compost dairy manure addition at 22.4 Mg ha−1, and (S) represents Sainfoin (legume). The different lowercase letters represent significant differences between depths within each treatment and nitrogen pool (p < 0.05). The active + slow N (Na+s) fraction was influenced by depth but not by treatment in both years (Figure 2B and Figure 3B). A significantly higher Na+s fraction was observed in the 0–5 cm depth compared with the 5–10 cm depth due to no tillage practice and a lack of soil disturbance after the CDM addition. The magnitude of the difference in the Na+s fraction between depths was approximately 2-fold higher in 2009 compared with 2008. The greater differences in the Na+s fraction between the study periods were again related to the continuous surface CDM addition, three CDM additions before 2009, compared with two CDM additions before the 2008 sampling.
Agriculture 07 00037 g003
Table 1. Species, varieties, and seeding rates of grasses and legumes used in the study.
SpeciesScientific NameVarietySeeding Rate kg ha−1
(WG-TF-B)
Hybrid wheatgrassElymus hoffmainni K.B. Jensen & K.H. Asay’Newhy’9.0
Tall fescueFestuca arundinacea Schreb.’Fawn’ Endophyte-free7.3
Hybrid bromeBromus inermis Leyss. x beibersteinii Roem. & Schult.’Bigfoot’10.1
(OG-MB-SB)
OrchardgrassDactylis glomerata L.’Crown Royale’3.3
Meadow bromeBromus biebersteinii Roem. & Schult.'Paddock'11.2
Smooth bromeBromus inermis Leyss.‘Lincoln’5.6
Legumes
AlfalfaMedicago sativa L.‘Ranger’9.0
SainfoinOnobrychis viciaefolia Scop.‘Sandhills’22.4
Table 2. Soil organic carbon (SOC) and total N (STN) as influenced by grass mix and nitrogen source at two depths (0–5 and 5–10 cm) in 2008.
TreatmentNitrogen SourceSOCSTN
Soil Depth (cm)
0–55–100–55–10
g kg−1
HWG-TF-HB Sainfoin13.38 a §13.96 a1.67 a1.59 a
TF ††Sainfoin14.99 a13.33 a1.79 a1.66 a
OG-MB-SB Sainfoin14.55 a13.83 a1.76 a1.71 a
HWG-TF-HBAlfalfa14.15 a13.58 a1.69 a1.56 a
TFAlfalfa13.38 a10.52 b1.62 a1.42 b
OG-MB-SBAlfalfa14.00 a11.58 b1.74 a1.54 b
HWG-TF-HBCompost 14.67 a12.68 b1.78 a1.61 a
TFCompost 16.18 a14.03 b1.98 a1.72 b
OG-MB-SBCompost 14.68 a13.41 a1.72 a1.73 a
HWG-TF-HBAlfalfa + Compost16.15 a13.06 b1.92 a1.60 b
TFAlfalfa + Compost16.17 a11.33 b1.79 a1.48 b
OG-MB-SBAlfalfa + Compost15.69 a12.30 b1.79 a1.62 a
PR > F
Treatment 0.35870.5570
Depth (cm) <0.0001<0.0001
0–5 14.83 a1.77 a
5–10 12.80 b1.60 b
Treatment × Depth0.78570.3278
Hybrid Wheatgrass-Tall Fescue-Hybrid Brome; †† Tall Fescue; Orchard grass-Meadow Brome-Smooth Brome; § Lowercase letters represent significant differences between depths (0–5 and 5–10 cm) within each parameter; Composted dairy manure added at 22.4 Mg ha−1.
Table 3. Soil organic carbon (SOC) and total N (STN) as influenced by grass mix and nitrogen sources at two depths (0–5 and 5–10 cm) in 2009.
TreatmentNitrogen SourceSOCSTN
Soil Depth (cm)
0–55–100–55–10
g kg−1
HWG-TF-HB Sainfoin13.30 a §10.61 b1.60 a1.26 b
TF ††Sainfoin13.99 a10.84 b1.58 a1.35 b
OG-MB-SB Sainfoin14.82 a10.86 b1.69 a1.38 b
HWG-TF-HBAlfalfa14.45 a10.82 b1.56 a1.39 a
TFAlfalfa13.24 a10.90 b1.53 a1.43 a
OG-MB-SBAlfalfa12.94 a10.10 b1.59 a1.32 b
HWG-TF-HBCompost (0 Mg ha−1) 15.85 a11.63 b1.86 a1.45 b
TFCompost (0 Mg ha−1)15.58 a12.36 b1.80 a1.49 b
OG-MB-SBCompost (0 Mg ha−1)15.94 a11.23 b1.92 a1.42 b
HWG-TF-HBCompost (11.2 Mg ha−1)15.11 a11.35 b1.75 a1.32 b
TFCompost (11.2 Mg ha−1)15.55 a10.89 b1.88 a1.31 b
OG-MB-SBCompost (11.2 Mg ha−1)15.10 a10.96 b1.65 a1.40 b
HWG-TF-HBCompost (22.4 Mg ha−1)12.94 a11.43 a1.42 a1.35 a
TFCompost (22.4 Mg ha−1)14.43 a11.67 b1.70 a1.45 b
OG-MB-SBCompost (22.4 Mg ha−1)15.46 a11.35 b1.68 a1.40 b
HWG-TF-HBAlfalfa + Compost (R) ‡‡15.49 a11.72 b1.75 a1.40 b
TFAlfalfa + Compost (R)15.96 a10.26 b1.74 a1.27 b
OG-MB-SBAlfalfa + Compost (R)14.21 a11.20 b1.71 a1.40 b
PR > F
Treatment 0.28590.3442
Depth (cm) <0.0001<0.0001
0–5 14.67 a1.69 a
5–10 11.12 b1.38 b
Treatment × Depth0.46560.2374
Hybrid Wheatgrass-Tall Fescue-Hybrid Brome; †† Tall Fescue; Orchard grass-Meadow Brome-Smooth Brome; § Lowercase letters represent significant differences between depths (0–5 and 5–10 cm) within each parameter; Composted dairy manure at different rates (0, 11.2, and 22.4 Mg ha−1); ‡‡ Residual compost dairy manure.
Table 4. Potential mineralizable carbon (Co) and mineralization rate constant (kc) as influenced by grass mix and nitrogen source at two depths (0–5 and 5–10 cm) in 2008.
TreatmentNitrogen SourcePotential Mineralizable C (Co)Mineralization Rate Constant (kc)
Soil Depth (cm)
0–55–100–55–10
mg kg−1day−1
HWG-TF-HB Sainfoin1029.9 a §680.0 a0.0304 a0.0426 a
TF ††Sainfoin1600.2 a943.3 b0.0188 a0.0321 a
OG-MB-SB Sainfoin1399.4 a939.1 a0.0255 a0.0328 a
HWG-TF-HBAlfalfa1408.1 a1055.6 a0.0273 a0.0266 a
TFAlfalfa1255.1 a853.0 a0.0275 a0.0384 a
OG-MB-SBAlfalfa1480.8 a1076.4 a0.1066 a0.0318 a
HWG-TF-HBCompost 1355.6 a784.1 b0.0852 a0.0370 a
TFCompost 1995.2 a983.3 b0.0196 a0.0297 a
OG-MB-SBCompost 1887.4 a1056.5 b0.0213 a0.0274 a
HWG-TF-HBAlfalfa + Compost1456.6 a997.3 a0.0226 a0.0331 a
TFAlfalfa + Compost1742.7 a967.3 b0.0223 a0.0317 a
OG-MB-SBAlfalfa + Compost1710.4 a907.3 b0.0227 a0.3470 a
PR > F
Treatment 0.46640.5170
Depth (cm) <0.00010.7663
0–5 1526.8 a0.0365 a
5–10 936.9 b0.0332 a
Treatment × Depth0.78570.5859
Hybrid Wheatgrass-Tall Fescue-Hybrid Brome; †† Tall Fescue; Orchard grass-Meadow Brome-Smooth Brome; § Lowercase letters represent significant differences between depths (0–5 and 5–10 cm) within each parameter; Composted dairy manure added at 22.4 Mg ha−1.
Table 5. Potential mineralizable carbon (Co) and mineralization rate constant (kc) as influenced by grass mix and nitrogen source at two depths (0–5 and 5–10 cm) in 2009.
TreatmentNitrogen SourcePotential Mineralizable C (Co)Mineralization Rate Constant (kc)
Soil Depth (cm)
0–55–100–55–10
mg kg−1 day−1
HWG-TF-HB Sainfoin788.3 a §378.6 b0.0445 a0.0593 a
TF ††Sainfoin615.8 a321.0 a0.0670 a0.0668 a
OG-MB-SB Sainfoin720.0 a383.8 b0.0554 a0.0533 a
HWG-TF-HBAlfalfa725.3 a361.8 b0.0467 a0.0638 a
TFAlfalfa924.3 a341.4 b0.0440 a0.0665 a
OG-MB-SBAlfalfa852.9 a450.9 b0.0485 a0.0524 a
HWG-TF-HBCompost (0 Mg ha−1) 829.3 a344.1 b0.0538 a0.0630 a
TFCompost (0 Mg ha−1)934.8 a360.6 b0.0411 b0.0679 a
OG-MB-SBCompost (0 Mg ha−1)1196.3 a337.5 b0.0474 a0.0632 a
HWG-TF-HBCompost (11.2 Mg ha−1)892.8 a403.4 b0.0464 a0.0568 a
TFCompost (11.2 Mg ha−1)596.0 a379.0 a0.0595 a0.0594 a
OG-MB-SBCompost (11.2 Mg ha−1)707.5 a344.0 b0.0790 a0.0547 a
HWG-TF-HBCompost (22.4 Mg ha−1)729.9 a394.7 b0.0597 a0.0626 a
TFCompost (22.4 Mg ha−1)842.3 a380.2 b0.0471 a0.0596 a
OG-MB-SBCompost (22.4 Mg ha−1)728.5 a424.9 a0.0706 a0.0505 a
HWG-TF-HBAlfalfa + Compost (R) ‡‡911.9 a277.6 b0.0450 b0.0702 a
TFAlfalfa + Compost (R)977.7 a372.2 b0.0450 a0.0631 a
OG-MB-SBAlfalfa + Compost (R)1023.5 a343.3 b0.0317 b0.0579 a
PR > F
Treatment 0.76300.6113
Depth (cm) <0.00010.0043
0–5 833.2 a0.0518 b
5–10 366.6 b0.0606 a
Treatment × Depth0.46560.2280
Hybrid Wheatgrass-Tall Fescue-Hybrid Brome; †† Tall Fescue; Orchard grass-Meadow Brome-Smooth Brome; § Lowercase letters represent significant differences between depths (0–5 and 5–10 cm) within each parameter; Composted dairy manure at different rates (0, 11.2, and 22.4 Mg ha−1); ‡‡ Residual composted dairy manure.
Table 6. The effect of grass mix and nitrogen source on soil organic carbon (SOC) in different carbon pools (resistant and slow) at two depths (0–5 and 5–10 cm) in 2008.
TreatmentNitrogen SourceResistant C Pool (Cr)Slow C Pool (Cs)
Soil Depth (cm)
0–55–100–55–10
g kg−1g kg−1
HWG-TF-HB Sainfoin5.23 a§5.14 a7.11 a8.14 a
TF ††Sainfoin7.03 a5.20 b6.37 a7.19 a
OG-MB-SB Sainfoin5.13 a6.00 a8.02 a6.90 a
HWG-TF-HBAlfalfa6.68 a6.20 a6.07 a6.33 a
TFAlfalfa5.28 a4.85 a6.84 a4.82 a
OG-MB-SBAlfalfa5.17 a4.69 a7.35 a5.81 a
HWG-TF-HBCompost 6.25 a4.58 b7.07 a7.32 a
TFCompost6.00 a4.79 b8.19 a8.25 a
OG-MB-SBCompost6.72 a5.72 a6.07 a6.63 a
HWG-TF-HBAlfalfa + Compost6.08 a6.17 a8.61 a5.89 b
TFAlfalfa + Compost5.06 a4.75 a9.65 a5.61 b
OG-MB-SBAlfalfa + Compost6.43 a5.17 b7.55 a6.21 a
PR > F
Treatment 0.49110.6140
Depth (cm) 0.00020.028
0–5 5.92 a7.382 a
5–10 5.27 b6.592 b
Treatment × Depth0.04810.1352
Hybrid Wheatgrass-Tall Fescue-Hybrid Brome; †† Tall Fescue; Orchard grass-Meadow Brome-Smooth Brome; § Lowercase letters represent significant differences between depths (0–5 and 5–10 cm) within each parameter; Composted dairy manure at different rates (0, 11.2, and 22.4 Mg ha−1).
Table 7. The effect of grass mix, different nitrogen sources, and different dairy compost rates on soil organic carbon (SOC) in different carbon pools (resistant and slow) at two depths (0–5 and 5–10 cm) in 2009.
TreatmentNitrogen SourceResistant C Pool (Cr)Slow C Pool (Cs)
Soil Depth (cm)
0–55–100–55–10
g kg−1 g kg−1
HWG-TF-HB Sainfoin4.68 a §4.85 a7.83 a5.39 b
TF ††Sainfoin5.14 a6.07 a8.23 a5.45 b
OG-MB-SB Sainfoin4.56 a4.20 a9.53 a6.28 b
HWG-TF-HBAlfalfa4.95 a4.79 a8.48 a5.66 b
TFAlfalfa5.01 a4.43 a7.30 a6.13 a
OG-MB-SBAlfalfa5.35 a3.81 b6.74 a5.84 a
HWG-TF-HBCompost (0 Mg ha−1) 5.64 a3.95 b9.38 a7.33 b
TFCompost (0 Mg ha−1)5.20 a4.05 a9.44 a7.93 a
OG-MB-SBCompost (0 Mg ha−1)6.83 a4.89 b7.91 a6.00 a
HWG-TF-HBCompost (11.2 Mg ha−1)8.01 a4.42 b6.20 a6.53 a
TFCompost (11.2 Mg ha−1)6.24 a5.06 a8.72 a5.45 b
OG-MB-SBCompost (11.2 Mg ha−1)5.36 a5.54 a9.03 a5.08 b
HWG-TF-HBCompost (22.4 Mg ha−1)5.43 a3.86 b6.78 a7.17 a
TFCompost (22.4 Mg ha−1)6.97 a5.73 a6.62 a5.56 a
OG-MB-SBCompost (22.4 Mg ha−1)6.43 a5.64 a8.30 a5.29 b
HWG-TF-HBAlfalfa + Compost (R) ‡‡5.61 a4.62 a8.97 a6.82 b
TFAlfalfa + Compost (R)5.78 a3.92 b9.21 a4.96 b
OG-MB-SBAlfalfa + Compost (R)4.87 a4.29 a8.32 a6.57 a
PR > F
Treatment 0.0040.3226
Depth (cm) <0.0001<0.0001
0–5 5.671 a8.166 a
5–10 4.618 b6.081 b
Treatment × Depth0.10990.1085
Hybrid Wheatgrass-Tall Fescue-Hybrid Brome; †† Tall Fescue; Orchard grass-Meadow Brome-Smooth Brome; § Lowercase letters represent significant differences between depths (0–5 and 5–10 cm) within each parameter; Composted dairy manure at different rates (0, 11.2, and 22.4 Mg ha−1); ‡‡ Residual composted dairy manure.
Table 8. Pearson correlation coefficients (r) representing associations among soil carbon pools as influenced by depths (0–5 and 5–10 cm) in 2008 (n = 36) and 2009 (n = 54).
MeasurementSOCCoCs
2008
0–5 cm
Soil organic C (SOC)
Mineralizable C (Co)0.4428 **
Slow C (Cs)0.6770 ***−0.0797
Resistant C (Cr)0.24420.3239 *−0.5022 **
5–10 cm
Soil organic C (SOC)
Mineralizable C (Co)0.1372
Slow C (Cs)0.7517 ***−0.0885
Resistant C (Cr)0.30660.1781−0.3900 *
2009
0–5 cm
Soil organic C (SOC)
Mineralizable C (Co)0.3856 **
Slow C (Cs)0.7588 ***0.1182
Resistant C (Cr)0.2857 *0.1645−0.3905 **
5–10 cm
Soil organic C (SOC)
Mineralizable C (Co)−0.3843 **
Slow C (Cs)0.6823 ***−0.2953 *
Resistant C (Cr)0.3001 *−0.1369−0.4906 ***
* Significant correlation at p < 0.05; ** Significant correlation at p < 0.01; *** Significant correlation at p < 0.001.
Table 9. Pearson correlation coefficients (r) representing associations among soil nitrogen pools as influenced by depths (0–5 and 5–10 cm) in 2008 (n = 36) and 2009 (n = 54).
MeasurementSTNNminNa+s
2008
0–5 cm
Soil Total N (STN)
Mineralizable N (Nmin)0.8177 ***
Active + Slow N (Na+s)0.9649 ***
Resistant N (Nr)0.24420.2880−0.0189
5–10 cm
Soil Total N (STN)
Mineralizable N (Nmin)0.5895 ***
Active + Slow N (Na+s)0.9697 ***
Resistant N (Nr)0.27100.16720.0278
2009
0–5 cm
Soil Total N (STN)
Mineralizable N (Nmin)0.3249 **
Active + Slow N (Na+s)0.9114 ***
Resistant N (Nr)0.15590.0680−0.2645 *
5–10 cm
Soil Total N (STN)
Mineralizable N (Nmin)0.6122 ***
Active + Slow N (Na+s)0.9166 ***
Resistant N (Nr)0.21410.2752 *−0.1942
* Significant correlation at p < 0.05; ** Significant correlation at p < 0.01; *** Significant correlation at p < 0.001.

