Article

Net Greenhouse Gas Budget and Soil Carbon Storage in a Field with Paddy–Upland Rotation with Different History of Manure Application

1
Faculty of Bioresource Sciences, Akita Prefectural University, 241-438 Aza Kaidobata-Nishi, Shimoshinjo Nakano, Akita 010-0195, Japan
2
Akita Prefectural Agricultural Experiment Station, 34-1, Aza Genpachizawa, Yuwa Aikawa, Akita 010-1231, Japan
*
Author to whom correspondence should be addressed.
Agriculture 2017, 7(6), 49; https://doi.org/10.3390/agriculture7060049
Submission received: 28 February 2017 / Revised: 7 June 2017 / Accepted: 8 June 2017 / Published: 10 June 2017
(This article belongs to the Special Issue C and N Cycling and Greenhouse Gas Emissions in Agroecosystem)

Abstract

:
Methane (CH4) and nitrous oxide (N2O) fluxes were measured from paddy–upland rotation (three years for soybean and three years for rice) with different soil fertility due to preceding compost application for four years (i.e., 3 kg FW m−2 year−1 of immature or mature compost application plots and a control plot without compost). Net greenhouse gas (GHG) balance was evaluated by integrating CH4 and N2O emissions and carbon dioxide (CO2) emissions calculated from a decline in soil carbon storage. N2O emissions from the soybean upland tended to be higher in the immature compost plot. CH4 emissions from the rice paddy increased every year and tended to be higher in the mature compost plot. Fifty-two to 68% of the increased soil carbon by preceding compost application was estimated to be lost during soybean cultivation. The major component of net GHG emission was CO2 (82–94%) and CH4 (72–84%) during the soybean and rice cultivations, respectively. Net GHG emissions during the soybean and rice cultivations were comparable. Consequently, the effects of compost application on the net GHG balance from the paddy–upland rotation should be carefully evaluated with regards to both advantages (initial input to the soil) and disadvantages (following increases in GHG).

1. Introduction

“Paddy–upland rotation” involves alternating between rice cultivation in paddy fields and upland crops cultivation in drained paddy fields every few years. Recently, this has become a popular practice for adjusting rice production to decreasing demands in Japan. Currently, soybean is a major crop cultivated in the converted uplands in Japan [1]. In the northern part of Japan that has heavy snow in winter, cultivation of rice or upland crops generally occurs once a year.
Soil conditions in such rotated paddy fields could change drastically along with the cycle of flooding and drainage. Furthermore, the change in soil conditions influences greenhouse gas (GHG) dynamics greatly. Flooded paddy fields are a major source of methane (CH4, the second most major GHG) due to anaerobic decomposition of organic matter under reductive conditions [2]. In comparison, upland fields emit carbon dioxide (CO2, the most major GHG) derived from aerobic decomposition of organic matter as well as nitrous oxide (N2O, the third major GHG) derived from nitrogen in fertilizer, plant residue, and soil organic matter [2,3,4]. In particular, drained paddy fields can cause depletion of soil carbon accumulated during use as a paddy field [5,6]. It is reported that N2O emissions from upland fields tend to be higher in poorly drained soils [7], which are major soils for paddy–upland rotation.
It was reported that CH4 emission from a paddy field converted from an upland field decreased significantly compared to a continuous paddy field in the first year after conversion in Japan [8,9]. Furthermore, the suppressing effect of CH4 emission was found notably in the field incorporated with rice straw [10]. However, the length of this effect has not been well clarified yet. In an upland field converted from a rice paddy field, although N2O emission is increased compared to a continuous paddy field, the decrease in CH4 emission exceeds the increase based on CO2 equivalent evaluation [9,10].
However, to our knowledge, reports on GHG balance are sparse, including CO2 emission in paddy–upland rotation systems. In addition, there have been no reports on the GHG balance in paddy rice–upland soybean rotation, which is the major system in northern Japan.
Recently, depletion in available soil nitrogen has been reported in fields with paddy (rice)–upland (soybean) rotation in northern Japan [11,12]. To maintain the soil nitrogen availability of rotated paddy fields, application of organic matter (e.g., compost and green manure) is considered to be an efficient practice. Organic matter application, such as manure compost to paddy fields, could increase soil carbon storage [11,13]. In comparison, organic matter application could enhance CH4 emissions from paddy fields [14] and N2O emissions from upland fields [15,16]. However, reports on the effects of organic matter application are also sparse, including preceding application on GHG balance in paddy–upland rotation system.
Consequently, the objective of this study was to evaluate the effect of preceding manure compost application on GHG balance in a paddy–upland rotation field in northern Japan.

2. Materials and Methods

2.1. Site Description and Plant Cultivation

The experiment was conducted at the lysimeter plots of the Akita Prefectural Agricultural Experiment Station (39°35′ Ν, 140°12′ Ε), Akita, Japan for six years (June 2008 to May 2014). Three lysimeter plots (15 m2 in area and 2 m in depth for each plot) were filled with gray lowland soil (Eutric Fluvisols; Food and Agriculture Organization/UNESCO) with subsurface drainage at 60 cm depth in each plot. Soil fertilities differed among the plots due to preceding compost application to forage rice (Oryza sativa L. cv. Bekoaoba) cultivation for four consecutive years (2004–2007) before this study. During the cultivation, 3.0 kg m−2 (as fresh matter) of immature or mature compost made of livestock manure (mixture of poultry/swine/cattle = 2:3:7, C/N ratios: 18.2–24.3 and 10.0–16.9, respectively) was applied to the plots (i.e., immature compost or mature compost plots, respectively) each year. In the control plot, forage rice was cultivated without compost application. Chemical fertilizers were applied to all plots equally. All treatments were conducted with one replication (lysimeter). More detailed information is provided in related papers [17,18]. The chemical properties of studied soils (0–10 cm) in each plot are provided in detail by Takakai et al. [17]. Briefly, the soil pH and cation exchange capacity (CEC) ranged from 5.6 to 6.0 and 21.8 to 23.9 cmolC kg−1, respectively. The total nitrogen contents of the immature and mature compost plots (2.03 and 2.14 g kg−1, respectively) were higher than that of the control plot (1.67 g kg−1) at the beginning of the experiment. The total carbon contents of the immature and mature compost plots (25.0 and 26.4 g kg−1, respectively) were also higher than that of the control plot (18.0 g kg−1) (Table S1).
The mean annual temperature and precipitation recorded by the automated meteorological data acquisition system (AMeDAS) at a location 5 km from the experimental field are 10.9 °C and 1775 mm, respectively (Table S2). In this region, snowfall is generally observed from December to March.
Soybean (upland) and staple rice (paddy) was cultivated for the three consecutive years (2008–2010 and 2011–2013), respectively. Plant cultivation was conducted based on the guidelines of Akita Prefecture [19,20]. All plots did not have applications of any organic materials throughout the study period. All agricultural practices (i.e., chemical fertilizers and agrochemicals) were applied to all plots equally. Detailed information about plant cultivation was described in our previous paper [18].
Soybean (Glycine max (L.) Merr. cv. Ryuho) was cultivated with applying chemical fertilizer at the rate of 0 or 2 g N m−2 (ammonium sulfate) as a basal fertilizer to all plots in 2008 or 2009 and 2010, respectively. In all years, top-dressing of fertilizer was not conducted. Soybean seeds were stripe-sown (10.9 plants m−2) in early June. Ridging was conducted once at the end of June or July. Plant residue after harvesting (early October) was subsequently scattered to each plot. After the harvesting, ridges were leveled with a hoe.
Thereafter, staple rice cultivar (Oryza sativa L. cv. Yumeobako or Akitakomachi for 2011 or 2012–2013, respectively) was cultivated for three years. In the middle of May, plowing and basal fertilizer application (chemical fertilizer with the rate of 0 or 6 g N m−2 (ammonium sulfate) was applied to all plots in 2011 or 2012 and 2013, respectively), with puddling conducted. In late May, transplanting was carried out at a density of 20.8 hills m−2. In late July, a total of 3 or 2 g N m−2 of chemical fertilizer (2011 or 2012–2013, respectively) was top-dressed. During the flooding period before mid-season drainage, flooding water depth was kept around 3–5 cm by irrigation and surface drainage. Mid-season drainage was conducted from late June to the middle of July according to plant growth and field moisture condition. Intermittent drainage was carried out during the end of mid-season drainage and final drainage in late August. Harvest was conducted in late September. Rice straw after harvesting was subsequently scattered to each plot and was left until plowing in the next spring.
For the first year of soybean and rice cultivation (2008 and 2011), to avoid over-luxuriant growth of crops due to increased soil nitrogen supply caused by paddy–upland rotation, basal fertilizers were not applied based on the guidelines of Akita Prefecture [19,20]. The plant nitrogen accumulations in 2008 (soybean) and 2011 (rice) were similar to or higher than those in the corresponding other two years despite no application of basal fertilizer [18].

2.2. CH4 and N2O Fluxes

CH4 and N2O fluxes were measured using a closed-chamber method based on the method described in Takakai et al. (for soybean upland [17,18] and rice paddy [18,21]).
For soybean uplands, cylindrical stainless-steel chambers (18.5–21.0 cm in diameter and 25 cm in height) were used for the measurements. Two stainless-steel bases equipped with a groove for sealing by water were installed into the soil between the rows and on the rows of each plot. In total, the gas flux measurement was conducted for each plot with four replicates. After ridging, the difference in height of measurement points between “inter-rows” and “on the rows” was approximately 20 cm. During the snow period, gas fluxes from the snow surface were measured by inserting the chamber into snow directly. Measurements were conducted almost once a week during the growing period (June–October) and one to three times per month during the fallow season (December–May, including the snow period). The frequency of measurement increased during one month after fertilization, plowing and sowing. Gas samples were taken at 0 and 20 min after the chamber was closed. Soil temperature at a depth of 5 cm and volumetric soil water content at a depth of 0–6 cm was measured simultaneously with each gas flux measurement by thermometer and amplitude domain reflectometry (ADR, ML2 Theta Probe Delta-Y Devices, Cambridge, UK), respectively. The volumetric soil water content was converted into a value of water filled pore space (WFPS) by soil porosity measured using soil core samples.
For rice paddies, rectangular transparent acryl chambers (30 × 60 × 50 or 100 cm in length × width × height) were used for the measurements during the rice growing period (end of May to late September). The flux measurement was conducted with three replicates per plot. Gas samples were taken at 1, 11 and 21 min after the chamber was closed. During the fallow period, gas fluxes from soil surface were measured in the same manner with soybean upland. Measurements were conducted almost once a week during the growing period and one to three times per month during the fallow season. Soil redox potential (Eh) at a depth of 5 cm was measured using platinum-tipped electrodes and a portable Eh meter (PRN-41, Fujiwara Scientific Company Co. Ltd., Tokyo, Japan) simultaneously with each measurement of gas fluxes. After transplanting rice, three electrodes were inserted into the soil at a depth of 5 cm per plot and kept in place throughout the rice growing period. Soil temperature was also measured. To avoid any disturbance during the flux measurements, all operations were performed from a boardwalk.
The CH4 and N2O concentrations were analyzed using a gas chromatograph (GC-14B, Shimadzu, Kyoto, Japan) equipped with a flame ionization detector and an electron capture detector, respectively. CH4 and N2O fluxes were calculated using a linear regression method. Annual emissions of CH4 and N2O were calculated by integrating the daily fluxes by linear interpolation.

2.3. Soil Carbon Storage and Decrease Rate

Changes in soil carbon storage were calculated by using the soil samples obtained by Takakai et al. [18]. Briefly, bulk soil samples were taken at three different depths (0–10, 10–20, and 20–30 cm), with three replicates conducted at each plot before the start of this study (November 2007), after 3 years of soybean cultivation (May 2011) and after 3 years of rice cultivation (April 2014). The total carbon content of air-dried, sieved (2-mm mesh) and finely ground samples were measured using an N/C analyzer (NC-900 and NC-22F, Sumika Chemical Analysis Service, Ltd., Osaka, Japan). Soil carbon storage (0–30 cm) was calculated based on soil mass [3,22], using the value of bulk density in May 2008 (before plowing) as described in Takakai et al. [18].
In this study, assuming that all carbon losses from soil contributed to CO2 and CH4 emissions, annual CO2 emissions from soils were calculated by subtracting annual CH4 emissions from the annual rate of carbon loss.

2.4. Net Greenhouse Gas Balance

Net GHG balance in the field was calculated by integrating CH4, N2O and CO2 emissions described above as equivalent to CO2. Global warming potentials for CH4 and N2O were 34 and 298, respectively [2].

2.5. Statistical Analyses

Differences in cumulative GHG emissions among the plots were compared by two-way analysis of variance (ANOVA, Year × Plot) followed by a Tukey’s test. In this study, differences with p < 0.10 were considered significant. For all statistical analyses, Excel Statistics 2012 for Windows (SSRI, Tokyo, Japan) was used.

3. Results

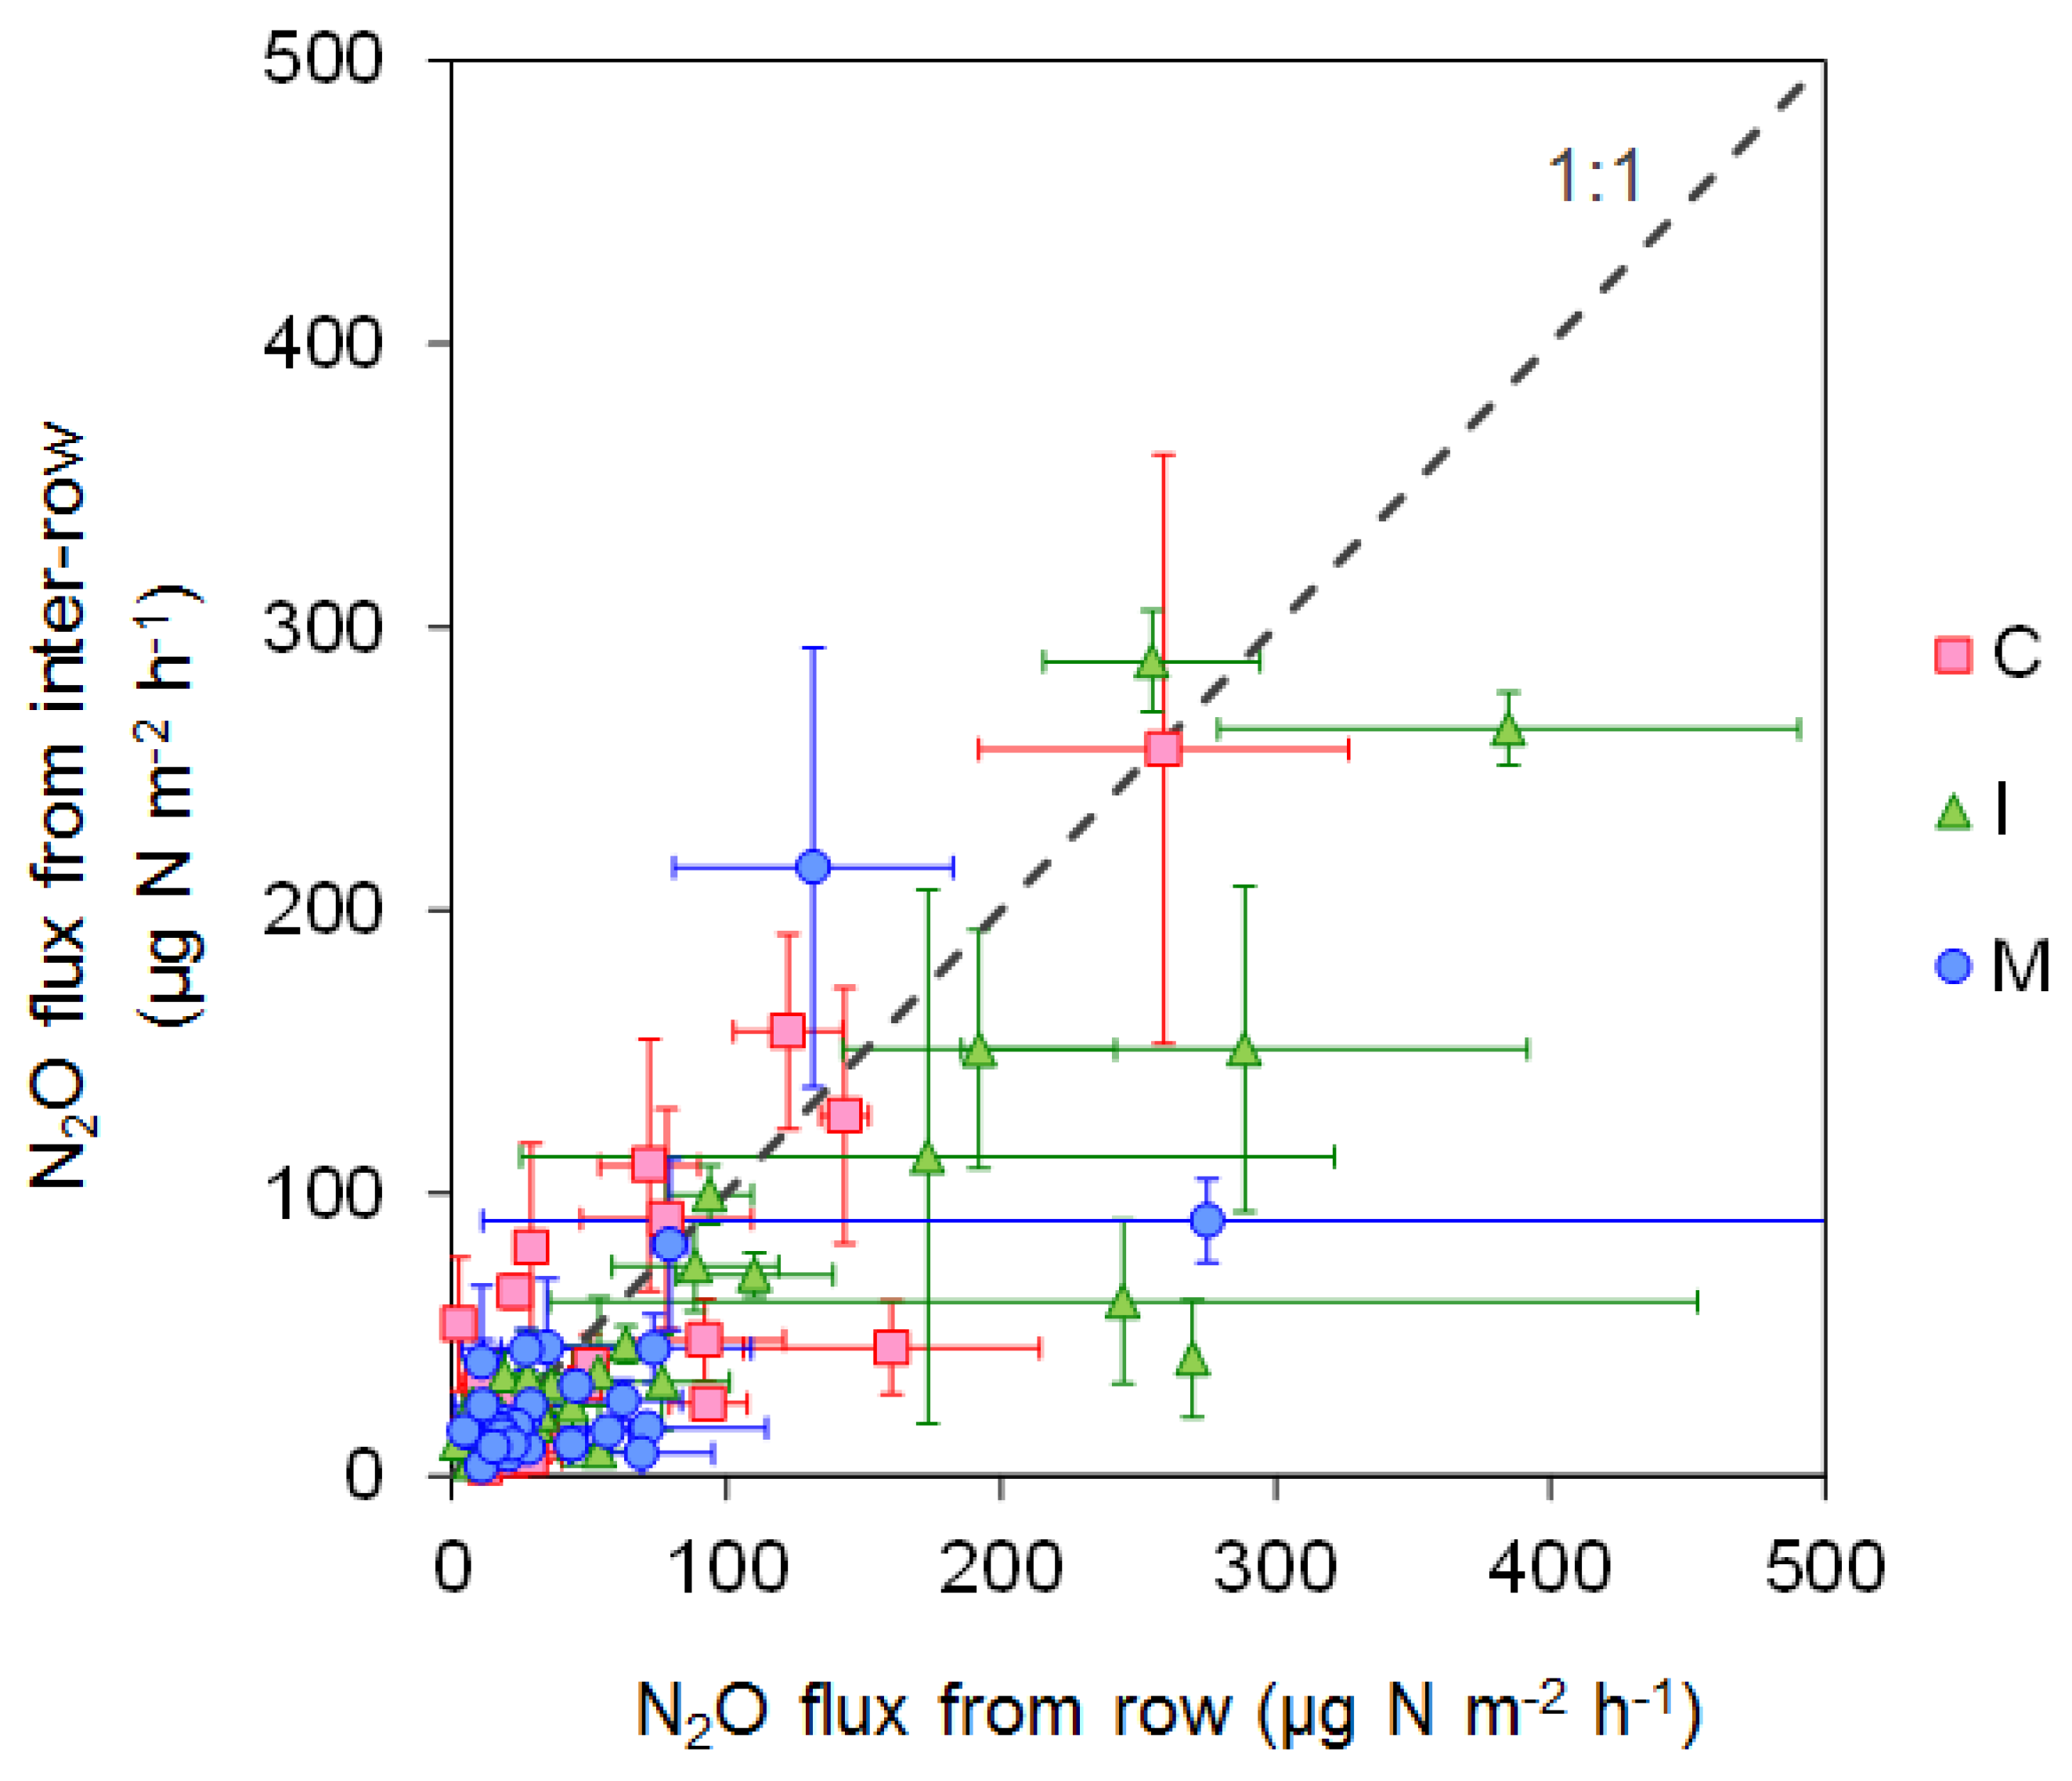
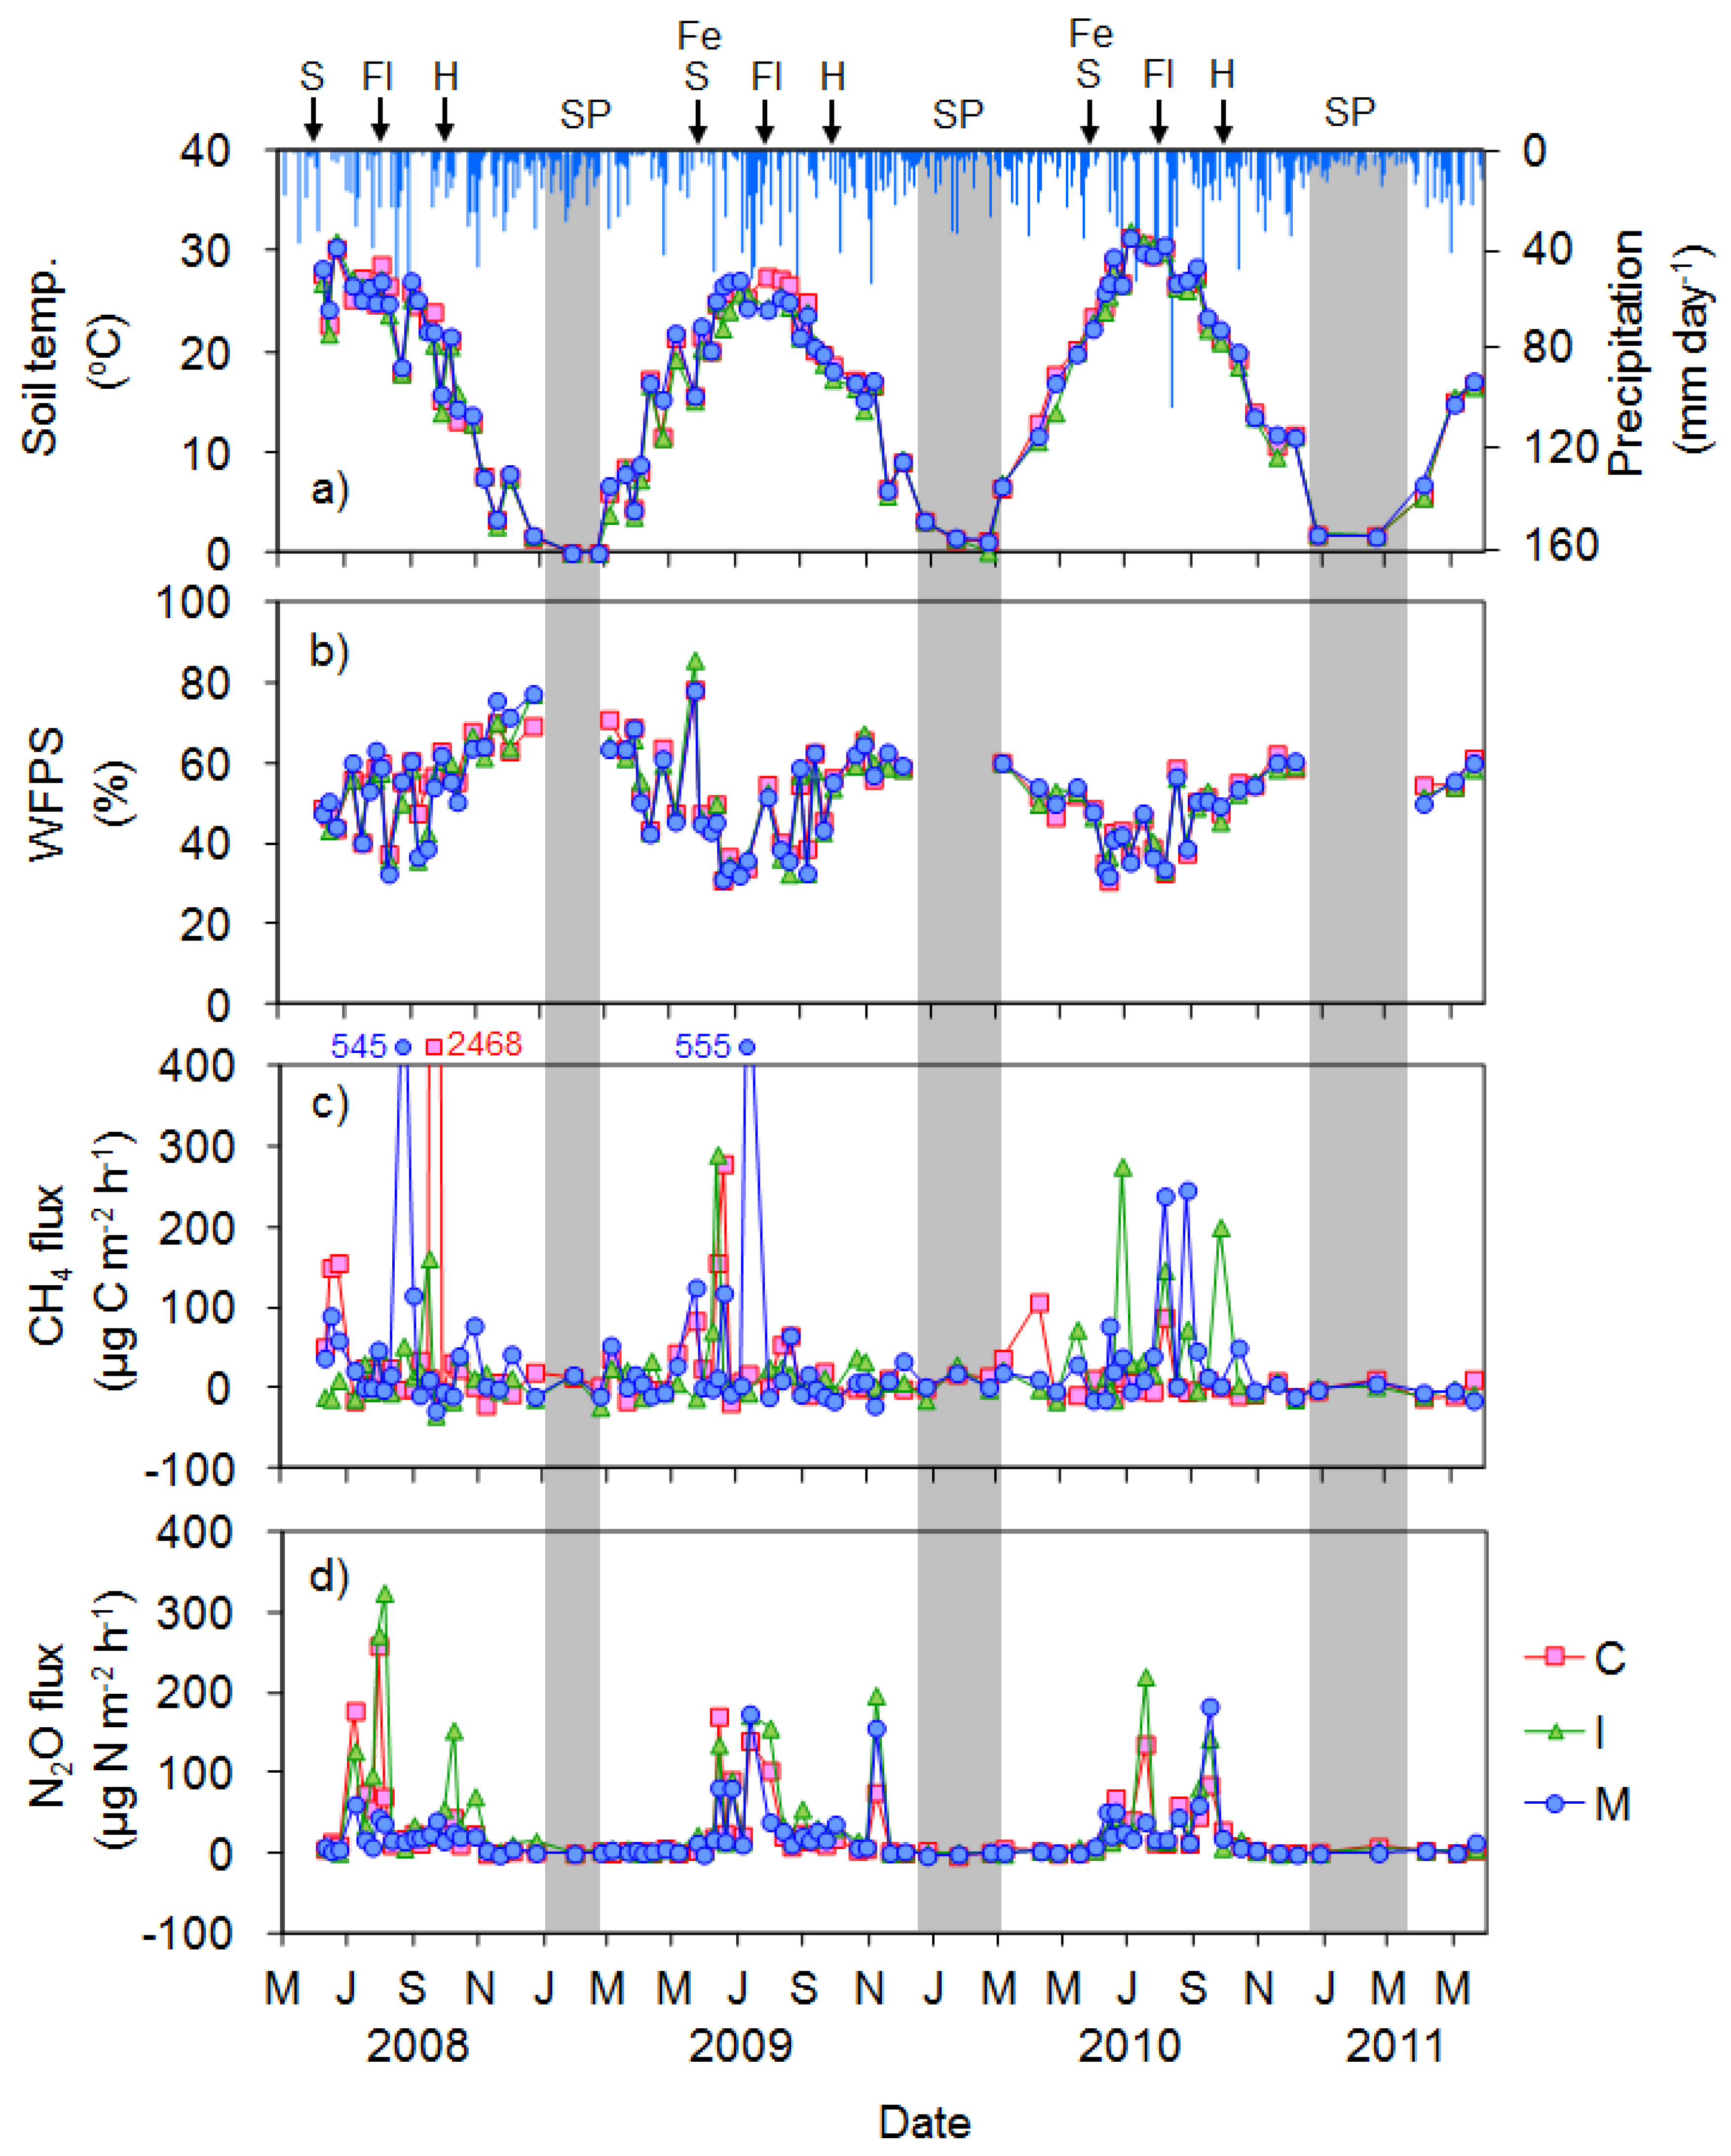
3.1. GHG Emissions from the Upland Soybean Field

In all years, there were no differences in soil temperature and WFPS among the plots (Figure 1). The WFPS mainly ranged from 40% to 60% during the growing period, and tended to increase after harvesting with an increase in precipitation. Episodic CH4 emissions were randomly found irrespective of the plots. Significant N2O fluxes from all plots were found after sowing (June–July) and after harvesting (October). On the other hand, there was no significant N2O flux during the snow and snow-melting period. In the first year (2008), N2O flux from the mature compost plot was lower than those in the other two plots. In comparison, in the second (2009) and third years (2010), high N2O flux was sometimes found even in the mature compost plot.
During the soybean growing period after ridging, there was no significant difference in N2O fluxes from inter-row and from on the rows, except for the immature compost plot, which had a tendency to have higher flux from those located on the rows (Figure 2, p > 0.05, paired t-test, statistical data not shown).
The annual CH4 emissions did not differ significantly among the years and the plots (Table 1). The annual N2O emissions from soybean upland did not have obvious differences among the years. For the three-year average, the annual N2O emissions increased in the following order: mature compost plot < control plot < immature compost plot. A significant difference was found between the mature and immature compost plots. GWP (CO2 equivalent) of N2O emissions were 6 to 19 times higher than those of CH4 emissions.

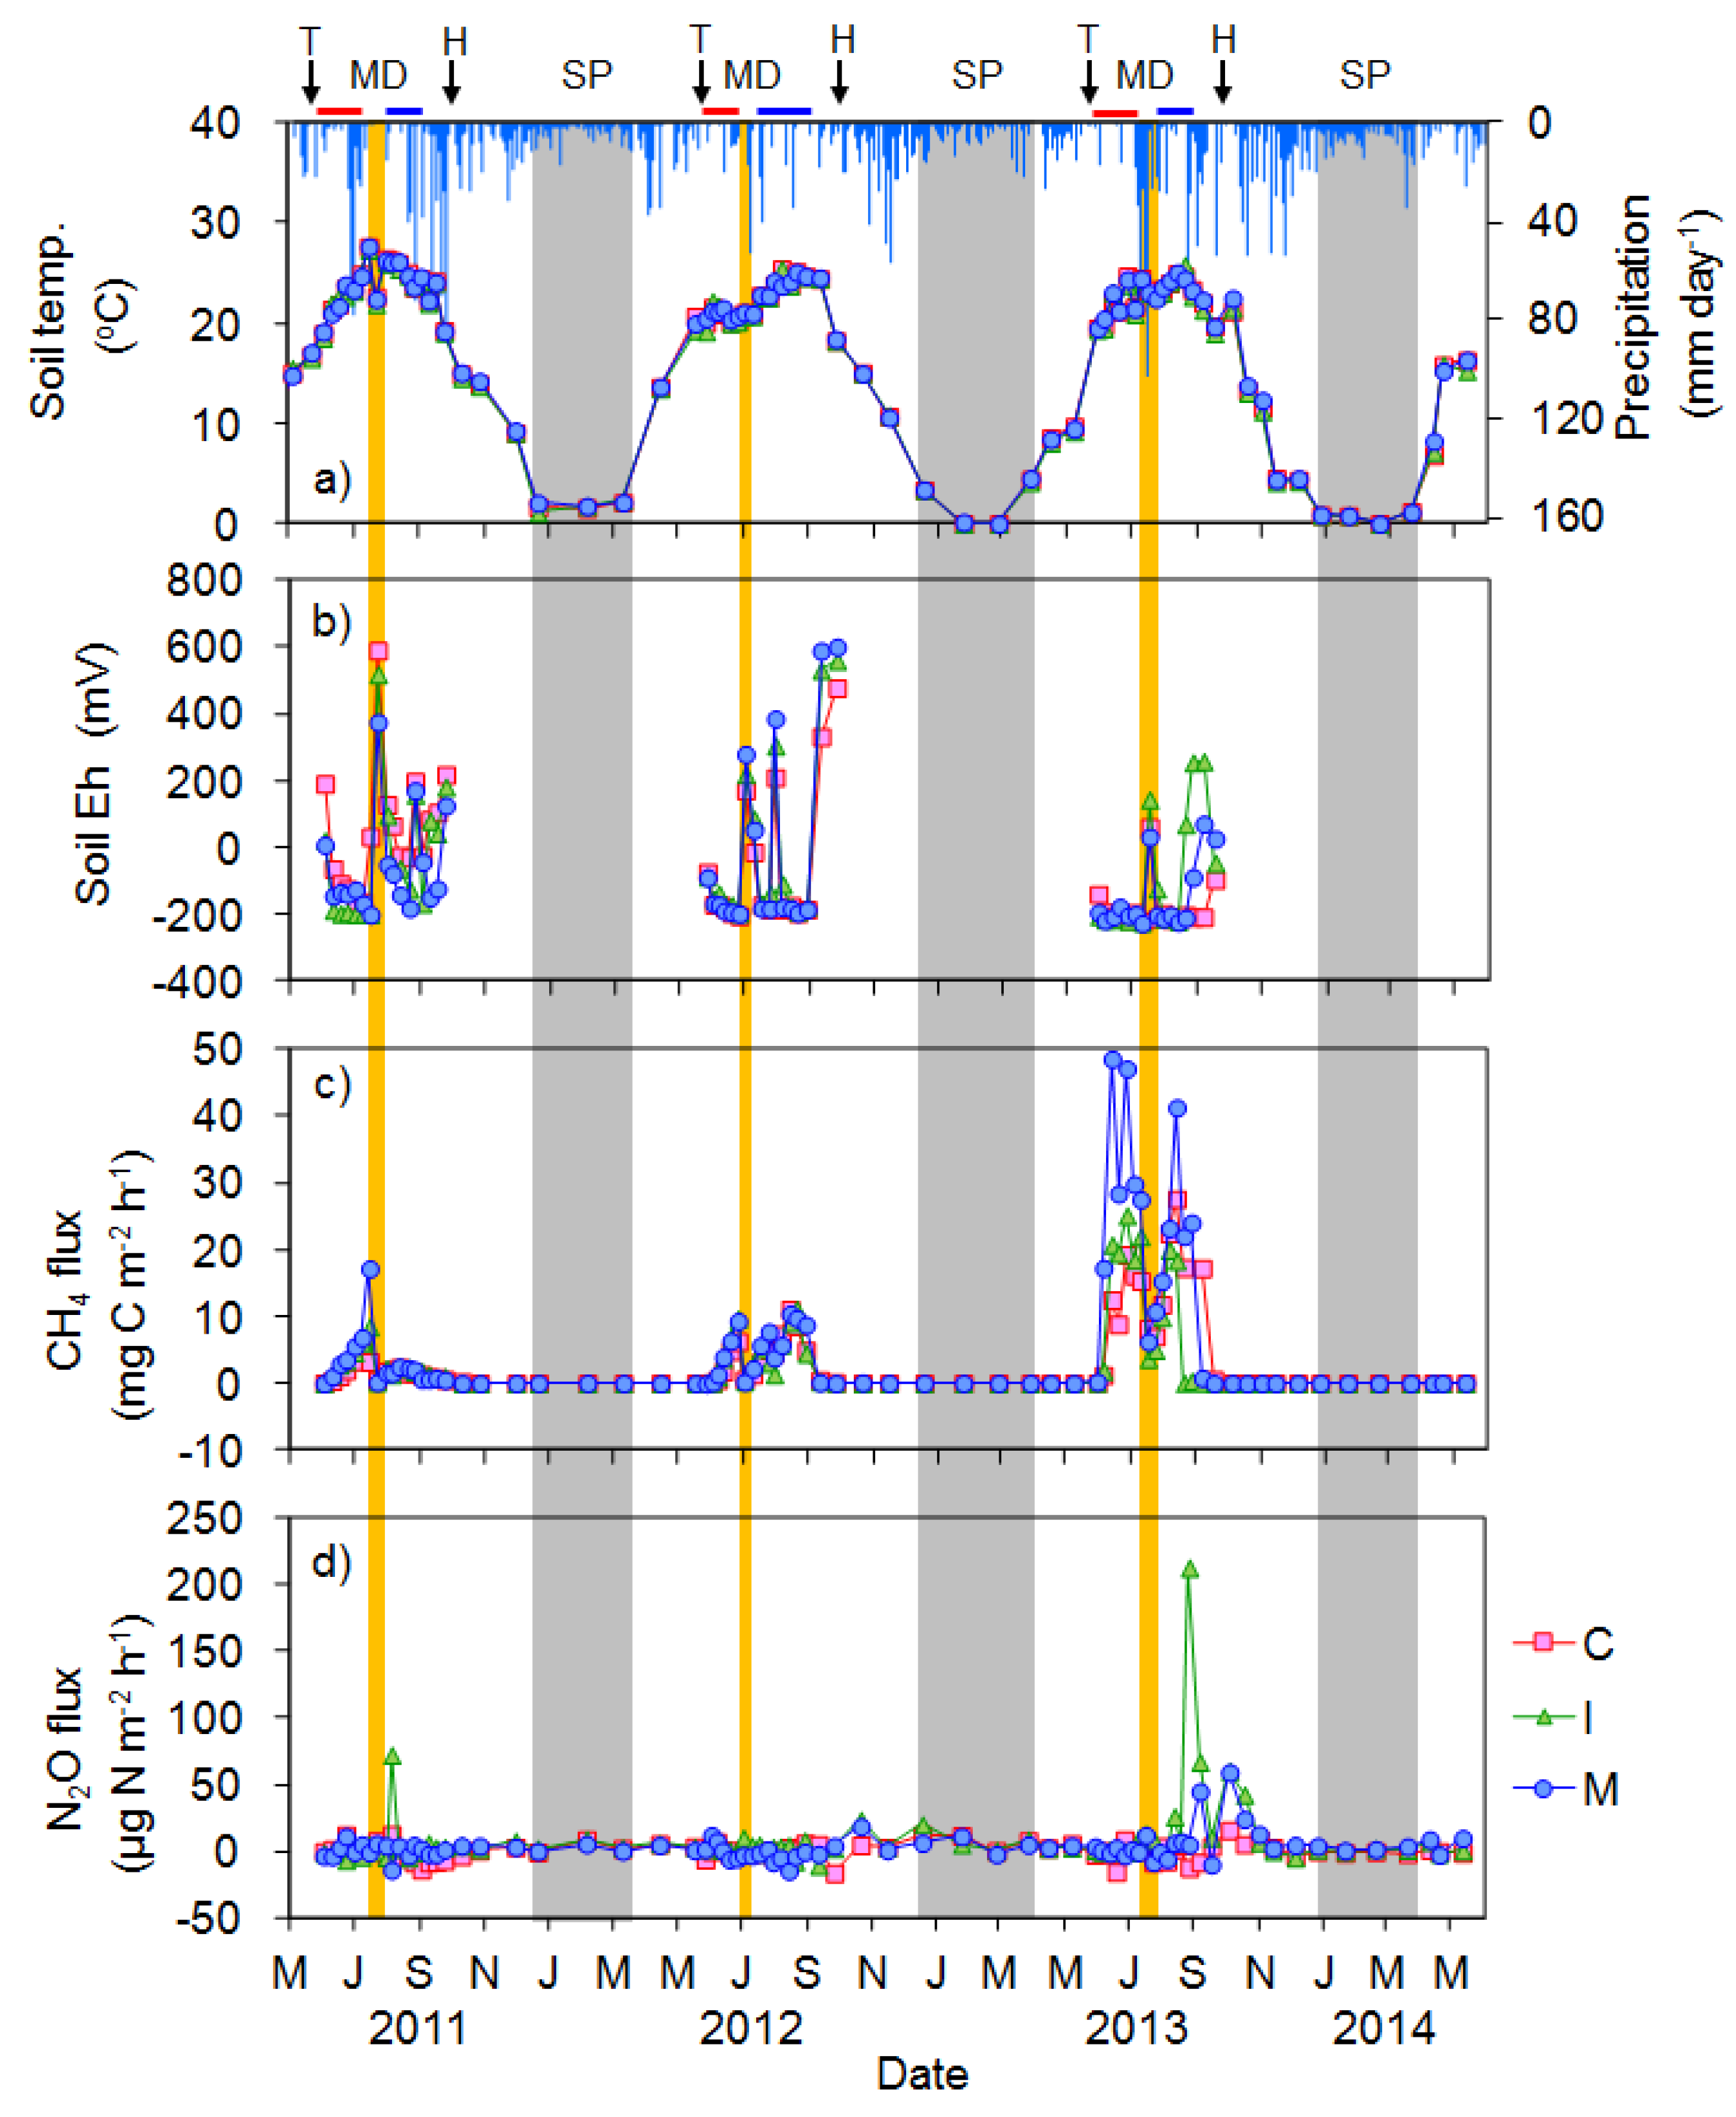
3.2. GHG Emissions from the Rice Cultivated Paddy Field

In all years, there were no differences in soil temperature and soil Eh among the plots (Figure 3). The soil Eh in all plots began to decrease after transplanting and increased to positive values during the mid-season drainage. The decrease in the third year (2013) tended to be faster than those in the first (2011) and second year (2012). The soil Eh after mid-season drainage in the first year tended to be higher than those in the other two years. In the first year, CH4 fluxes before mid-season drainage from both compost application plots were higher than that from the control plot. In the second year, significant CH4 fluxes after mid-season drainage were observed. In the third year, CH4 fluxes were higher than those in the previous two years. In addition, the CH4 fluxes in both compost application plots tended to be higher than that in the control plot until the rapid decrease in the immature compost plot caused by accidental drainage with drainage system trouble in late August. Throughout the three-year rice cultivation period, N2O fluxes in all plots indicated slight uptake or emissions, aside for several episodic emissions. High N2O emissions from the immature compost plot in late August of the third year could be caused by the accidental drainage.
The annual CH4 emissions from all plots increased year by year and were significantly higher in the third year compared to those in previous two years (Table 2). For the three-year average, the annual CH4 emissions increased in the following order: immature compost plot < control plot < mature compost plot, although there was no significant difference among the plots. The lowest CH4 emission from the immature compost plot could be attributed to the accidental drainage in the third year. The annual N2O emissions from all plots did not differ obviously among the years, and tended to be higher in both compost application plots compared to the control plot. GWP (CO2 equivalent) of CH4 emissions were 22 to 122 times higher than those of N2O emissions.

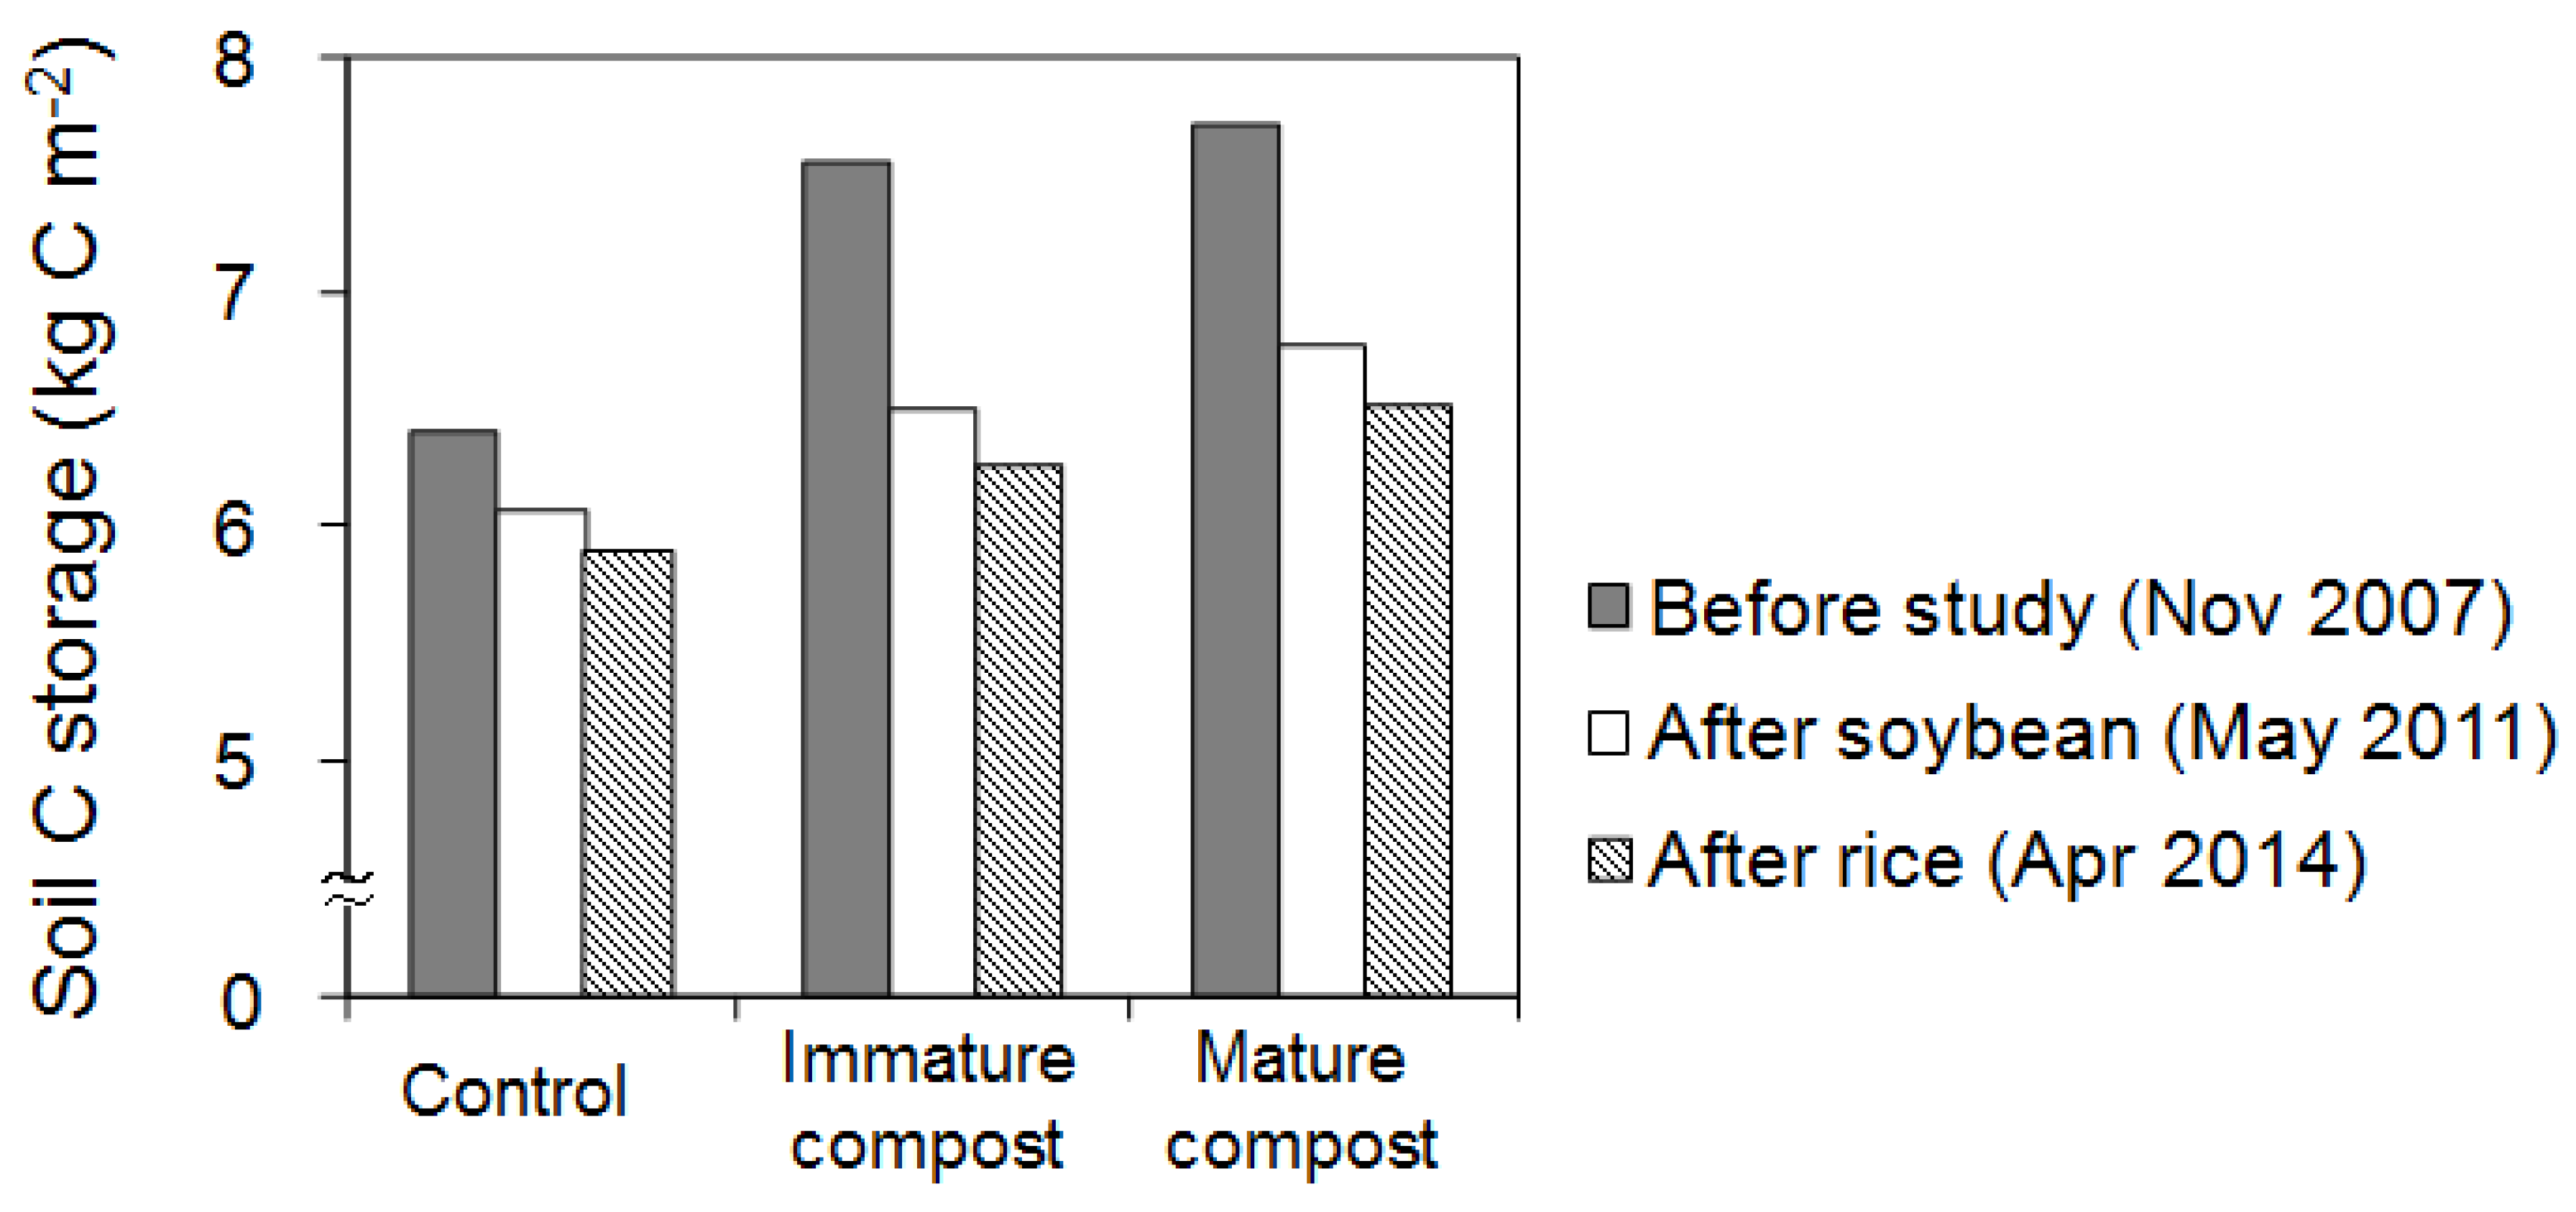
3.3. Changes in Soil Carbon Storage

Assuming that soil carbon storage was similar for all plots at a depth of 0–30 cm before compost application for forage rice cultivation (2004–2007), the application of immature and mature compost caused carbon storage to increase by 1.16 and 1.32 kg C m−2, respectively, compared to the control plot over four years (Figure 4, Table S3). The increase in soil carbon storage occurred in the surface soil at a depth of 0–10 cm. The decreases in the carbon storage during the 3 years of soybean cultivation in the immature and mature compost plots (1.05 and 0.96 kg C m−2, respectively) were higher than that in the control plot (0.33 kg C m−2). Sixty-eight percent and 52% of the carbon increase from immature and mature compost application were estimated to be lost during the soybean cultivation period. During the soybean cultivation, soil carbon storage in the surface soil decreased remarkably in both compost application plots, with no change found in the control plot. On the other hand, during the rice cultivation period, the decreases in the carbon storage did not differ among the plots (0.17 to 0.25 kg C m−2) and were lower than those during the soybean cultivation period. During the rice cultivation, soil carbon storage in surface soil (0–10 cm) tended to increase slightly in all plots, while soil carbon storage in subsoil (10–30 cm) decreased in all plots.
During the soybean cultivation period, the annual CO2 emissions from soil in the control, immature and mature compost plots were 110, 350 and 315 g C m−2 year−1, respectively. On the other hand, during the rice cultivation period, the CO2 emission in the control, immature and mature compost plots were 58, 79 and 83 g C m−2 year−1, respectively.

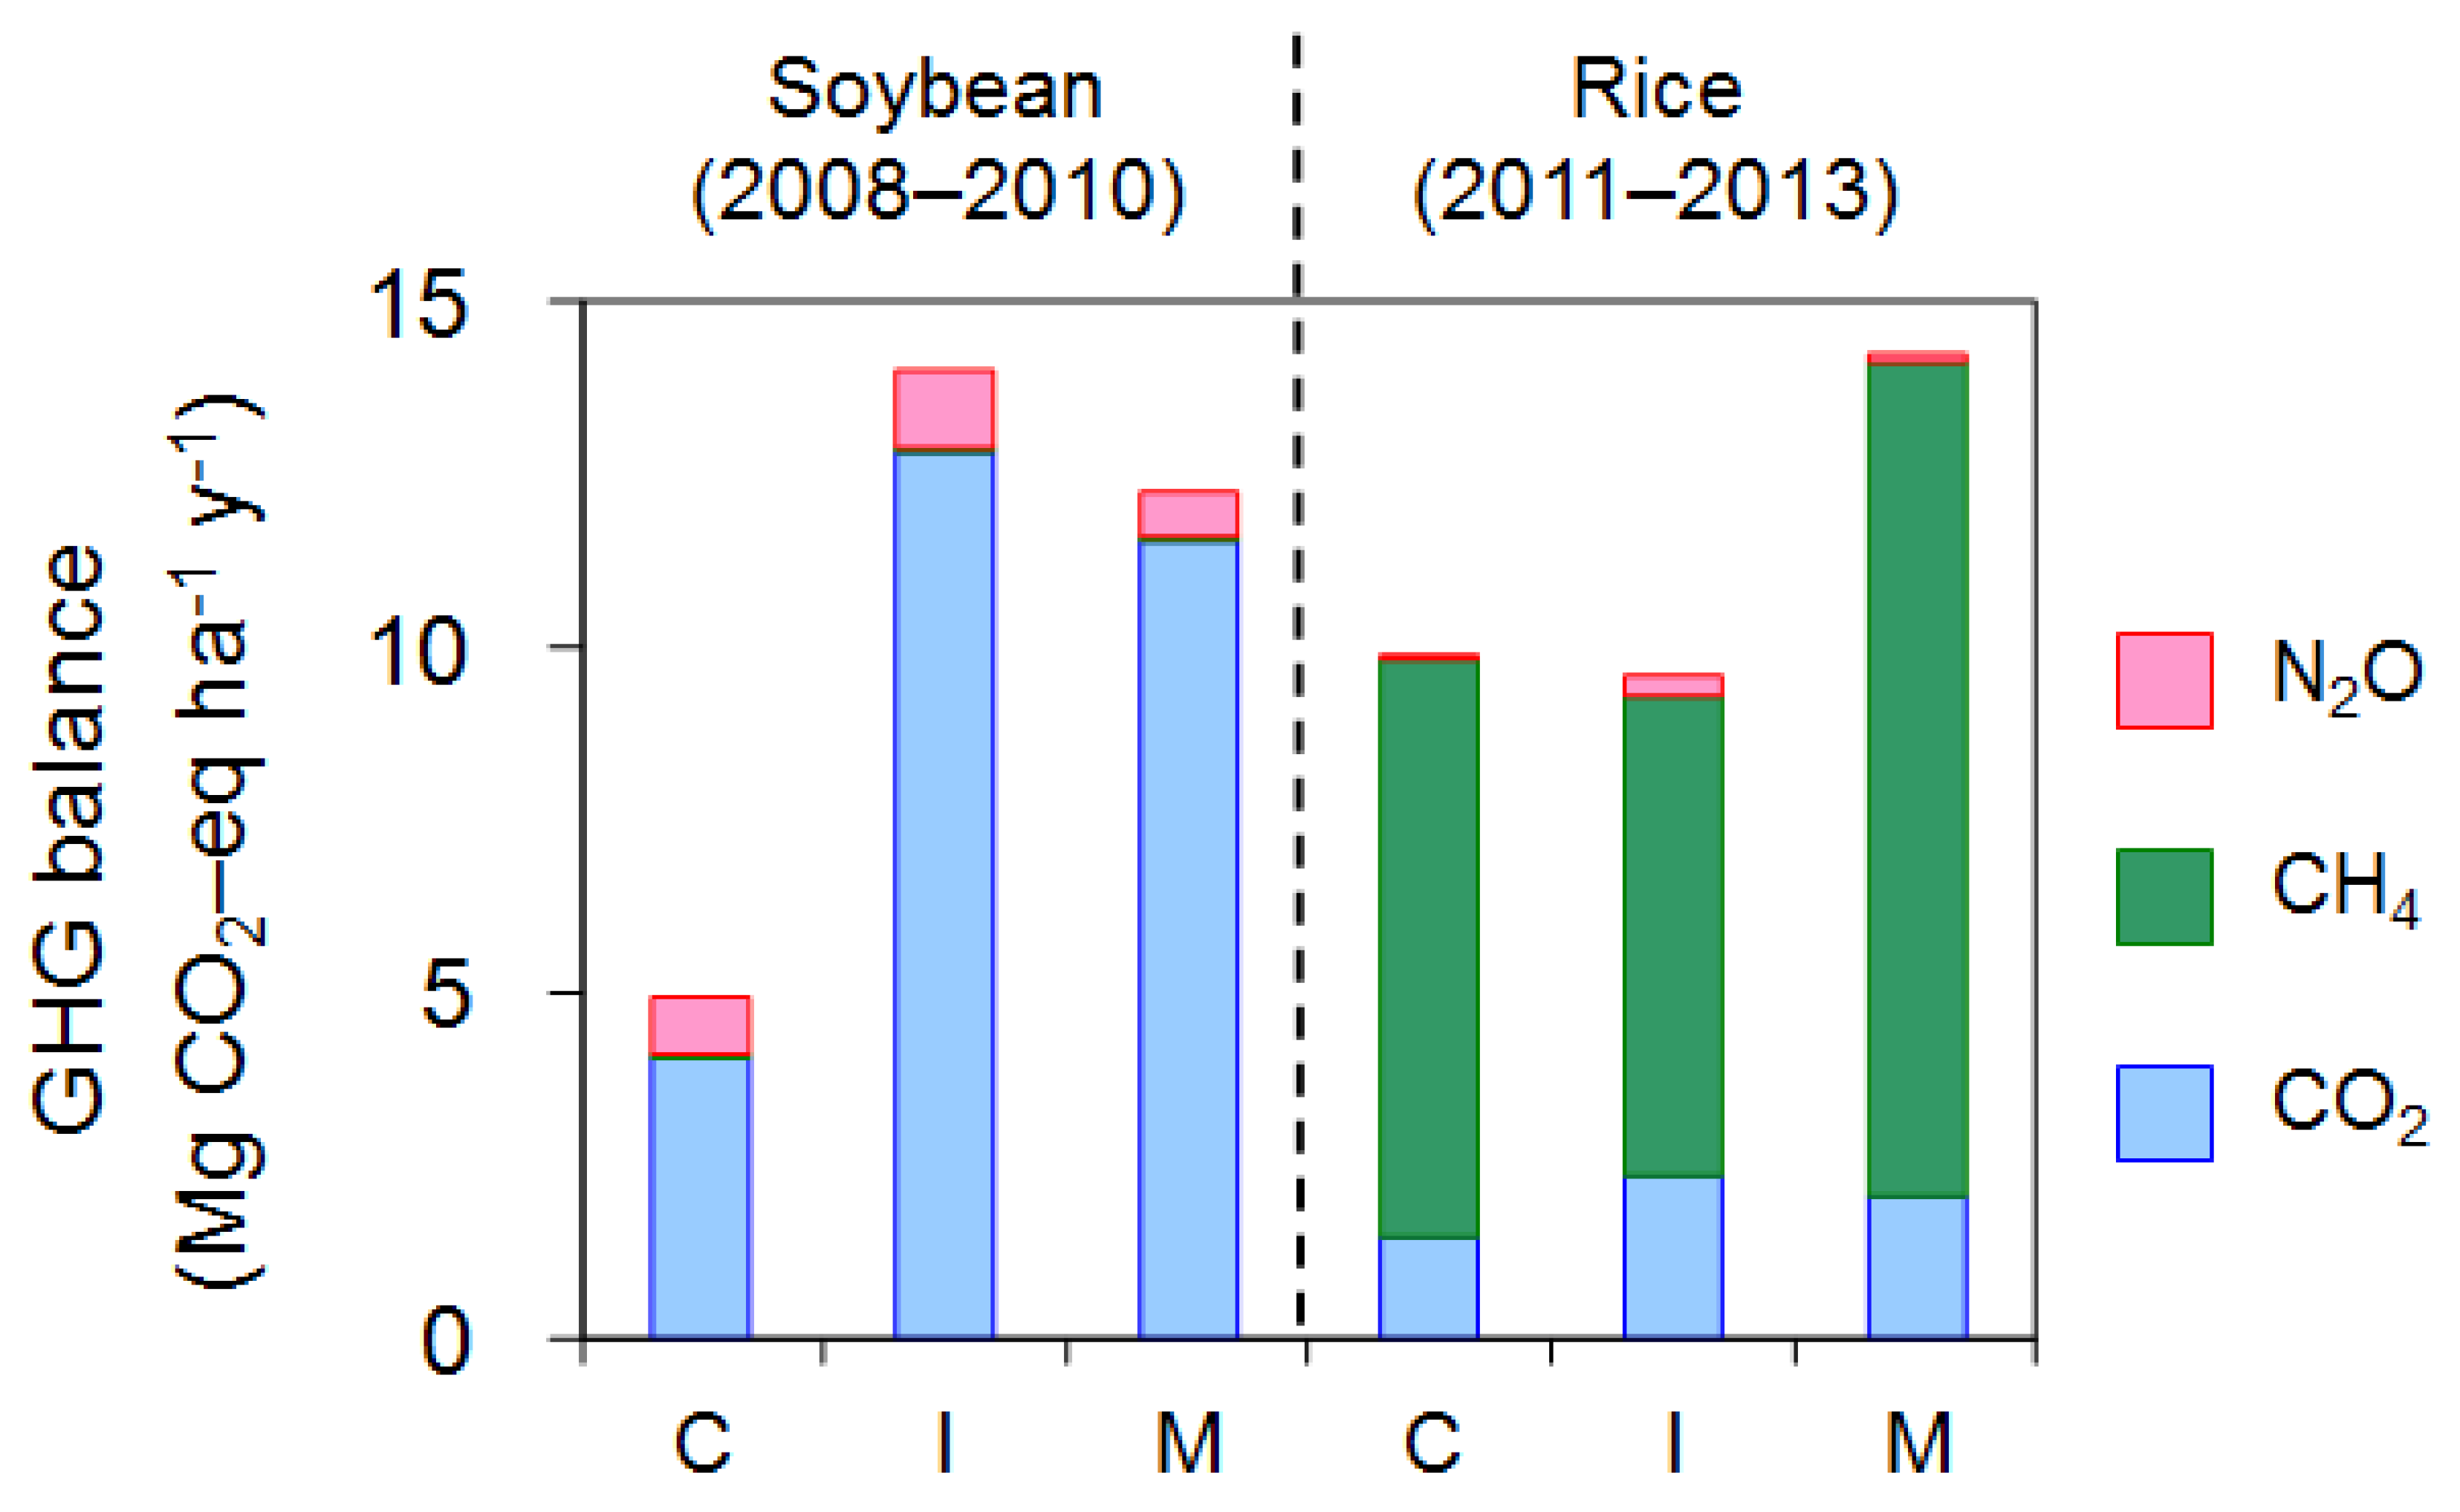
3.4. Net GHG Balance

During the three years of soybean cultivation, the major component of net GHG balance was CO2 emission (82–94% of the total; Figure 5). The net GHG balances in both compost application plots (12.3–14.0 Mg CO2-eq ha−1 year−1) were higher than that in the control plot (4.9 Mg CO2-eq ha−1 year−1) along with the difference in CO2 emission. During the three years of rice cultivation, the major component of net GHG balance was CH4 emission (72–84% of the total). The net GHG balance in the mature compost plot (14.3 Mg CO2-eq ha−1 year−1) was higher than those in the other two plots (9.6–9.9 Mg CO2-eq ha−1 year−1) along with the difference in CH4 emission. Consequently, the net GHG balances during the rice cultivation period were higher than that in the control plot and were similar to or lower than those in both compost application plots during soybean cultivation period.

4. Discussion

4.1. N2O Emissions from the Upland Soybean Field

Increase in N2O flux in June and July (Figure 1) was consistent with the results from a soybean-cultivated converted paddy field in Yamagata, northern Japan [10]. It could be caused by increases in soil temperature and moisture for the period. The increase in N2O flux after harvesting (October) could be derived from decomposition of plant residue and nodule [23]. There was no clear tendency between the N2O fluxes from inter-row and from those on the rows with different conditions of the surface soil such as soil moisture across the plots (Figure 2). It suggested that there is only a minor contribution of N2O production in the surface soil on N2O flux. Therefore, it is considered that there is a significant contribution of N2O production via denitrification near ground water table [24] fluctuating around drainage pipe buried at a depth of 60 cm.
Any clear trend in annual N2O emissions from soybean upland was not found across the years (Table 1). N2O production in soil is affected greatly by soil moisture condition [25]. In addition, N2O emissions from upland fields tend to be higher in poorly drained soils [7]. Improvement of soil drainage properties in converted (drained) paddy fields with increasing year after paddy condition [6] may influence N2O production and emission. In this study, there was a possibility that subsurface drainage pipe buried in the soil affected the soil drainage properties even in the first year after paddy condition.
Although there was a significant difference in N2O emissions among the plots, the difference did not correlate with the available nitrogen in the soil (Table 1 and Table S1). Therefore, the reason for the difference did not become clear in this study. The annual N2O emissions in this study ranged from 0.88 to 2.73 kg N ha−1 year−1. These values were similar to or slightly higher than the mean value of N2O emissions from unfertilized uplands in Japan (0.36 and 1.4 kg N ha−1 year−1 for the well-drained and poorly-drained soils, respectively [7]). Furthermore, these values were lower than those from an onion-cultivated and unfertilized upland on gray lowland soil in Hokkaido (4.88 kg N ha−1 year−1; [26]) in addition to those from a soybean-cultivated upland converted from a paddy field on gray lowland soil in Yamagata, northern Japan (3.3–4.4 kg N ha−1 year−1; [10]).

4.2. CH4 and N2O Emissions from the Rice Paddy Field

The annual CH4 emission from the rice paddy was the lowest in the first year after conversion and increased year by year (Table 2). In this study, the suppressing effect of the paddy–upland rotation on CH4 emission [8,9] could not be evaluated quantitatively due to the absence of a continuous paddy field as a control. However, at least, the suppressing effect was considered to continue until the second year based on the comparison with the third year. The suppressing effect could be caused by the absence in rice straw, a major substrate for CH4 production [10] and changes in availability of electron donors, redox status of soil Fe and activity of methanogens [27]. In the third year (2013) CH4 fluxes before the accidental drainage at the immature compost plot increased in the following order: control plot < immature compost plot < mature compost plot (Figure 3). The order was consistent with the order of available nitrogen in surface soil shown in our previous paper [18]. A positive relationship between available nitrogen content and CH4 production rate was found in Japanese paddy soils [28]. Therefore, increased mineralizable soil organic matter caused by preceding manure application could enhance CH4 emission from rice paddy fields even in six years after application.
The annual N2O emission from the rice paddy ranged from 0.03 to 0.59 kg N ha−1 year−1, with the exception of high emission caused by the accidental drainage in the late August (the immature compost plot in the third year). These values were lower than the mean value of N2O emissions from fertilized paddy fields with mid-season drainage in the world (0.99 kg N ha−1 season−1; [29]).

4.3. CO2 Emission and Net GHG Balance

The decreases in soil carbon storage during the soybean cultivation period were higher than those during the rice cultivation period (Figure 4). The result was consistent with previous reports [5,6,11]. It could be mainly attributed to the difference in oxidative–reductive status between the upland and paddy areas. Carbon loss from upland and grassland fields on brown lowland soil, brown forest soil and gray lowland soil in central Hokkaido estimated by the carbon budget were found to range from 193 to 410 g C m−2 season−1 [30]. Carbon loss from an upland plot on andosol in Hokkaido estimated by change in soil carbon storage was 134 g C m−2 year−1 [22]. Carbon loss from uplands converted from rice paddy estimated by continuous measurement of CO2 flux were 275–343 and 256–361 g C m−2 year−1 for upland rice and soybean-wheat, respectively [31]. The carbon losses estimated in this study were considered to be comparable with those values in previous reports.
At upland fields converted from paddy fields, trade-off relationships between decrease in CH4 emission and increase in N2O emission have been reported [9,10]. Shiono et al. [10] indicated that the suppressing effects of the paddy-upland rotation on GHG (CH4 + N2O) increased in the field with rice straw incorporation, because the decrease in CH4 emission exceeded the increase in N2O emission greatly. The results in this study agreed with the trend. However, significant CO2 emission from soybean-cultivated upland occurred in this study (Figure 5). Taking the increased CO2 emission into account, the suppressing effect of paddy–upland rotation on CH4 emission may be canceled to some extent. A significant amount of accumulated soil carbon by the preceding compost application had been released during the soybean cultivation period. Thus, quantitative evaluation of change in soil carbon storage related to organic matter application is considered to be required in future.

5. Conclusions

Although compost application to the paddy–upland rotation system increased soil carbon storage, it also increased net GHG emission after application, including CO2 emission during the soybean cultivation period under upland conditions. Therefore, to evaluate the effect of compost application to the net GHG balance from the paddy–upland rotation system, integration of both advantages (the initial input to the soil) and disadvantages (the following increase in GHG) should be conducted in the future.

Supplementary Materials

The following are available online at https://www.mdpi.com/2077-0472/7/6/49/s1, Table S1: Chemical properties of the surface soil (0–10 cm) in the experimental plots after the first year of soybean cultivation (2008), Table S2: Monthly air temperature and precipitation, Table S3: Changes in soil carbon (C) storage in soil (0–30 cm), Table S4: Comparison of net greenhouse gas (GHG) balance in soybean (upland) and rice (paddy) cultivation field.

Acknowledgments

We are deeply grateful to the staff members of the Akita Prefectural Agricultural Experiment Station (Kazuki Sekiguchi, Keiji Sasaki, and others) for their support in the management of the experimental field. We would also like to thank Keiko Hatakeyama, Emiko Sato, and Tomoko Suzuki for their great help on field survey and laboratory analyses.

Author Contributions

Kazuhiro Kon and Yoshihiro Kaneta conceived and designed the experiments; Fumiaki Takakai performed the experiments and analyzed the data; Kensuke Sato, Shinpei Nakagawa, and Kazuhiro Kon contributed cultivation and measurements in the lysimeter; Fumiaki Takakai wrote the paper; Takashi Sato and Yoshihiro Kaneta provided many constructive comments on this manuscript.

Conflicts of Interest

The authors declare no conflict of interest.

References

  1. Takahashi, T.; Sumida, H.; Nira, R. A new framework for study of irrigated paddy rice and upland crops rotation farming and its relation to soil and plant nutrition science. 1. Advances and perspectives in irrigated paddy rice and upland crops rotation farming. Jpn. J. Soil Sci. Plant Nutr. 2013, 84, 202–207. (In Japanese) [Google Scholar]
  2. Intergovernmental Panel on Climate Change (IPCC). The physical science basis: Anthropogenic and natural radiative forcing. In Climate Change 2013; Myhre, G., Shindell, D., Eds.; Cambridge University Press: Cambridge, UK, 2013. [Google Scholar]
  3. Paustian, K.; Andrén, O.; Janzen, H.; Lal, R.; Smith, P.; Tian, G.; Tiessen, H.; van Noordwijk, M.; Woomer, P. Agricultural soil as a C sink to offset CO2 emissions. Soil Use Manag. 1997, 13, 230–244. [Google Scholar] [CrossRef]
  4. Bouwman, A.F. Exchange of greenhouse gases between terrestrial ecosystems and the atmosphere. In Soils and the Greenhouse Effect; Bouwman, A.F., Ed.; John Wiley: New York, NY, USA, 1990; pp. 61–127. [Google Scholar]
  5. Mitsuchi, M. Characters of humus formed under rice cultivation. Soil Sci. Plant Nutr. 1974, 20, 249–259. [Google Scholar] [CrossRef]
  6. Moroyu, H. Changes of physical and chemical properties of paddy soils under the cultivation of upland crops. Jpn. J. Soil Sci. Plant Nutr. 1983, 54, 434–441. (In Japanese) [Google Scholar]
  7. Akiyama, H.; Yan, X.; Yagi, K. Estimations of emission factors for fertilizer-induced direct N2O emissions from agricultural soils in Japan: Summary of available data. Soil Sci. Plant Nutr. 2006, 52, 774–787. [Google Scholar] [CrossRef]
  8. Kumagai, K.; Konno, Y. Methane emission from rice paddy fields after upland farming. Jpn. J. Soil Sci. Plant Nutr. 1998, 69, 333–339, (In Japanese with English Summary). [Google Scholar]
  9. Nishimura, S.; Akiyama, H.; Sudo, S.; Fumoto, T.; Cheng, W.; Yagi, K. Combined emission of CH4 and N2O from a paddy field was reduced by preceding upland crop cultivation. Soil Sci. Plant Nutr. 2011, 57, 167–178. [Google Scholar] [CrossRef]
  10. Shiono, H.; Saito, H.; Nakagawa, F.; Nishimura, S.; Kumagai, K. Effects of crop rotation and rice straw incorporation in spring on methane and nitrous oxide emissions from an upland paddy field in a cold region of Japan. Jpn. J. Soil Sci. Plant Nutr. 2014, 85, 420–430, (In Japanese with English Summary). [Google Scholar]
  11. Sumida, H.; Kato, N.; Nishida, M. Depletion of soil fertility and crop productivity in succession of paddy rice-soybean rotation. Bull. Natl. Agric. Res. Cent. Tohoku Reg. 2005, 103, 39–52, (In Japanese with English Summary). [Google Scholar]
  12. Nishida, M.; Sekiya, H.; Yoshida, K. Status of paddy soils as affected by paddy rice and upland soybean rotation in northeast Japan, with special reference to nitrogen fertility. Soil Sci. Plant Nutr. 2013, 59, 208–217. [Google Scholar] [CrossRef]
  13. Shirato, Y.; Yagasaki, Y.; Nishida, M. Using different versions of the Rothamsted Carbon model to simulate soil carbon in long-term experimental plots subjected to paddy–upland rotation in Japan. Soil Sci. Plant Nutr. 2011, 57, 597–606. [Google Scholar] [CrossRef]
  14. Kumagai, K.; Shiono, H.; Morioka, M.; Nagasawa, K.; Nakagawa, F. Effect of application of livestock dung compost instead of spring incorporation of rice straw on methane emission from paddy fields in Yamagata. Bull. Agric. Res. Yamagata Prefect. 2010, 2, 1–18. [Google Scholar]
  15. Toma, Y.; Hatano, R. Effect of crop residue C:N ratio on N2O emissions from Gray Lowland soil in Mikasa, Hokkaido, Japan. Soil Sci. Plant Nutr. 2007, 53, 198–205. [Google Scholar] [CrossRef]
  16. Akiyama, H.; Tsuruta, H. Nitrous oxide, nitric oxide, and nitrogen dioxide fluxes from soils after manure and urea application. J. Environ. Qual. 2003, 32, 423–431. [Google Scholar] [CrossRef] [PubMed]
  17. Takakai, F.; Takeda, M.; Kon, K.; Inoue, K.; Nakagawa, S.; Sasaki, K.; Chida, A.; Sekiguchi, K.; Takahashi, T.; Sato, T.; et al. Effects of preceding compost application on the nitrogen budget in an upland soybean field converted from a rice paddy field on gray lowland soil in Akita, Japan. Soil Sci. Plant Nutr. 2010, 56, 760–772. [Google Scholar] [CrossRef]
  18. Takakai, F.; Kikuchi, T.; Sato, T.; Takeda, M.; Sato, K.; Nakagawa, S.; Kon, K.; Sato, T.; Kaneta, Y. Changes in the nitrogen budget and soil nitrogen in a field with paddy–upland rotation with different histories of manure application. Agriculture 2017, 7, 39. [Google Scholar] [CrossRef]
  19. Department of Agriculture, Forestry and Fisheries, Akita Prefecture. Guidelines for Soybean Cultivation; Department of Agriculture, Forestry and Fisheries, Akita Prefecture: Akita, Japan, 2015; pp. 26–29. (In Japanese) [Google Scholar]
  20. Department of Agriculture, Forestry and Fisheries, Akita Prefecture. Guidelines for Rice Cultivation; Department of Agriculture, Forestry and Fisheries, Akita Prefecture: Akita, Japan, 2014; pp. 43–51. (In Japanese) [Google Scholar]
  21. Takakai, F.; Ichikawa, J.; Ogawa, M.; Ogaya, S.; Yasuda, K.; Kobayashi, Y.; Sato, T.; Kaneta, Y.; Nagahama, K. Suppression of CH4 emission by rice straw removal and application of bio-ethanol production residue in a paddy field in Akita, Japan. Agriculture 2017, 7, 21. [Google Scholar] [CrossRef]
  22. Koga, N.; Sawamoto, T.; Tsuruta, H. Life cycle inventory-based analysis of greenhouse gas emissions from arable land farming systems in Hokkaido, northern Japan. Soil Sci. Plant Nutr. 2006, 52, 564–574. [Google Scholar] [CrossRef]
  23. Uchida, Y.; Akiyama, H. Mitigation of postharvest nitrous oxide emissions from soybean ecosystems: A review. Soil Sci. Plant Nutr. 2013, 59, 477–487. [Google Scholar] [CrossRef]
  24. Minamikawa, K.; Nishimura, S.; Nakajima, Y.; Osaka, K.; Sawamoto, T.; Yagi, K. Upward diffusion of nitrous oxide produced by denitrification near shallow groundwater table in the summer: A lysimeter experiment. Soil Sci. Plant Nutr. 2011, 57, 719–732. [Google Scholar] [CrossRef]
  25. Davidson, E.A.; Keller, M.; Erickson, H.E.; Verchot, L.V.; Veldkamp, E. Testing a conceptual model of soil emissions of nitrous and nitric oxides. Bioscience 2000, 50, 667–680. [Google Scholar] [CrossRef]
  26. Toma, Y.; Kimura, S.D.; Yamada, H.; Hirose, Y.; Fujiwara, K.; Kusa, K.; Hatano, R. Effects of environmental factors on temporal variation in annual carbon dioxide and nitrous oxide emissions from an unfertilized bare field on Gray Lowland soil in Mikasa, Hokkaido, Japan. Soil Sci. Plant Nutr. 2010, 56, 663–675. [Google Scholar] [CrossRef]
  27. Eusufzai, M.K.; Tokida, T.; Okada, M.; Sugiyama, S.; Liu, G.C.; Nakajima, M.; Sameshima, R. Methane emission from rice fields as affected by land use change. Agric. Ecosyst. Environ. 2010, 139, 742–748. [Google Scholar] [CrossRef]
  28. Cheng, W.; Yagi, K.; Akiyama, H.; Nishimura, S.; Sudo, S.; Fumoto, T.; Hasegawa, T.; Hartley, A.E.; Megoniga, J.P. An empirical model of soil chemical properties that regulate methane production in Japanese rice paddy soils. J. Environ. Qual. 2007, 36, 1920–1925. [Google Scholar] [CrossRef] [PubMed]
  29. Akiyama, H.; Yagi, K.; Yan, X.Y. Direct N2O emissions from rice paddy fields: Summary of available data. Glob. Biogeochem. Cycles 2005, 19. [Google Scholar] [CrossRef]
  30. Mu, Z.J.; Kimura, S.D.; Hatano, R. Estimation of global warming potential from upland cropping systems in central Hokkaido, Japan. Soil Sci. Plant Nutr. 2006, 52, 371–377. [Google Scholar] [CrossRef]
  31. Nishimura, S.; Yonemura, S.; Sawamoto, T.; Shirato, Y.; Akiyama, H.; Sudo, S.; Yagi, K. Effect of land use change from paddy rice cultivation to upland crop cultivation on soil carbon budget of a cropland in Japan. Agric. Ecosyst. Environ. 2008, 125, 9–20. [Google Scholar] [CrossRef]
Figure 1. Seasonal changes in (a) soil temperature and precipitation (bars); (b) water filled pore space (WFPS); as well as (c) methane (CH4) and (d) nitrous oxide (N2O) fluxes during the soybean cultivation period (upland). Positive flux values indicate emission to the atmosphere and negative indicate uptake from the atmosphere. C: control; Fe; Fertilizer application; Fl: flowering stage; H: harvesting; I: immature compost; M: mature compost; S: sowing; SP: snow period (gray area).
Agriculture 07 00049 g001
Figure 2. Comparison of N2O flux from row and inter-low during the soybean cultivation period after ridging. Error bars indicate standard error. C: control; I: immature compost; M: mature compost.
Agriculture 07 00049 g002
Figure 3. Seasonal changes in: (a) soil temperature and precipitation (bars); (b) soil Eh; as well as (c) methane (CH4) and (d) nitrous oxide (N2O) fluxes during the rice cultivation period (paddy). Positive flux values indicate emission to the atmosphere and negative indicate uptake from the atmosphere. In the late August 2013, accidental drainage with drainage system trouble occurred in the immature compost plot. C: control; H: harvesting; I: immature compost; M: mature compost; MD: Mid-season drainage (orange area); SP: snow period (gray area). Red lines before MD and blue lines after MD indicate continuous flooding and intermittent drainage, respectively.
Agriculture 07 00049 g003
Figure 4. Decrease in soil carbon (C) storage (0–30 cm) under the soybean–rice cultivation.
Agriculture 07 00049 g004
Figure 5. Comparison of net greenhouse gas (GHG) balance in soybean (upland) and rice (paddy) cultivation field. Positive values indicate net emission to the atmosphere. Carbon dioxide (CO2) was estimated from soil carbon loss. Methane (CH4) and nitrous oxide (N2O) fluxes were obtained by the closed chamber method. C: control; I: immature compost; M: mature compost.
Agriculture 07 00049 g005
Table 1. Annual methane (CH4) and nitrous oxide (N2O) emissions from the soybean cultivated field (upland) for three years (2008–2010).
YearPlotCH4N2OGWP (Mg CO2-eq ha−1 year−1) Measurement Period
(kg C ha−1 year−1)(kg N ha−1 year−1)CH4N2OTotal
2008C5.511.730.250.811.0610 Jun 2008 to 8 Jun 2009
I0.892.700.041.261.30
M3.140.880.140.410.56
Average 3.18 ± 1.33 a1.77 ± 0.52 a0.14 ± 0.060.83 ± 0.250.97 ± 0.22 a
2009C1.961.850.090.870.968 June 2009 to 11 Jun 2010
I1.352.730.061.281.34
M2.491.900.110.891.00
Average 1.93 ± 0.33 a2.16 ± 0.28 a0.09 ± 0.011.01 ± 0.131.10 ± 0.12 a
2010C0.151.440.010.670.6811 Jun 2010 to 22 May 2011
I1.941.750.090.820.91
M1.731.290.080.610.68
Average 1.28 ± 0.57 a1.49 ± 0.13 a0.06 ± 0.030.70 ± 0.060.75 ± 0.07 a
Three years average C2.54 ± 1.57 A1.68 ± 0.12 A,B0.12 ± 0.070.78 ± 0.060.90 ± 0.11 A,B-
I1.40 ± 0.30 A2.39 ± 0.32 B0.06 ± 0.011.12 ± 0.151.18 ± 0.14 B
M2.45 ± 0.41 A1.36 ± 0.30 A0.11 ± 0.020.64 ± 0.140.75 ± 0.13 A
Positive values indicate net emissions to the atmosphere. Calculated using the GWP of CO2:CH4:N2O = 1:34:298 [2]. Values represent average ± standard error for three plots in each year or three years and numbers of CH4 and N2O emission and total GWP within a column followed by different letters differ significantly among the years (lowercase) or plots (uppercase) (Two-way ANOVA (Year × Plot) followed by Tukey’s test, p < 0.10). C: control; I: immature compost; M: mature compost.
Table 2. Annual methane (CH4) and nitrous oxide (N2O) emissions from the rice cultivated field (paddy) for three years (2011–2013).
YearPlotCH4N2OGWP (Mg CO2-eq ha−1 year−1) Measurement Period
(kg C ha−1 year−1)(kg N ha−1 year−1)CH4N2OTotal
2011C48.70.112.210.052.262 Jun 2011 to 17 May 2012
I71.50.373.240.173.41
M83.50.183.780.083.87
Average 67.9 ± 10.2 a0.22 ± 0.08 a3.08 ± 0.460.10 ± 0.043.18 ± 0.48 a
2012C106.90.284.840.134.9727 May 2012 to 8 May 2013
I113.70.505.150.235.39
M133.90.256.070.126.19
Average 118.1 ± 8.1 a0.34 ± 0.08 a5.36 ± 0.370.16 ± 0.045.52 ± 0.36 a
2013C364.00.0316.500.0116.5230 May 2013 to 12 May 2014
I §274.11.1512.430.5412.96
M580.00.5926.290.2726.57
Average 406.1 ± 90.8 b0.59 ± 0.32 a18.41 ± 4.120.28 ± 0.1518.68 ± 4.07 b
Three years average C173.2 ± 96.9 A0.14 ± 0.07 A7.85 ± 4.390.07 ± 0.037.92 ± 4.37 A-
I153.1 ± 61.7 A0.67 ± 0.24 A6.94 ± 2.800.32 ± 0.117.25 ± 2.91 A
M265.8 ± 157.8 A0.34 ± 0.13 A12.05 ± 7.150.16 ± 0.0612.21 ± 7.21 A
Positive values indicate net emissions to the atmosphere. Calculated using the GWP of CO2:CH4:N2O = 1:34:298 [2]. Values represent average ± standard error for three plots in each year or three years and numbers of CH4 and N2O emission and total GWP within a column followed by different letters differ significantly among the years (lowercase) or plots (uppercase) (Two-way ANOVA (Year × Plot) followed by Tukey’s test, p < 0.10). § Influenced by accidental drainage with drainage system trouble in the late August. C: control; I: immature compost; M: mature compost.

