Article

Phenotypic Variability Assessment of Sugarcane Germplasm (Saccharum officinarum L.) and Extraction of an Applied Mini-Core Collection

by
Atena Shadmehr
1,
Hossein Ramshini
1,*,
Mehrshad Zeinalabedini
2,*,
Masoud Parvizi Almani
3,
Mohammad Reza Ghaffari
2,
Ali Izadi Darbandi
1 and
Mahmoud Fooladvand
3
1
Department of Agronomy and Plant Breeding Sciences, Agricultural College of Aburaihan, University of Tehran, Emam reza Blvd, Pakdasht, Tehran 3391653755, Iran
2
Systems Biology Department, Agricultural Biotechnology Research Institute of Iran, Agricultural Research, Education and Extension Organization (AREEO), 31359-33151 Karaj, Iran
3
Department of Biotechnology, Cane Development and Sidelong Industrial Research and Education Institute, Golestan Blvd, Khuzestan 1465834581, Iran
*
Authors to whom correspondence should be addressed.
Agriculture 2017, 7(7), 55; https://doi.org/10.3390/agriculture7070055
Submission received: 30 April 2017 / Revised: 21 June 2017 / Accepted: 26 June 2017 / Published: 6 July 2017

Abstract

:
The sugarcane germplasm collection located in Khuzestan, Iran, is one of the most important genetic resources with valuable accessions from different continents. However, this collection has not been properly used by breeders due to the extremely large population. The aim of this study was to phenotypically characterize the sugarcane germplasm and form a mini-core collection. Hence, 13 morphological traits were evaluated on 253 accessions. The primary germplasm was grouped into 10 clusters based on partial repeated bisection (RB) data, where the smallest cluster contained three accessions from two breeding centres (USA and Cuba). Using principal component analysis (PCA), the first two PCs (principal component) explained 59.5% of the total variation. A mini-core of 21 accessions was created by using the maximization strategy, with a low mean difference percentage (MD = 2.31%) and large coincidence rate of range (CR = 93.96%). The sugarcane mini-core represented the major diversity of the primary collection. The means and medians between the mini-core and the primary collection did not differ significantly. Accessions with high sugar and cane yield, originating from the USA, Cuba, Argentina, and South Africa, were in the mini-core collection. In this paper, we established, for the first time, an applied mini-core collection in sugarcane germplasm. The mini-core collection, as a breeding collection, is a highly suitable, manageable, and efficient subset for the enhanced use of sugarcane germplasm in breeding programs.

1. Introduction

Sugarcane belongs to the genus Saccharum L., of the tribe Andropogoneae in the family of Poaceae (Gramineae), which is grown widely in tropical and subtropical regions across the world [1].
In Iran, there is a Cane Development and Sidelong Industrial Research and Education Institute located in Khuzestan province that was officially founded in 1981. The sugarcane germplasm collection located at this institute includes approximately 340 accessions from Saccharum officinarum L. and interspecific hybrids. This set has been collected from different continents, such as the USA, Cuba, Brazil, Argentina, South Africa, India, and Australia, and has been maintained over the years in Iran. It seems that present accessions are well adapted to the climate of Iran, and the collection probably contains genotypes carrying genes for cold tolerance. The sugarcane collection in Khuzestan (primary collection), which has been selected manually from whole accessions across the world, is actually a core collection (CC). Due to the large size of the collection (340 accessions), there are problems concerning the management and use of this genetic resource. Hence, a diverse mini-core collection or breeding collection could be a beneficial resource for sugarcane breeders [2]. Formation of a reduced subset of sugarcane genetic resources in Khuzestan is very important for assessing the population structure and diversity and for identifying sources of variation in breeding programs. So far, there has been no research to assess the morphological diversity of the entire sugarcane germplasm in Iran, indicating the necessity of a comprehensive evaluation of the accessions in the mentioned collection.
Despite the diversity of resources and genotypes, one of the major problems faced during plant breeding programs is insufficient use of the whole germplasm, because it is difficult to manage and utilize a large number of genotypes in germplasm collections. It is accepted that recognition and use of diversity in germplasm is very important prior to starting a breeding program [3]. There is a growing body of literature that recognizes the importance of constructing a core or mini-core collection for conservation of novel variations in genetic resources [2,4,5]. A core collection is defined as a limited set of accessions representing the minimum of repetition and the maximum of the genetic diversity of a crop species and its wild relatives [6]. Similar to the definition of a core collection [6], a mini-core collection is defined as a reduced subset of a core collection with minimum repetitiveness and maximum genetic diversity of the source germplasm [7]. Previous studies have reported that a core collection would be better if it contains 10% of the entire collection and a mini-core collection contains 10% of the core collection or 1% of the entire collection [8]. A mini-core collection is important in order to identify sources of resistance to biotic and/or abiotic stresses and agronomic and nutritional traits. In sugarcane, it is arguable that the accessions with high sucrose content can be selected for sugar production. More importantly, such a subset of germplasm is also useful for recognition of superior energy cane cultivars, i.e., with high biomass and lignocellulosic compounds and fiber, which are appropriate for lignocellulosic ethanol production [9]. Additionally, a core or mini-core collection plays an important role in assessing allelic richness and association genetics, especially for identifying important QTLs (quantitative trait locus) controlling desirable traits, such as yield and fiber content.
Over the years, phenotypic traits have played an important role in genetic diversity analysis and in discriminating genotypes in order to form a core and/or mini-core collection [10,11,12]. Similarly, previous studies have reported establishing a core collection of germplasm in sugarcane based on morphological traits [2,13,14,15]. Phenotypic characterization of a germplasm collection is an increasingly important step in plant breeding programs since breeders can evaluate variations and select high performance accessions more efficiently. Although several studies have been carried out on core collection construction in sugarcane [2], no single study has established the breeding collection (BC), actually named mini-core collection, of sugarcane germplasm.
The goals of our work were (1) comprehensive evaluation of sugarcane genetic resources in Iran and measuring important phenotypic traits on four dates over two growing seasons and (2) to create a mini-core collection or breeding collection that captures most of the phenotypic diversity of the primary collection. The present research attempts, for the first time, to establish a mini-core collection in sugarcane germplasm. This study provides an exciting opportunity to advance our knowledge of germplasm characterization for discovering new sources of variations in order to enhance the use of germplasm for cultivar improvement.

2. Materials and Methods

2.1. Plant Materials

The materials comprised 253 sugarcane accessions collected from different continents. All accessions in the collection belong to the Saccharum officinarum L. and all of them are hybrids. The accessions’ names have been derived from their origin or breeding centre. For example, C85-102 is a variety of Cuban sugarcane, and the breeding centre of the FGO2-250 variety is France. These accessions were evaluated in a randomized complete block design with four replications at the experimental station of the Cane Development and Sidelong Industrial Research and Education Institute of Khuzestan, Iran in two successive seasons (2012 and 2013). The plot size was 100 m2 including five rows, 20 m long with a between-row spacing of 1 m.

2.1.1. Measurements of Phenotypic Traits

Sugarcane planting was done in June 2010, and morphological traits and sugar yield factors were measured during two separate seasons. The first season was January 2012, and coincided with 18-month-old plants. The second season was comprised of three successive time points, namely November 2012, January 2013, and February 2013, and coincided with ratoon plants. The plan was to record data in the abovementioned time points in order to gain a detailed understanding of growth periods, and to assess the difference between them and, consequently, to recognize critical stages for gaining the optimum yield. Thirteen traits (Table 1) were measured for 253 accessions grown in the field, across two separate seasons. First, the whole collection (comprising 340 accessions) was chosen, but because of the expected difficulty of obtaining phenotypic traits for all accessions, and also because of missing data in sugar yield measurements such as Brix% or sugar%, measurements were restricted to 253 accessions. Stalk height (cm), internode length (cm), and stalk diameter (mm) were measured on five stalks at harvest according to Dillewiijn [16] and were averaged subsequently. The canes were cut and the average weight of 10 canes was recorded. After peeling the selected canes, they were crushed in a mill to calculate the percentage and weight of juice. The Brix value (total soluble solids) was determined with a refractometer, and Pol (apparent sucrose) in sugarcane juice was determined with saccharimeter (a saccharimeter is simply a polarimeter specially designed for measuring the polarization of sugars). Purity is the percentage of pure sucrose in dry matter that was calculated as [Pol/Brix] × 100. In order to calculate the recoverable sucrose (%) (RS), the following formula was used:
Recoverable   sucrose   %   =   { Pol %     ( Brix % Pol % 2   ) } ×   juice   extraction %
Cane yield was estimated as the number of stalk (m2) × stalk weight. For calculation of sugar yield (kg sugar ha−1), RS was multiplied with cane yield per hectare [17].

2.2. Statistical Analysis

2.2.1. Descriptive Statistics

Data management and analysis were carried out using SAS [18]. Descriptive statistics including mean, median, range, and variance were generated for all variables for both the primary germplasm and the mini-core collection. A normality test was performed with the Shapiro–Wilk W method. In this study, the analysis of variance (ANOVA) was conducted and the experimental design was considered as a randomized complete block design with four replications. Each time point was mentioned as a replication.

2.2.2. Correlation and Regression Analysis

Pairwise correlations were obtained by using the Pearson method in Proc Corr of SAS [18]. Stepwise multiple linear regression analysis was carried out using SAS program using Proc Reg [18]. In this analysis, recoverable sucrose (RS) was considered as dependent variable and the remaining traits as independent variables. Prior to analyzing the regression, in order to identify important characteristics affecting the amount of white sugar (RS), and moreover to avoid the loss of fit due to multicollinearity phenomenon (correlation between predictors that one can be linearly predicted from the others with a substantial degree of accuracy), the level of multicollinearity was estimated with the most widely used criterion of the Variance Inflation Factor (VIF) as suggested by Hair et al. [19]. High VIF values (above 10) indicate a high collinearity [19].

2.2.3. Clustering

To reduce data dimensions for better visualization of accessions and traits, principal component analysis (PCA) was conducted for 13 traits and 253 accessions using statistical software SPSS (version 19, IBM Corp, Armonk, NY, USA). Clustering analysis of accessions in the primary collection based on morphological traits was performed using gCLUTO software (version 1.0, University of Minnesota, Twin Cities, MI, USA) based on the RB (repeated bisection) method. The advantage of Graphical Clustering Toolkit (gCLUTO) [20] is the better visualization of the clusters.

2.3. Establishment of Mini-Core Collection

PowerCore software v 1.1 [21] was used to construct the mini-core collection by analysing phenotypic data using maximization strategy (M strategy). The M strategy was used to select entries of subset collection with highest diversity through a modified heuristic algorithm [22]. In order to compare means or medians of traits between primary and mini-core collection, t-test and Wilcoxon signed-rank method was used in Proc t-test and in Proc NPAR1WAY, respectively [18]. For traits with normal distribution, the t-test was performed, and for traits with non-normal distribution, the non-parametric Wilcoxon signed-rank method was used. The Ansari-Bradley test was performed using Proc NPAR1WAY to compare the variance of traits with non-normal distributions between the mini-core and primary collection. Moreover, comparison of the variances of traits with normal distributions, between two collections, was carried out using F test. The Shannon–Weaver diversity index [23] was estimated using PowerCore software based on all the traits to measure the diversity of accessions in the primary and mini-core collection, and finally this index was compared between entire collection and mini-core collection with pairwise t-test in SAS Proc means.

3. Results

3.1. Phenotypic Characterization & Trait Distributions

3.1.1. Morphological Traits

The average stalk height in the second season was 168.2 cm, which was significantly (p ≤ 0.05) higher than the stalk height in the first year (125.6 cm). There were no significant differences in stalk height among the three time points of the second season (Figure 1a). The same trend was found for internode length, as the first season mean (8.8 cm) was lower than that of the second season (10.1 cm) (Figure 1b). Contrary to these findings, the average stalk diameter in the first season (23.4 mm) was higher than that of the second season (22.6 mm), and this difference was found to be significant (p ≤ 0.05) (Figure 1c).

3.1.2. Sugar-Related Traits and Cane Yield

There was a clear trend of an increase in in juice weight during two seasons (Figure 1d). In February 2013, juice weight was significantly higher than those in other time points. The results obtained from the measurement of mean percentage of Brix are presented in Figure 1e. The mean percentage of Brix (18.74%) was at a maximum in January 2012. In November 2012, the value obtained was minimum (17.70%), but it increased in subsequent time points. It was 18.10% and 18.53% at harvest times in January 2013 and February 2013, respectively. There were significant differences (p ≤ 0.05) between the three harvest times in the second season for this trait (Figure 1f). The trend for recoverable sucrose (RS %) was the same as that of Brix, i.e., the RS percentage was significantly higher in the first season than that of the second season. As shown in Figure 1g, the average cane yield in the second season was much higher than that in the first season. Cane yield in November 2012 was 25% higher than January 2012, but no significant differences were found between the three time points in the second season. Figure 1h provides an overview of mean sugar yield of the primary collection sugarcane accessions measured in four harvest time points. In the third time point in the second season (February 2013), the mean sugar yield was significantly higher (p ≤ 0.05) than other time points.
The normality test was carried out according to the Shapiro–Wilk test. The results revealed that the distributions of all traits in the first season were non-normal, but in the second season, distributions for stalk height, stalk diameter, stalk internode number, cane weight, RS percentage, and sugar yield were normal. The distribution of the means of two seasons for stalk height, stalk internode length, stalk diameter, POL%, and RS% was normal, while for other traits it was non-normal.

3.2. Correlations Analysis of Traits Measured in Different Time Points

The pair-wise Pearson product-moment correlation analysis was used to determine the relationship between different harvest time points in two seasons in the primary collection (Table 2). The analysis showed medium R-value for most traits among different time points. Nevertheless, in several traits there were significant positive correlations among different harvest times. For example, a significant positive correlation (p ≤ 0.01) was found between January 2013 and February 2013 for stalk height, internode length, stalk diameter and cane yield with R-values of 0.98, 0.99, 0.98 and 0.99, respectively. In contrast, the lowest correlations between time points were between January 2012 and November 2012 for Brix (R = 0.21) and RS (R = 0.15). Generally, as Table 2 shows, there are modest correlations among different time points for different traits.
Further correlation analysis among traits (Table 3) revealed the strong positive correlation between POL% and RS% (R = 0.96, p ≤ 0.01) and also between Brix% and POL% (R = 0.95, p ≤ 0.01). It is apparent from this table that there is a significant positive correlation between cane yield and sugar yield (R = 0.92). Also, RS% was correlated significantly with Brix%; likewise, juice weight with cane weight, both of them with R = 0.90 (p ≤ 0.01). A significant negative correlation was detected between stalk diameter and cane yield (Table 3). In this investigation, the correlation between sugar yield with internode number and POL% was not significant (Table 3). Among the traits, RS%, Pol%, Brix%, PTY%, stalk height, and internode length had significant correlation with sugar yield, suggesting that these traits perhaps can be manipulated for sugar yield improvement in sugarcane.

3.3. Multiple Stepwise Regression Analysis

During genetic improvement, breeders are interested in those traits that have causative effects on economical traits. In this research, to do multiple stepwise regressions, the percentage of recoverable sucrose (RS%) was considered as the dependent variable and other remaining characters as independent variables. The result of the stepwise regression analysis is summarized in Table 4. Accordingly, 96% of total variation for the RS% could be explained by two characters; Brix percent (82%) and PTY percent (14%). The most positive effective traits on RS% were Brix and PTY. Juice weight had a significant negative effect on RS%.

3.4. Principal Component Analysis

Figure 2 exhibits the distribution of accessions and traits in groups according to PCA. The first two principal components (PCs) provided a reasonable summary of the data and explained 59.51% of the total variation. PC1 explained 32.36% of the total variation. The most effective traits on this component were sugar yield, cane yield, stalk height and internode length. The second PC, which represented 27.15% of the variation, mainly represented RS% and Brix%. According to PCA result, CL61-620 and CL73-239 (from the USA) were two accessions with the highest content of RS and Brix percent. Likewise, CP73-1547, CP44-101 (from the USA) and TUC68-19 (from Argentina), were accessions with the highest sugar yield and cane yield. From this data, it can be seen that F134, Q138 and CL54-336 accessions had the lowest content of Brix and RS percent. Also, some accessions like CP75-1353, CP81-1254 and CP73-21 (from the USA) had high values for both Brix and sugar yield.

3.5. Graphical Clustering Analysis

The results obtained from the clustering analysis are summarized in Table 5. As can be seen, all the accessions were grouped in 10 segregated clusters based on the RB method. The highest and lowest numbers of accessions were observed in Clusters 8 and 1, respectively. This data showed that Clusters 7 and 9 resulted in the highest value of average internal similarities (Isim) (0.999), and Clusters 2 and 6 with Isim of 0.997 had the lowest value of internal similarities. Data from this table can be compared and completed with Figure 3, which shows the mountain visualization of relationships between the 10 clusters. Considering the distances between peaks, cluster 1 is the farthest group from other clusters and thus has the lowest value of average external similarities (Esim) (Table 5). Moreover, the lowest peak height was seen in Clusters 2 and 6, which represents the lowest value of internal similarity in these clusters. As Figure 3 shows, accessions from Cuba, the USA, South Africa, India, and Iran were grouped in the same cluster (Cluster 3). The data in Figure 3 and Table 5 makes it apparent that the smallest group is Cluster 1, which contains only three accessions from two breeding centres in the USA and Cuba, while other clusters, which had accessions from several breeding centres, were grouped in the same cluster.

3.6. Constructing a Mini-Core Collection

Based on the PowerCore program output, conducted on the entire collection (253 accessions), a mini-core collection was generated that included 21 accessions using M strategy and heuristic search. Descriptions of the 21 selected accessions with important morphological and sugar-related traits have been shown in Table 6.
To compare the primary collection with the mini-core collection, the variance difference (VD = 53.5%), mean difference (MD = 2.31%), coincidence rate (CR = 93.96%), and variable rate (VR = 147.28%) were calculated. In traits with normal distribution, there were no significant differences between the means of two collections (Table 7). Similarly, in non-normal traits, there were no significant differences between the medians of two collections (Table 7). The F test showed significant differences between variances of two collections for normally distributed traits, while, for non-normally distributed traits, except for juice weight, no significant differences were found between two collections (Table 7). Interestingly, for those traits with significant difference in variation, the mini-core collection was more diverse than the whole collection.
To compare the variability of two collections, mini-core collection and primary collection, the Shannon–Weaver diversity index was also used for each trait in each collection (Table 7). The mean of the Shannon–Weaver diversity index scores for primary and mini-core collections were 17.50% and 20.11%, respectively. Pairwise t-test for comparing this index between two collections revealed significant difference, i.e., two collections have different variability. Altogether, these results confirmed that the mini-core collection was a good representation of the primary collection and captured much of the diversity present in the primary collection.

4. Discussion

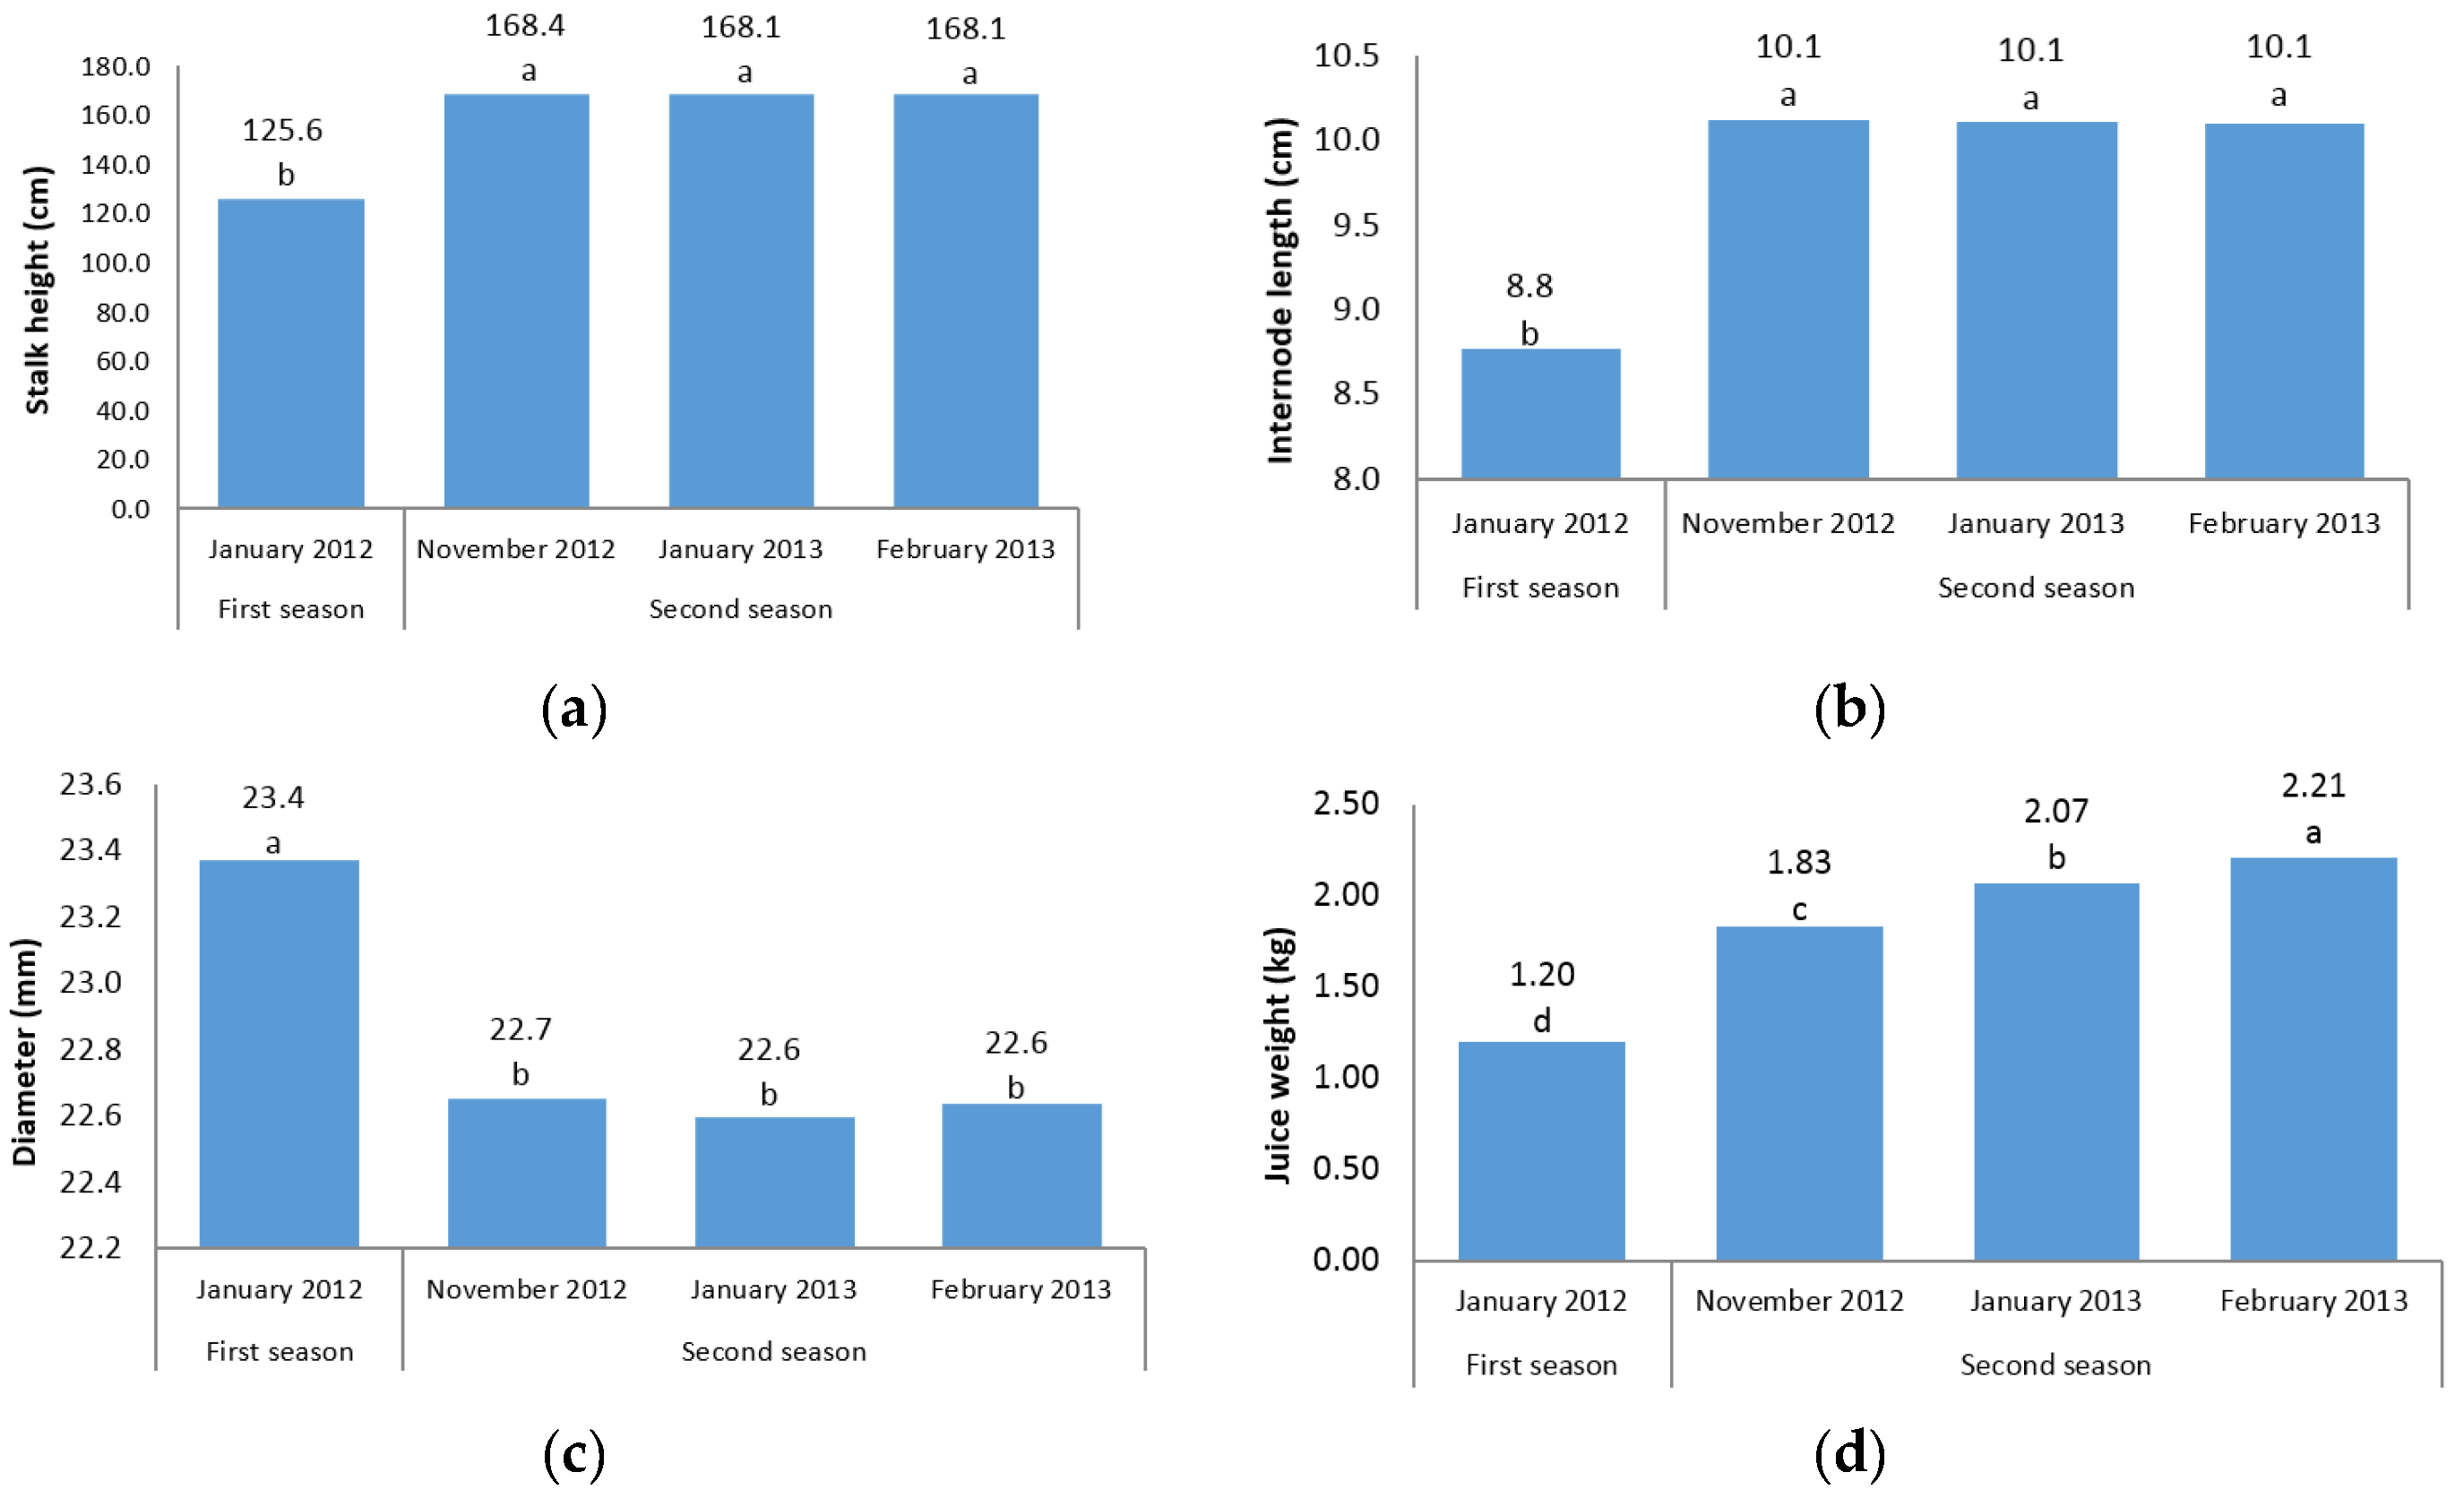
The first question of this study sought to characterize the sugarcane germplasm with the assessment of phenotypic traits. The mean analysis showed that no differences were found among three harvest time points of the second season for stalk height, internode length, stalk diameter, and cane yield (Figure 1a–c,g). A possible explanation for this result might be that there is cold weather and short daylight in November, January, and February in the second season in Iran, which may have led to a lack of adequate photosynthesis and no differences between the time points were found. Another reason could probably be due to the short time intervals between three harvests; hence, plants did not have growth opportunities. However, for other traits there were significant differences between the three time points in the second season (Figure 1d–f,h). In fact, for morphological traits, the harvest time differences were not significant; while for sugar-related traits significant differences between the three time points of the second season were observed. A significant increase in height from one season to the next was observed (Figure 1a). These results are consistent with those reported by Todd et al. [2], who showed a significant increase in height in the Saccharum officinarum species at different measurement times.
The present experiment was conducted during four harvest times (in two seasons) to determine the effect of growth periods to select the best harvest time in order to achieve the highest cane and sugar yield. It is interesting to note that in all sugar-related traits, significant differences between two seasons and/or different time points were observed (Figure 1d–f,h). This finding showed that the best time point with the maximum sugar yield is February in the second season. The same trend was observed for cane yield in which second season values were significantly (p ≤ 0.05) higher than first season records. Due to the significant increase in cane yield in the second season, these findings suggest the best time for sugarcane harvest to be the second season. Also, it could conceivably be hypothesized that energy-cane cultivars/accessions are preferably harvested in the second year (ratoon stage) due to the importance of cane yield in the production of high biomass and lingo-cellulosic compounds (Figure 1g).
As mentioned earlier, the greatest magnitudes of correlations were observed between January 2013 and February 2013 for stalk height, internode length, stalk diameter and cane yield (Table 2). The observed correlation may be due to the short time interval between January and February harvest times and subsequently, a lack of plant growth. These results are in agreement with those reported by Todd et al., [2] in which there were high correlations for stalk height, stalk diameter, and internode length between two time points. In correlation analysis among traits, positive association was seen between cane yield with stalk height and internode length, at α = 0.01. Cane yield is one of the major parameters for assessment of sugarcane performance [24]. Hence, stalk height and internode length are two effective traits to improve and to recognize the high cane yield genotype. These results are in agreement with recent studies indicating that cane yield was associated positively with stalk height, internode length and cane thickness [25]. Another important significant positive correlation was found between sugar-related factors such as RS%, Pol%, Brix%, PTY%, with sugar yield. The present results are significant in at least two major respects. On the one hand, for sugar yield improvement in sugarcane accessions, it is suggested to focus and to manipulate the factors such as RS%, Pol%, Brix%, PTY%. On the other hand, for increase in cane yield, it is recommended to focus on stalk height and internode length.
In current research, Brix% and PTY% were identified as effective traits on RS%, according to multiple stepwise regression analysis results. Positive regression coefficients of these variables indicated that these variables can be mentioned as logical and reasonable indices for selection in order to improve recoverable sucrose in sugarcane. This result confirms the strong association between RS% with two variables of Brix% and PTY%, (Table 3). The question that arises here is that in the study of correlation analysis (Table 3), positive correlation between RS% and POL% was found while it is missing in the model. In fact, due to high multicollinearity among independent variables scaled by VIF, POL% was omitted from the analysis.
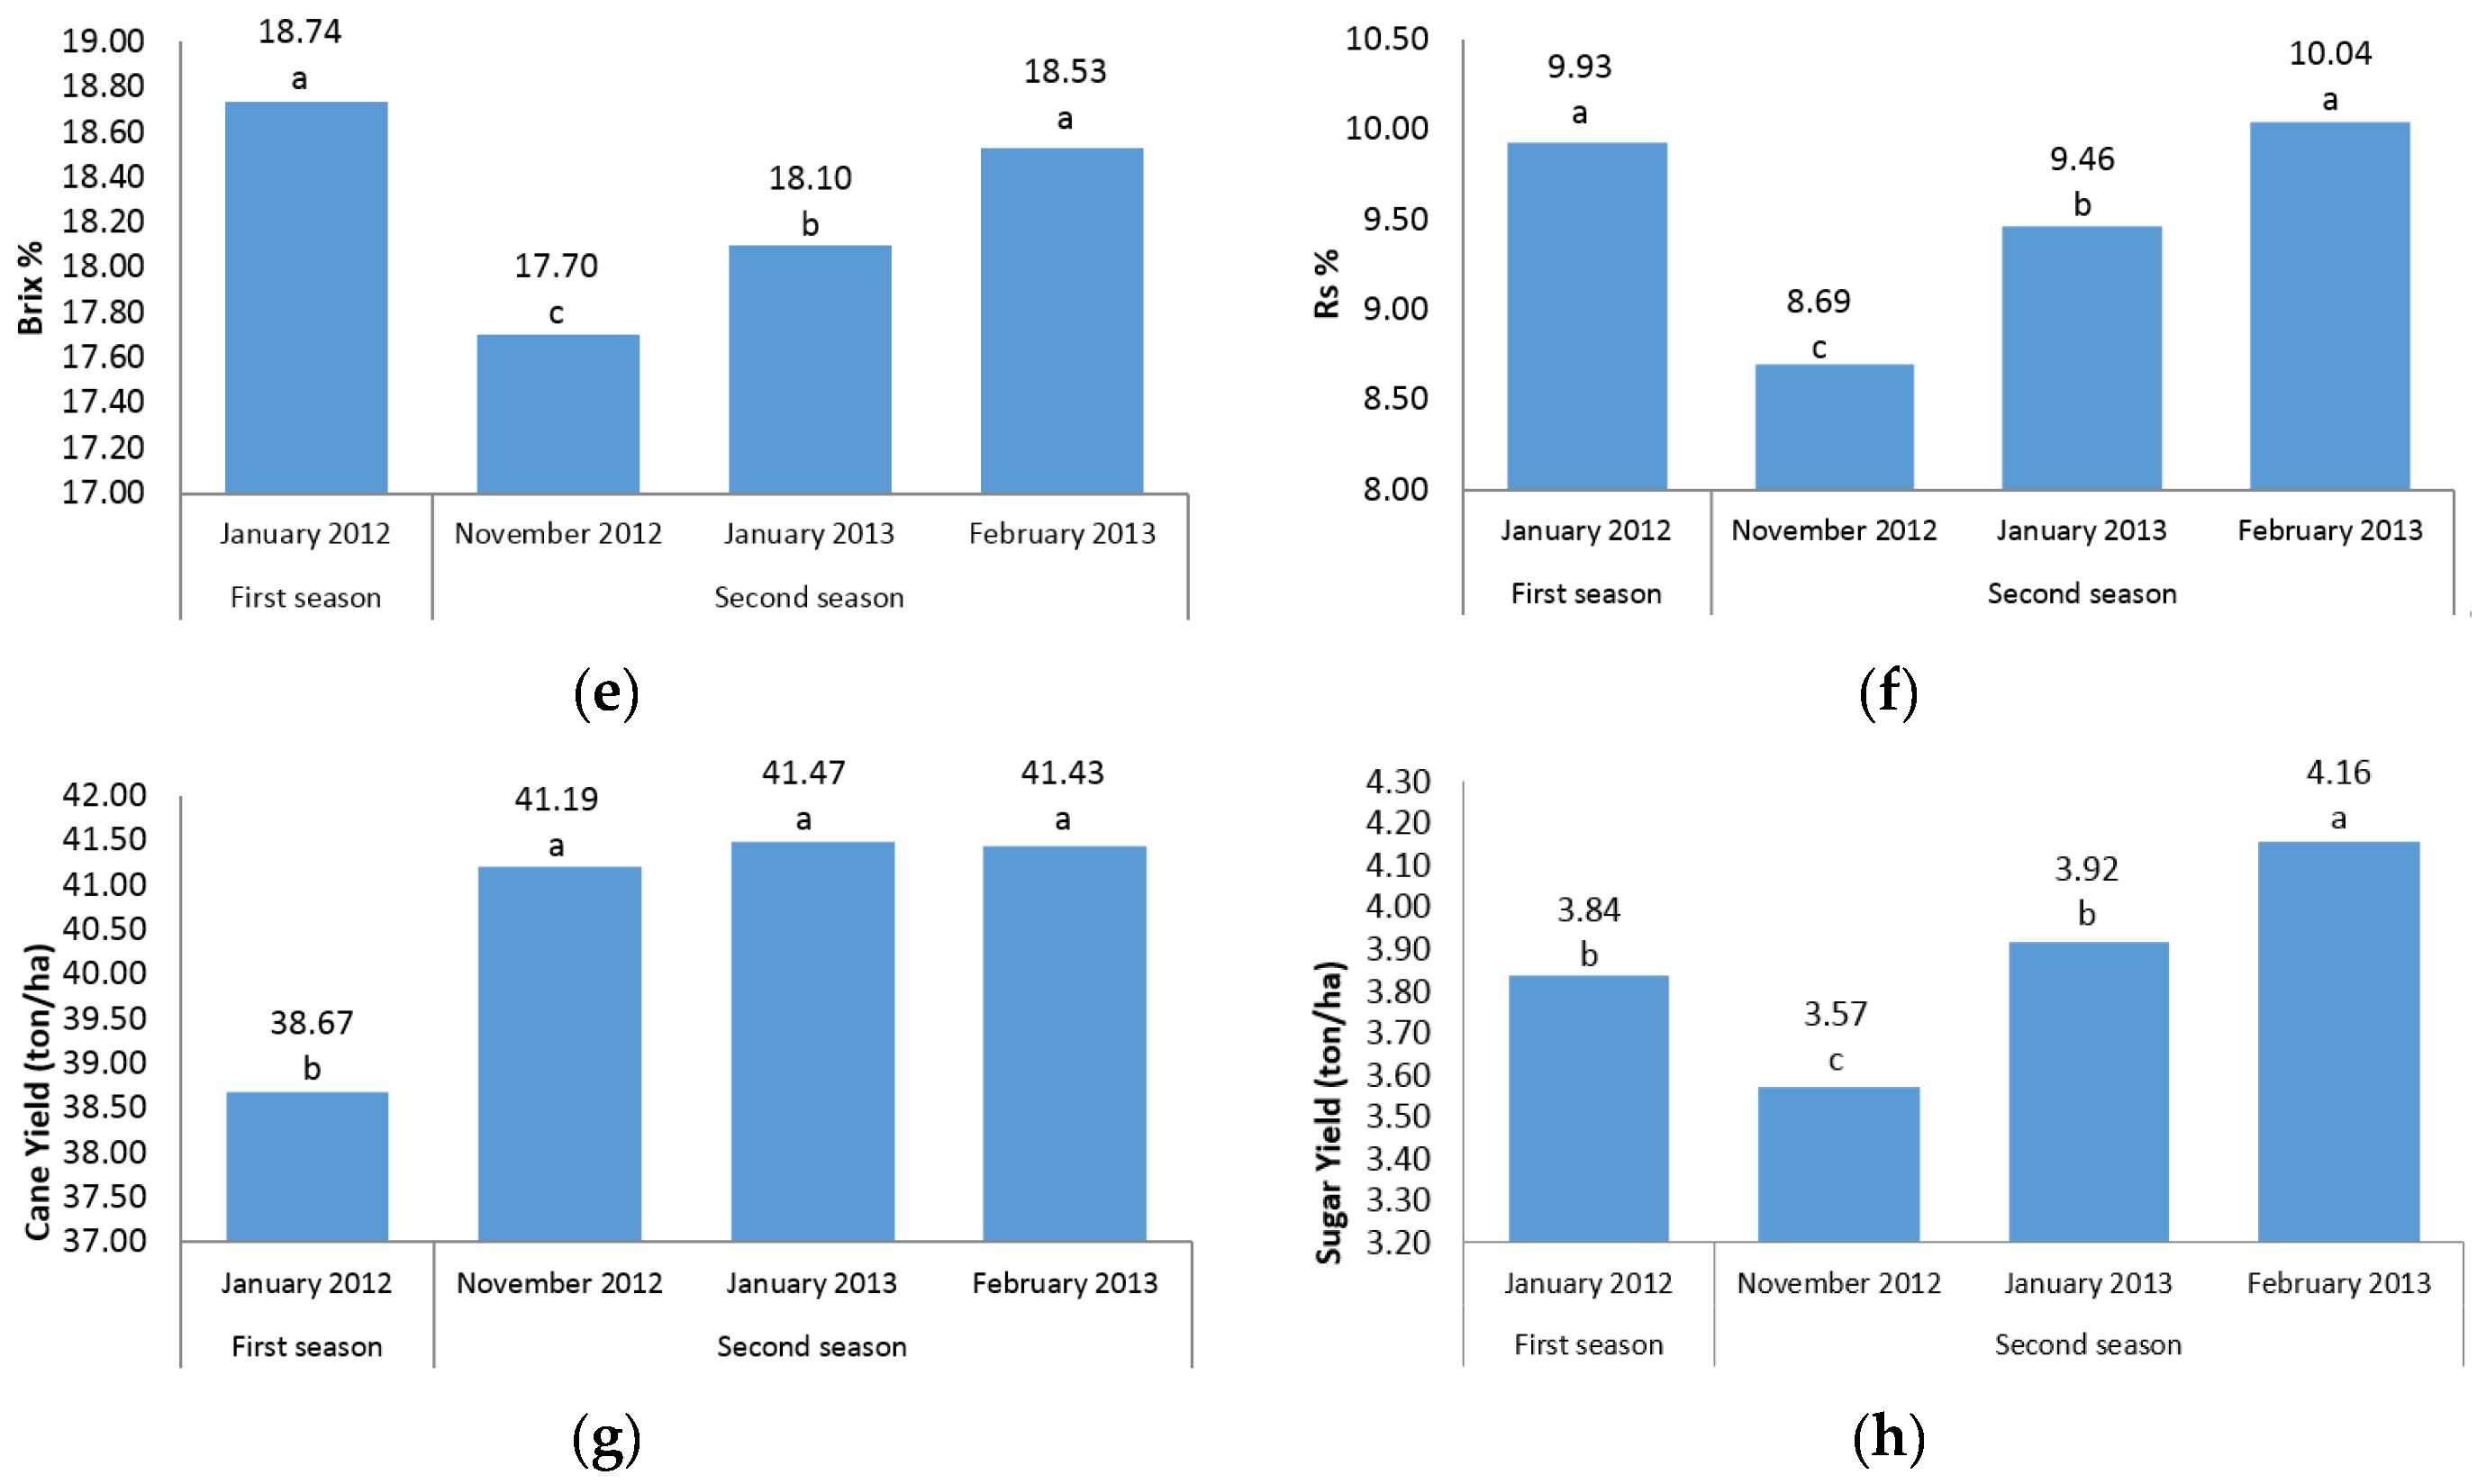
The PCA scatterplot of two principal components axes provided the distribution of primary collection accessions in a biplot. The PCA finding has important implications for introducing accessions with desirable traits, such as accessions with high content of RS% and Brix% or accessions with high/low sugar yield or cane yield (Figure 2). Arguably, depending on the approach of sugarcane breeding, these traits can be utilized by breeders. Some of the clear findings in the biplot are that CL61-620 and CL73-239 are accessions with the highest content of RS% and Brix% percent, and that CP45-3, Q68 and EH16-9 are accessions with the highest cane yield (Figure 2). Interestingly these accessions are present in the constructed mini-core collection in this research (Table 6).
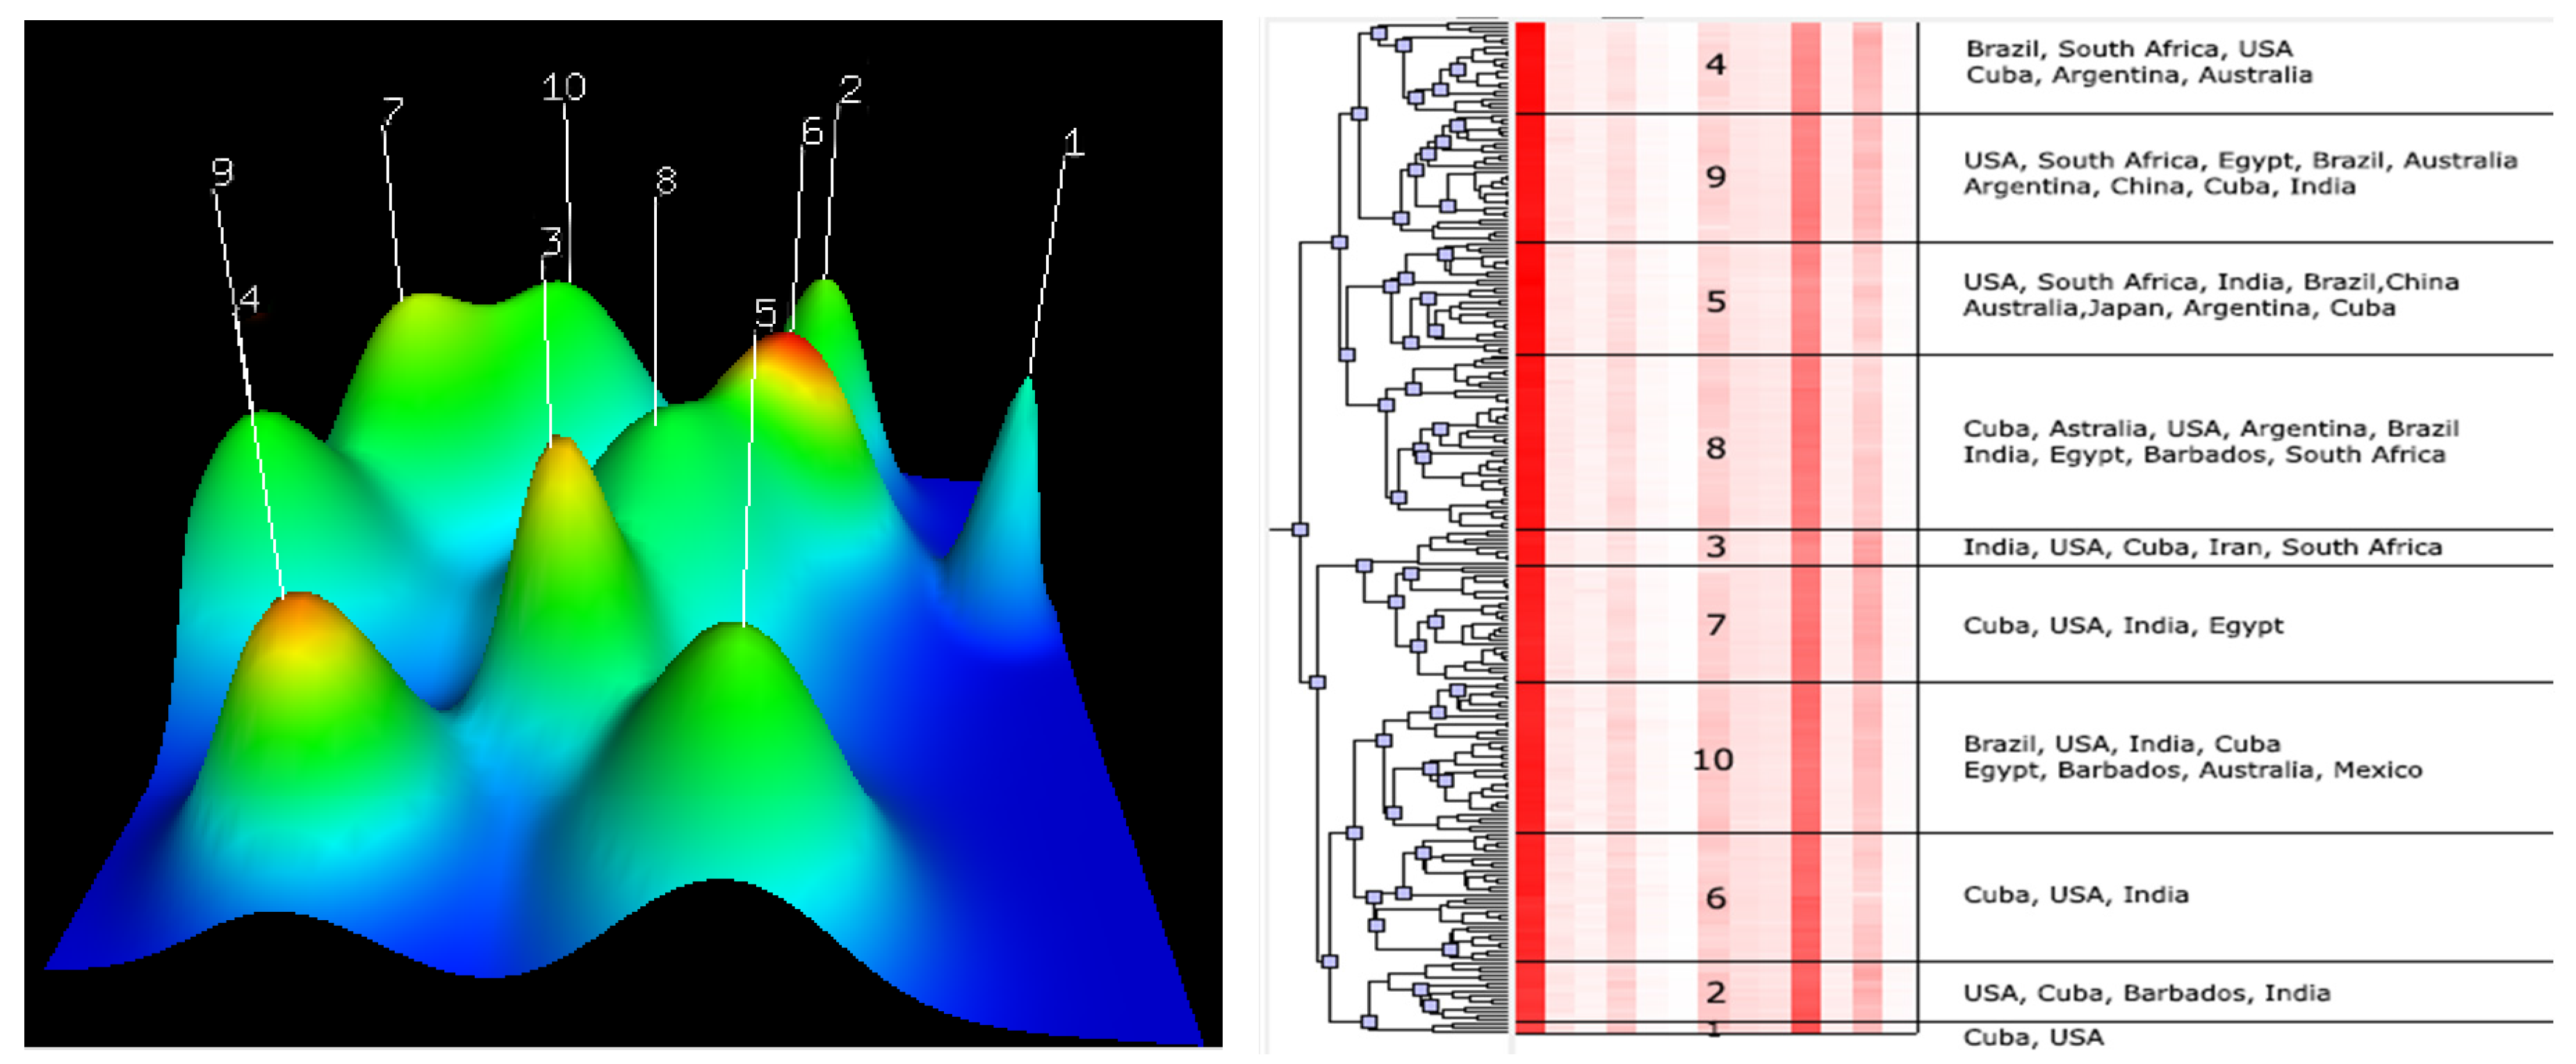
The clustering analysis revealed the morphologic similarity of different accessions from different breeding centres. For example, grouping of the USA and Cuba accessions in the same clusters indicated that there are morphologic similarities between these accessions (Figure 3). Likewise, the grouping of the Iran–Cuba hybrid (Iran) with the USA, India, Cuba, and South Africa varieties in Cluster 3 demonstrate the morphologic similarities between them (Figure 3).
The range values of all traits in both collections are shown in Table 7. As can be seen from the table (above), in the core collection (primary collection), the range value of stalk height and stalk diameter obtained 129.17 (cm) and 15.46 (mm) respectively. Todd et al. showed that range value of stalk height and stalk diameter 304.13 (cm) and 37.79 (mm), respectively, in World Collection of Sugarcane (Saccharum spp.) and Related Grasses of Sugarcane in Miami, Florida. This is different from the findings presented here about the range value of traits, but the mean value of the mentioned traits in our collection are consistent with data obtained with Todd et al [2].
With respect to the second research goal, PowerCore software was used to construct a mini-core collection. PowerCore software had been used previously to create core/mini collections for rice (Oryza sativa L.) [26,27], sesame (Sesamum indicum L.) [28], and chickpea (Cicer arietinum L.) [29]. Using this software, 21 accessions were selected to build a mini-core collection out of 253 accessions of sugarcane. These results confirm the appropriate number of subset collections (10% of the primary collection), as was mentioned in the literature [8]. A core/mini-core collection with a coincidence rate (CR%) greater than 80% has been recommended as a proper collection for breeding purposes [30]. In our analysis, the CR was found to be 93.96%, indicating that the mini-core collection selected from sugarcane germplasm is a good representative subset of the phenotypic diversity in the primary collection. Also, t- and Wilcoxon test results showed no significant difference in means and medians between the mini-core and primary sugarcane collections (Table 7). Furthermore, high values for VR% and VD% [31], which are the evaluating factors of core collections, reconfirm that the mini-core collection in this study incorporates the main portion of diversity of the primary sugarcane collection. Additionally, the F and Ansari–Bradley test results also revealed no significant loss of diversity in mini-core collection compared with the primary collection. Interestingly, for normally distributed traits, the mini-core collection was more diverse than the whole collection. However, for non-normally distributed traits, Ansari–Bradley test results showed non-significant difference between two collections, except for juice weight.
For comparing the Shannon–Weaver diversity indices between the two collections pairwise t-test was carried out. Accordingly, significant differences were found between the two collections, so that Shannon–Weaver index scores in the mini-core were significantly higher than in the primary collection. Higher variance in the core/mini collection relative to the entire collection has been reported frequently in previous researches [2,31,32].

5. Conclusions

The present study was designed to evaluate the primary germplasm of sugarcane (as a core collection) based on phenotypic traits and finally to construct a core set of accessions called the mini-core collection. This experiment led to the selection of a mini-core of 21 accessions (12.05% of the core collection of sugarcane) that retains the maximum diversity in the primary collection, as validated by comparing the Shannon–Weaver diversity index scores between the two collections. The average of coincidence rate of range in the 13 traits was 93.96%, indicating that the mentioned mini-core is a real representation of the core collection. Additionally, the findings of this study about both collections (primary/core and mini-core) have significant implications for the effective use of sugarcane germplasm, thereby enhancing our knowledge about important accessions with favourable traits, eventually, for sugarcane and energy cane improvement. In a sugarcane collection with a large germplasm, creating a mini-core or breeding collection is an efficient approach to identify the suitable parents for future breeding programs.

Acknowledgments

The authors are grateful to the Cane Development and Sidelong Industrial Research and Education Institute for providing helpful information about the sugarcane genotypes as well as giving facilities for the field trials. This study was funded by Agricultural Biotechnology Research Institute of Iran (grant number: 4/05/05/004/940008).

Author Contributions

This manuscript has derived from the PhD thesis of the first author and there are two supervisors, who are the two co-corresponding authors.

Conflicts of Interest

The authors declare no conflict of interest.

References

  1. Henry, R.J.; Kole, C. Genetics, Genomics and Breeding of Sugarcane; CRC Press, Taylor & Francis Group: New York, NY, USA, 2010. [Google Scholar]
  2. Todd, J.; Wang, J.; Glaz, B.; Sood, S.; Nayak, S.N.; Glynn, N.C.; Gutierrez, O.A.; Kuhn, D.N. Phenotypic characterization of the Miami World Collection of sugarcane (Saccharum spp.) and related grasses for selecting a representative core. Genet. Res. Crop Evol. 2014, 61, 1581–1596. [Google Scholar] [CrossRef]
  3. Govindaraj, M.; Vetriventhan, M.; Srinivasan, M. Importance of genetic diversity assessment in crop plants and its recent advances: An overview of its analytical perspectives. Genet. Res. Int. 2015, 2015, 1–14. [Google Scholar] [CrossRef] [PubMed]
  4. Zhang, H.; Zhang, D.; Wang, M.; Sun, J.; Qi, Y.; Li, J.; Wei, X.; Han, L.; Qiu, Z.; Tang, S.; et al. A core collection and mini core collection of Oryza Sativa. Theor. Appl. Genet. 2011, 122, 49–61. [Google Scholar] [CrossRef] [PubMed]
  5. Odong, T.L.; Jansen, J.; Van Eeuwijk, F.A.; Van Hintum, T.J. Quality of core collections for effective utilisation of genetic resources review, discussion and interpretation. Theor. Appl. Genet. 2013, 126, 289–305. [Google Scholar] [CrossRef] [PubMed]
  6. Frankel, O. Genetic perspective of germplasm collection. In Genetic Manipulations: Impact on Man and Society; Arber, W., Limensee, K., Peacock, W.J., Stralinger, P., Eds.; Cambridge University Press: Cambridge, UK, 1984; pp. 61–170. [Google Scholar]
  7. Upadhyaya, H.D.; Ortiz, R. A mini core subset for capturing diversity and promoting utilization of chickpea genetic resources in crop improvement. Theor. Appl. Genet. 2001, 102, 1292–1298. [Google Scholar] [CrossRef]
  8. Upadhyaya, H.D.; Gowda, C.L.L.; Sastry, D. Management of Germplasm Collections and Enhancing Their Use by Mini Core and Molecular Approaches. In Proceedings of the APEC-ATCWG Workshop, Taichung, Taiwan, 14–17 October 2008. [Google Scholar]
  9. Upadhyaya, H.D. Establishing core collections for enhanced use of germplasm in crop improvement. Ekin J. Crop Breed. Genet. 2015, 1, 1–12. [Google Scholar]
  10. Bhattacharjee, R.; Khairwal, I.S.; Bramel, P.J.; Reddy, K.N. Establishment of a pearl millet [Pennisetum glaucum (L.) R. Br.] core collection based on geographical distribution and quantitative traits. Euphytica 2007, 155, 35–45. [Google Scholar] [CrossRef]
  11. Li, X.L.; Lu, Y.G.; Li, J.Q.; Xu, H.M.; Shahid, M.Q. Strategies on sample size determination and qualitative and quantitative traits integration to construct core collection of rice (Oryza sativa). Rice Sci. 2011, 18, 46–55. [Google Scholar] [CrossRef]
  12. Studnicki, M.; Mądry, W.; Schmidt, J. Comparing the efficiency of sampling strategies to establish a representative in the phenotypic-based genetic diversity core collection of orchardgrass (Dactylis glomerata L.). Genet. Plant Breed. 2013, 49, 36–47. [Google Scholar]
  13. Balakrishnan, R.; Nair, N.V.; Sreenivasan, T.V. A method for establishing a core collection of Saccharum officinarum L. germplasm based on quantitative-morphological data. Genet. Res. Crop Evol. 2000, 47, 1–9. [Google Scholar] [CrossRef]
  14. Tai, P.Y.P.; Miller, J.D. A core collection for Saccharum spontaneum L. from the world collection of sugarcane. Crop Sci. 2001, 41, 879–885. [Google Scholar] [CrossRef]
  15. Amalraj, V.A.; Balakrishnan, R.; Jebadhas, A.W.; Balasundaram, N. Constituting a core collection of Saccharum spontaneum L. and comparison of three stratified random sampling procedures. Genet. Res. Crop Evol. 2006, 53, 1563–1572. [Google Scholar] [CrossRef]
  16. Dillewiijn, C. Botany of Sugarcane; Chronica Botanica: Waltham, MA, USA, 1952. [Google Scholar]
  17. Legendre, B.L. The core/press method for predicting the sugar yield from cane for use in cane payment. Sugar J. 1992, 54, 2–7. [Google Scholar]
  18. SAS Institute Inc. SAS OnlineDoc 9.3; SAS Institute Inc.: Cary, NC, USA, 2011. [Google Scholar]
  19. Hair, J.F.; Tatham, R.L.; Anderson, R.E. Multivariate Data Analysis, 5th ed.; Prentice Hall: Maryland, NY, USA, 1998. [Google Scholar]
  20. Rasmussen, M.; Karypis, G. gCLUTO—An Interactive Clustering, Visualization, and Analysis System; CSE/UMN Technical Report TR04-021; University of Minnesota: Twin Cities, MI, USA, 2004. [Google Scholar]
  21. Kim, K.; Chung, H.; Cho, G.; Ma, K.; Chandrabalan, D.; Gwag, J.; Kim, T.; Cho, E.; Park, Y. Power Core: A program applying the advanced M strategy with a heuristic search for establishing core sets. Bioinformatics 2007, 23, 2155–2162. [Google Scholar] [CrossRef] [PubMed]
  22. Schoen, D.J.; Brown, A.H. Conservation of allelic richness in wild crop relatives is aided by assessment of genetic markers. Proc. Natl. Acad. Sci. USA 1993, 90, 10623–10627. [Google Scholar] [CrossRef] [PubMed]
  23. Shannon, C.E.; Weaver, W. A mathematical theory of communication. Bell Syst. Tech. J. 1948, 27, 1–54. [Google Scholar] [CrossRef]
  24. Raza, S.; Qamarunnisa, S.; Jamil, I.; Naqvi, B.; Azhar, A.; Qureshi, J.A. Screening of sugarcane somaclones of variety BL4 for agronomic characteristics. Pak. J. Bot. 2014, 46, 1531–1535. [Google Scholar]
  25. Khan, I.A.; Raza, G.; Ismail, M.; Raza, S.; Ahmed, I.; Et, K. Assessment of contender sugarcane clones for morphological traits and biotic tolerance under agro-climatic conditions of Tando Jam. Pak. J. Bot. 2015, 47, 43–48. [Google Scholar]
  26. Zhang, P.; Li, J.; Li, X.; Liu, X.; Zhao, X.; Lu, Y. Population structure and genetic diversity in a rice core collection (Oryza sativa L.) investigated with SSR markers. PLoS ONE 2011, 6, e27565. [Google Scholar] [CrossRef] [PubMed]
  27. Agrama, H.A.; Yan, W.; Lee, F.; Fjellstrom, R.; Chen, M.; Jia, M.; Mcclung, A. Genetic assessment of a mini-core subset developed from the USDA rice genebank. Crop Sci. 2009, 49, 1336–1346. [Google Scholar] [CrossRef]
  28. Zhang, Y.; Zhang, X.; Che, Z.; Wang, L.; Wei, W.; Li, D. Genetic diversity assessment of sesame core collection in China by phenotype and molecular markers and extraction of a mini-core collection. BMC Genet. 2012, 13, 102. [Google Scholar] [CrossRef] [PubMed]
  29. Archak, S.; Tyagi, R.K.; Harer, P.N.; Mahase, L.B.; Singh, N.; Dahiya, O.P.; Nizar, M.A.; Singh, M.; Tilekar, V.; Kumar, V.; et al. Characterization of chickpea germplasm conserved in the Indian National Genebank and development of a core set using qualitative and quantitative trait data. Crop J. 2016, 4, 417–424. [Google Scholar] [CrossRef]
  30. Hu, J.; Zhu, J.; Xu, H. Methods of constructing core collections by stepwise clustering with three sampling strategies based on the genotypic values of crops. Theor. Appl. Genet. 2000, 101, 264–268. [Google Scholar] [CrossRef]
  31. Reddy, L.J.; Upadhyaya, H.D.; Gowda, C.L.L.; Singh, S. Development of core collection in pigeonpea [Cajanus cajan (L.) Millspaugh] using geographic and qualitative morphological descriptors. Genet. Res. Crop Evol. 2005, 52, 1049–1056. [Google Scholar] [CrossRef]
  32. Mei, Y.; Zhou, J.; Xu, H.; Zhu, S. Development of Sea Island cotton (Gossypium barbadense L.) core collection using genotypic values. Aust. J. Crop Sci. 2012, 6, 673–680. [Google Scholar]
Figure 1. (a) Mean stalk height (cm); (b) Mean internode length (cm); (c) Mean diameter (mm); (d) Mean juice weight (kg); (e) Mean percentage Brix of juice extracted from stalks; (f) Mean recoverable sucrose; (g) Mean cane yield (ton/ha); and (h) Mean sugar yield (ton/ha) of primary collection of sugarcane accessions measured in two seasons (in four time points). In all Figures (ah), means followed with the same letters are not significantly different at p ≤ 0.05.
Agriculture 07 00055 g001aAgriculture 07 00055 g001b
Figure 2. Two-dimensional scatter plot of principal component analysis for the first two principal components created from phenotypic traits from the sugarcane collection (Saccharum spp.) in Khuzestan province, Iran.
Agriculture 07 00055 g002
Figure 3. The mountain (left) and matrix (right) visualization of relationships among 10 clusters constructed in collection of sugarcane (Saccharum spp.) in Khuzestan. The clustering analysis and visualization were performed using gCLUTO.
Agriculture 07 00055 g003
Table 1. Descriptors used for characterizing the sugarcane accessions of entire collection (253 accessions) in order to build a mini-core collection.
TraitsDescription
Stalk Height (cm)Stalk height from ground level to the insertion of the top visible dewlap leaf (TVD)
Stalk Internode NumberNumber of internode
Stalk Internode Length (cm)Length of internode
Stalk Diameter (mm)Diameter of stalk
Stalk Weight (kg)Ten-stalk weight in kilogram
Juice Weight (kg)Weight of juice extracted after crushing the stems
Juice %Percentage of juice extracted after crushing the stems
Brix %Brix is the total soluble solids in the aqueous solution from the stalk as a percentage by weight (% w/w)
POL%The apparent sucrose content expressed as a mass percent measured by the optical rotation of polarized light passing through a sugar solution
PTY%Purity is the sucrose content as a percent of the dry substance or dissolved solids content.
RS%Recoverable sucrose: The percentage of white sugar
Cane Yield (tone/ha)Yield of cane stalk dependent on two factors: number of stalk and stalk weight.
Sugar Yield (tone/ha)Yield of sugar dependent on two factors: cane yield and RS.
Table 2. Correlation coefficients among months for the different traits measured in two seasons of the collection of sugarcane.
TraitsNovember 2014:January 2015November 2014:February 2015January 2015:February 2015January 2014:November 2014January 2014:January 2015January 2014:February 2015
Stalk height0.69 **0.69 **0.98 **0.42 **0.46 **0.46 **
Internode length0.70 **0.70 **0.99 **0.28 **0.32 **0.32 **
Stalk diameter0.67 **0.68 **0.98 **0.33 **0.38 **0.38 **
Juice weight0.35 **0.38 **0.60 **0.28 **0.40 **0.23 **
Brix0.23 **0.24 **0.53 **0.21 **0.27 **0.23 **
RS0.27 **0.27 **0.56 **0.15 *0.28 **0.25 **
Cane yield0.59 **0.60 **0.99 **0.59 **0.97 **0.98 **
Sugar yield0.50 **0.49 **0.89 **0.83 **0.83 **0.43 **
* and **, significant at p < 0.05 and 0.01, respectively. RS% = Recoverable sugar percent.
Table 3. Correlation coefficients among thirteen traits measured in 253 sugarcane accessions for mean measurement of two seasons.
TraitsSHInNInLSDCWJWJ%Br%Po%PT%RS%CYSY
SH1
InN0.46 **1
InL0.71 **0.011
SD−0.16 **0.13 *−0.26 **1
SW0.52 **0.40 **0.25 **0.50 **1
JW0.45 **0.33 **0.24 **0.48 **0.90 **1
J%0.070.040.090.28 **0.35 **0.62 **1
Br%−0.10−0.02−0.14 *0.13 *0.040.01−0.111
Po%−0.11−0.05−0.13 *0.12 *0.040.01−0.110.95 **1
PT%−0.07−0.07−0.060.050.040.03−0.040.64 **0.80 **1
RS%−0.12−0.06−0.13 *0.110.01−0.01−0.090.90 **0.96 **0.87 **1
CY0.33 **0.090.31 **−0.31 **−0.001−0.04−0.07−0.004−0.01−0.03−0.031
SY0.27 **0.060.25 **−0.25 **−0.002−0.05−0.100.32 **0.33 **0.29 **0.33 **0.92 **1
* and **, significant at the 5% and 1% levels probability, respectively. SH = Stalk height, InN = internode number, InL = internode length, SD = stalk diameter, SW = 10-stalk weight, JW = juice weight, J% = juice percent, Br% = Brix percent, Po% = POL percent (sucrose content in the cane), PT% = PTY (the purity of juice), RS% = recoverable sugar percent, CY = cane yield, SY = sugar yield.
Table 4. Stepwise regression model for RS% as dependent variable and the remaining characters as independent variables.
VariableParameter EstimateStandardized EstimatePartial R-Squaret Valuepr > |t|
Intercept−16.3253400−39.00<0.0001
Br%0.486890.587100.821841.94<0.0001
PT%0.192210.504550.147836.78<0.0001
JW−0.19206−0.100410.0015−4.94<0.0001
J%0.011040.046200.00083.120.0020
SD0.015680.042650.00072.990.0030
SH0.001070.024610.00031.680.0952
Br% = Brix percent, PT% = PTY (the purity of juice), JW = juice weight, J% = juice percent, SD = stalk diameter, SH = stalk height.
Table 5. Clustering analysis of 253 sugarcane accessions with morphological traits based on repeated bisection (RB) method.
Cluster NumberNumber of Accessions inside the ClusterIsimIsdevEsimEsdev
130.9980.0000.9700.003
2150.9970.0010.9830.003
390.9980.0010.9880.004
4230.9980.0010.9880.004
5280.9980.0010.9890.003
6320.9970.0010.9900.003
7290.9990.0010.9820.002
8440.9980.0010.9930.002
9320.9990.0010.9930.001
10380.9980.0010.9930.001
Isim = internal similarity, Isdev = internal standard deviation, Esim = external similarity, Esdev = external standard deviation.
Table 6. Description of 21 sugarcane accessions created by M-strategy and heuristic algorithm.
Clone NameOriginParentsMaturity GroupHeightInterLDiameterJuice %Brix %RS %Cane YieldSugar Yield
BL-4BarbadosPOJ2878 × PolycrossMedium-Late112.907.0528.8529.3518.999.7337.003.60
C85-102CubaUnknownEarly-Medium97.106.2720.5525.7318.289.3934.503.24
C86-12CubaUnknownEarly-Medium135.958.5427.0035.0319.4610.3714.501.50
C87-51CubaUnknownEarly-Medium106.258.2021.8029.7820.7211.1846.005.14
CL54-336USAUnknownLate126.308.1519.9534.7613.967.5127.002.03
CL61-620USACP52-68 × PolycrossEarly137.256.8124.4023.4921.7812.2232.503.97
CL73-239USAUnknownEarly-Medium116.158.2225.3025.4920.6311.3951.505.87
CO-407IndiaUnknownLate150.739.1619.5321.5317.808.6335.333.05
CP45-3USAUnknownMedium-Late169.2511.3021.1533.5018.509.6266.506.40
CP65-315USAUnknownMedium-Late143.1516.0020.6629.4918.079.3247.504.42
CP68-1067USAUnknownMedium-Late132.656.9430.9536.5319.3810.0142.504.26
CP73-21USACP56-63 × CP66-1043Early-Medium143.758.6918.9515.0719.6510.7653.505.75
EH16-9UnknownLCP81-325 × LCP81-30Early-Medium190.0011.9225.3726.6119.7110.3233.003.41
F134ChinaUnknownLate183.1011.5022.7029.1714.886.4627.501.78
L61-49USAUnknownMedium-Late171.4211.3819.8729.6616.658.3353.004.41
MY55-14CubaCP34-79 × B45181Medium-Late163.729.5725.9332.5518.379.1626.172.40
N30South Africa77F0637 × 78F1025Medium-Late214.4712.6817.8223.6816.557.7262.004.79
NCo-376South AfricaCo421 × Co312Early-Medium163.9811.0023.4731.6317.769.3845.174.24
Q68AustraliaPOJ2878 × Co290Early-Medium175.829.9628.9339.0218.299.8829.502.91
TRITONUnknownCo270 × ErosLate139.9310.1022.9728.8218.917.6736.502.80
TUC68-18ArgentinaCP50-28 × CB38-79Medium-Late181.779.7924.8835.9516.188.0139.003.12
InterL = internode length, RS % = recoverable sugar percent.
Table 7. Comparison of descriptive statistics of the accessions growing in the primary germplasm of the sugarcane collection (means of two season), and the accessions from this collection selected for the mini-core collection (breeding collection), table (b) is continue of table (a).
(a)
HeightInter NInter LDiameter10 Cane WJuice WJuice %
CCMCCCCMCCCCMCCCCMCCCCMCCCCMCCCCMCC
Mean146.87150.2615.3915.609.449.6722.9923.385.255.521.631.7429.7829.37
Median146.97143.7515.5015.509.499.5722.9522.975.144.981.581.4729.7829.49
Range129.17117.3713.7213.1210.929.7315.4613.136.145.853.463.3325.5123.95
Max214.47214.4722.7722.77161632.3530.958.578.573.993.9939.6839.02
Min85.3097.109.059.655.086.2716.8917.822.432.720.530.6614.1715.07
Variance496.07919.24 *3.478.682.415.41 **6.8913.07 *1.433.090.250.84 *16.3232.52
Shannon-Weaver0.180.20 **0.150.19 **0.160.19 **0.170.20 **0.190.20 **0.160.19 **0.170.20 **
(b)
Brix %Pol %PTY %RS %Cane YieldSugar Yield
CCMCCCCMCCCCMCCCCMCCCCMCCCCMCC
Mean18.4218.3115.8515.6485.7584.329.969.3840.0240.003.863.76
Median18.4918.3715.9515.8385.9985.359.729.3937.8337.003.763.60
Range7.827.828.548.5415.8315.205.765.7658.0052.005.454.90
Max21.7821.7820.0620.0691.1090.4712.2212.2272.5065.506.956.40
Min13.9613.9611.5211.5275.2775.276.466.4614.5014.501.501.50
Variance1.353.601.804.37 **6.4114.540.932.06 **102.94162.571.051.82
Shannon-Weaver0.160.20 **0.160.19 **0.160.19 **0.170.20 **0.180.19 **0.190.20 **
Inter N = internode number, Inter L = internode length, 10 SW = 10-stalk weight, JW = juice weight, Pol = sucrose content in the cane, PTY = the purity of juice, RS% = recoverable sugar percent. * and **, significant at p < 0.05 and 0.01, respectively. CC: core collection: Primary collection. MCC: mini core collection.

