
Grasslands and Croplands Have Different Microbial Biomass Carbon Levels per Unit of Soil Organic Carbon

Department of Biology, Brandon University, 270-18th Street, Brandon, MB R7A 6A9, Canada
*
Author to whom correspondence should be addressed.
Agriculture 2017, 7(7), 57; https://doi.org/10.3390/agriculture7070057
Submission received: 1 April 2017
/
Revised: 14 June 2017
/
Accepted: 5 July 2017
/
Published: 10 July 2017
(This article belongs to the Special Issue Dynamics of Root–Soil–Microbial Interactions)
Abstract
:Primarily using cropped systems, previous studies have reported a positive linear relationship between microbial biomass carbon (MBC) and soil organic carbon (SOC). We conducted a meta-analysis to explore this relationship separately for grasslands and croplands using available literature. Studies were limited to those using fumigation–extraction for MBC for field samples. Trials were noted separately where records were distinct in space or time. Grasslands were naturally occurring, restored, or seeded. Cropping systems were typical of the temperate zone. MBC had a positive linear response to increasing SOC that was significant in both grasslands (p < 0.001; r2 = 0.76) and croplands (p < 0.001; r2 = 0.48). However, MBC increased 2.5-fold more steeply per unit of increasing SOC for grassland soils, as compared to the corresponding response in cropland soils. Expressing MBC as a proportion of SOC across the regression overall, slopes corresponded to 2.7% for grasslands and 1.1% for croplands. The slope of the linear relationship for grasslands was significantly (p = 0.0013) steeper than for croplands. The difference between the two systems is possibly caused by a greater proportion of SOC in grasslands being active rather than passive, relative to that in croplands, with that active fraction promoting the formation of MBC.
1. Introduction
Microbial biomass carbon (MBC) comprises all microorganisms in soil and is typically measured as the carbon released in response to microbe death following chloroform fumigation [1]. MBC changes with greater agility than soil organic carbon (SOC) in response to residue management [2]. SOC includes both a passive fraction that is chemically or physically protected from breakdown over several decades or centuries, as well as an active fraction that is mineralized seasonally or within a few years [3]. MBC was correlated closely with the active fraction, which was determined as up to 5% of SOC recovered as CO2 over 45 days of incubation under laboratory conditions [4]. MBC acts as a pool of organic carbon that contributes cyclically to immobilization and release of minerals during formation and breakdown [5].
Soil health and soil quality are often considered as synonyms [6]. However, soil health places more emphasis on biological activity in soil, such as the contribution of soil organisms to nutrient cycling [7]. Either term is typically defined in terms of vegetation productivity, possibly along with productivity of grazers, the capacity of soil to decompose residues, or the provision by soil of other ecological services [8]. A soil property employed effectively as an indicator of soil health should allow for prediction in advance of that production or service. SOC is considered a valuable indicator of soil health in agricultural soils [9]. MBC has been suggested as another possible indicator [10]. SOC and MBC have sometimes been combined with other measurements to form an index of soil quality [11,12,13]. If MBC is to be used to evaluate soil health or soil quality, then the relationship between MBC and SOC needs to be understood clearly.
A positive linear relationship was reported for MBC plotted against SOC for a combination of mostly crop trials along with a small number of grassland trials [14]. A similar correlation was also found for each of two sets of exclusively crop trials [15]. MBC as a percentage of SOC calculated on a case-by-case basis for many studies was reported as lower for cropland at 1.6–1.7%, compared to 1.9–2.2% in the combined category of grassland and savanna [11]. However, pasture was lower still at 1.3–1.6% [16]. In contrast, MBC as a percentage of total soil C was relatively high and in the range 1.6–2.9% for poorly drained pasture in the south-west of the UK [17,18]. MBC as a proportion of SOC also varies for agricultural systems. MBC was found to be 1.2% of SOC in paddy rice in China [19]. Crops under moldboard, disk, rotary, and chisel tillage regimens in Iran had 1.0–2.4% of SOC in MBC [20], whereas the percentage of SOC in MBC was similar under barley after six years of either conventional-tillage and zero-till treatments in Alberta [21]. Greater MBC is expected in grasslands, because croplands are reported to have reduced soil quality and less microbial activity associated with soil disturbance and incomplete vegetation cover in time and space [22]. Thus, given the positive relationship between MBC and SOC from the literature, analysis of published studies was undertaken to test the hypothesis that grasslands have more MBC than croplands relative to the amount of SOC present.
2. Materials and Methods
A literature search was conducted in late 2016 via internet search engine and keywords for studies reporting both SOC and MBC for field-collected soils from grasslands, croplands, or both. Only studies using the fumigation extraction (FE) method [23] for MBC were included in the meta-analysis. Excluded methods to determine MBC were: the fumigation incubation (FI) method [24,25], the substrate-induced respiration (SIR) method [26], microwave extraction [27], ultraviolet absorption [28], and direct chloroform extraction [29]. FI was omitted, because the carbon flush released by FE was only 73% of that released by FI [23]. SIR gives different MBC values compared to FE, although correlation is claimed for MBC values from these two methods [30]. A period of incubation is needed to undertake SIR and FI, and so the most commonly used method to determine MBC has been FE [31]. Even though promise was offered by the microwave method and the direct extraction method for MBC, few studies have taken these approaches [32,33]. Data for organic matter were converted to SOC using the following relationship: organic matter = 1.724*SOC [34]. Many papers with data for MBC were necessarily omitted, because neither SOC nor organic matter was reported. MBC decreases with soil depth [35]. Thus, where studies used multiple depths, only the surface layer was included. Sample depths among studies were 0–5 cm, 0–10 cm, or 0–15 cm.
Designations used by authors in the source papers to distinguish trials were as follows: time since grassland restoration, grazing system, stocking density, slope position, forage species sown, and sample date. For cropland locations, corresponding categories were current crop, tillage regimen, crop rotation, and farm. Within North America, locations were dispersed across the regions of the Great Lakes, the Mid-West, and the Great Plains. Worldwide, additional locations were dispersed across southern Brazil, Germany, the Netherlands, and the south-western part of the UK.
Grassland and cropland systems were investigated separately using linear regression of MBC as the dependent variable and SOC as the independent variable. The significance of regression lines was evaluated using analysis of variance [36]. Slopes were calculated initially as µg g−1/g kg−1, in order to retain the units most frequently used historically for MBC and SOC. However, slopes of SOC versus MBC were also expressed with MBC as a proportion of SOC in percentage form, because of the frequent use in the literature of this proportion. Slopes for grassland and cropland were compared by t-test [36].
3. Results
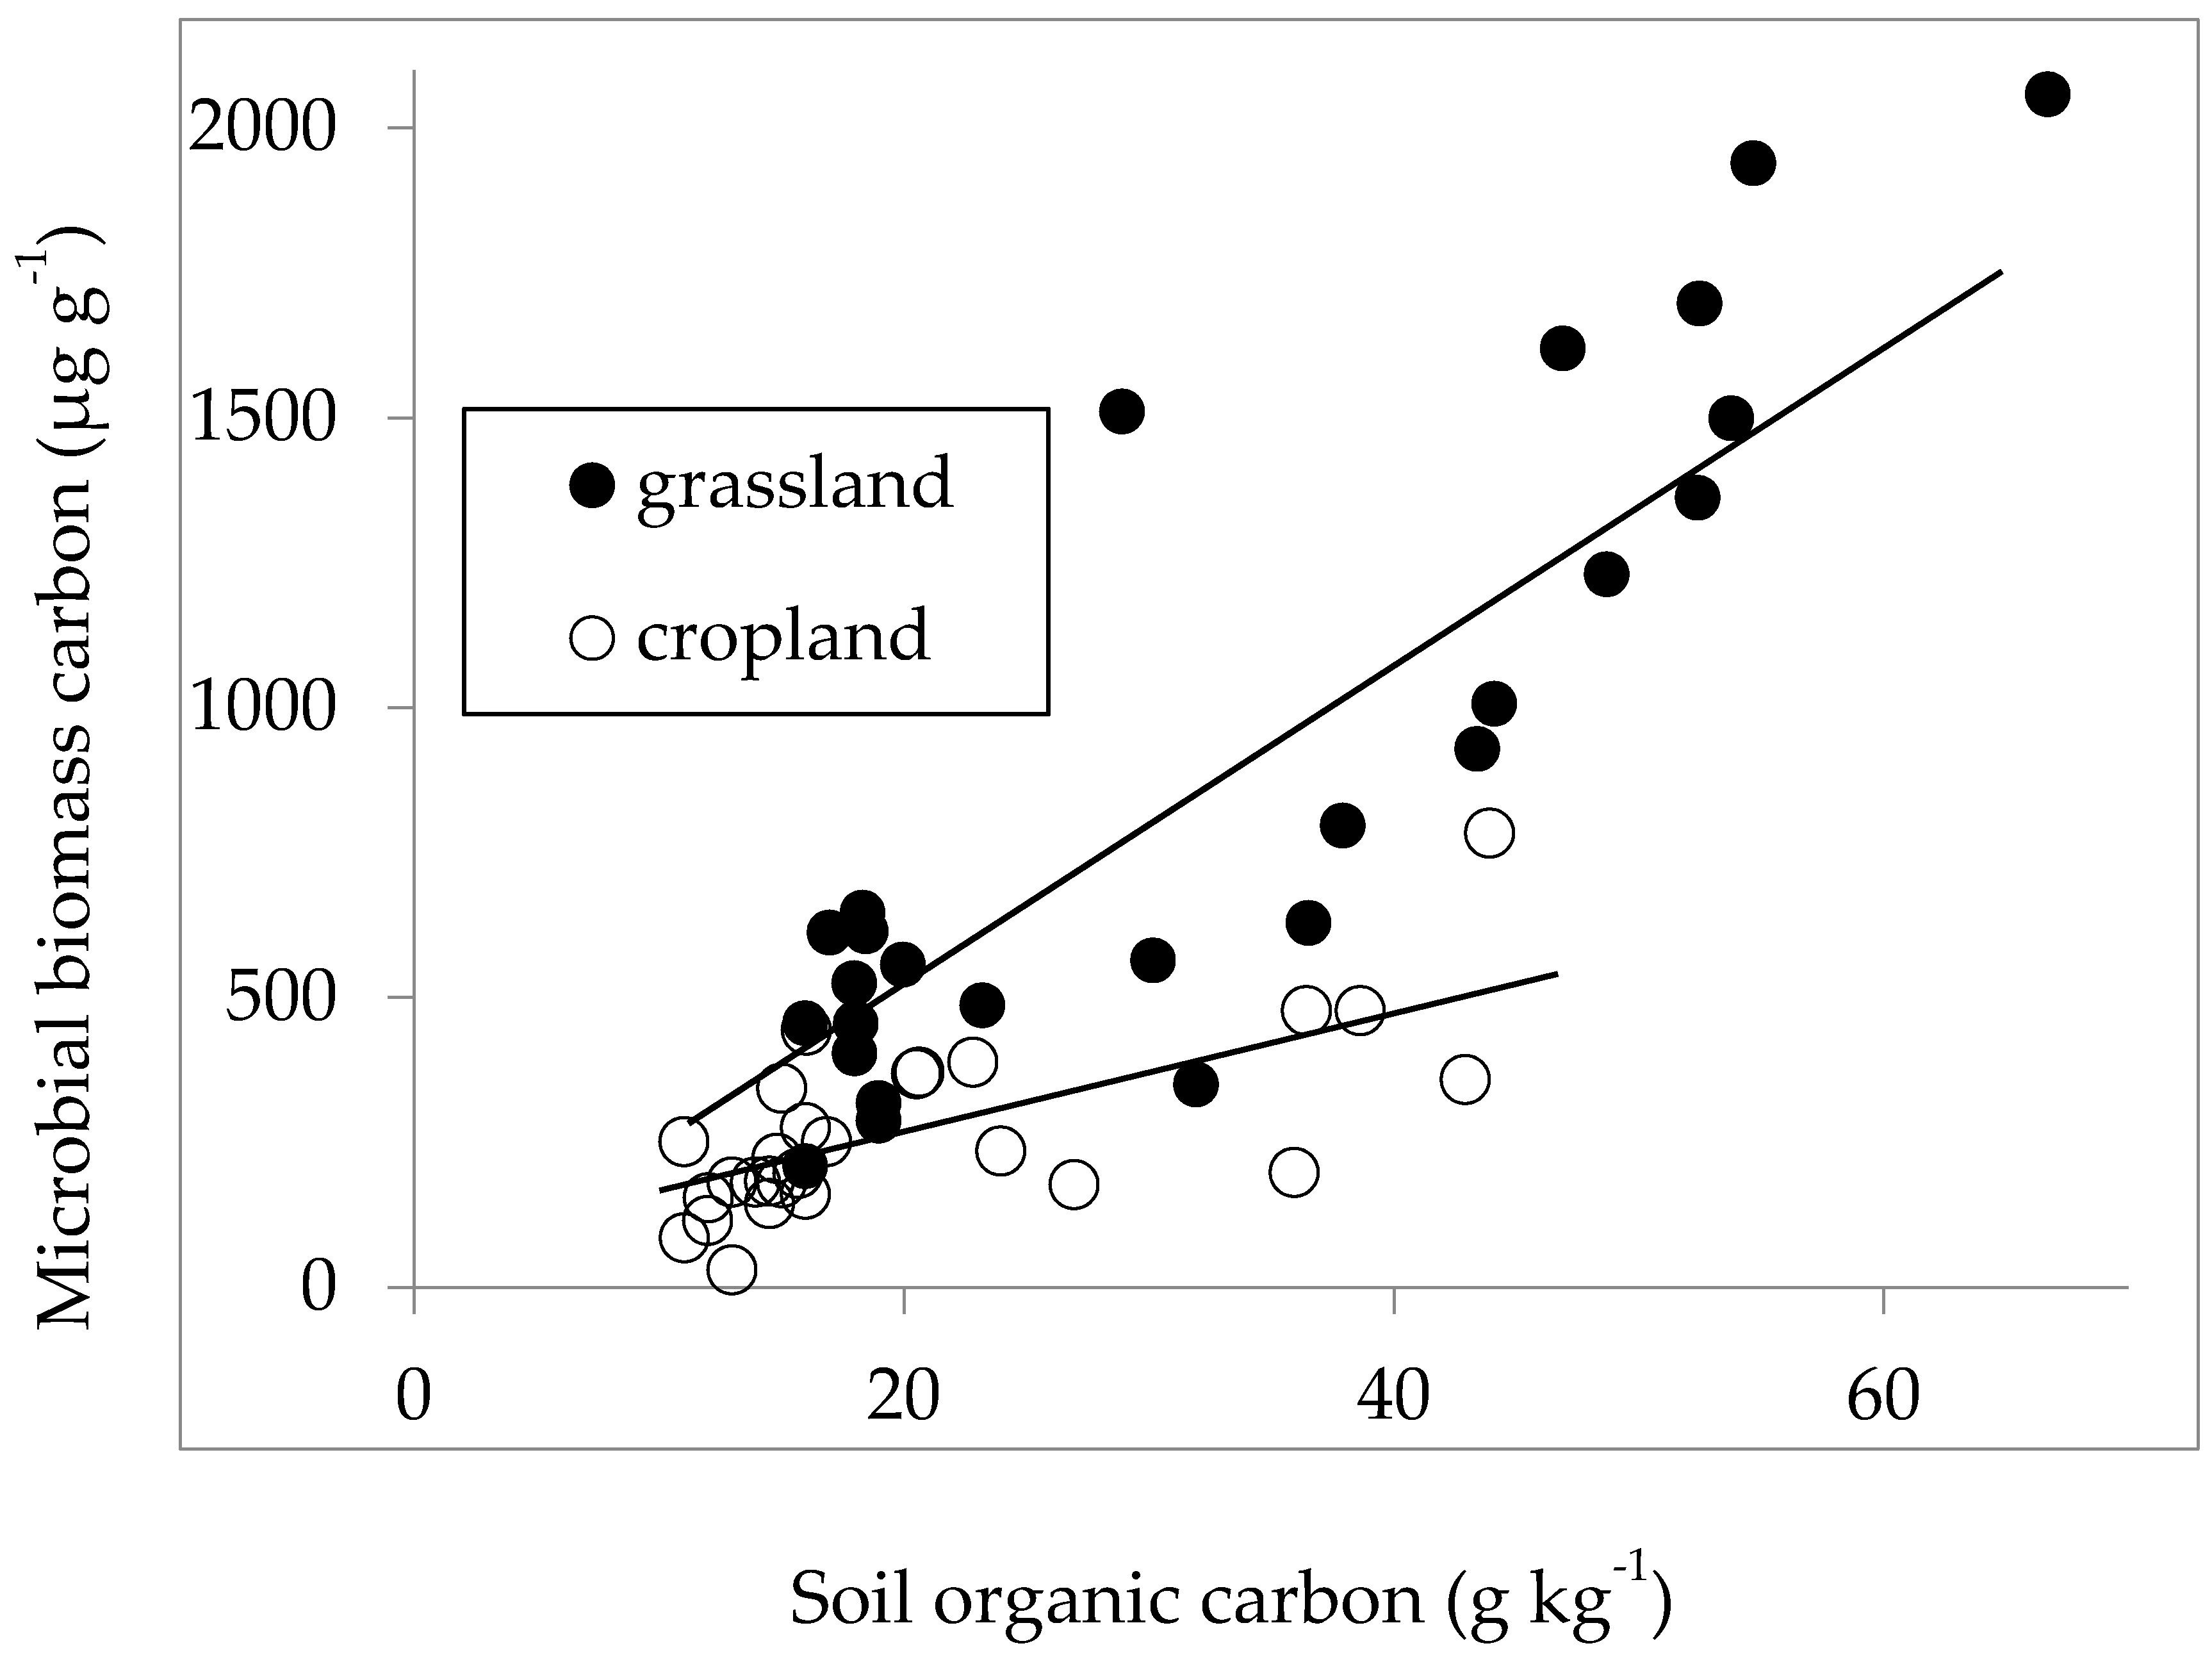
The relationship between MBC and SOC was sufficiently robust to give linear regressions for both grassland and cropland (Figure 1). Linear regressions were found even though source trials were drawn from a wide-ranging variety of field situations and from across a considerable range of the temperate world (Table 1). Grasslands varied considerably in character, including both virgin and restored prairie, grazed pasture, and various other grass systems that were either native or sown (Table 1). Cropping systems were also varied, including soybean, cereals, corn, and cotton (Table 1). Many studies identified in our literature search were excluded from our meta-analysis, because they did not meet our criteria of using the FE method to determine MBC, or because they did not report SOC or organic matter. We retained our criteria rather than expanding our analysis to encompass other methods to determine MBC, because the choice of method modifies the value obtained for MBC and could be expected to obscure relationships to SOC. MBC increased significantly in response to increasing SOC in both grassland (Table 2) and cropland (Table 3). MBC in cropland increased from 210 µg g−1 at 15 g kg−1 SOC to only 530 µg g−1 at 45 g kg−1 SOC (Figure 1). In contrast, MBC in grassland increased from 440 µg g−1 at 15 g kg−1 SOC to 1190 µg g−1 at 45 g kg−1, thereafter increasing further to 1800 µg g−1 at 65 g kg−1 SOC (Figure 1). The slope of increase of MBC in response to increasing SOC was 2.5-fold higher in grassland at 27.2 (µg g−1)/(g kg−1) compared to 10.7 (µg g−1)/(g kg−1) for cropland (Figure 1). The slope for grassland was significantly (t = 3.399; df = 51; p = 0.0013) greater than for cropland. The slopes as presented for plots of SOC versus MBC correspond to MBC as a proportion of SOC as 2.7% for grassland and 1.1% for cropland.
Slopes (Figure 1) were recalculated with a restricted x-axis ranging from SOC of 15–49 g kg−1 in order to evaluate relationships without inclusion of values at distance from the common x-axis range, yet at the same time retaining samples both equitable and sizeable of n = 21 for grassland and n = 20 for cropland. Although not presented graphically, such recalculation gave significant regressions of y = 24.2x + 20.1 for grassland (p < 0.001) and y = 9.3x + 92.8 for cropland (p = 0.004). The recalculated slopes remained different statistically (t = 2.347; df = 37; p = 0.024).
4. Discussion
The slope of the relationship between MBC as a function of SOC found here as 10.7 (µg g−1)/(g kg−1) for cropland compares well to corresponding values previously reported. Moore et al. [15] found slopes of 7.9 (µg g−1)/(g kg−1) for 1996 data and 10.1 (µg g−1)/(g kg−1) for 1997 data in cropland, whereas Carter [14] reported a slope of 13.6 (µg g−1)/(g kg−1) for a graph of 35 crop trials combined with five grassland trials in the same graph. We are not aware of any previously published report of this linear relationship exclusively for grassland systems, shown here to have a slope of 27.2 (µg g−1)/(g kg−1). Expression of these slopes with MBC as a proportion of SOC, found here to be 2.7% for grassland and 1.1% for cropland, are consistent with the report of a greater value of this proportion in grassland and savanna, relative to cropland, as calculated on a trial-by-trial basis [16]. However, the values for MBC as a proportion of SOC from our slopes were more widely separated between systems than in the case of Xu et al. [16], who reported averages of 1.5% in pasture, 1.7% in cropland, and 2.1% in grassland and savanna. Selective use within our meta-analysis of a single method for MBC determination likely reduced variability and gave clearer separation between grassland and cropland systems.
The mechanism for a steeper increase in MBC per unit of SOC in grasslands as compared to croplands likely relates to a difference in the quality of the SOC between the two systems. Chemical estimation of the active fraction of SOC has used permanganate oxidation [45], and this method has been applied to soil quality evaluation [46]. However, recent work illustrates that the fraction of SOC determined by permanganate appears to contribute primarily to SOC sequestration, whereas a closer correspondence to nutrient availability in the short term is shown by the SOC fraction disposed to mineralization during incubation studies [47]. Similarly, the fraction of SOC oxidized with dichromate was associated with larger aggregates of grassland and forest, rather than the small aggregates of croplands [48]. Use of density fractions and size fractions to characterize SOC from recent residue inputs shows that the nitrogen concentration and nitrogen availability of the SOC are affected by not only the fractionation method, but also by the quality and placement of the residue and by the environmental conditions that speed or slow the breakdown [49]. Compared to continuous grass cover with 64% of SOC in the active fraction, corresponding values ranged from 11–45% among various crops [50]. Only 3–8% of SOC was found in the active fraction of the soils of the corn belt of the USA, this fraction being derived from corn residues and having a residence time of 100 days [51]. Loss of SOC under cultivation is attributed to soil aeration, breakdown of larger aggregates, and reduced residue inputs [52,53,54]. Loss of MBC in cropland relates to reduced rhizodeposition, which is higher in grasslands due to greater root biomass [55]. The quality of the microbial community also changes in response to land use. Fungi increased relative to bacteria following prairie restoration, relative to a maize control [56]. Similarly, greater fungal representation was seen for microbes under reduced tillage [57]. Rotation provides aboveground diversity that stimulates microbial functional activity in soil [58].
Based on the meta-analysis reported herein, reduced MBC in cropland can be seen to correspond not only to less SOC in croplands, but also to proportionately less MBC per unit of SOC in croplands. The difference in the quantity of MBC per unit SOC reported here when comparing croplands and grasslands stands in contrast to previous commentary, in which reduced MBC in croplands was attributed solely to reduced SOC [59]. Based on the present meta-analysis, we note that both the quantity and quality of the SOC in croplands appear to modify the MBC therein. The SOC that remains in long-cultivated cropland soil is predominantly passive, with turnover on a timescale of centuries to millennia [60]. The sensitivity of MBC to this loss of the active fraction of SOC demonstrates that MBC is a measure more closely aligned to soil health than is SOC alone.
5. Conclusions
Our meta-analysis of data from the literature shows a positive relationship between MBC and SOC. However, this relationship was different for contrasting ecosystem types: MBC increases 2.5-times faster per unit of SOC in grassland, as compared to cropland. This outcome shows that MBC offers promise as an indicator of soil health, because elevated MBC is associated with the features that accompany grassland versus cropland systems: more SOC, a greater proportion of SOC in the active fraction, and greater microbial activity to promote nutrient availability and vegetation productivity. This study supports our hypothesis that, relative to croplands, grasslands have more MBC per unit of SOC. These results encourage the use of MBC for assessment of soil health broadly across locations and land use systems.
Acknowledgments
W.G.T. would like to thank Manitoba Beef and Forage Initiatives Inc. for support for his contribution to this study.
Author Contributions
T.P.M. conceived and designed the meta-analysis; W.G.T. performed the literature search; T.P.M. and W.G.T. analyzed the data and wrote the paper.
Conflicts of Interest
The authors declare no conflict of interest.
References
- Powlson, D.S. The soil microbial biomass: Before, beyond and back. In Beyond the Biomass; Ritz, K., Dighton, J., Giller, K.L., Eds.; Wiley-Sayce: London, UK, 1994; pp. 3–20. [Google Scholar]
- Powlson, D.S.; Brookes, P.C.; Christensen, B.T. Measurement of soil microbial biomass provides an early indication of changes due to straw incorporation. Soil Biol. Biochem. 1987, 19, 159–164. [Google Scholar] [CrossRef]
- Wander, M. Soil organic matter fractions and their relevance to soil function. In Soil Organic Matter in Sustainable Agriculture; Magdoff, F., Weil, R.R., Eds.; CRC Press: Boca Raton, FL, USA, 2004; pp. 67–102. [Google Scholar]
- Rovira, P.; Jorba, M.; Romanya, J. Active and passive organic matter fractions in Mediterranean forest soils. Biol. Fertil. Soils 2010, 46, 355–369. [Google Scholar] [CrossRef]
- Hassink, J. Density fractions of soil macroorganic matter and microbial biomass as predictors of C and N mineralization. Soil Biol. Biochem. 1995, 27, 1099–1108. [Google Scholar] [CrossRef]
- Doran, J.W.; Zeiss, M.R. Soil health and sustainability: Managing the biotic component of soil quality. Appl. Soil Ecol. 2000, 15, 3–11. [Google Scholar] [CrossRef]
- Anderson, T.-H. Microbial eco-physiological indicators to assess soil quality. Agric. Ecosyst. Environ. 2003, 98, 285–293. [Google Scholar] [CrossRef]
- Karlen, D.L.; Mausbach, M.J.; Doran, J.W.; Cline, R.G.; Harris, R.F.; Schuman, G.E. Soil quality: A concept, definition, and framework for evaluation (a guest editorial). Soil Sci. Soc. Am. J. 1997, 61, 4–10. [Google Scholar] [CrossRef]
- Zornoza, R.; Acosta, J.A.; Bastida, F.; Domínguez, S.G.; Toledo, D.M.; Faz, A. Identification of sensitive indicators to assess the interrelationship between soil quality, management practices and human health. Soil 2015, 1, 173. [Google Scholar] [CrossRef]
- Gonzalez-Quinones, V.; Stockdale, E.A.; Banning, N.C.; Hoyle, F.C.; Sawada, Y.; Wherrett, A.D.; Jones, D.L.; Murphy, D.V. Soil microbial biomass—Interpretation and consideration for soil monitoring. Soil Res. 2011, 49, 287–304. [Google Scholar] [CrossRef]
- Andrews, S.S.; Karlen, D.L.; Cambardella, C.A. The soil management assessment framework. Soil Sci. Soc. Am. J. 2004, 68, 1945–1962. [Google Scholar] [CrossRef]
- Bastida, F.; Zsolnay, A.; Hernandez, T.; Garcia, C. Past, present and future of soil quality indices: A biological perspective. Geoderma 2008, 147, 159–171. [Google Scholar] [CrossRef]
- Erkossa, T.; Itanna, F.; Stahr, K. Indexing soil quality: A new paradigm in soil science research. Soil Res. 2007, 45, 129–137. [Google Scholar] [CrossRef]
- Carter, M.R. The influence of tillage on the proportion of organic carbon and nitrogen in the microbial biomass of medium-textured soils in a humid climate. Biol. Fertil. Soils 1991, 11, 135–139. [Google Scholar] [CrossRef]
- Moore, J.M.; Klose, S.; Tabatabai, M.A. Soil microbial biomass carbon and nitrogen as affected by cropping systems. Biol. Fertil. Soils 2000, 31, 200–210. [Google Scholar] [CrossRef]
- Xu, X.; Thornton, P.E.; Post, W.M. A global analysis of soil microbial biomass carbon, nitrogen and phosphorus in terrestrial ecosystems. Glob. Ecol. Biogeogr. 2013, 22, 737–749. [Google Scholar] [CrossRef]
- Lovell, R.D.; Jarvis, S.C.; Bardgett, R.D. Soil microbial biomass and activity in long-term grassland: Effects of management changes. Soil Biol. Biochem. 1995, 27, 969–975. [Google Scholar] [CrossRef]
- Lovell, R.D.; Jarvis, S.C. Effect of cattle dung on soil microbial biomass C and N in a permanent pasture soil. Soil Biol. Biochem. 1996, 28, 291–299. [Google Scholar] [CrossRef]
- Wang, F.E.; Chen, Y.X.; Tian, G.M.; Kumar, S.; He, Y.F.; Fu, Q.L.; Lin, Q. Microbial biomass carbon, nitrogen and phosphorus in the soil profiles of different vegetation covers established for soil rehabilitation in a red soil region of southeastern China. Nutr. Cycl. Agroecosyst. 2004, 68, 181–189. [Google Scholar] [CrossRef]
- Kabiri, V.; Raiesi, F.; Ghazavi, M.A. Tillage effects on soil microbial biomass carbon, SOM mineralization and enzyme activity in a semi-arid calcixerepts. Agric. Ecosyst. Environ. 2016, 232, 73–84. [Google Scholar] [CrossRef]
- Franzluebbers, A.J.; Arshad, M.A. Soil organic matter pools during early adoption of conservation tillage in northwestern Canada. Soil Sci. Soc. Am. J. 1996, 60, 1422–1427. [Google Scholar] [CrossRef]
- Karlen, D.L.; Stott, D.E.; Cambardella, C.A.; Kremer, R.J.; King, K.W.; McCarty, G.W. Surface soil quality in five midwestern cropland conservation effects assessment project watersheds. J. Soil Water Conserv. 2014, 69, 393–401. [Google Scholar] [CrossRef]
- Vance, E.D.; Brookes, P.C.; Jenkinson, D.S. An extraction method for measuring soil microbial biomass C. Soil Biol. Biochem. 1987, 19, 703–707. [Google Scholar] [CrossRef]
- Jenkinson, D.S. Studies on the decomposition of plant material in soil. J. Soil Sci. 1966, 17, 280–302. [Google Scholar] [CrossRef]
- Jenkinson, D.S. Determination of microbial biomass carbon and nitrogen in soil. In Advances in Nutrient Cycling in Agricultural Ecosystems; Wilson, J.R., Ed.; CAB International: Wallingford, UK, 1988; pp. 368–386. [Google Scholar]
- Anderson, J.P.E.; Domsch, K.H. A physiological method for the quantitative measurement of microbial biomass in soils. Soil Biol. Biochem. 1978, 10, 215–221. [Google Scholar] [CrossRef]
- Islam, K.R.; Weil, R.R. Microwave irradiation of soil for routine measurement of microbial biomass carbon. Biol. Fertil. Soils 1998, 27, 408–416. [Google Scholar] [CrossRef]
- Turner, B.L.; Bristow, A.W.; Haygarth, P.M. Rapid estimation of microbial biomass in grassland soils by ultra-violet absorbance. Soil Biol. Biochem. 2001, 33, 913–919. [Google Scholar] [CrossRef]
- Gregorich, E.G.; Wen, G.; Voroney, R.P.; Kachanoski, R.G. Calibration of a rapid direct chloroform extraction method for measuring soil microbial biomass C. Soil Biol. Biochem. 1990, 22, 1009–1011. [Google Scholar] [CrossRef]
- Strecker, T.; Barnard, R.L.; Niclaus, P.A.; Scherer-Lorenzen, M.; Weigelt, A.; Scheu, S.; Eisenhauer, N. Effects of plant diversity, functional group composition, and fertilization on soil microbial properties in experimental grassland. PLoS ONE 2015, 10, e0125678. [Google Scholar] [CrossRef] [PubMed]
- Jenkinson, D.S.; Brookes, P.C.; Powlson, D.S. Measuring soil microbial biomass. Soil Biol. Biochem. 2004, 36, 5–7. [Google Scholar] [CrossRef]
- Johnson, C.K.; Wienhold, B.J.; Doran, J.W.; Drijber, R.A.; Wright, S.F. Linking microbial-scale findings to farm-scale outcomes in a dryland cropping system. Precis. Agric. 2004, 5, 311–328. [Google Scholar] [CrossRef]
- Seita, R.; Verma, S.L.; Marschner, P. Measuring microbial biomass carbon by direct extraction—Comparison with chloroform fumigation-extraction. Eur. J. Soil Biol. 2012, 53, 103–106. [Google Scholar]
- Nelson, D.W.; Sommers, L.E. Total carbon, organic carbon, and organic matter. In Methods of Soil Analysis. Part 3. Chemical Methods; Sparks, D.L., Ed.; Soil Science Society of America: Madison, WI, USA, 1996; pp. 961–1010. [Google Scholar]
- Iyyemperumal, K.; Israel, D.W.; Shi, W. Soil microbial biomass, activity and potential nitrogen mineralization in a pasture: Impact of stock camping activity. Soil Biol. Biochem. 2007, 39, 149–157. [Google Scholar] [CrossRef]
- Zar, J.H. Biostatistical Analysis, 5th ed.; Prentice Hall: Upper Saddle River, NJ, USA, 2010. [Google Scholar]
- Allison, V.J.; Miller, R.M.; Jastrow, J.D.; Matamala, R.; Zak, D.R. Changes in soil microbial community structure in a tallgrass prairie chronosequence. Soil Sci. Soc. Am. J. 2005, 69, 1412–1421. [Google Scholar] [CrossRef]
- Banerjee, M.R.; Burton, D.L.; McCaughey, W.P.; Grant, C.A. Influence of pasture management on soil biological quality. J. Range Manag. 2000, 53, 127–133. [Google Scholar] [CrossRef]
- Lovell, R.D.; Jarvis, S.C. Soil microbial biomass and activity in soil from different grassland management treatments stored under controlled conditions. Soil Biol. Biochem. 1998, 30, 2077–2085. [Google Scholar] [CrossRef]
- Corre, M.D.; Schnabel, R.R.; Stout, W.L. Spatial and seasonal variation of gross nitrogen transformations and microbial biomass in a Northeastern US grassland. Soil Biol. Biochem. 2002, 34, 445–457. [Google Scholar] [CrossRef]
- Jordan, D.; Kremer, R.J.; Bergfield, W.A.; Kim, K.Y.; Cacnio, V.N. Evaluation of microbial methods as potential indicators of soil quality in historical agricultural fields. Biol. Fertil. Soils 1995, 19, 297–302. [Google Scholar] [CrossRef]
- Friedel, J.K.; Scheller, E. Composition of hydrolysable amino acids in soil organic matter and soil microbial biomass. Soil Biol. Biochem. 2002, 34, 315–325. [Google Scholar] [CrossRef]
- Klose, S.; Tabatabai, M.A. Urease activity of microbial biomass in soils. Soil Biol. Biochem. 1999, 31, 205–211. [Google Scholar] [CrossRef]
- Balota, E.L.; Colozzi-Filho, A.; Andrade, D.S.; Dick, R.P. Microbial biomass in soils under different tillage and crop rotation systems. Biol. Fertil. Soils 2003, 38, 15–20. [Google Scholar] [CrossRef]
- Weil, R.R.; Islam, K.R.; Stine, M.A.; Gruver, M.A.; Samson-Liebig, S.E. Estimating active carbon for soil quality assessment: A simplified method for laboratory and field use. Am. J. Alter. Agric. 2003, 18, 3–17. [Google Scholar]
- Veum, K.S.; Goyne, K.W.; Kremer, R.J.; Miles, R.J.; Sudduth, K.A. Biological indicators of soil quality and soil organic matter characteristics in an agricultural management continuum. Biogeochemistry 2014, 117, 81–99. [Google Scholar] [CrossRef]
- Hurisso, T.T.; Culman, S.W.; Horwath, W.R.; Wade, J.; Cass, D.; Beniston, J.W.; Bowles, T.M.; Grandy, A.S.; Franzluebbers, A.J.; Schipanski, M.E.; et al. Comparison of permanganate-oxidizable carbon and mineralizable carbon for assessment of organic matter stabilization and mineralization. Soil Sci. Soc. Am. J. 2016, 80, 1352–1364. [Google Scholar] [CrossRef]
- Liu, M.-Y.; Chang, Q.-R.; Qi, Y.-B.; Liu, J.; Chen, T. Aggregation and soil organic carbon fractions under different land uses on the tableland of the Loess Plateau of China. Catena 2014, 115, 19–28. [Google Scholar] [CrossRef]
- Gregorich, E.G.; Beare, M.H.; McKim, U.F.; Skjemstad, J.O. Chemical and biological characteristics of physically uncomplexed organic matter. Soil Sci. Soc. Am. J. 2006, 70, 975–985. [Google Scholar] [CrossRef]
- Hsieh, Y.-P. Pool size and mean age of stable carbon in cropland. Soil Sci. Soc. Am. J. 1992, 56, 460–464. [Google Scholar] [CrossRef]
- Collins, H.P.; Elliott, E.T.; Paustian, K.; Bundy, L.G.; Dick, W.A.; Huggins, D.R.; Smucker, A.J.M.; Paul, E.A. Soil carbon pools and fluxes in long-term corn belt agroecosystems. Soil Biol. Biochem. 2000, 32, 157–168. [Google Scholar] [CrossRef]
- Burke, I.C.; Yonker, C.M.; Parton, W.J.; Cole, C.V.; Schimel, D.S.; Flach, K. Texture, climate, and cultivation effects on soil organic matter content in US grassland soils. Soil Sci. Soc. Am. J. 1989, 53, 800–805. [Google Scholar] [CrossRef]
- Brady, N.C.; Weil, R.R. The Nature and Properties of Soils, 13th ed.; Prentice Hall: Upper Saddle River, NJ, USA, 2002. [Google Scholar]
- Shi, X.P.; Li, X.G.; Long, R.J.; Singh, B.P.; Li, Z.T.; Li, F.M. Dynamics of soil organic carbon and nitrogen associated with physically separated fractions in a grassland-cultivation sequence in the Qinghai-Tibetan plateau. Biol. Fertil. Soils 2010, 46, 103–111. [Google Scholar] [CrossRef]
- Agbenin, J.O.; Adeniyi, T. The microbial biomass properties of a savanna soil under improved grass and legume pastures in northern Nigeria. Agric. Ecosyst. Environ. 2005, 109, 245–254. [Google Scholar] [CrossRef]
- Bailey, V.L.; Smith, J.L.; Bolton, H. Fungal-to-bacterial ratios in soils investigated for enhanced C sequestration. Soil Biol. Biochem. 2002, 34, 997–1007. [Google Scholar] [CrossRef]
- Mbuthia, L.W.; Acosta-Martínez, V.; Debryun, J.; Schaeffer, S.; Tyler, D.; Odoi, E.; Eash, N. Long term tillage, cover crop, and fertilization effects on microbial community structure, activity: Implications for soil quality. Soil Biol. Biochem. 2015, 89, 24–34. [Google Scholar] [CrossRef]
- Tiemann, L.K.; Grandy, A.S.; Atkinson, E.E.; Marin-Spiotta, E.; McDaniel, M.D. Crop rotational diversity enhances belowground communities and functions in an agroecosystem. Ecol. Lett. 2015, 18, 761–771. [Google Scholar] [CrossRef] [PubMed]
- Wardle, D.A. A comparative assessment of factors which influence microbial biomass carbon and nitrogen levels in soil. Biol. Rev. 1992, 67, 321–358. [Google Scholar] [CrossRef]
- Carter, M.R. Analysis of soil organic matter storage in agroecosystems. In Structure and Organic Matter Storage in Agricultural Soils; Carter, M.R., Stewart, B.A., Eds.; CRC Press: Boca Raton, FL, USA, 1996; pp. 3–11. [Google Scholar]
Figure 1.
Microbial biomass carbon in relation to soil organic carbon for grassland and cropland. Respective linear regressions are: for grassland, y = 27.2x − 31.7 with r2 = 0.76 and n = 28; and for cropland, y = 10.7x + 48.2 with r2 = 0.48 and n = 27.
Figure 1.
Microbial biomass carbon in relation to soil organic carbon for grassland and cropland. Respective linear regressions are: for grassland, y = 27.2x − 31.7 with r2 = 0.76 and n = 28; and for cropland, y = 10.7x + 48.2 with r2 = 0.48 and n = 27.


Table 1.
Source data for the meta-analysis.
| System | Trials | Location | Field Use | Reference |
|---|---|---|---|---|
| Grassland | 9 | IL, USA | Restored prairie | [37] |
| Grassland | 8 | MB, Canada | Grazed pasture | [38] |
| Grassland | 4 | Devon, UK | Grazed pasture | [39] |
| Grassland | 3 | PA, USA | Native grassland | [40] |
| Grassland | 2 | MO, USA | Long-term Timothy | [41] |
| Grassland | 1 | MO, USA | Virgin prairie | [41] |
| Grassland | 1 | Lake Constance, Germany | Grassland | [42] |
| Cropland | 10 | IA, USA | Agricultural fields | [43] |
| Cropland | 6 | Parana, Brazil | Maize, wheat, cotton, soybean | [44] |
| Cropland | 5 | MO, USA | Maize, soybean | [41] |
| Cropland | 3 | Stuttgart, Germany | Winter wheat | [42] |
| Cropland | 2 | IL, USA | Maize, soybean | [37] |
| Cropland | 1 | Lovinghoeve, Netherlands | Arable | [42] |
Table 2.
Linear regression analysis of variance for the plot of microbial biomass carbon as a dependent variable against soil organic carbon for grassland.
Table 2.
Linear regression analysis of variance for the plot of microbial biomass carbon as a dependent variable against soil organic carbon for grassland.
| Source | DF | SS | MS | F | p |
|---|---|---|---|---|---|
| Regression | 1 | 6,998,352 | 6,998,352 | 84.4 | <0.001 |
| Residual | 26 | 2,155,244 | 82,894 | ||
| Total | 27 | 9,153,595 |
Table 3.
Linear regression analysis of variance for the plot of microbial biomass carbon as a dependent variable against soil organic carbon for cropland.
Table 3.
Linear regression analysis of variance for the plot of microbial biomass carbon as a dependent variable against soil organic carbon for cropland.
| Source | DF | SS | MS | F | p |
|---|---|---|---|---|---|
| Regression | 1 | 305,486 | 305,486 | 22.98 | <0.001 |
| Residual | 25 | 332,338 | 13294 | ||
| Total | 26 | 637,824 |
© 2017 by the authors. Licensee MDPI, Basel, Switzerland. This article is an open access article distributed under the terms and conditions of the Creative Commons Attribution (CC BY) license (http://creativecommons.org/licenses/by/4.0/).
Share and Cite
MDPI and ACS Style
McGonigle, T.P.; Turner, W.G. Grasslands and Croplands Have Different Microbial Biomass Carbon Levels per Unit of Soil Organic Carbon. Agriculture 2017, 7, 57. https://doi.org/10.3390/agriculture7070057
AMA Style
McGonigle TP, Turner WG. Grasslands and Croplands Have Different Microbial Biomass Carbon Levels per Unit of Soil Organic Carbon. Agriculture. 2017; 7(7):57. https://doi.org/10.3390/agriculture7070057
Chicago/Turabian StyleMcGonigle, Terence P., and William G. Turner. 2017. "Grasslands and Croplands Have Different Microbial Biomass Carbon Levels per Unit of Soil Organic Carbon" Agriculture 7, no. 7: 57. https://doi.org/10.3390/agriculture7070057
Note that from the first issue of 2016, this journal uses article numbers instead of page numbers. See further details here.