Optimal Cultivation Pattern to Increase Revenue and Reduce Water Use: Application of Linear Programming to Arjan Plain in Fars Province

1
Department of Civil and Environmental Engineering, Cleveland State University, Cleveland, OH 44115, USA
2
Daneshkar Ahwaz Company, Tehran 1987984354, Iran
3
Department of Civil, Construction and Environmental Engineering, Iowa State University, Ames, IA 50011, USA
4
Department of Civil and Environmental Engineering, Cleveland State University, Cleveland, OH 44115, USA
*
Author to whom correspondence should be addressed.
Agriculture 2017, 7(9), 73; https://doi.org/10.3390/agriculture7090073
Submission received: 21 June 2017
/
Revised: 30 August 2017
/
Accepted: 31 August 2017
/
Published: 5 September 2017
Abstract
:Because the available water resources of the Arjan plain region in Iran do not fully meet the watering requirements for plants in farmlands, the crops suffer from water stress, a situation that causes them to wilt. The aim of this study is to develop a water resources planning model that helps decision-makers determine an appropriate cultivation pattern, optimize the exploitation from surface water resources, and specify the method of allocating water across different farm crops to minimize the detrimental effects of water shortage. Through investigating various models of water resources planning and properties along with the governing conditions for each of these models, the linear programming model was selected as a suitable option due to its simplicity and practical applicability to water resource allocation planning. The model was run for a five-year period by considering gradual variations through the determination of the most appropriate exploitation pattern from the available water resources (surface and groundwater). Results reveal that the negative water balance can be improved gradually as positive, where it will reach +20 million m3 per year in 2040 from the current deficit of 236 million m3 with an 8% increased net profit.
1. Introduction
For many decades, the scarcity of water resources has become a serious problem due to the rapid population growth and shift in economic development. As a result, this has become a pressing issue in formulating sustainable development policies [1,2,3]. In many countries, agriculture requires the largest amount of water, which places even more importance on agricultural water management. For example, agricultural water use accounts for 63.6% of the national total water use in China [4]. Crop area is considered as an important reference data for agricultural water management and plays an increasingly significant role in the sustainable development of agriculture [5,6,7,8,9,10]. The most common technique used for cropping pattern optimization (CPO) is linear programming (LP). Efficient optimization methods for crop area planning are desired and beneficial to agricultural water management as they can decide how much water should be allocated to different cropped areas in order to obtain certain goals, such as maximizing benefit and minimizing water-use of an irrigation system [11,12,13,14].
The proposed goal is to find a way to maximize the profit or minimize the cost; to this end, cases where available resources must be combined are analyzed. Via mathematical programming, an optimal way of combining scarce resources can be quantified.
From an engineering perspective, planning irrigation with a deficit is very complex, because the production functions need to be reliable [15]. Any uncertainity in those functions will spoil the precise production prediction as well as the determination of the most economical water level [16]; however, deficit irrigation is a concept that can be applied with great success. Many farmers who experience a shortage of available water resources can practice deficit irrigation, aiming to maximize profit by many times in an empirical way. Achieving a proper cultivation pattern with the aim of water resources management is a complex problem, which is dependent upon various factors. In this regard, an LP model was used for optimization of cultivation patterns in the Arjan plain.
Examination of resources indicates that models have been used for optimization in various areas including management of water resources and determination of optimal cultivation pattern. Zhou et al. [17] investigated the theory and application of the fuzzy ideal linear programming model for a plain in a sub-region of Haraz. They concluded that by establishing flexibility in the ideals in a fuzzy model, the resources can be allocated in a better way for the developed area under cultivation. Shang and Mao [18] proposed an optimization model for irrigation under the conditions of limited availability of water.
Theocharis et al. [19] presented a simplified non-linear programming method for selecting the best diameters for pipes used for irrigation. Previously, many real-life case studies about crop area optimization have been addressed during the last three decades. López-Baldovin et al. [20] developed a multicriteria objective function for the Guadalquivir Valley. In this model, cluster analysis was employed to divide the irrigated area into homogeneous types of farming. The results showed that the crops’ evolution over time was significantly related to the political environment regarding the Common Agricultural Policy (CAP).
Accordingly, the objective of this study is to develop a water resources programming model for determination of a proper cultivation pattern; to optimize exploitation from surface and groundwater resources; and to specify the way water can be allocated among agricultural crops in the Arjan plain in Fars Province.
Case Study
The Arjan plain is located in the southwestern part of Iran in the Fars province. This is a protected area of about 60,000 ha, with an average annual rainfall of 430 mm (16.92 inches). This area is located between two wetlands, Arjan wetland from the east and Parishan wetland from the west, in addition to being located between two major cities, Shiraz and Kazeroon. These two wetlands create a beautiful area. Furthermore, the demands of these nearby two major demands for agriculture has resulted in local people beginning to invest in agriculture in this area, which considered as the most important economic role. Figure 1 presents the Arjan plain location in Iran and the Arjan and Parishan wetlands [21,22].
About 60% of this area is bounded by Zagros Mountain, and the climate of the wetlands is more similar to the city of Kazeroon, with the International Wetland of Parishan located 12 km from Kazeroon. The Arjan plain elevation is almost 1500 m above the sea level, the Arjan wetland elevation is 2015 m and the Parishan elevation is 820 m above the sea surface level. According to the cultural background of the Arjan plain, local people utilized remedial plants to cure their illness in the past in addition to demanding food crops from the major cities, such as watermelon, apple, eggplants and so on. Therefore, the biodiversity of plants in this area will be critical regarding the demands for food and vegetables from the major neighboring cities in addition to the local economy. The Arjan and Parishan wetlands as well as the plain are considered as protected areas by the International Union for Conservation of Nature (IUCN) list.
2. Materials and Methods
2.1. Optimization
Optimization is a method through which the best possible solution for a problem is determined based on the specified target and the existing constraints. All of these values are determined by mathematical functions and relations. The optimized problem has one target function and related constraint conditions encompassing the properties of the system of interest.
The common methods of mathematical programming for optimization include linear programming, non-linear programming, dynamic programming, integer programming, binary programming, the critical path method, and the allocation method.
2.2. Optimization of Cultivation Pattern
The water resources available in the region of interest do not fully meet the agronomic water need for crops in agricultural lands. Consequently, the plants face water stress and in turn, this results in yield reduction. As a result, the way resources are exploited and water is allocated across different crops should be optimized in order to minimize the detrimental effects of water shortage.
Through investigation of various models of water resource programming and properties along with the conditions governing each of these models, linear programming was chosen as the best model for this case of study.
2.3. Linear Programming (LP)
Linear programming is one of the simplest and most practical models of optimization. To develop a linear programming model, the steps below are followed:
- Development of target function
- Development of a set of equations and inequalities (constraints)
- The no-negative condition
This model deals with the solution of the type of problems in which the relations between the variables are linear for both the target function and constraints. This simplifies the problem, although this also imposes more constraints.
This type of programming in water resources can be applied in problems with simple relations, such as direct allocation of resources. Furthermore, it can be applied even to complex problems of exploitation and management.
The general model of linear programming is as defined by Equation (1):
where C is the n-dimensional coefficient vector of the target function; X is the n-dimensional vector of the decision variables; b is the m-dimensional vector of constants indicating available resources; A is the m by n matrix of the coefficients of constraints; and T is the matrix transpose operator.
Under logical and specific assumptions, non-linear problems can also be converted into LP problems. They then need repetition or approximation methods to be solved. The advantages of LP are as follows [23]:
- the possibility of solving problems for a large number of decision variables;
- no requirement of initial values;
- quick calculation of the global optimal solution;
- availability of the related software programs.
The target function of the proposed optimization model is formulated as Equation (2):
where Ac is the cultivation area of Product c (ha); Bc and Cc are the revenue and the cost of Product c per ha, respectively per area unit (Iranian Rials per ha); Ya and Yp are the actual and potential products, respectively (kg/ha); Yp/Ya are the relative produced product (the function of producing a product out of water-dimensionless).
In Equation (2), Ya is the only unknown variable and other variables are either measurable (Ac, Bc, and Cc) or calculable (Yp). In contrast to the various functions of producing a crop out of water, Equation (3) was used in this study:
where ETac and ETpc are the actual and potential evapo-transpiration (PET) of the plant, respectively, during the growth season (mm); Kyc is the coefficient of plant sensitivity to water, which is the correlation between the related productivity loss and the related evapotranspiration reduction.
In Equation (3), if the actual evapo-transpiration (ETa) is equal to the potential evapo-transpiration for Product c (e.g., ETac/ETpc = 1); thus, Ya/Yp is also equal to 1. However, if ETa is lower than the ETp (e.g., ETac/ETpc < 1), then Ya/Yp < 1. Essentially, in this case, its value changes in relation to ETac/ETpc in a linear fashion (with its slope in proportion with Kyc). In order to employ Equation (3) in the model, the value of ETac/ETpc is considered equivalent to the ratio of the actual to potential irrigation water, where the amount of potential irrigation water can be calculated with Equation (4):
where IRpc,t is the potential irrigation water allocated to each plant in every month t (mm); ETpc,t is the potential evapo-transpiration of the plant in every month t (mm); Klf is the leaching coefficient assumed as 1.1 in this study; Ef is the irrigation efficiency.
After the target function, constraints are the next to be calculated in the formula. The area under cultivation is the first constraint, with the total cultivation area equal to the total area of each plain as in Equation (5), and the area under cultivation for each crop can only vary by 20% when considering the social conditions, with the aim of gradual changes in the region’s cultivation combination according to Equation (6):
where At is the total area of each plain (ha); Apc is the cultivation area of Crop C under the existing conditions (ha).
Irrigation water is the second constraint. The maximum limit for the actual irrigation water in each month is equal to the potential irrigation water, which is calculated in Equation (7):
The total irrigation water during the growth season is equal to the total irrigation water in each month, which is calculated according to Equations (8) and (9):
where IRac,t and IRpc,t are the actual and potential irrigation water in each month t (mm); IRac,g and IRpc,g are the actual and potential irrigation water in the growth season (mm).
Water harvest is the third constraint. Harvesting surface water is conducted completely. However, harvesting groundwater is limited to the maximum allowable limit of groundwater resources in the target year, which is calculated in Equation (10):
The total irrigation water is equal to the sum of the harvested water from the surface and groundwater, which is calculated in Equation (11):
where GR is the groundwater harvesting (million m3); GRmax is the maximum allowable limit to harvest groundwater resources in the target year (million m3); SU is the surface water harvesting (million m3); IR is the total irrigation water (million m3).
The allocation of water to plants is the fourth constraint. The total water allocated to plants (IRRt) should be fully divided between downstream agricultural plants as calculated by Equation (12):
The model inputs include the following two parameter groups.
- The parameters related to economic calculations, extracted from reports of basic studies (agricultural and socioeconomic) [23], include
- the product efficiency in each plain;
- the unit price of each product in the region, which is the average of reference-year and the final year with inflation effects of 11.9% [24];
- price per ha of each product in the region.
- The parameters related to calculations of irrigation water include
- the total irrigation efficiency of each plain in different years;
- the net monthly irrigation requirement of each product;
- the coefficient of plant sensitivity to water;
- the maximum allowable withdrawal from groundwater in different years.
Due to the great significance of these parameters, the required constant and coefficient values for the LP model are presented in Table 1, Table 2 and Table 3.
The total efficiency of irrigation of the Arjan plain was 52.2% in 2015; however, after managing the irrigation system and water allocation, in the target years of 2020, 2025, 2030, 2035, and 2040, the total efficiency should increase. Total changes in efficiency are expected to amount to a 15% increase, which is significant in the Arjan plain project.
Based on the long-term governmental plan of surface and ground water harvest, regardless of the climate changing situation and precipitation, surface water harvest is always 9 Million Cubic Metres (MCM), but the governmental long-term plan for groundwater harvest will change every five years, decreasing from 659 MCM in 2015 to 392 MCM in 2040, which is a 267 MCM decrease over a period of 25 years.
It can be claimed that the crops with a Ky smaller than 1 tolerate the lack of water to a greater extent and could be exposed to a water deficit. On the other hand, crops with a Ky greater than 1 show a yield decrease that is more than proportional to the applied evapotranspiration decrease [26]. Benefit-to-cost (B/C) calculation shows that the highest rate of B/C is for lentils with 4.76; moreover, for onions and walnuts, the B/C ratio is almost 3.4, which is significant. Other crops have a B/C ratio between 2 and 3, except wheat, hay, and green beans for which the B/C ratio is less than 2. Different B/C ratios cause different results in terms of irrigation water allocation and cultivation area.
3. Results and Discussion
The LP model applied to the study region was developed using in LINGO 8.0 [27]. The LP model is used for the determination of the optimal cultivation combination, of the most suitable exploitation pattern regarding the available resources, of the optimal allocation of this pattern between different plants, and eventually of the profit to be made from the agriculture. The results of the study are described as follows.
3.1. The Optimal Cultivation Pattern
The results of the model, run over many years, are provided in Table 4 for the Arjan plain. The results reveal that the variations in the cultivation pattern over different years is expected to result in an increasing trend in the net gained profit from $223 million in 2020 to $245 million in 2040, despite reduced withdrawal from groundwater resources. The net profit is calculated based on all revenue and the cost of all products in each year, including land rent costs, capital, tax, labor force costs, and all other costs. This is calculated as follows (Thompson, 1978):
- Step (1) Sales revenue = price of product (Bc) × quantity sold;
- Step (2) Gross profit = sales revenue − cost of sales and other direct costs;
- Step (3) Operating profit = gross profit − overheads and other indirect costs;
- Step (4) Pretax profit (earnings before taxes) = operating profit − interest payable;
- Step (5) Net profit (Bc-Cc) = Pre-tax profit – tax.
In Table 4, the total cultivation area is 50,701 ha and the net profit is 697 billion IR Rials, which is equal to 18.6 million US Dollars (USD) in 2015 as a reference year. Net profit is expected to continuously increase with changes in cultivation area. Furthermore, the area utilization is expected to decrease, which is in the interest of local farmers. The harvest of surface water is limited to its maximum allowable amount of 9 MCM each year and the groundwater harvest decreases by time due to improvement of irrigation efficiency. In 2020, the total cultivation area will decrease by around 20%, the net profit will increase by about 0.5%, and there will be a decrease of 31% in irrigation water use. The lack of water in the southern part of Iran is critical and very serious. Therefore, the most important aspects of this optimization are the declining use of irrigation water and increasing net profit. In the target year of 2040, net profit will increase by around 8%, which is quite important for local farmers, and water demand will decline by around 42% compared to the reference year. All crops in Table 4 cab be classified into four different classes based on changes in cultivation area as follows.
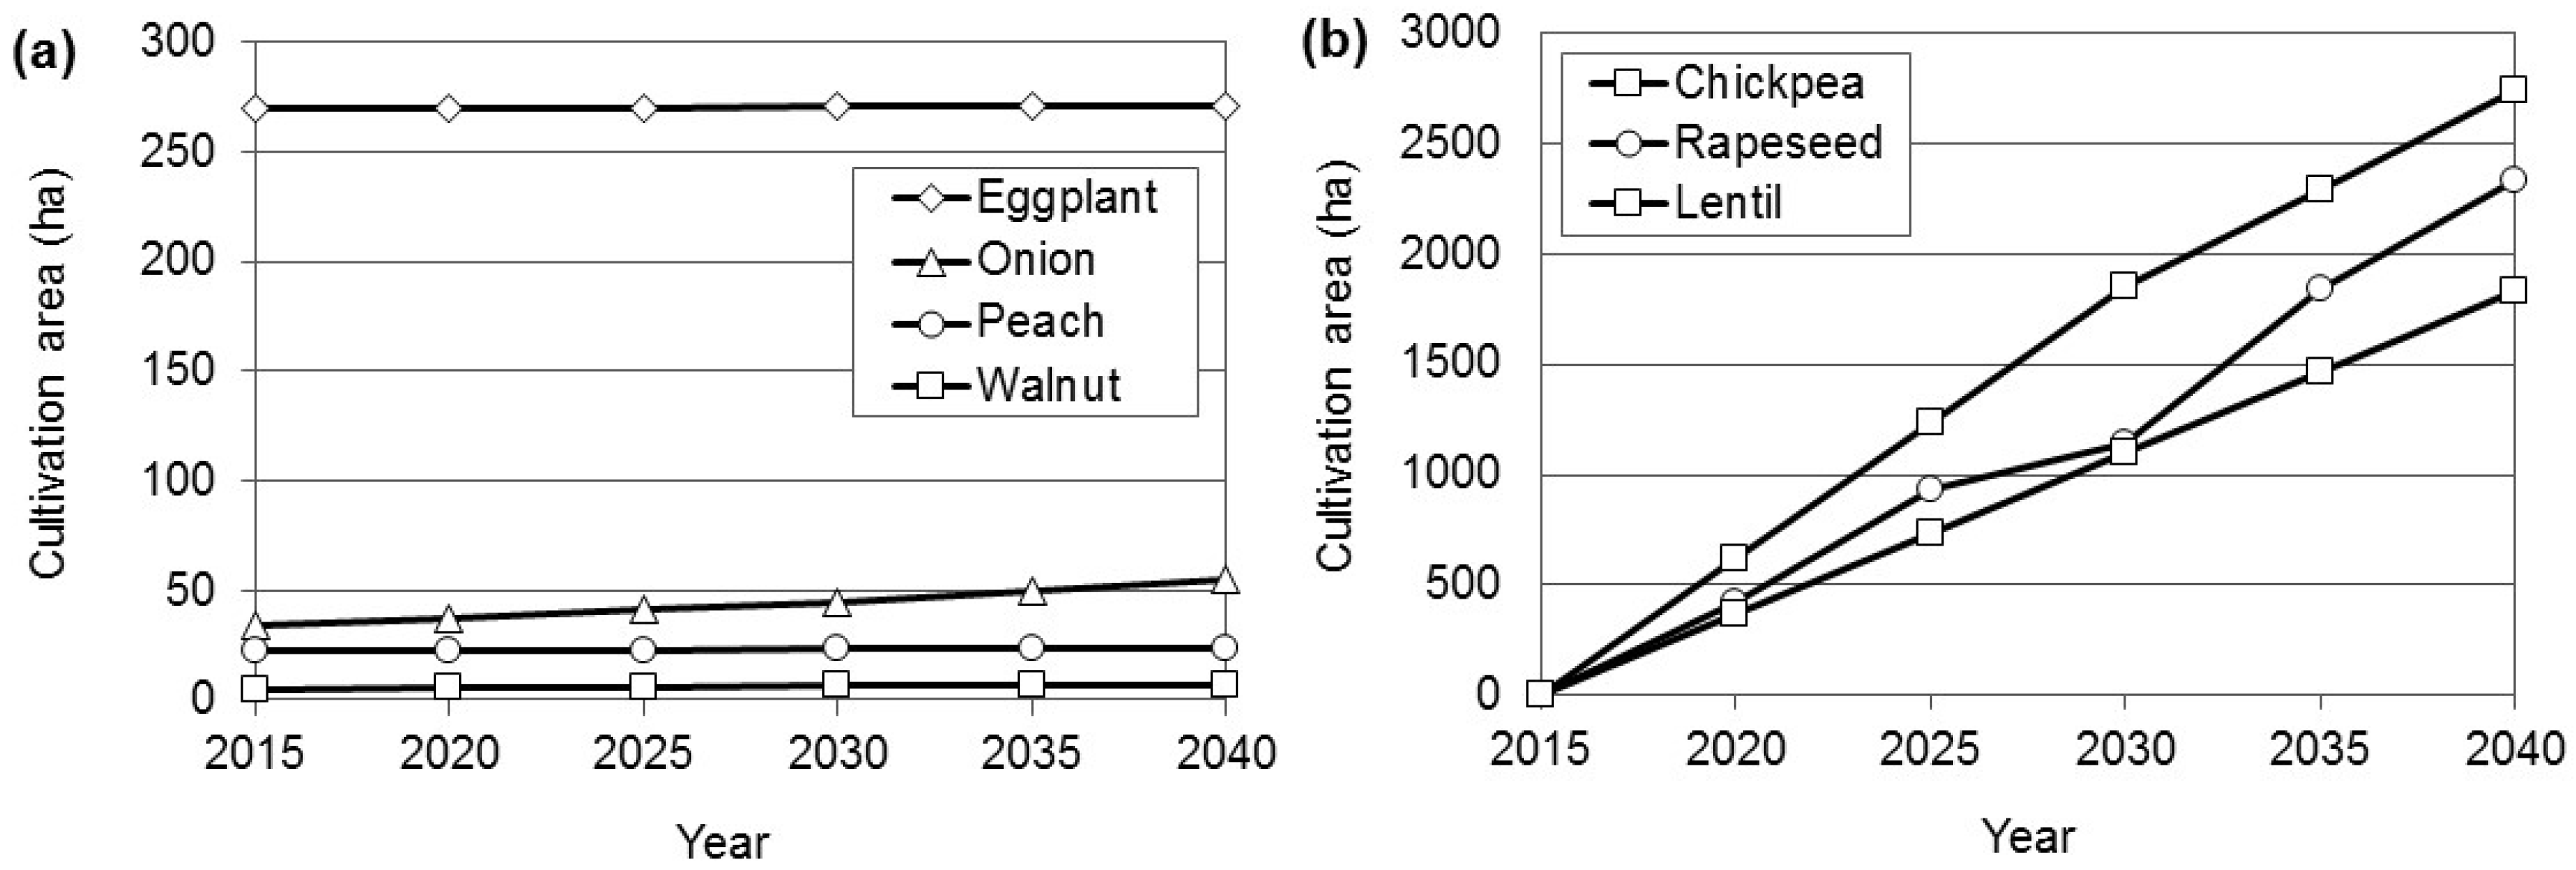
Class 1 includes the crops whose cultivation area is to stay stable from 2015 to 2040 period after optimization (Figure 2a). The crops in Class 1 are eggplant, onion, peach, and walnut. These crops will be optimally cultivated and that there is no need to change the cultivation area in the Arjan wetland area.
Class 2 includes the crops that will not be cultivated but will be suitable for the Arjan wetland area regarding the weather situation and condition, and they will increase the benefit and decrease the water demand (Figure 2b). These crops are chickpea, rapeseed, and lentil that were not cultivated until 2015 even though their B/C values are higher than other crops. Based on optimization results, their cultivation area can increase significantly by 2040 with an average rate of about 100 ha per year to generate new revenue for future.
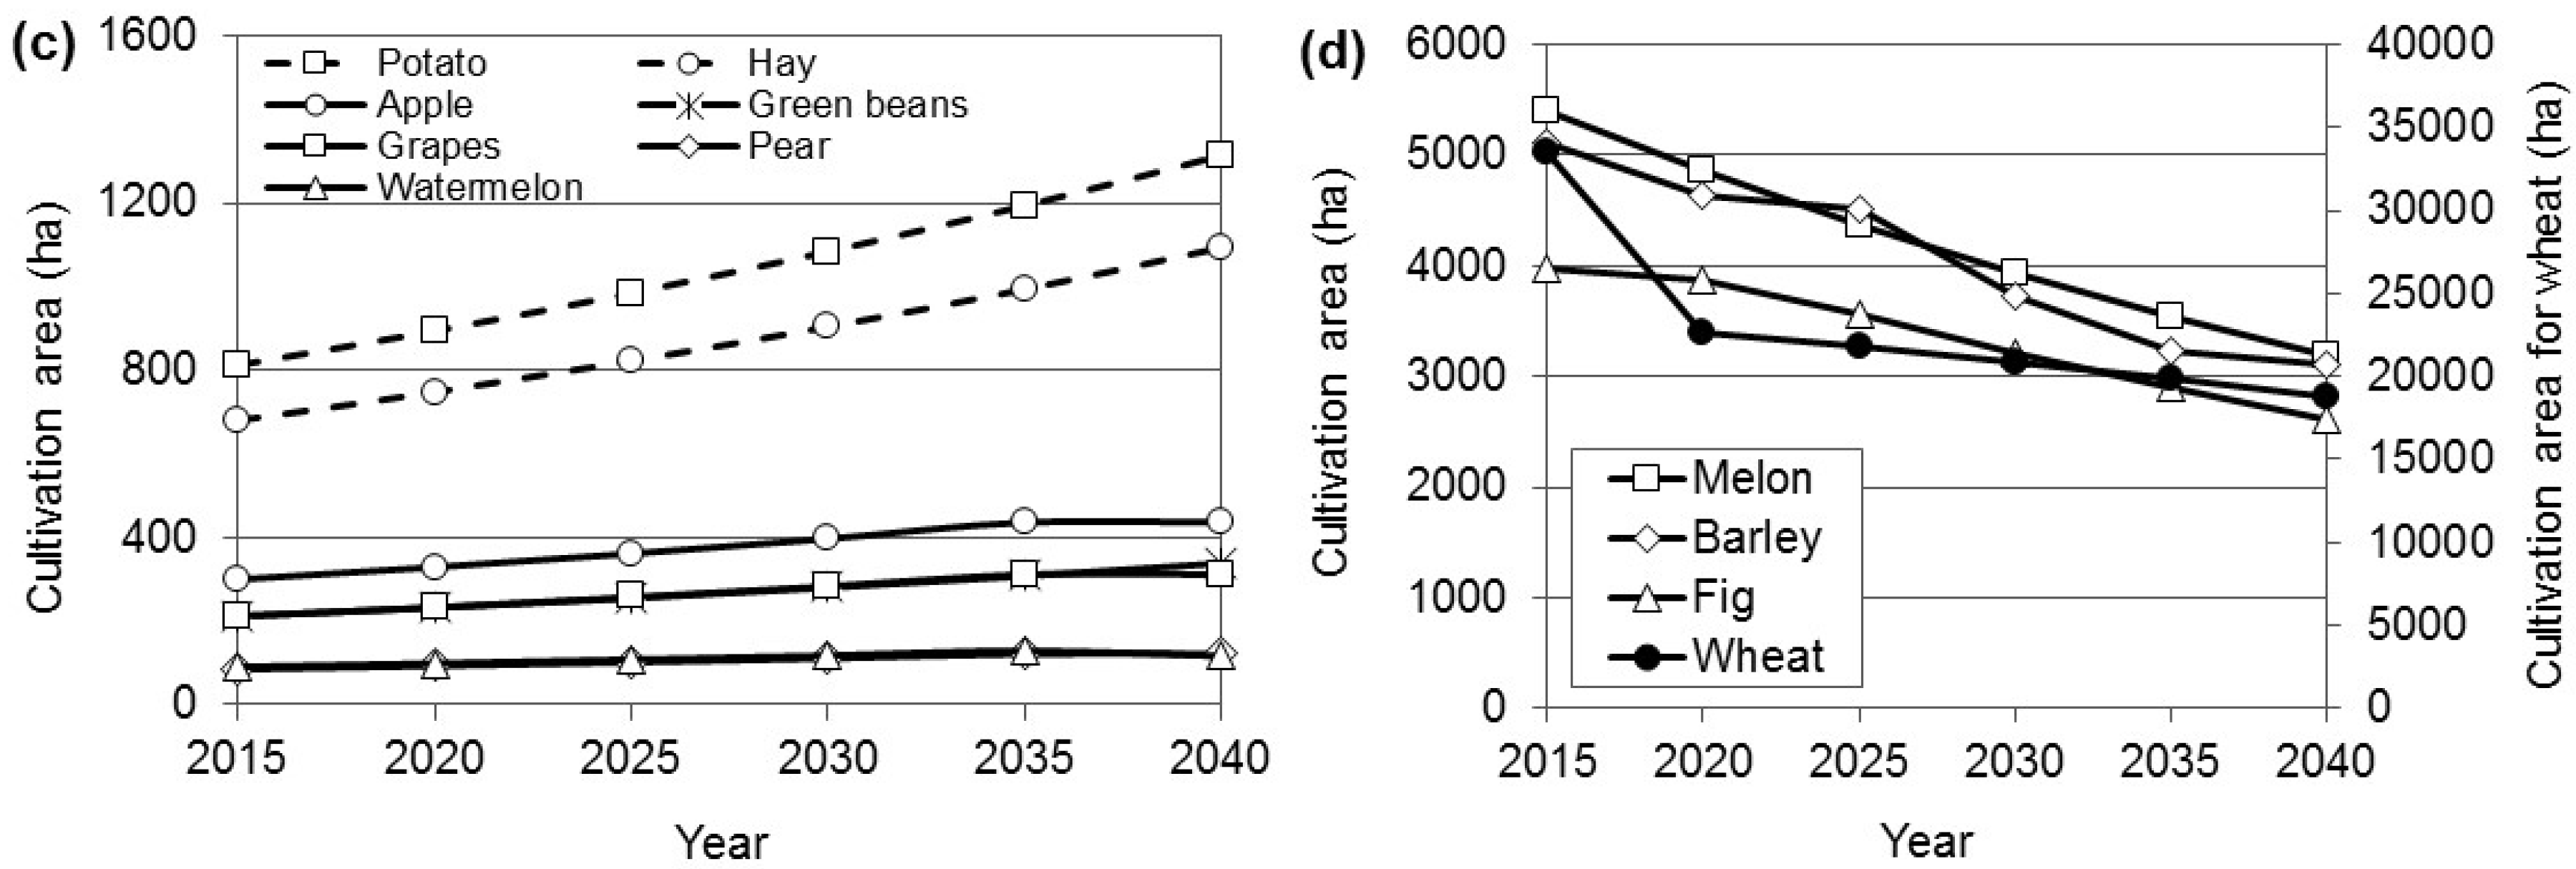
Class 3 includes the crops that will experience increases in cultivation area after optimization in the 2015–2040 period (Figure 2c). These crops are grape, pear, apple, watermelon, potato, greenbeans, and hay. Their increasing rate ranges from 2 to 19 ha/year during the period of 2015 to 2040. The long-term perspective for the Arjan wetland should consider this suggestion to increase the revenue continusouly.
Finally, Class 4 includes the crops that are expected to experience declines in cultivation area after optimization in the 2015–2040 period (Figure 2d). These crops are melon, barley, and fig. Note that wheat is presented in the right axis. Unfortunately, these four crops are cultivated on a large scale in the study region relative to other crops, showing 95% of the total area as of 2015. Optimizaiton results, however, show that this occupancy gradulally reduces to 72% by 2040, while the total revenue increases. This implies that these crops are not suitable for the Arjan wetland area considering their water use pattern and B/C. Regarding the precipitation rate, water demand, and the geographical situation of the study region, these crops are not suitable for cultivation in large scale and should be replace by other crops such as Class 2 or 3 in the long term.
3.2. Plain Balance
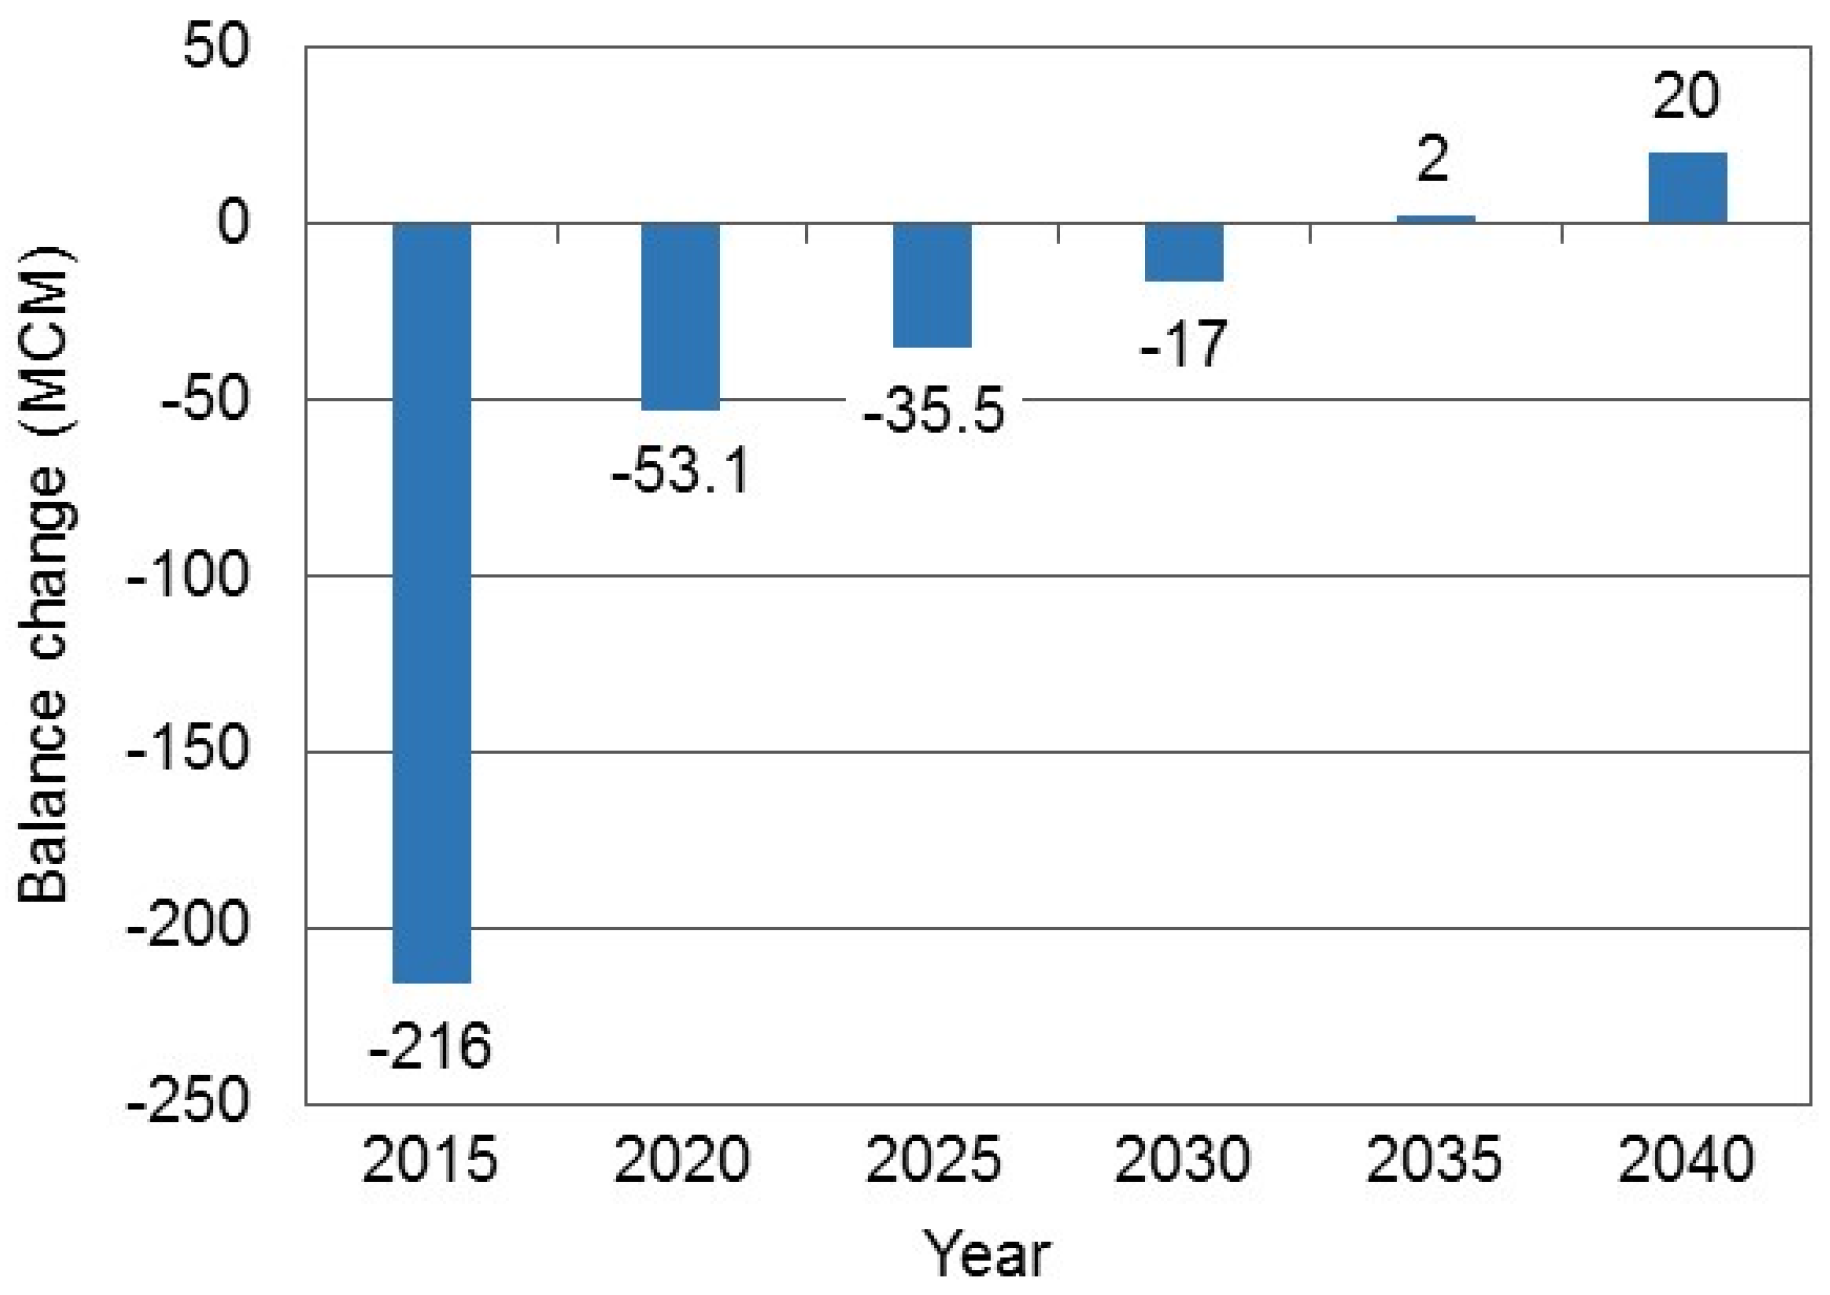
Through determination of the most appropriate exploitation pattern from the available resources (surface and groundwater), the negative balance of the plain was modified by the model and becomes gradually positive, having developed from −216 to +20 in 2040. The changes in the plain balance are presented in Figure 3 during different years.
It is important to note that the changes in the plain balance from 2015 to 2020 has been large; however, these changes occur at a slower rate over the following years. This can be due to the changes in the current cultivation pattern to the optimal pattern where the annual optimal cultivation becomes the basis for the following year.
Figure 3 shows that the current balance in 2015 is −216, which will jump to −53.1 after 5 years. This is considered as the most important jump among all the years. Cultivation management will have decreased the negative balance and after 20 years, there will be a positive balance of +2. The highest balance of 20 MCM occurs in 2040, although the highest change occurs in 2020, with a decrease of 75.5% to 53.1 MCM.
4. Conclusions
The Arjan plain is one of the most important plains in the southwestern part of Iran. The southern part of Iran is faced with several issues regarding lack of water and decreasing groundwater level. Groundwater is one of the most important resources for irrigation worldwide and especially in semi-arid areas, such as the Arjan plain. Therefore, the cultivation management and modeling is one of the most important topics for the Arjan plain.
After considering all limitations, inputs and calculated variables in our target model, the cultivation area and irrigation water was optimized based on the different vegetables and crops. The limitations of this study were the maximum allowable limit to harvest groundwater and surface water resources in the target years, the maximum limit for the actual irrigation water in each month, and the boundary condition of cultivation area of each crop. The target of the model saw the cultivation area and irrigation water requirement decrease, but the net profit of local farmers increased. These changes in irrigation water harvest resulted in a substantial positive shift in the Arjan plain water balance. The presented results are merely preliminary, intended to show model capabilities, and all of the results are based on published data and conditions currently available. The reference year in this paper is 2015, and target years were set for every 5 years from 2020 until 2040 to determine cultivation area optimization and possibilities for revenue maximization; therefore, there is no validation for results regarding the 2020–2040 period.
The final net profit was shown to change from $18.6 million USD in 2015 to $20.1 million USD in 2040 according to our calculations, which is an increase of 8% compared to the reference year. The surface water harvest was the same regarding the local limitations, but the groundwater harvest changed from 657 MCM for 50,702 ha (12,953 m3/ ha) to 379 MCM for 38,683 ha (9796 m3/ha), which is a decrease of 42.3% in groundwater demand in the Arjan plain.
Considering the water resource shortages in most of the plains in the country, and since the highest water consumption occurs in the agricultural sector, viewpoint changes in the pattern of cultivation of agricultural crops and in the allocation of water to this sector are inevitable. Optimization models can be employed as a desirable tool for the determination of optimal cultivation patterns in order to reduce water consumption and increase production in total plans of water resource management.
Author Contributions
Amin Daghighi conceived and designed; Ungtae Kim advised formulation; Amin Daghighi and Ali Nahvi wrote the paper initially and performed numerical simulations; all authors equally analyzed the data and contributed to manuscript revisions.
Conflicts of Interest
The authors declare no conflict of interest.
References
- Dai, Z.Y.; Li, Y.P. A multistage irrigation water allocation model for agricultural land-use planning under uncertainty. Agric. Water Manag. 2013, 129, 69–79. [Google Scholar] [CrossRef]
- Mianabadi, H.; Sheikhmohammady, M.; Mostert, E.; Van de Giesen, N. Application of the ordered weighted averaging (OWA) method to the Caspian Sea conflict. Stoch. Environ. Res. Risk Assess. 2014, 28, 1359–1372. [Google Scholar] [CrossRef]
- Nahvi, A.; Daghighi, A.; Nazif, S. The Environmental Impact Assessment of Drainage Systems: A Case Study of the Karun River Sugarcane Development Project. Arch. Agron. Soil Sci. 2017. [Google Scholar] [CrossRef]
- Li, M.; Guo, P. A coupled random fuzzy two-stage programming model for crop area optimization—A case study of the middle Heihe River basin, China. Agric. Water Manag. 2015, 155, 53–66. [Google Scholar] [CrossRef]
- Cai, X.; Cui, Y. Crop planting structure extraction in irrigated areas from multi-sensor and multi-temporal remote sensing data. Trans. Chin. Soc. Agric. Eng. 2009, 25, 124–130. [Google Scholar]
- Singh, A. Land and water management planning for increasing farm income in irrigated dry areas. Land Use Policy 2015, 42, 244–250. [Google Scholar] [CrossRef]
- Iglesias, A.; Garrote, L. Adaptation strategies for agricultural water management under climate change in Europe. Agric. Water Manag. 2015, 155, 113–124. [Google Scholar] [CrossRef]
- Valipour, M.; Ziatabar Ahmadi, M.; Raeini-Sarjaz, M.; Gholami Sefidkouhi, M.A.; Shahnazari, A.; Fazlola, R.; Darzi-Naftchali, A. Agricultural water management in the world during past half century. Arch. Agron. Soil Sci. 2015, 61, 657–678. [Google Scholar] [CrossRef]
- Valipour, M. Future of agricultural water management in Africa. Arch. Agron. Soil Sci. 2015, 61, 907–927. [Google Scholar] [CrossRef]
- Maughan, T.; Drost, D.; Allen, L.N. Vegetable Irrigation: Squash and Pumpkin. Horticulture 2015, 4, 1–5. [Google Scholar]
- Zeng, X.; Kang, S.; Li, F.; Zhang, L.; Guo, P. Fuzzy multi-objective linear programming applying to crop area planning. Agric. Water Manag. 2010, 98, 134–142. [Google Scholar] [CrossRef]
- Azzaz, A.A.; Jellali, S.; Akrout, H.; Assadi, A.A.; Bousselmi, L. Optimization of a cationic dye removal by a chemically modified agriculture by-product using response surface methodology: Biomasses characterization and adsorption properties. Environ. Sci. Pollut. Res. 2017, 24, 9831–9846. [Google Scholar] [CrossRef] [PubMed]
- Davijani, M.H.; Banihabib, M.E.; Anvar, A.N.; Hashemi, S.R. Multi-objective optimization model for the allocation of water resources in arid regions based on the maximization of socioeconomic efficiency. Water Resour. Manag. 2016, 30, 927–946. [Google Scholar] [CrossRef]
- Jianchang, L.; Luoping, Z.; Yuzhen, Z.; Hongbing, D. Trade-off between water pollution prevention, agriculture profit, and farmer practice—An optimization methodology for discussion on land-use adjustment in China. Environ. Monit. Assess. 2015, 187, 4104. [Google Scholar] [CrossRef] [PubMed]
- Frizzone, J.A.; Coelho, R.D.; Dourado-Neto, D.; Soliani, R. Linear programming model to optimize the water resource use in irrigation projects: An application to the Senator Nilo Coelho Project. Sci. Agric. 1997, 54, 136–148. [Google Scholar] [CrossRef]
- English, M. Deficit irrigation. I: Analytical framework. J. Irrig. Drain. Eng. 1990, 116, 399–412. [Google Scholar] [CrossRef]
- Zhou, H.; Peng, H.; Zhang, C. An interactive fuzzy multi-objective optimization approach for crop planning and water resources allocation. In International Conference on Life System Modeling and Simulation; Springer: Berlin/Heidelberg, Germany, 2007; pp. 335–346. [Google Scholar]
- Shang, S.; Mao, X. Application of a simulation based optimization model for winter wheat irrigation scheduling in North China. Agric. Water Manag. 2006, 85, 314–322. [Google Scholar] [CrossRef]
- Theocharis, M.E.; Tzimopoulos, C.D.; Yannopoulos, S.I.; Sakellariou-Makrantonaki, M.A. Design of optimal irrigation networks. Irrig. Drain. 2006, 55, 21–32. [Google Scholar] [CrossRef]
- López-Baldovin, M.J.; Gutiérrez-Martin, C.; Berbel, J. Multicriteria and multiperiod programming for scenario analysis in Guadalquivir river irrigated farming. J. Oper. Res. Soc. 2006, 57, 499–509. [Google Scholar] [CrossRef]
- Dolatkhahi, M.; Dolatkhahi, A.; Nejad, J.B. Ethnobotanical study of medicinal plants used in Arjan–Parishan protected area in Fars Province of Iran. Avicenna J. Phytomed. 2014, 4, 402. [Google Scholar] [PubMed]
- Monavari, S.M.; Momen Bellah Fard, S. A GIS based assessment tool for biodiversity conservation. Int. J. Environ. Res. 2010, 4, 701–712. [Google Scholar]
- Dantzig, G. Linear Programming and Extensions; Princeton University Press: Princeton, NJ, USA, 2016. [Google Scholar]
- World Data Atlas. Iran—Average Consumer Prices Inflation Rate. Available online: https://knoema.com/atlas/Iran/Inflation-rate (accessed on 1 August 2017).
- Steduto, P.; Hsiao, T.C.; Fereres, E.; Raes, D. Crop Yield Response to Water; FAO: Rome, Italy, 2012. [Google Scholar]
- Kirda, C. Deficit irrigation scheduling based on plant growth stages showing water stress tolerance. Food Agric. Organ. U. N. Deficit Irrig. Pract. Water Rep. 2002, 22, 102. [Google Scholar]
- Thornburg, K.; Hummel, A. LINGO 8.0 TUTORIAL; Columbia University: New York, NY, USA, 2006. [Google Scholar]
Figure 1.
Location of study area: (a) Iran; (b) Fars Province and the Arjan–Parishan wetlands.
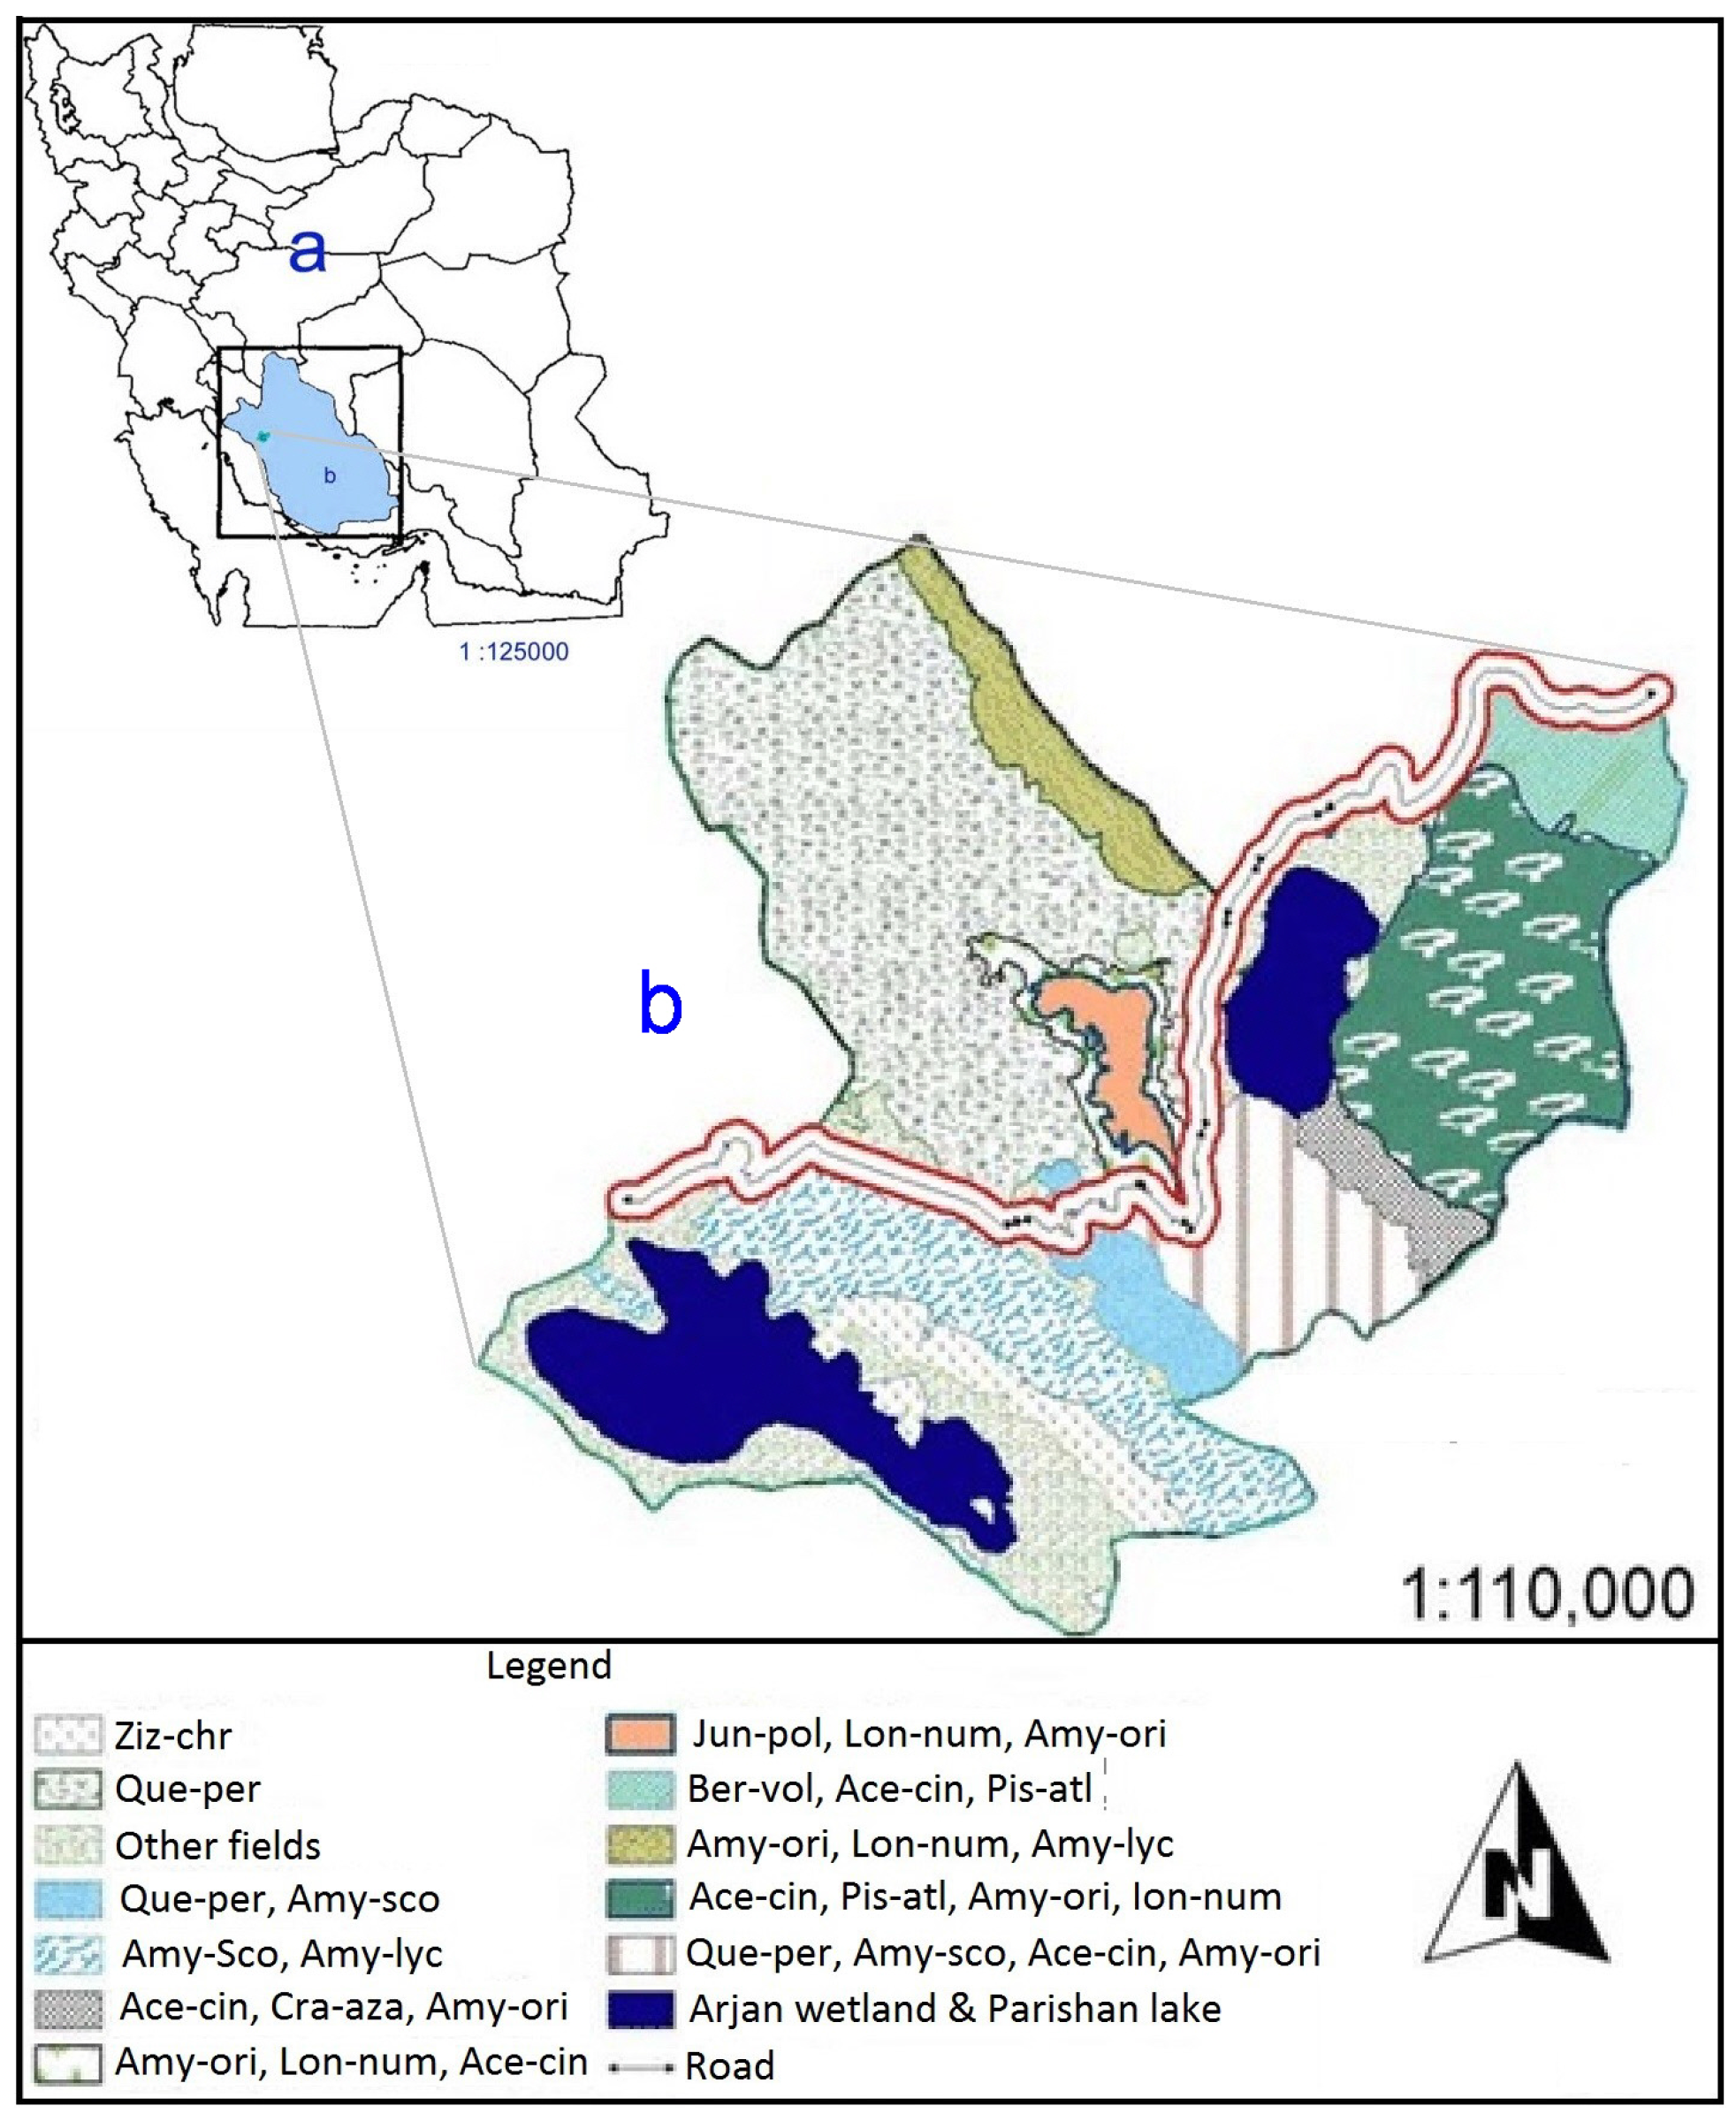
Figure 2.
Cultivation area changes for (a) Class 1; (b) Class 2; (c) Class 3; and (d) Class 4.


Figure 3.
The changes in the Arjan plain water balance (MCM).

Table 1.
The total efficiency of irrigation of the Arjan plain for the target years (%).
| Base Year | Target Years | ||||
|---|---|---|---|---|---|
| 2015 (Current Status) | 2020 | 2025 | 2030 | 2035 | 2040 |
| 52.2 | 55.7 | 57.8 | 59.3 | 64.1 | 67.0 |
Table 2.
The maximum allowable groundwater withdrawal from the Arjan plain for the target years (unit: Million Cubic Metres, MCM).
Table 2.
The maximum allowable groundwater withdrawal from the Arjan plain for the target years (unit: Million Cubic Metres, MCM).
| Base Year | Target Years | ||||
|---|---|---|---|---|---|
| 2015 (Current Status) | 2020 | 2025 | 2030 | 2035 | 2040 |
| 659 | 473 | 465 | 437 | 428 | 392 |
Table 3.
The net monthly irrigation requirement (IR), revenue (B), cost (C), and Ky of agricultural products of the Arjan plain.
Table 3.
The net monthly irrigation requirement (IR), revenue (B), cost (C), and Ky of agricultural products of the Arjan plain.
| Month | IR for Each Month (mm) | B | C | Ky [25] | |||||||||||||
|---|---|---|---|---|---|---|---|---|---|---|---|---|---|---|---|---|---|
| Crop Type | 1 | 2 | 3 | 4 | 5 | 6 | 7 | 8 | 9 | 10 | 11 | 12 | Sum | ($k in ha) | |||
| Wheat | 81 | 159 | 119 | - | - | - | - | 48 | 8 | 3 | 9 | 25 | 452 | 654 | 348 | 1.10 | |
| Barley | 81 | 154 | 62 | - | - | - | - | 48 | 9 | 4 | 10 | 25 | 393 | 57 | 21 | 1.10 | |
| Fig | 48 | 51 | 149 | 280 | 282 | 201 | 101 | 25 | - | - | - | - | 1137 | 2897 | 1106 | 0.80 | |
| Watermelon | 55 | 103 | 202 | 250 | 61 | - | - | - | - | - | - | - | 671 | 1387 | 642 | 1.10 | |
| Melon | 55 | 103 | 202 | 244 | 60 | - | - | - | - | - | - | - | 664 | 1276 | 611 | 1.10 | |
| Hay | 53 | 110 | 156 | 194 | 185 | 135 | 82 | 41 | 22 | 5 | 10 | 19 | 1012 | 55 | 35 | 0.90 | |
| Green beans | - | - | - | 65 | 103 | 162 | 100 | 25 | - | - | - | - | 455 | 1848 | 939 | 0.90 | |
| Potato | 51 | 57 | 199 | 287 | 273 | 177 | 61 | - | - | - | - | - | 455 | 408 | 185 | 1.10 | |
| Onion | 71 | 116 | 202 | 261 | 230 | - | - | - | - | - | - | - | 1105 | 274 | 80 | 1.05 | |
| Apple | 13 | 79 | 193 | 256 | 243 | 166 | 30 | - | - | - | - | - | 980 | 2084 | 737 | 1.05 | |
| Pear | 20 | 117 | 194 | 256 | 243 | 152 | - | - | - | - | - | - | 982 | 2529 | 988 | 0.95 | |
| Peach | 23 | 114 | 184 | 242 | 228 | 142 | - | - | - | - | - | - | 933 | 3222 | 1328 | 0.65 | |
| Eggplant | 53 | 110 | 156 | 194 | 185 | 135 | 82 | 41 | 22 | 5 | 10 | 19 | 1012 | 1953 | 728 | 0.70 | |
| Walnut | - | 68 | 188 | 294 | 279 | 169 | - | - | - | - | - | - | 998 | 7759 | 2303 | 0.75 | |
| Grapes | - | 47 | 163 | 226 | 213 | 81 | - | - | - | - | - | - | 730 | 1933 | 802 | 0.85 | |
| Lentil | 52 | 90 | 220 | 273 | 40 | - | - | - | - | - | - | - | 675 | 1211 | 255 | 1.25 | |
| Chickpea | 52 | 90 | 220 | 271 | 40 | - | - | - | - | - | - | - | 673 | 378 | 137 | 1.15 | |
| Rapeseed | 81 | 154 | 62 | - | - | - | - | 48 | 9 | 4 | 10 | 25 | 393 | 477 | 182 | 1.20 | |
Table 4.
Optimization results of cultivation area, net profit, and water harvests for the Arjan Plain.
Table 4.
Optimization results of cultivation area, net profit, and water harvests for the Arjan Plain.
| Variables | Target Years | ||||||
|---|---|---|---|---|---|---|---|
| 2015 | 2020 | 2025 | 2030 | 2035 | 2040 | ||
| Cultivation area by crops (ha) | Wheat | 33,488 | 22,607 | 21,804 | 20,858 | 19,857 | 18,778 |
| Barley | 5121 | 4630 | 4515 | 3724 | 3236 | 3102 | |
| Fig | 3966 | 3880 | 3557 | 3201 | 2910 | 2619 | |
| Watermelon | 88 | 97 | 107 | 117 | 129 | 116 | |
| Melon | 5403 | 4863 | 4376 | 3939 | 3545 | 3190 | |
| Hay | 679 | 747 | 822 | 904 | 994 | 1094 | |
| Green beans | 211 | 232 | 255 | 281 | 309 | 340 | |
| Potato | 814 | 895 | 985 | 1083 | 1192 | 1311 | |
| Onion | 34 | 37 | 41 | 45 | 50 | 55 | |
| Apple | 300 | 330 | 363 | 399 | 439 | 439 | |
| Pear | 85 | 94 | 103 | 113 | 124 | 124 | |
| Peach | 23 | 23 | 23 | 24 | 24 | 24 | |
| Eggplant | 270 | 270 | 270 | 271 | 271 | 271 | |
| Walnut | 5 | 6 | 6 | 7 | 7 | 7 | |
| Grapes | 214 | 235 | 259 | 285 | 313 | 313 | |
| Lentil | 0 | 366 | 732 | 1097 | 1463 | 1829 | |
| Chickpea | 0 | 617 | 1234 | 1851 | 2286 | 2743 | |
| Rapeseed | 0 | 425 | 931 | 1137 | 1842 | 2328 | |
| Sum of cultivation area (ha) | 50,701 | 40,354 | 40,383 | 39,336 | 38,991 | 38,683 | |
| Net profit | 109 IR Rials | 697 | 702 | 714 | 724 | 738 | 752 |
| 106 USD | 18.6 | 18.7 | 19.0 | 19.3 | 19.7 | 20.1 | |
| Water harvest (MCM) | Surface water | 9 | 9 | 9 | 9 | 9 | 9 |
| Ground water | 657 | 452 | 440 | 424 | 403 | 379 | |
| Total irrigation water (MCM) | 666 | 461 | 449 | 433 | 412 | 388 | |
© 2017 by the authors. Licensee MDPI, Basel, Switzerland. This article is an open access article distributed under the terms and conditions of the Creative Commons Attribution (CC BY) license (http://creativecommons.org/licenses/by/4.0/).
Share and Cite
MDPI and ACS Style
Daghighi, A.; Nahvi, A.; Kim, U. Optimal Cultivation Pattern to Increase Revenue and Reduce Water Use: Application of Linear Programming to Arjan Plain in Fars Province. Agriculture 2017, 7, 73. https://doi.org/10.3390/agriculture7090073
AMA Style
Daghighi A, Nahvi A, Kim U. Optimal Cultivation Pattern to Increase Revenue and Reduce Water Use: Application of Linear Programming to Arjan Plain in Fars Province. Agriculture. 2017; 7(9):73. https://doi.org/10.3390/agriculture7090073
Chicago/Turabian StyleDaghighi, Amin, Ali Nahvi, and Ungtae Kim. 2017. "Optimal Cultivation Pattern to Increase Revenue and Reduce Water Use: Application of Linear Programming to Arjan Plain in Fars Province" Agriculture 7, no. 9: 73. https://doi.org/10.3390/agriculture7090073
Note that from the first issue of 2016, this journal uses article numbers instead of page numbers. See further details here.