Article

Near Infrared Spectrometry for Rapid Non-Invasive Modelling of Aspergillus-Contaminated Maturing Kernels of Maize (Zea mays L.)

1
Queensland Alliance for Agriculture and Food Innovation, University of Queensland, Brisbane QLD 4108, Australia
2
International Institute of Tropical Agriculture, Headquarters & West African Hub, Ibadan 200001, Nigeria
*
Author to whom correspondence should be addressed.
Agriculture 2017, 7(9), 77; https://doi.org/10.3390/agriculture7090077
Submission received: 25 July 2017 / Revised: 30 August 2017 / Accepted: 13 September 2017 / Published: 19 September 2017

Abstract

:
Aflatoxin-producing Aspergillus spp. produce carcinogenic metabolites that contaminate maize. Maize kernel absorbance patterns of near infrared (NIR) wavelengths (800–2600 nm) were used to non-invasively identify kernels of milk-, dough- and dent-stage maturities with four doses of Aspergillus sp. contamination. Near infrared spectrometry (NIRS) spectral data was pre-processed using first derivative Savitzky-Golay (1d-SG) transformation and multiplicative scatter correction on spectral data. Contaminated kernels had higher absorbance between 800–1134 nm, while uninoculated samples had higher absorbance above 1400 nm. Dose and maturity clusters seen in Principal Component Analysis (PCA) score plots were due to bond stretches of combination bands, CH and C=O functional groups within grain macromolecules. The regression model at 2198 nm separated uninoculated and inoculated kernels (p < 0.0001, R2 = 0.88, root mean square error = 0.15). Non-invasive identification of Aspergillus-contaminated maize kernels using NIR spectrometry was demonstrated in kernels of different maturities.
Keywords:
NIR; maize; Aspergillus

1. Introduction

Aflatoxins, first identified in the 1960s after the infamous aflatoxicosis outbreak termed “Turkey X” disease [1], are produced primarily by Aspergillus flavus and A. parasiticus [2]. Since the 1960s, aflatoxicosis epidemics have also been reported in India, Kenya and recently in Tanzania [3,4,5]. Management is a critical strategy for aflatoxin reduction. Aflatoxin management strategies include biological control [6,7], predictive modelling [8], innovative storage techniques [9], breeding efforts [10,11], aflatoxin reduction strategies [12] and detection [13]. However, detection plays a key role in aflatoxin management because many intervention methods hinge on the ability to monitor the production of the toxin [14,15]. Rapid and early detection is important for prompt intervention. Current detection methods include high-performance liquid chromatography (HPLC), Enzyme Linked Immunosorbent Assay ELISA, fluorometric assays and lateral flow assays [16,17,18,19]. However, these methods are invasive, require specialised skills and are weak for real time assessments. Therefore, rapid, non-invasive methods, including the use of near infrared spectrometry (NIRS), have become increasingly sought after [20], especially because of their potential for real-time applications.
The discovery of infrared light by William Herschel in the 19th century [21] unlocked a great potential in the use of infrared science and its subsequent applications to cereal science from the 20th century [22,23,24,25] NIRS has been explored for the identification of mycotoxigenic fungi [26] and contaminated crops [27,28]. In crops like peanuts, near infrared wavelengths have been used to identify mycotoxigenic fungi with >94% classification accuracy [29]. This study with peanuts was conducted with grains completely colonised by the fungus. The fungal consumption would have resulting in substantial light scattering effects caused by reduced content within the grain matrix from extensive fungal feeding. Also, the classification of mould and toxin contaminations of figs have been achieved with 100% classification accuracy [26]. In this recent study on figs, it was suggested that the NIRS method of classification was safer and more efficient than the currently used ultraviolet (UV) light [26]. The UV and near infrared (NIR) hyperspectral imaging have also been successful in classification of contaminated maize with a similar accuracy of >90% achieved for both [30]. Contamination of maize with pure aflatoxin has also been demonstrated with >90% classification accuracy [20], and a similar observation was made with field kernels inoculated with aflatoxigenic Aspergillus [28]. In these instances, the levels of aflatoxin concentrations in the grains utilised reached 1000 ng/g (for surface contamination with pure aflatoxins) and 3800 ng/g (for field contamination with toxigenic A. flavus). These high levels of aflatoxin contamination were important for classification accuracy since these levels are not common in natural contamination and wavelength absorbance from low aflatoxin levels are easily masked by the compounds within the grain matrix. Furthermore, with surface contamination with pure aflatoxin, this is not the natural contamination method. Therefore, this model would have excluded naturally occurring biochemical and biological changes that occur with natural aflatoxin accumulation that could have influenced the spectral signals. In a study where aflatoxin contamination was induced by two aflatoxigenic species on almond kernels, species-specific aflatoxin contamination was differentiated by NIRS [31]. Moreover, within the same species of A. flavus, strain-specific classification has been demonstrated [32]. These studies demonstrated the ability of NIR to identify aflatoxin contamination and unique NIRS fingerprints of fungi. However, more studies are necessary to better understand how NIR can be used to detect grain changes that occur with natural aflatoxin contamination. Previous NIRS investigations have utilised maize grains at physiological maturity [28,33,34]. However, aflatoxin contamination precedes physiological maturity. In gene expression profiles, Reese et al. [35] identified that genes for amino acid transport, carbohydrate and protein metabolism were active during aflatoxin metabolism at different stages of grain maturity. Also, Dolezal et al. [36] identified expression of genes associated with starch metabolism and hexose mobilization genes during aflatoxin metabolism at different stages of crop maturity. These studies demonstrate that aflatoxin contamination occurs at different stages of grain maturity. However, the inclusion of maize grains of different maturities in NIRS models is sparse. This paper makes an important contribution to the understanding of NIRS for aflatoxin detection by using maize grains at different maturity levels of crop development. To our knowledge, this is the first report that utilises maize grains of different maturities in this manner for NIR modelling in aflatoxigenic Aspergillus spp. contamination of single maize kernels.

2. Materials and Methods

2.1. Maize Crop Development and Preparation of Kernels and Fungal Spore Suspensions

A white Zea mays (Linnaeus) variety, 33v62, (Pioneer Overseas Corporation, Johnston, IA, USA) was planted at a temperature-controlled glasshouse at the University of Queensland, St. Lucia, Brisbane, Australia. The average glasshouse temperature was 26.2 °C ± 4 °C. Seeds were planted in UQ23 potting media (University of Queensland, St. Lucia, Australia) comprising 70% composted pine bark and 30% coco peat and other augments. Basal fertilizer application was done with Osmocote® slow release fertilizer. Thirty-six plants were grown, corresponding to a 4 × 3 arrangement for dose × stage of crop development, respectively, in three replications. Five detached kernels were used for each replication unit, bringing the total number of experimental samples (kernels) to 180. Stages of crop development used were milk (R3), dough (R4) and dent (R5) stages [37]. At the different stages of maturity, cobs were detached from the plants. Uniformly aged kernels were detached by carefully removing kernels between 10 and 20 rows from the bottom of the cob quickly and placed on ice to limit physiological alterations. Detached kernels were lyophilised using a freeze drier custom built by CSK Climatek (Brisbane, Australia) at vacuum of 10−1 to 10−2 atm following the manufacturer’s instructions. Lyophilization was done to reduce physiological modifications that could occur in vitro.
Fungal spores used for inoculation were from a strain of aflatoxigenic Aspergillus parasiticus (Speare) isolate (F75) available at the Queensland Department of Agriculture and Fisheries laboratory culture collection (QDAF, Brisbane, Australia). Fungal spore suspensions were prepared for grain inoculations by dispensing 8 μL of F75 from the agar-plug stores in sterile water. The spores were dispensed in the centre of 5 cm petri dishes containing V8 juice media. Inoculated petri dishes were incubated unilluminated at 25 °C for 5 days. At the end of the incubation period, fungal spores were gently rinsed off the surface of the agar plate with 0.1% Tween 80 solution. Fungal doses: control, low, medium, high were prepared. The control, low, medium and high fungal doses were achieved by rinsing spores from none, one, four and sixteen 5-cm petri dishes (respectively) into 9 mL of 0.1% sterile Tween 80 solution. These qualitative dose levels were used for assessment as spore concentrations were not determined quantitatively.
Lyophilised detached kernels were surface-sterilized with 70% alcohol and rinsed in three changes of sterile distilled water. Each experimental unit was a kernel. Five kernels in each experimental unit served as replicates. Kernel inoculation was conducted by completely immersing five surface-sterilized maize grains into the 9 mL suspension of the respective doses for 1 min. After the 1 min contact time, the kernels were placed (without surface contact with each other) in sterile (9 cm) petri dishes. Petri dishes were completely randomized in the incubator where they were incubated unilluminated at 25 °C for 72 h. After incubation, kernels were lyophilised again to halt post-incubation physiological changes to the kernels.

2.2. Near Infrared Spectral Data from Maize Kernels and Treatment of Spectral Data

The NIR spectral information was collected from the lyophilized kernels prior to grain colonisation and after grain colonisation. Individual kernels were scanned using the Bruker MPA (MPA Spectrometer, Bruker Optics, Ettlingen, Germany) and absorbance readings generated by the instrument were used. A choice was made to use absorbance values rather than transmission because previous studies with single kernel analysis suggest that transmission optics is less preferred for single kernels because of noise signals generated [38,39]. Single kernels were placed in 20-mm vials with stopper supplied by Bruker used to block external light interference [40]. The Fourier transformed data provided information at averaged 64 scans (equipment generated). Spectral data was at increments of 8 cm−1 (an equivalent of 0.5 nm). Spectral absorbance of single kernels was measured in wavenumbers corresponding to wavelengths between 800 and 2700 nm. Due to a spike of absorbance at the higher wavelengths, 100 nm was truncated and wavelengths up to 2600 nm were used. Kernels were scanned in germ-up and germ-down orientations—with the germ-up orientation having the endosperm directly facing the detector and the germ-down orientation having the germ directly facing the detector. Averaged spectral data from both were used for data analysis to ensure that kernel orientation therefore did not unduly influence the model.
Spectral data was exported from the Bruker MPA into Unscrambler 10.3 for spectral analyses. Unsupervised exploratory analysis via principal component analysis (PCA) was done. Categorical variables were sample categories defined for stage (milk, dough and dent), dose (control, low, medium and high) and stage-dose. Model inputs for PCA were non-linear iterative partial least squares (NIPALS) algorithm with equal weights assigned to the variable and sample inputs. Data was mean centred and outliers were identified in random cross-validation. Hotelling T2 was set at 5% to define a confidence limit of 95% in the PC scores plot and for outlier identification [41]. Selected outliers were confirmed from line and influence plots and removed from the data set for subsequent analysis. Data pre-treatment was conducted using Savitzky-Golay first derivative (1d-SG) transformation and multiplicative scatter correction (MSC) in Unscrambler. A single wavelength for modelling was investigated using the multiple linear regression feature in Unscrambler prior to spectral pre-processing. Class requirements were determined as control or inoculation and binary values of 1 and 0 were assigned for groups that met and did not meet class requirements, respectively. Global model characteristics were used to identify the most suitable model at p ≤ 0.05 and the line of fit was observed for model fitness by comparing the closeness of the calibration and validation lines to the target line. This detection of single wavelength might be important for applications with laser technologies or machinery with LED devices that utilise single wavelengths rather than a spectrum of wavelengths.

3. Results

The silk (R1), blister (R2), milk (R3), dough (R4) and dent (R5) stages of crop development were reached at 68, 76, 90, 97 and 105 days after planting, respectively. From visual observation, the milk-stage kernels were smaller than the dough- and dent-stage kernels that were of similar sizes. Of the total 180 kernels, five outliers were identified and excluded from the model to avoid undue influence on the model.

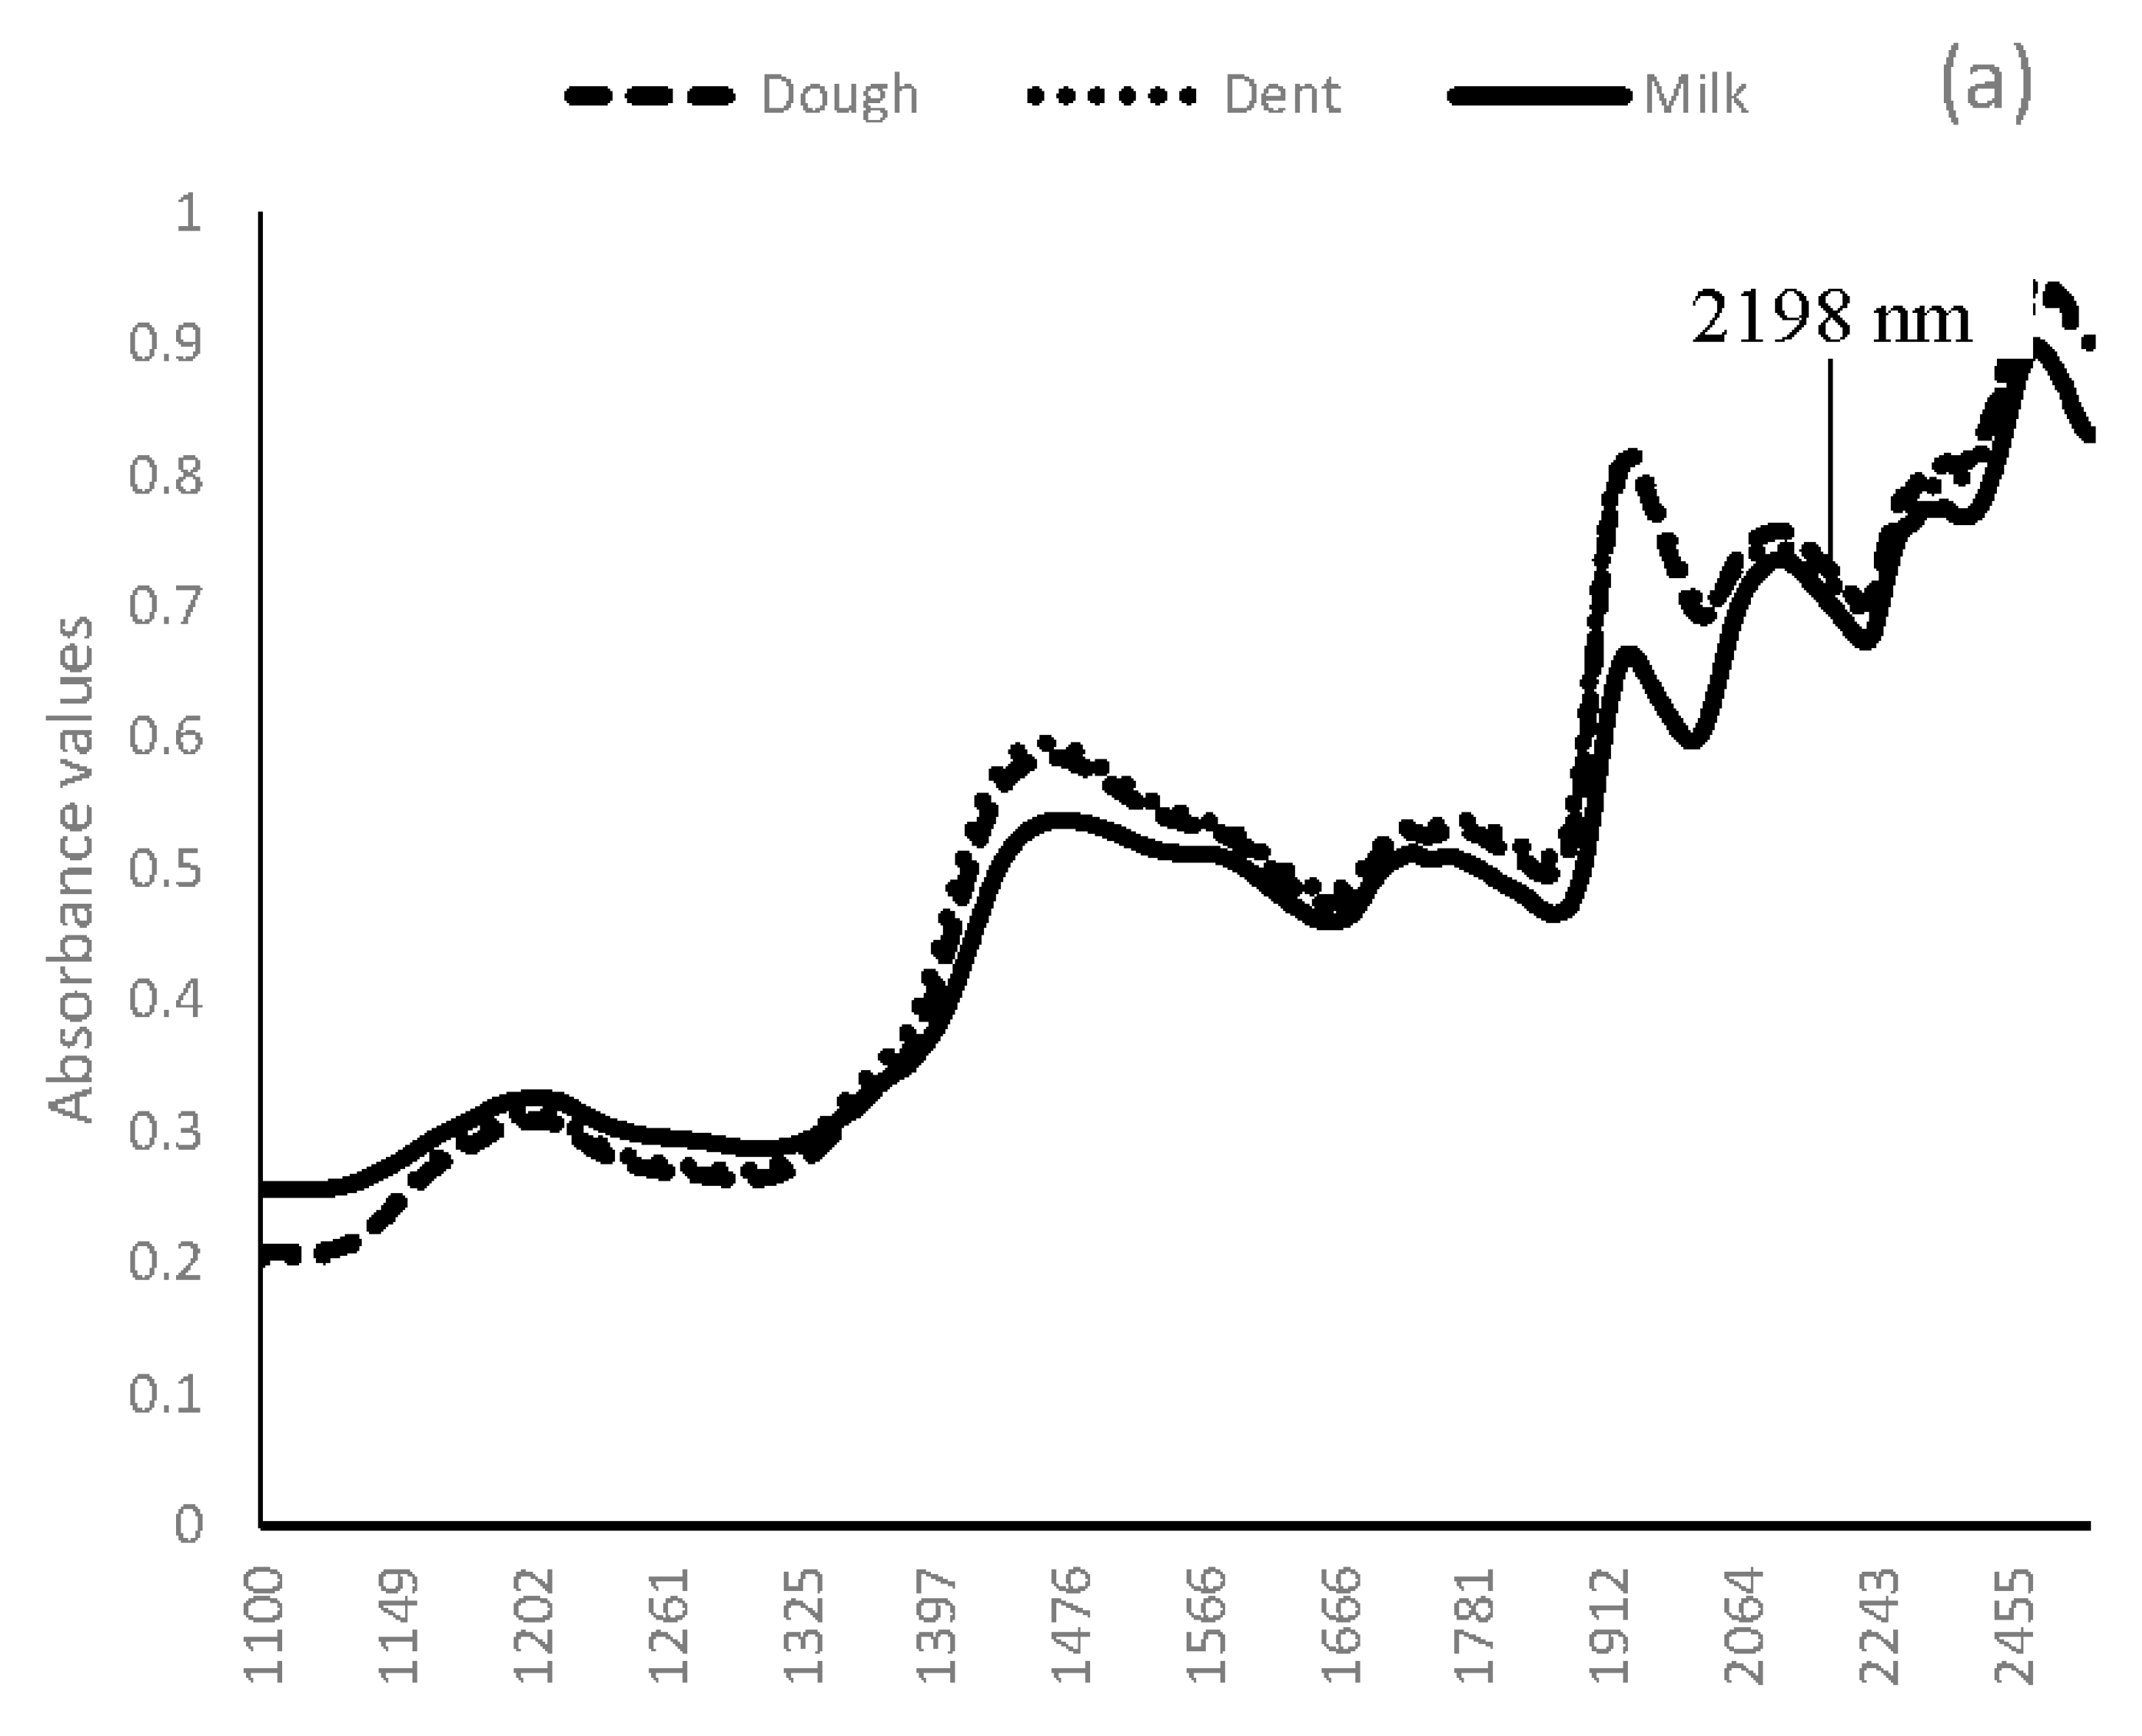
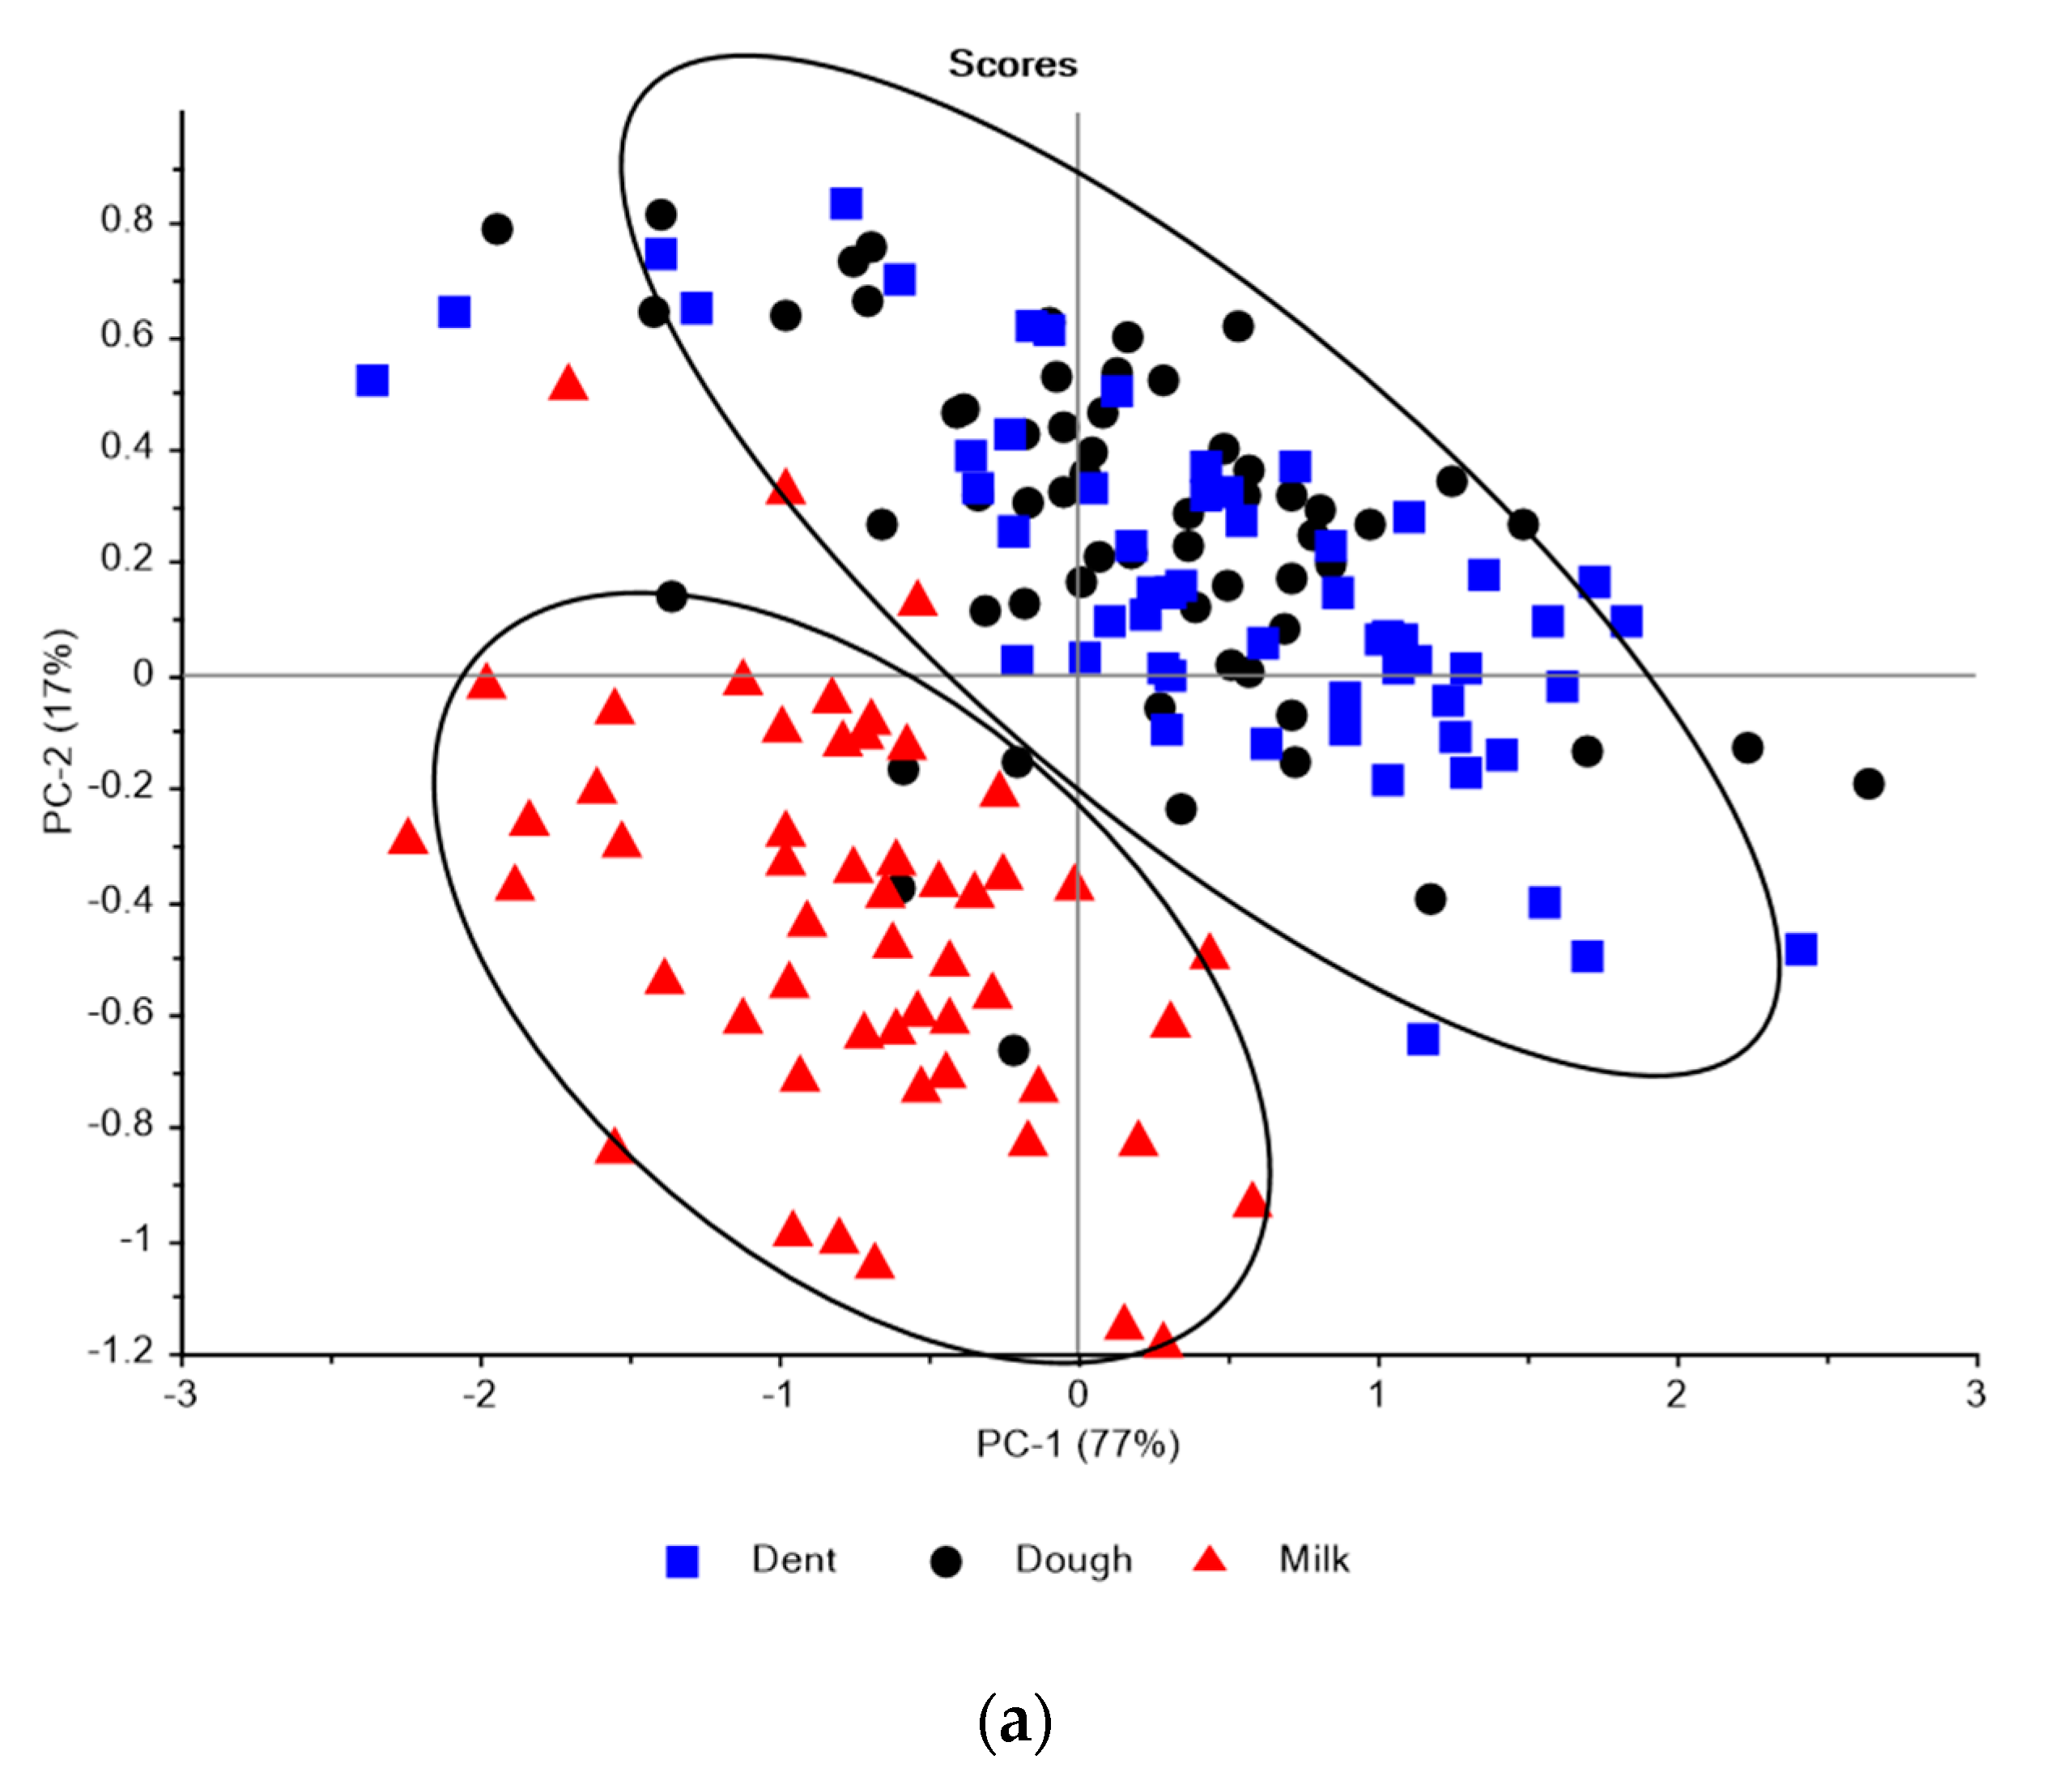
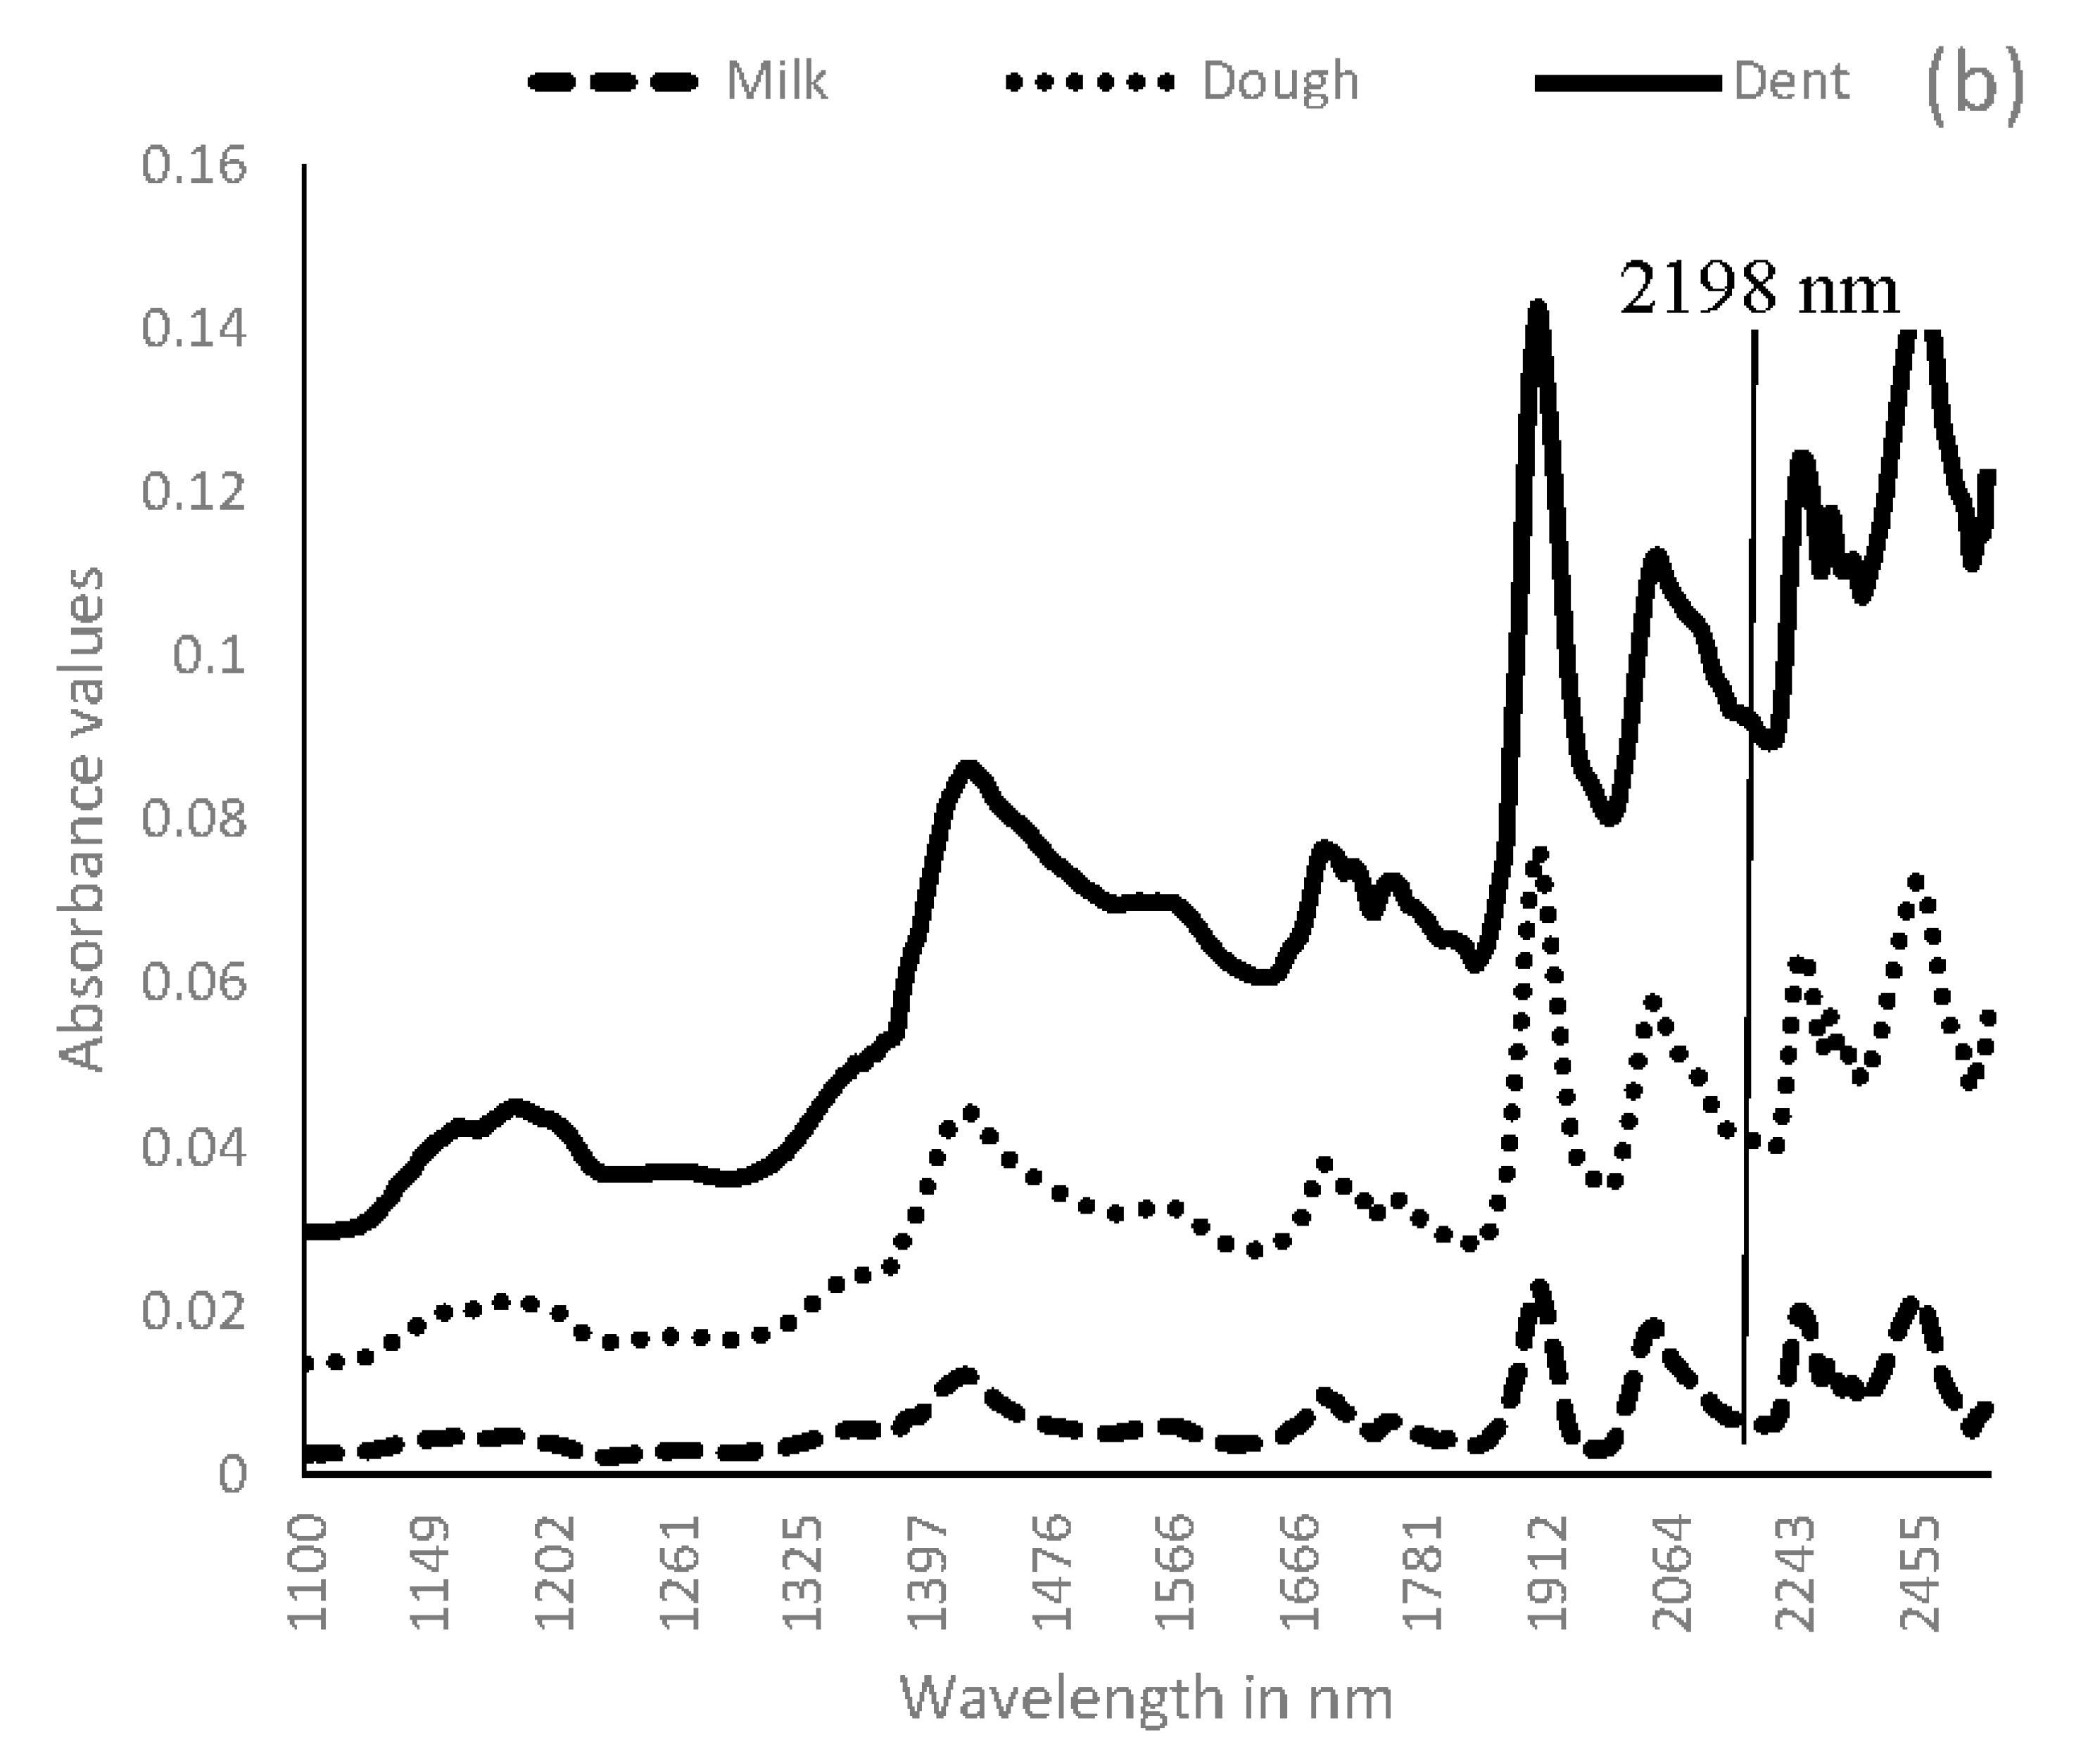
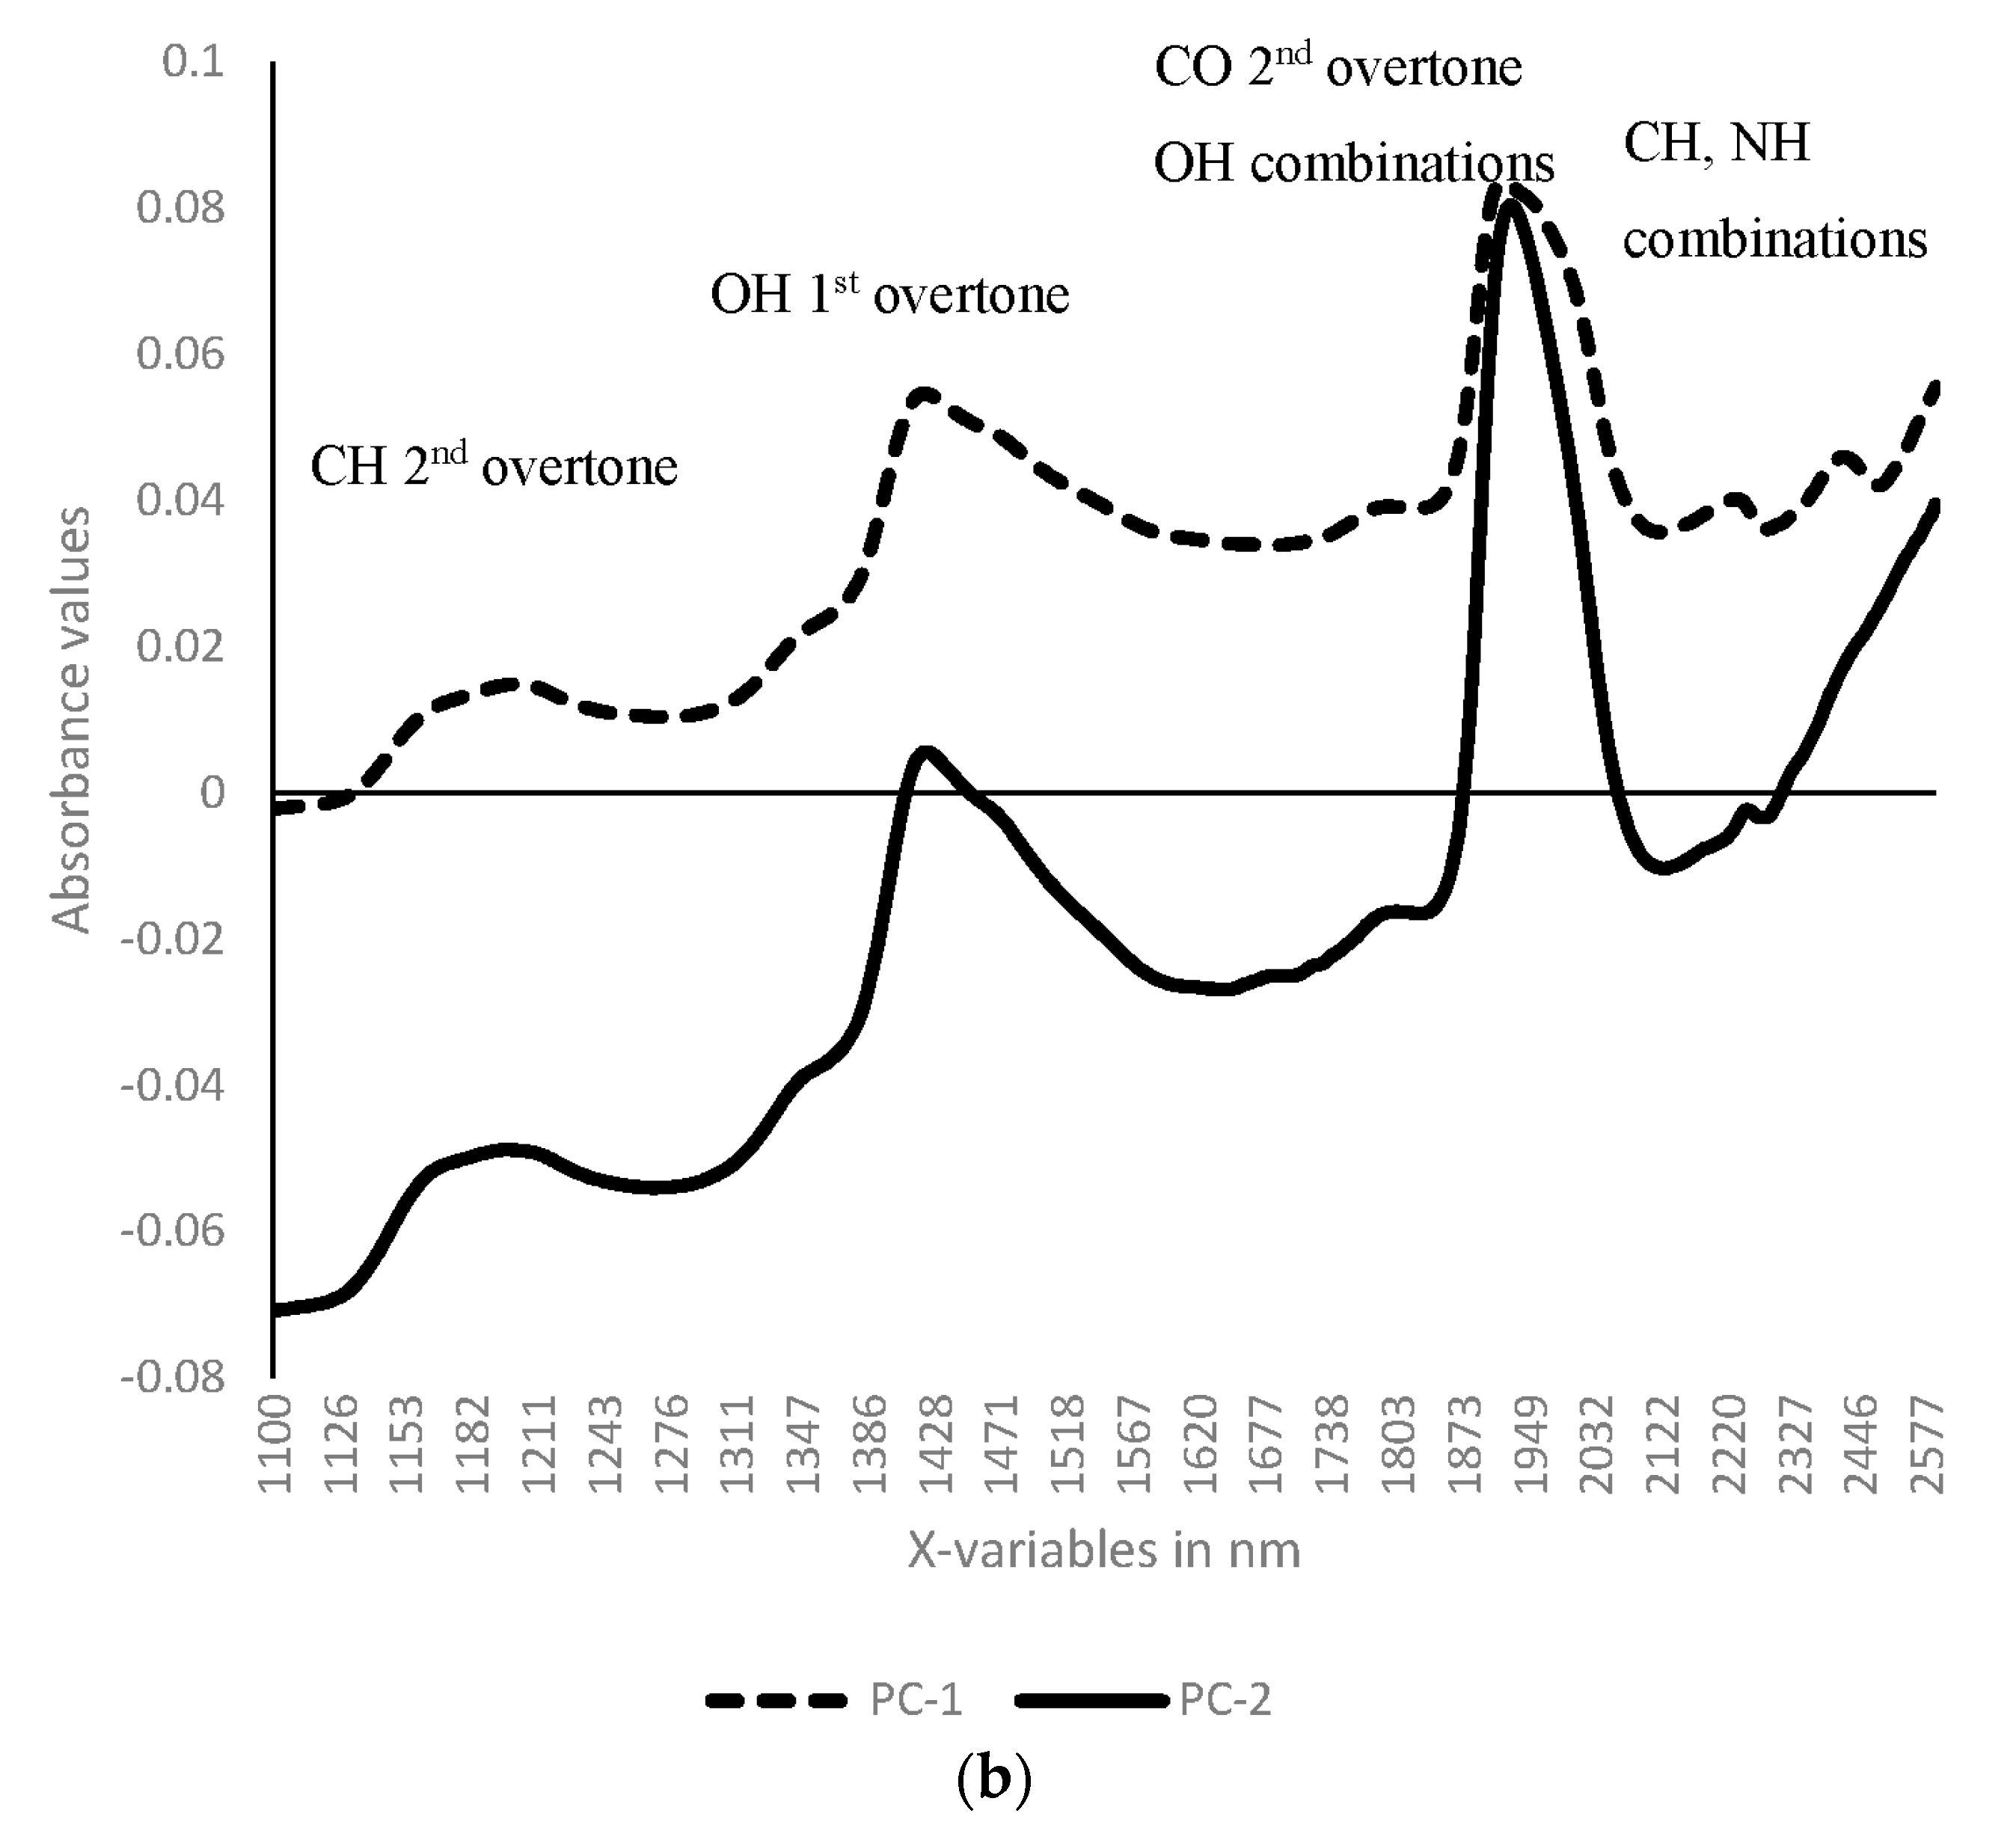
3.1. Near Infrared Spectral Data from Maize Kernels Prior to Fungal Inoculation

Generally, NIR spectral patterns for the milk, dough and dent stage kernels were identical prior to grain inoculation, but varying in absorbance intensities (Figure 1). Raw spectral data showed milk stage was distinct from the dough and dent samples which were overlapping in the line plot before spectral treatment (Figure 1a). After spectral pre-treatment by 1d-SG + MSC, the differences in spectral absorbance were more distinct (Figure 1b). The 1400 nm and 1940 nm peaks are associated with wavelength absorbance in the second overtone and first overtone regions, respectively. These peaks are typically associated with water. However wavelengths around this region have also been associated with water carbohydrate-associated changes caused by fungal deterioration by Fusarium sp. [42]
Similar to the observation with the line plot before spectral pre-treatment, in the PCA scores plot, the proximity of the dough and dent stage kernels was observed (Figure 2). The first two principal components (PC1 (77%), PC2 (17%)) explained most of the variation in the raw spectral dataset. Loading plots (Figure 2b) identified CH (2nd overtone, combinations), OH (1st overtone, combinations), NH (combinations) and C=O (2nd overtone) functional group vibrations as important for clustering.
Data pre-processing using 1d-SG analysis (using five smoothing points), followed by MSC improved separation of the dough and dent samples in the line plot (Figure 1b) and PC clusters (Figure 3). Also, a V-shaped cluster pattern indicative of the time influence [41] was observable after data pre-processing (Figure 3). This earlier hidden spectral feature in the raw data was revealed in the transformed data. Most of the variation was explained by the first two principal components, PC1 (93%) and PC2 (3%). Separation of the dough and dent stages occurred more along the PC2 axis, whereas the milk stage separation from both groups was more along the PC1 axis.

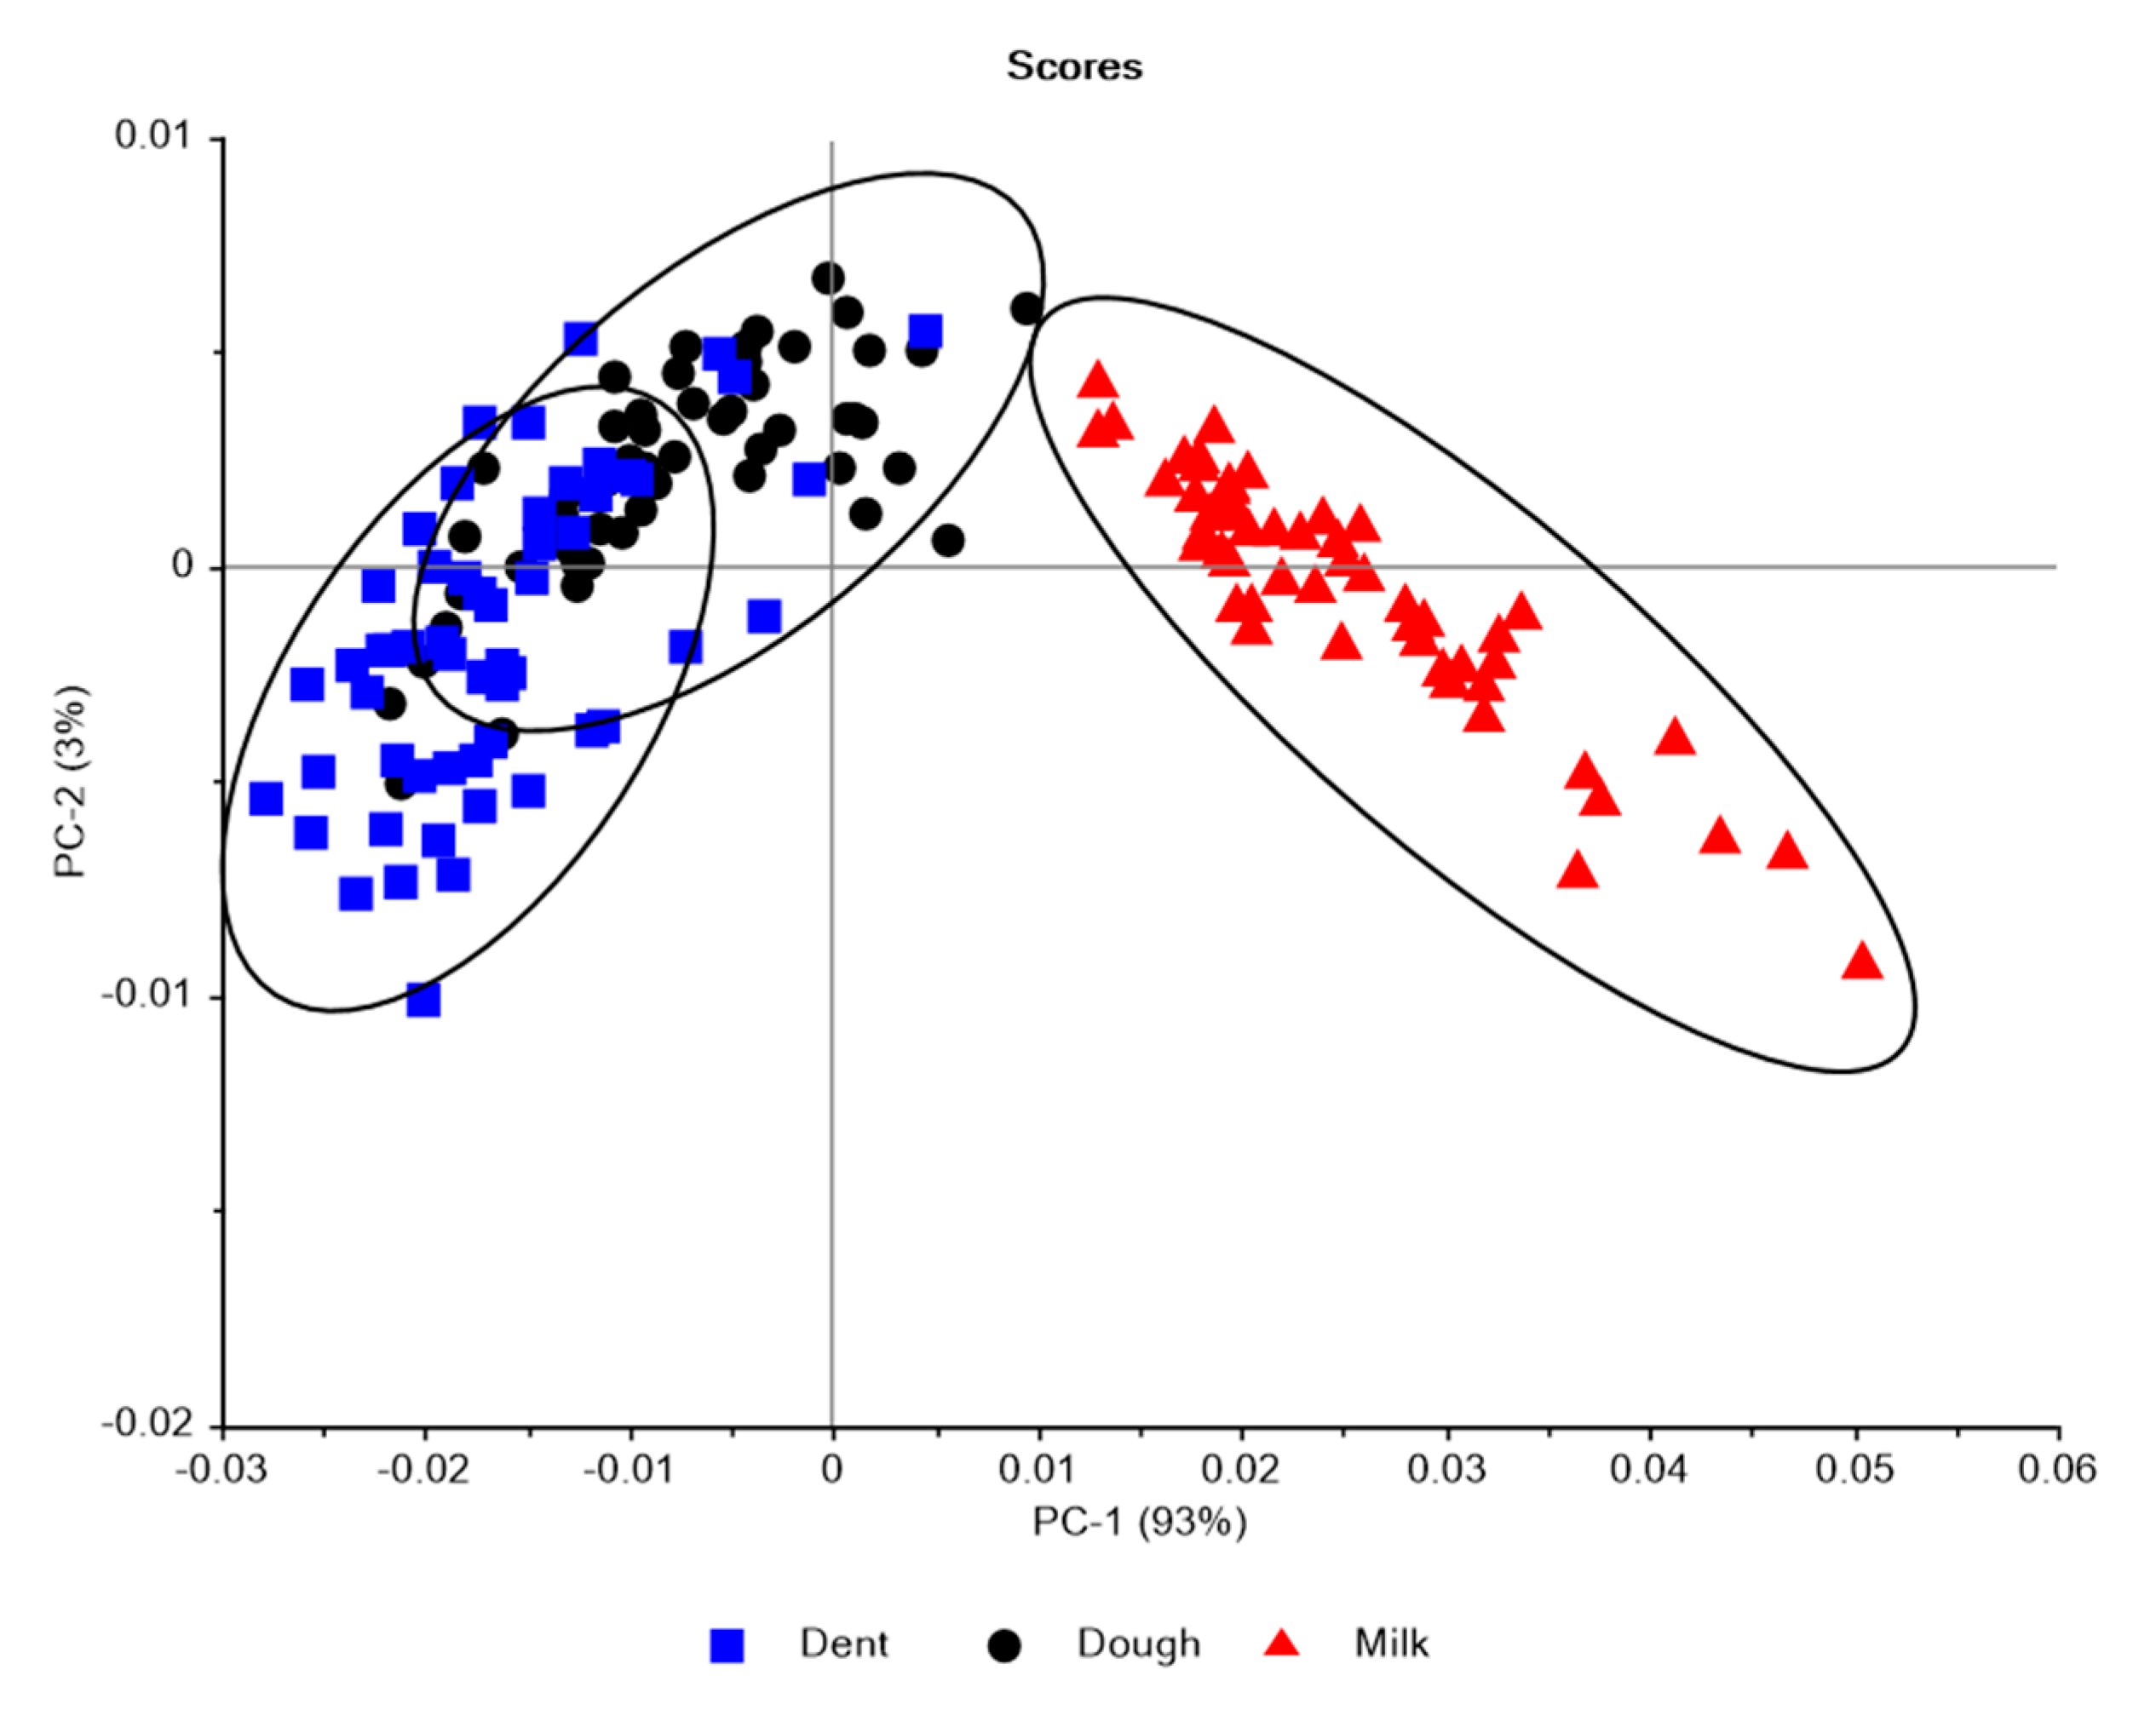
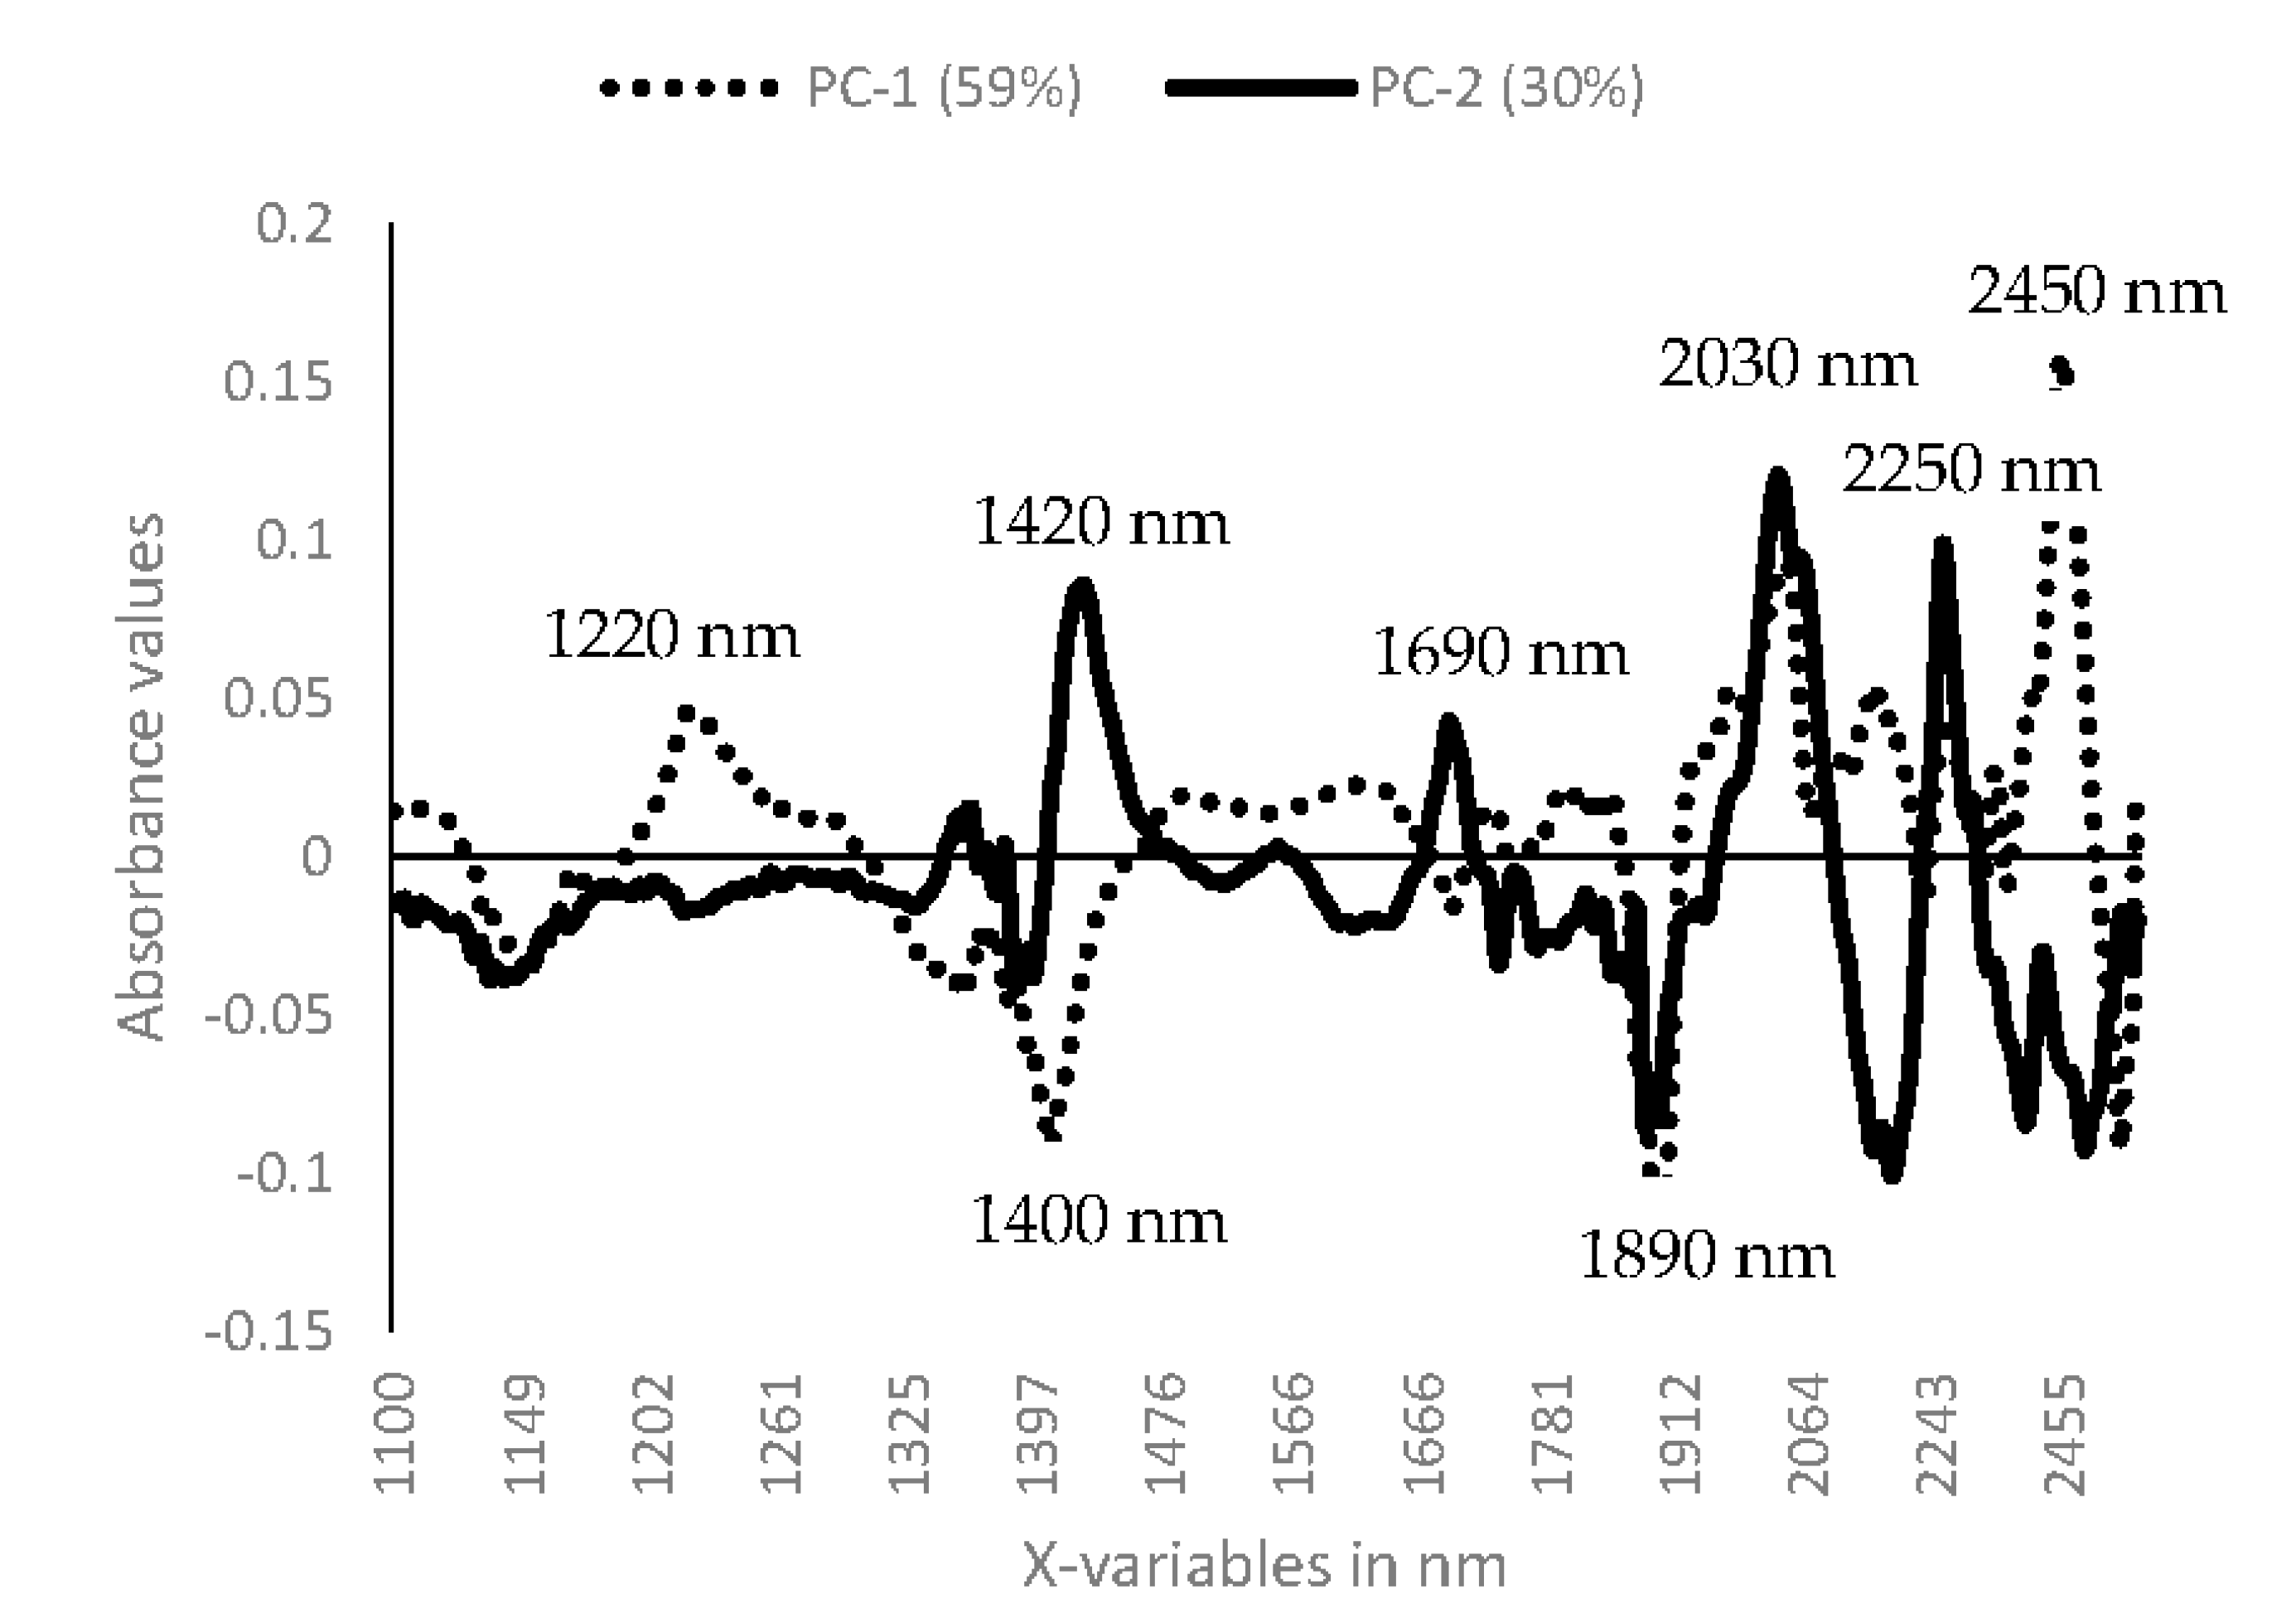
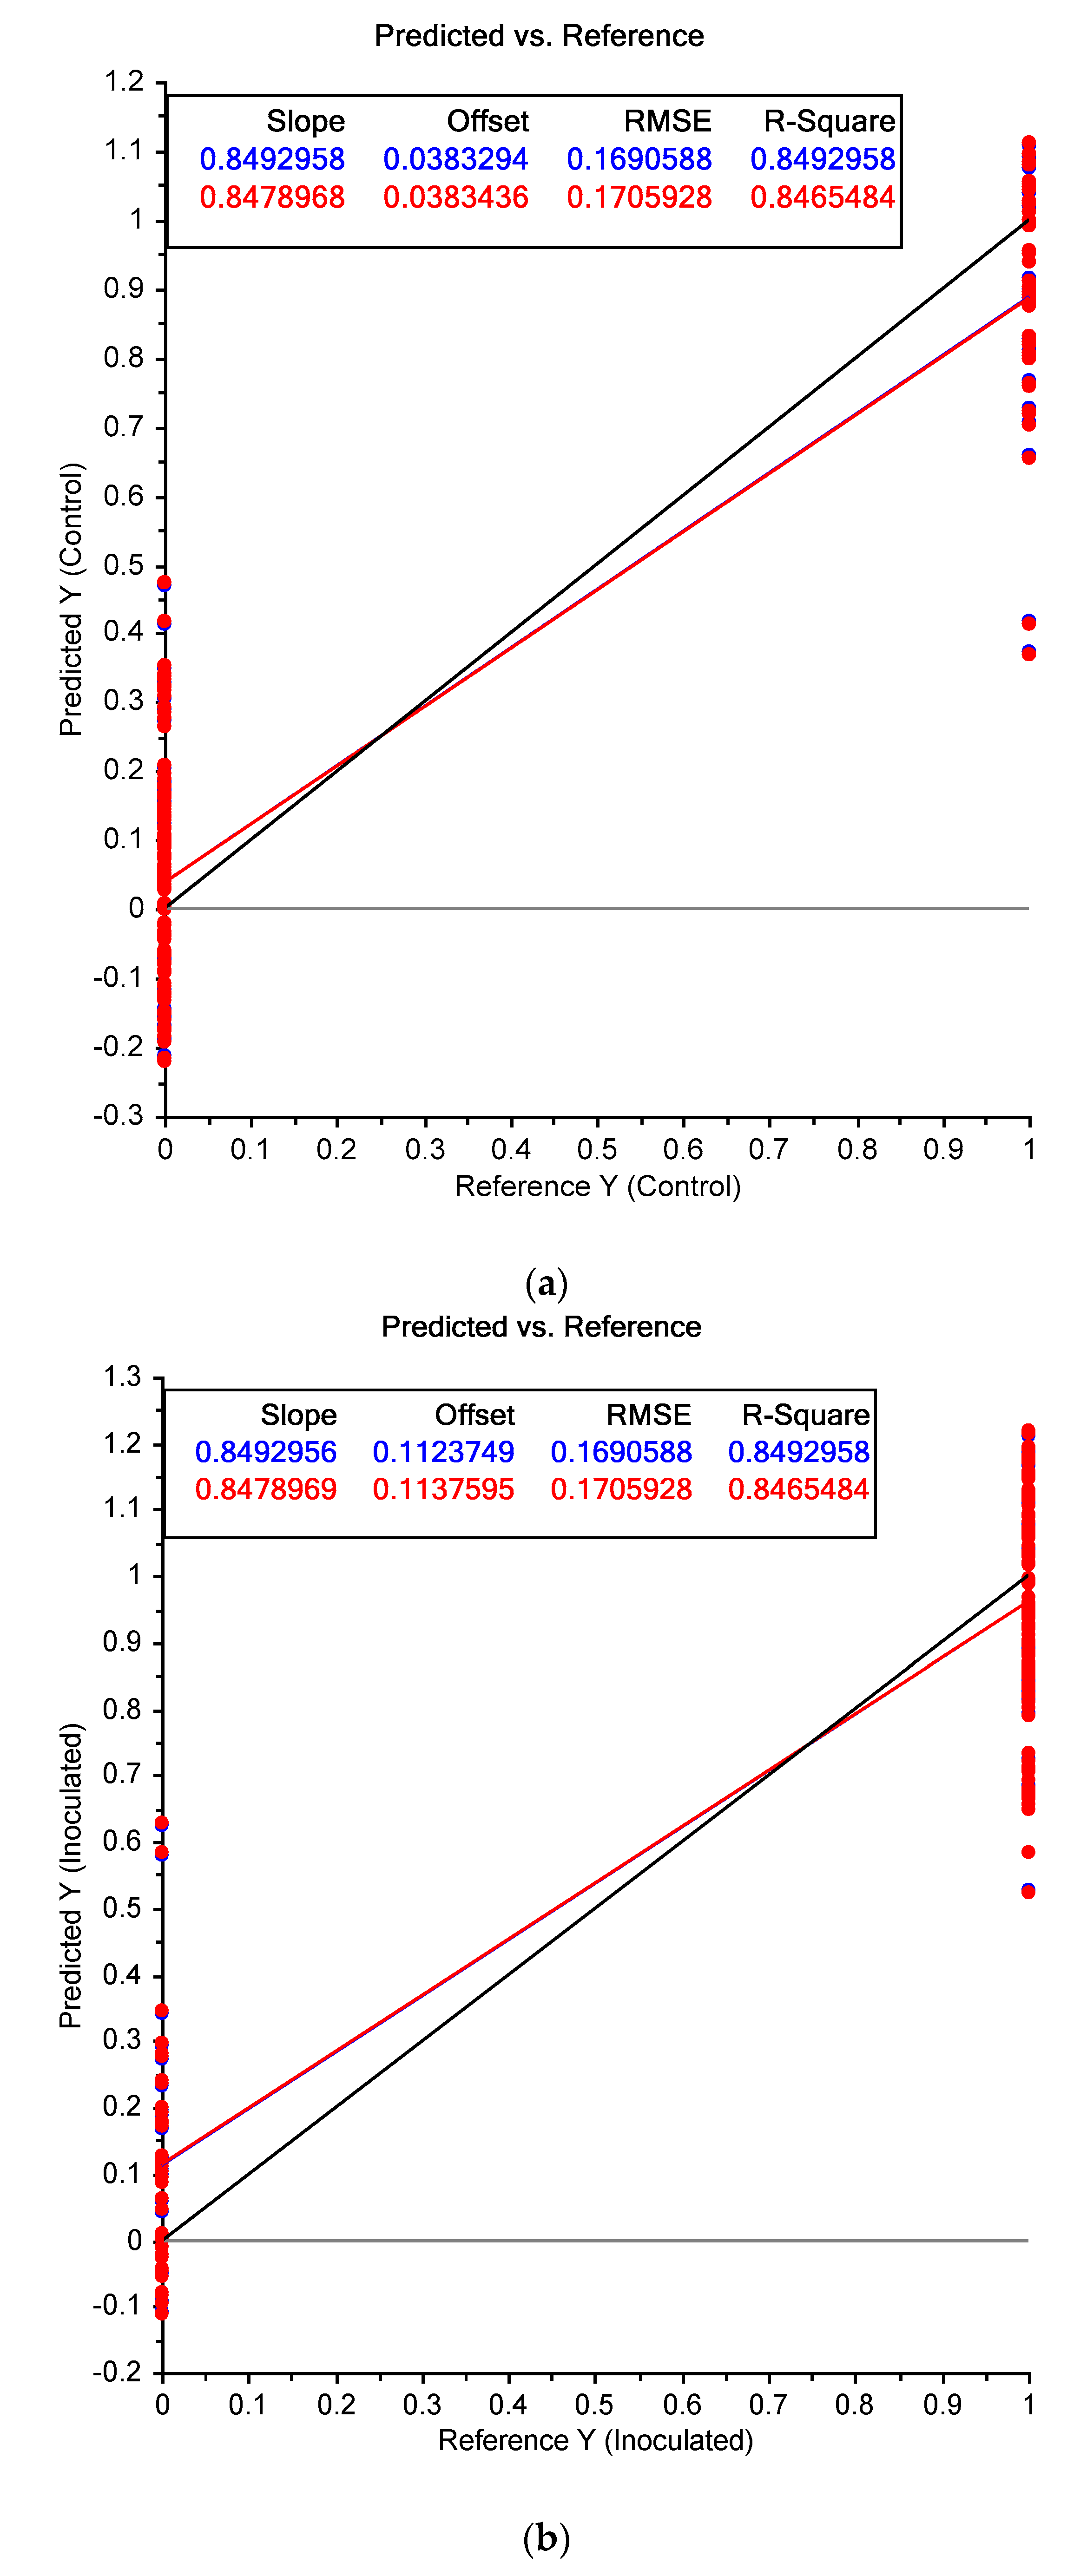
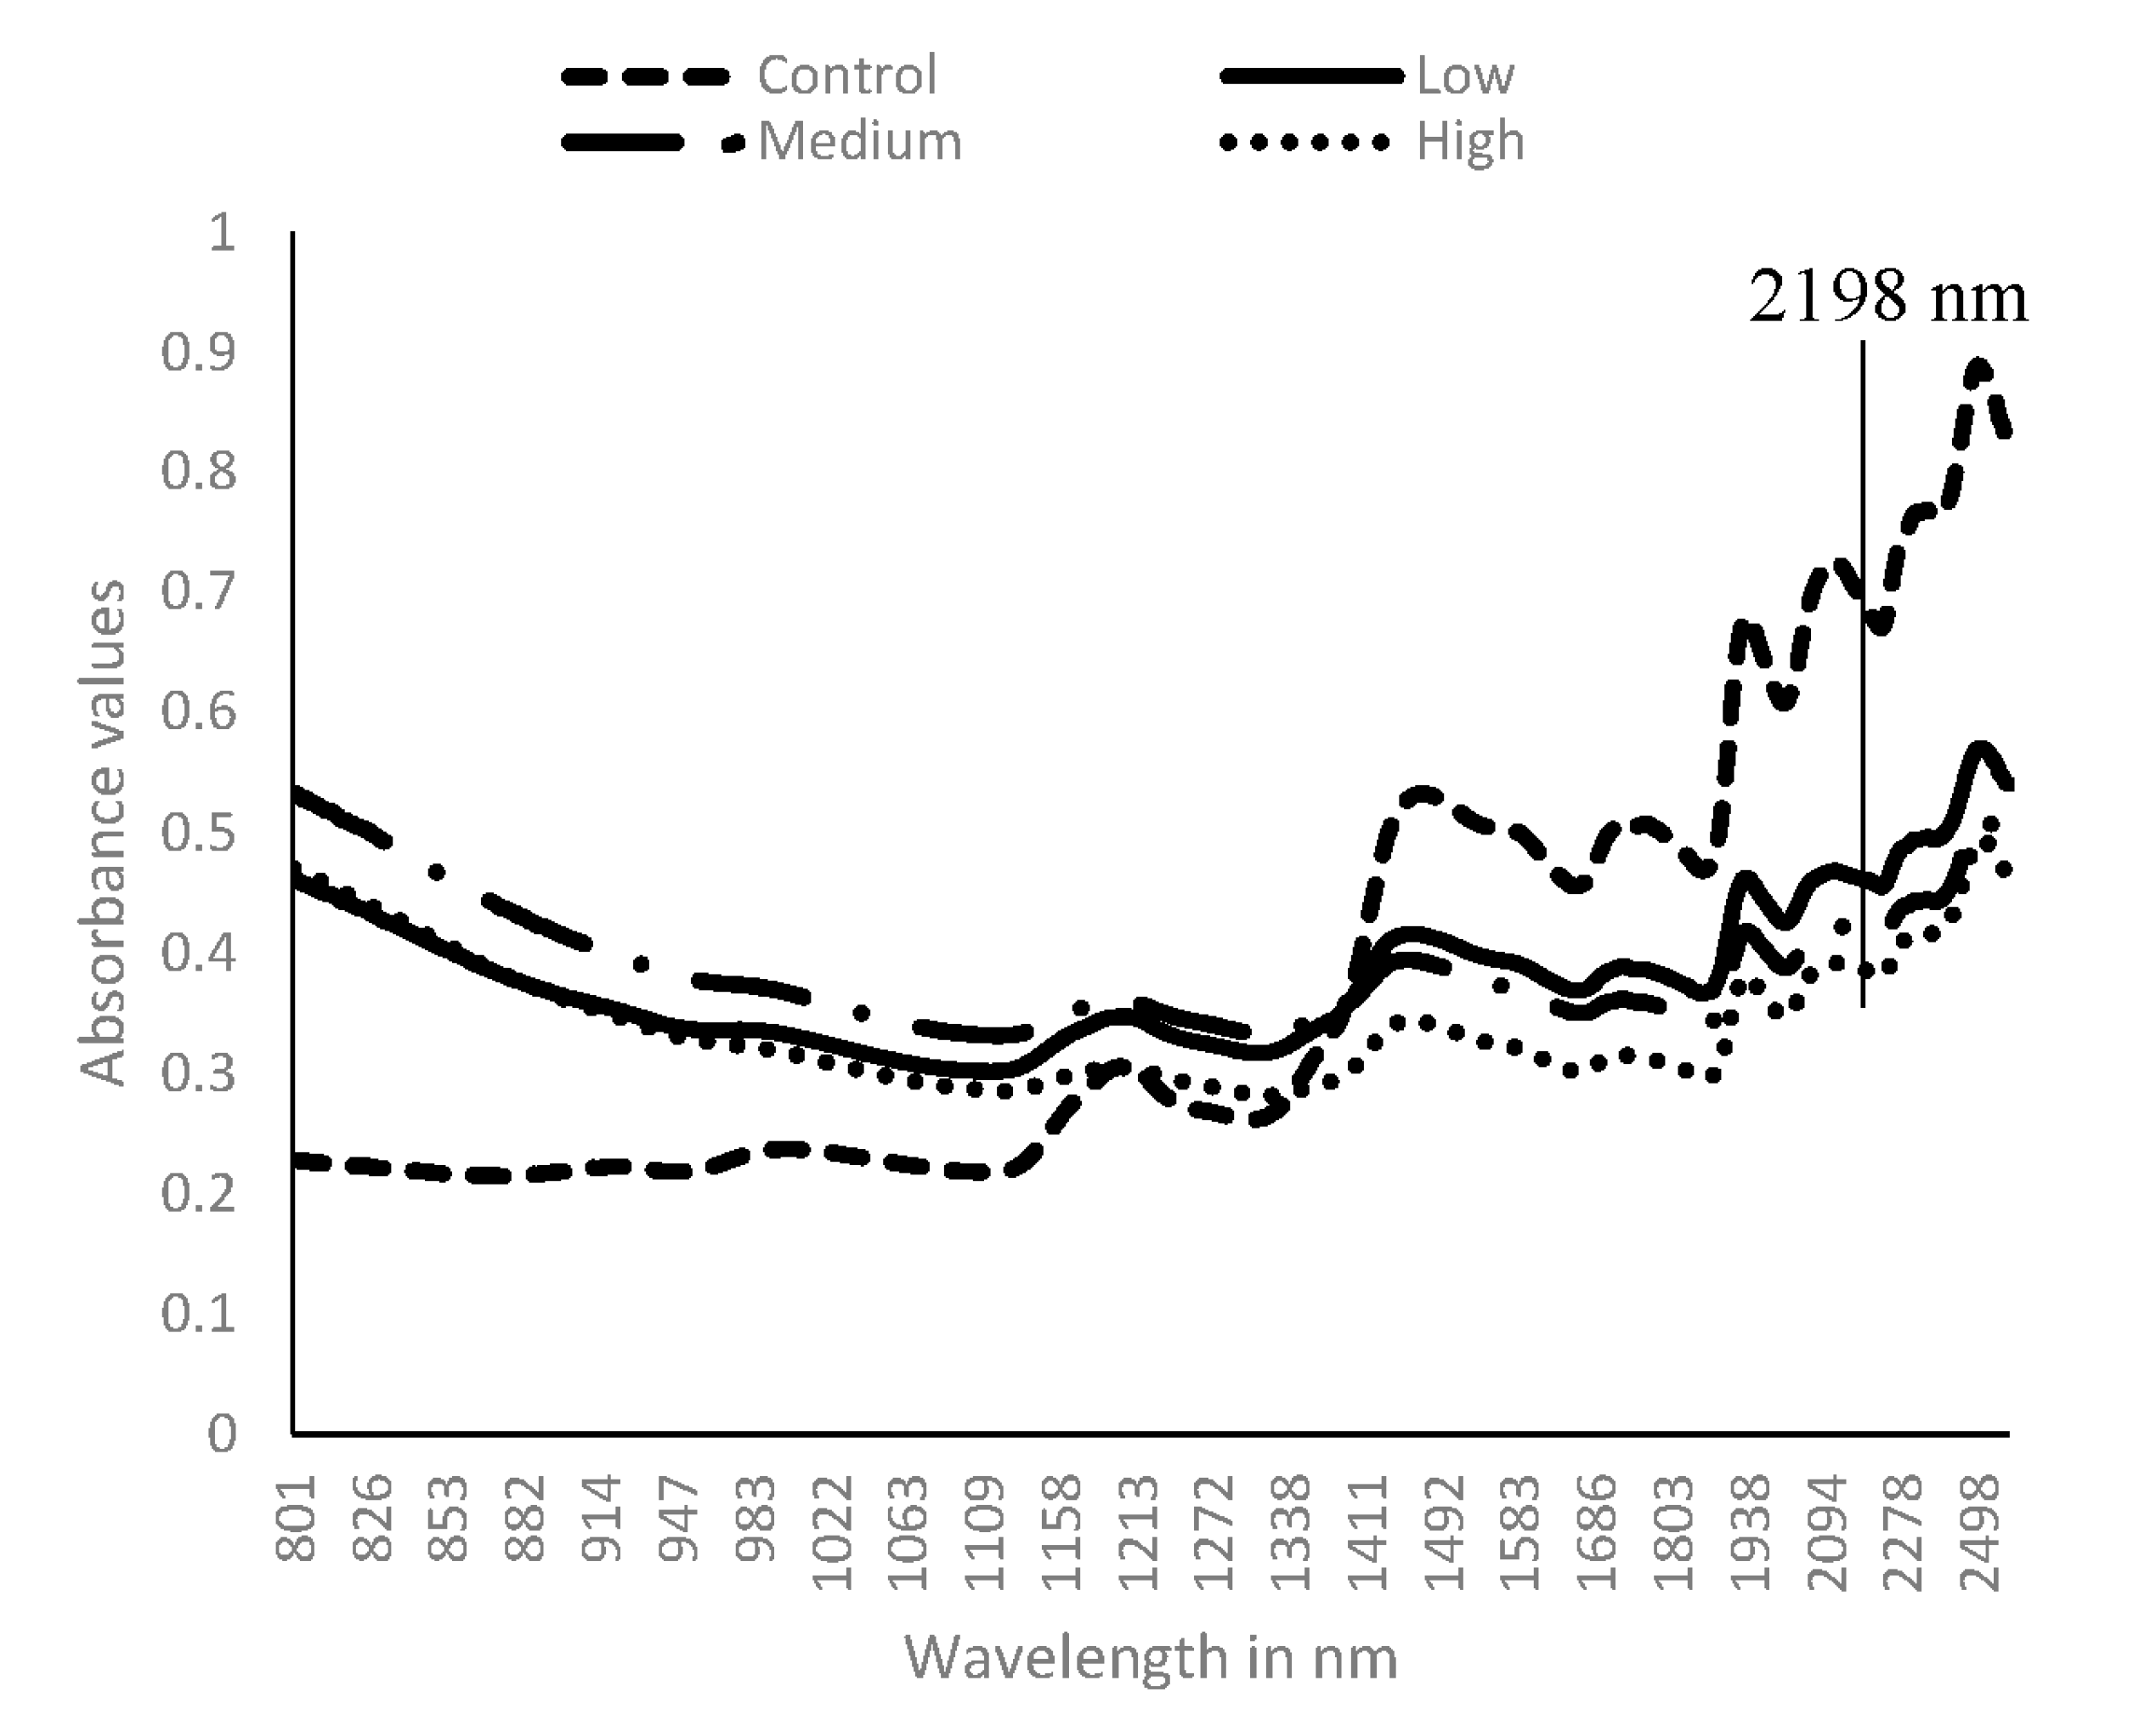
3.2. Near Infrared Spectral Data from Maize Kernels after Fungal Inoculation

The line plot revealed an observable divergence in the absorbance of NIR spectra by control and inoculated samples in spectral patterns (Figure 4). It was observed that between 800 and 1134 nm, spectral absorbance increased in inoculated samples relative to control samples. Conversely, there was generally higher absorbance of NIR wavelengths by the control samples compared to the inoculated kernels from around 1400 nm (Figure 4). This pattern was consistent regardless of the growth stage with dosage as the main effect. The lower absorbance values with contaminated are indicative of higher scattering effects in caused by changes in the grain matrices during fungal growth.
The PCA score plot revealed two main clusters—Cluster A and Cluster B (Figure 5). Cluster A comprised the inoculated while Cluster B was the control samples. Within Cluster A, the data points for the dough stage samples were seen interspersed between milk and dent stages. A similar observation was made within Cluster B. The PC1 and PC2 accounted for most of the variation of 85% and 14%, respectively. A separation of samples according to dose in Cluster A was also observed. Using a line to represent the separation, many low-dosed samples occurring to the right of the line, many high-dosed samples occurring to the left of the line and medium-dosed samples which interspersed along the centre (Figure 5) were noted. With increased fungal deterioration of the grains, the spectral data of dough samples bore close similarity to milk kernels, suggesting compositional similarity.
Pre-processing of data by 1d-SG + MSC highlighted the peak signals at specific wavelengths without loss of spectral definition. The PC1 accounted for 59% of the variation, while PC2 accounted for 30% of variation in the data (Figure 6). Data points from low-dosed dough samples were proximate to high-dosed dent kernels. Peaks associated with the variation in PC1 and PC2 were around 1220, 1400, 1420, 1690, 1890, 2030, 2250 and 2450 nm as shown in the PC loading plots (Figure 6).
In seeking a single wavelength model, 2198 nm was identified as superior for classification into control and inoculated classes using raw data. Model classification of wavelength absorbance at 2198 nm placed samples into ‘1’ or ‘0’ depending on absorbance values satisfying or failing to satisfy class requirements, respectively, for both control and inoculated classes. At p value < 0.0001 for the global regression model, R2 = 0.88, (root mean square error = 0.15). This indicated a low error, high coefficient of determination (R2). From the plots of predicted values against the reference values, a good line of fit was achieved (Figure 7) and was close to the target line. The single wavelength model was attempted with the four-dose classification of control, low, medium and high doses but was weak and did not provide good model properties (not presented). The physical or chemical basis for this wavelength in the samples suggest changes in amino acid content within the grains, as this wavelength is associated with absorbance by N–H bonds in the combination band region.

4. Discussion

This study agrees with the findings of others that NIRS is useful for the separation of crops contaminated by aflatoxigenic strains of Aspergillus [33,43]. The separation of the milk stage from the dough and dent stage kernels observed could be attributed to the difference in path length within the grain; this is associated with presentation effects due to its smaller size [44] and difference in chemical compositional properties [38,45]. By applying spectral pre-treatment, the variation due to particle size was thus corrected [46], and a clearer separation of the maturity stages, including the dough- and dent-stage kernels, were observed (Figure 1b and Figure 3). This demonstrated that the spectral pre-treatment corrected for the differences due to path length alone and highlighted the differences in chemical composition [44,47]. The accumulation of free amino acids are reported in the less mature kernels compared to the more mature kernels [36,48]. Also, there is increased starch accumulation as the kernels mature [49,50]. However, the milk stage kernels being more separated from the dough and dent stage kernels (Figure 3) indicated the latent variables along PC1 were more related to the milk stage kernels than the dough- and dent-stage kernels. It is possible that PC1 characteristics are likely inclusive of absolute absorbance by chemical constituents. Changes in PC2 may be related to the accumulation of starch in the more matured dent kernels and less in the dough stage kernels and other compositional changes related to changes in carbohydrate, protein and lipid content associated with changes in grain maturity.
The changes associated with the dose variations suggest that the increase in absorbance with dose at wavelengths preceding 1400 nm are due to an increase in functional group vibrations in the third overtone region of NIR vibrations. The decrease in absorbance intensity after inoculation from 1400 nm suggested a depletion in grain constituents, corresponding to decrease in the functional group vibrations after sample inoculations. The wavelengths in the region beyond 1400 nm corresponded to the first overtone, second overtone and combination band regions. The high peak intensities in the first and second overtone regions were related to the CH, OH, NH and CO functional groups. The separation in absorbance was most distinct in the combination bands region due to NH combinations, NH + OH combinations, CH + CH combinations and CH + CC combinations. This suggests important changes in this region of the spectral data (Figure 4). These wavelength regions, as reported by others in aflatoxin contamination [26,43], are associated with changes in the macromolecules of the maize grains including starch and proteins and the fungal structures [51].
The proximity of the data points the high-dosed dough samples to the milk kernels (not shown) suggests that the expected depletion of the grain nutrients in the inoculated dough stage samples could have resulted in an inclination towards compositional similarity with the milk-stage samples. This may be due to an increase in the sugar content as the fungus increased amylase activity and catabolised complex carbohydrates [36]. Similarly, the minimal catabolism of the dough samples were close in features to the dent stage samples. These attested to the validity of the global model demonstrating that modelling did not occur by random variation.
The correlation coefficient (r) was 0.92 and R2 was 0.85 for both control and inoculation groups. This indicated the model was able to separate samples into both groups with good accuracy. With this model, the offset of control kernels was slightly improved at 0.03 over the inoculated kernels (at 0.11) and fit more closely to the target line (Figure 7). It would have been valuable to assess the fungal load after spectral collection for each kernel. However, as the same individual kernels were to be used in a separate experiment requiring different sample processing techniques, this was impracticable for this experiment. In the future, it would be useful to collect information on fungal load at the different doses by determining the colony forming units or quantitative PCR. However, the calibrations in this model indicated wavelengths relevant for deterioration of maturing kernel, and thus suggested spectral regions of interest in future calibrations and for additional investigations.

5. Conclusions

The reported study has highlighted functional group changes that occur with grain maturities detected by NIRS, including time-lapse changes that may be latent in spectral data prior to spectral processing. Also, non-invasive separation of maize kernels was possible via NIRS-chemometric techniques. Additionally, using single-wavelength regression modelling, the potential of single wavelength calibrations was demonstrated. This study has provided for the first time, information of NIR spectral behaviours in maize kernels of a single variety at different stages of crop maturity pre- and post-inoculation with aflatoxigenic fungi. Additionally, for the first time, a single wavelength model that was useful for the classification of control and inoculated single kernel maize samples has been reported. The insights from this study would provide increased information on the NIR spectral attributes in maize-Aspergillus relationships in maturing grains. There is potential for model improvement with more factors, including field contaminated kernels of different maturity stages and diverse varieties to be included in the model.

Acknowledgments

The authors acknowledge funding provided by Department of Foreign Affairs and Trade, Australian Government (DFAT) funding of the Capacity and Action for Aflatoxin reduction in Eastern Africa (CAAREA) Project as part of the DFAT-Commonwealth Scientific and Industrial Research Organisation (CSIRO), Africa Food Security Initiative [grant 57685] and to the Nigerian and Australian governments for the PhD scholarship support provided to TF through the Australia Awards scholarship. The seeds used for this experiment were provided by Pioneer Corporation are graciously acknowledged. The authors are also grateful to Andrew Cusack, Dennis Webber and Margaret Currie and Michael Gravel, Queensland Department of Agriculture and Fisheries (QDAF) for their technical support.

Author Contributions

T.F. and G.F. conceived and designed the experiments; T.F. performed the experiments, analyzed the data and wrote the paper; Y.S., M.F. and G.F. contributed reagents/materials/analysis tools and edited the paper.

Conflicts of Interest

The authors declare no conflict of interest. The founding sponsors had no role in the design of the study; in the collection, analyses, or interpretation of data; in the writing of the manuscript, and in the decision to publish the results.

References

  1. Smith, R.H.; McKernan, W. Hepatotoxic action of chromatographically separated fractions of Aspergillus flavus extracts. Nature 1962, 195, 1301–1303. [Google Scholar] [CrossRef] [PubMed]
  2. Martins, L.M.; Sant’Ana, A.S.; Fungaro, M.H. P.; Silva, J.J.; do Nascimento, M.D.S.; Frisvad, J.C.; Taniwaki, M.H. The biodiversity of Aspergillus section Flavi and aflatoxins in the Brazilian peanut production chain. Food Res. Int. 2017, 94, 101–107. [Google Scholar] [CrossRef] [PubMed]
  3. Krishnamachari, K.; Nagarajan, V.; Bhat, R.; Tilak, T. Hepatitis due to aflatoxicosis: An outbreak in western India. Lancet 1975, 305, 1061–1063. [Google Scholar] [CrossRef]
  4. Centers for Disease Control and Prevention (CDC). Outbreak of aflatoxin poisoning—Eastern and central provinces, Kenya, January to July 2004. Morb. Mortal. Wkly. Rep. 2004, 53, 790–793. [Google Scholar]
  5. DPG Cholera Situation Updates and Response. Available online: http://www.tzdpg.or.tz/ (accessed on 6 February 2017).
  6. Udomkun, P.; Wiredu, A.N.; Nagle, M.; Müller, J.; Vanlauwe, B.; Bandyopadhyay, R. Innovative technologies to manage aflatoxins in foods and feeds and the profitability of application—A review. Food Control 2017, 76, 127–138. [Google Scholar] [CrossRef] [PubMed]
  7. Weaver, M.A.; Abbas, H.K.; Jin, X.; Elliott, B. Efficacy of water-dispersible formulations of biological control strains of Aspergillus flavus for aflatoxin management in corn. Food Addit. Contam. Part A 2016, 33, 346–351. [Google Scholar]
  8. Battilani, P.; Leggieri, M.C. Predictive modelling of aflatoxin contamination to support maize chain management. World Mycotoxin J. 2015, 8, 161–170. [Google Scholar] [CrossRef]
  9. Williams, S.B.; Murdock, L.L.; Baributsa, D. Storage of maize in Purdue Improved Crop Storage (PICS) bags. PLoS ONE 2017, 12, e0168624. [Google Scholar] [CrossRef] [PubMed]
  10. Wang, H.; Lei, Y.; Wan, L.; Yan, L.; Lv, J.; Dai, X.; Ren, X.; Guo, W.; Jiang, H.; Liao, B. Comparative transcript profiling of resistant and susceptible peanut post-harvest seeds in response to aflatoxin production by Aspergillus flavus. BMC Plant Biol. 2016, 16, 54. [Google Scholar] [CrossRef] [PubMed]
  11. Manoza, F.S.; Mushongi, A.A.; Harvey, J.; Wainaina, J.; Wanjuki, I.; Ngeno, R.; Darnell, R.; Gnonlonfin, B.G.; Massomo, S.M. Potential of using host plant resistance, nitrogen and phosphorus fertilizers for reduction of Aspergillus flavus colonization and aflatoxin accumulation in maize in Tanzania. Crop Prot. 2017, 93, 98–105. [Google Scholar] [CrossRef]
  12. Arzandeh, S.; Jinap, S. Effect of initial aflatoxin concentration, heating time and roasting temperature on aflatoxin reduction in contaminated peanuts and process optimisation using response surface modelling. Int. J. Food Sci. Technol. 2011, 46, 485–491. [Google Scholar] [CrossRef]
  13. Yao, H.; Hruska, Z.; Di Mavungu, D. Developments in detection and determination of aflatoxins. World Mycotoxin J. 2015, 8, 181–191. [Google Scholar] [CrossRef]
  14. Cheli, F.; Battaglia, D.; Gallo, R.; Dell’Orto, V. EU legislation on cereal safety: An update with a focus on mycotoxins. Food Control 2014, 37, 315–325. [Google Scholar] [CrossRef]
  15. Torres, A.M.; Barros, G.G.; Palacios, S.A.; Chulze, S.N.; Battilani, P. Review on pre- and post-harvest management of peanuts to minimize aflatoxin contamination. Food Res. Int. 2014, 62, 11–19. [Google Scholar] [CrossRef]
  16. Bowers, E.; Hellmich, R.; Munkvold, G. Comparison of fumonisin contamination using HPLC and ELISA methods in bt and near-isogenic maize hybrids infested with European corn borer or western bean cutworm. J. Agric. Food Chem. 2014, 62, 6463–6472. [Google Scholar] [CrossRef] [PubMed]
  17. Dzuman, Z.; Zachariasova, M.; Veprikova, Z.; Godula, M.; Hajslova, J. Multi-analyte high performance liquid chromatography coupled to high resolution tandem mass spectrometry method for control of pesticide residues, mycotoxins, and pyrrolizidine alkaloids. Anal. Chim. Acta 2015, 863, 29–40. [Google Scholar] [CrossRef] [PubMed]
  18. Nishimwe, K.; Wanjuki, I.; Karangwa, C.; Darnell, R.; Harvey, J. An initial characterization of aflatoxin B1 contamination of maize sold in the principal retail markets of Kigali, Rwanda. Food Control 2017, 73, 574–580. [Google Scholar] [CrossRef]
  19. Song, S.; Liu, N.; Zhao, Z.; Njumbe Ediage, E.; Wu, S.; Sun, C.; De Saeger, S.; Wu, A. Multiplex lateral flow immunoassay for mycotoxin determination. Anal. Chem. 2014, 86, 4995–5001. [Google Scholar] [CrossRef] [PubMed]
  20. Kandpal, L.M.; Lee, S.; Kim, M.S.; Bae, H.; Cho, B.-K. Short wave infrared (SWIR) hyperspectral imaging technique for examination of aflatoxin B1 (AFB1) on corn kernels. Food Control 2015, 51, 171–176. [Google Scholar] [CrossRef]
  21. Herschel, W. Experiments on the refrangibility of the invisible rays of the Sun. Philos. Trans. R. Soc. Lond. 1800, 90, 284–292. [Google Scholar] [CrossRef]
  22. Williams, P.; Norris, K. Near-Infrared Technology in the Agricultural and Food Industries; American Association of Cereal Chemists, Inc.: St. Paul, MN, USA, 1987. [Google Scholar]
  23. Finney, E., Jr.; Norris, K. Determination of moisture in corn kernels by near-infrared transmittance measurements. Trans. Am. Soc. Agric. Eng. 1978, 21, 581–584. [Google Scholar] [CrossRef]
  24. Hruschka, W.R.; Norris, K.H. Least-squares curve fitting of near infrared spectra predicts protein and moisture content of ground wheat. Appl. Spectrosc. 1982, 36, 261–265. [Google Scholar] [CrossRef]
  25. Williams, P.C.; Norris, K.H.; Sobering, D.C. Determination of protein and moisture in wheat and barley by near-infrared transmission. J. Agric. Food Chem. 1985, 33, 239–244. [Google Scholar] [CrossRef]
  26. Durmuş, E.; Güneş, A.; Kalkan, H. Detection of aflatoxin and surface mould contaminated figs by using Fourier-transform near-infrared (FT-NIR) reflectance spectroscopy. J. Sci. Food Agric. 2016, 97, 317–323. [Google Scholar] [CrossRef] [PubMed]
  27. Qiang, Z.; Fuguo, J.; Chenghai, L.; Jingkun, S.; Xianzhe, Z. Rapid detection of aflatoxin B1 in paddy rice as analytical quality assessment by near infrared spectroscopy. Int. J. Agric. Biol. Eng. 2014, 7, 127–133. [Google Scholar]
  28. Wang, W.; Lawrence, K.C.; Ni, X.; Yoon, S.-C.; Heitschmidt, G.W.; Feldner, P. Near-infrared hyperspectral imaging for detecting aflatoxin B1 of maize kernels. Food Control 2015, 51, 347–355. [Google Scholar] [CrossRef]
  29. Qiao, X.; Jiang, J.; Qi, X.; Guo, H.; Yuan, D. Utilization of spectral-spatial characteristics in shortwave infrared hyperspectral images to classify and identify fungi-contaminated peanuts. Food Chem. 2017, 220, 393–399. [Google Scholar] [CrossRef] [PubMed]
  30. Zhu, F.; Yao, H.; Hruska, Z.; Kincaid, R.; Brown, R.; Bhatnagar, D.; Cleveland, T. Classification of corn kernels contaminated with aflatoxins using fluorescence and reflectance hyperspectral images analysis. In SPIE Sensing Technology + Applications; International Society for Optics and Photonics: Baltimore, MD, USA, 2015; p. 94880M. [Google Scholar]
  31. Liang, P.-S.; Slaughter, D.C.; Ortega-Beltran, A.; Michailides, T.J. Detection of fungal infection in almond kernels using near-infrared reflectance spectroscopy. Biosyst. Eng. 2015, 137, 64–72. [Google Scholar] [CrossRef]
  32. Yao, H.; Hruska, Z.; Kincaid, R.; Brown, R.L.; Bhatnagar, D.; Cleveland, T.E. Detecting maize inoculated with toxigenic and atoxigenic fungal strains with fluorescence hyperspectral imagery. Biosyst. Eng. 2013, 115, 125–135. [Google Scholar] [CrossRef]
  33. Lee, K.-M.; Davis, J.; Herrman, T.J.; Murray, S.C.; Deng, Y. An empirical evaluation of three vibrational spectroscopic methods for detection of aflatoxins in maize. Food Chem. 2015, 173, 629–639. [Google Scholar] [CrossRef] [PubMed]
  34. Fernández-Ibañez, V.; Soldado, A.; Martínez-Fernández, A.; de la Roza-Delgado, B. Application of near infrared spectroscopy for rapid detection of aflatoxin B1 in maize and barley as analytical quality assessment. Food Chem. 2009, 113, 629–634. [Google Scholar] [CrossRef]
  35. Reese, B.N.; Payne, G.A.; Nielsen, D.M.; Woloshuk, C.P. Gene expression profile and response to maize kernels by Aspergillus flavus. Phytopathology 2011, 101, 797–804. [Google Scholar] [CrossRef] [PubMed]
  36. Dolezal, A.L.; Shu, X.; OBrian, G.R.; Nielsen, D.M.; Woloshuk, C.P.; Boston, R.S.; Payne, G.A. Aspergillus flavus infection induces transcriptional and physical changes in developing maize kernels. Front. Microbiol. 2014, 5, 1–4. [Google Scholar] [CrossRef] [PubMed]
  37. Nielsen, R.L. Grain Fill Stages in Corn. Available online: https://www.agry.purdue.edu/ext/corn/news/timeless/GrainFill.html (accessed on 6 February 2017).
  38. Baye, T.M.; Pearson, T.C.; Settles, A.M. Development of a calibration to predict maize seed composition using single kernel near infrared spectroscopy. J. Cereal Sci. 2006, 43, 236–243. [Google Scholar] [CrossRef]
  39. Cogdill, R.P.; Hurburgh, C.R. J.; Rippke, G.R.; Bajic, S.J.; Jones, R.W.; McClelland, J.F.; Jensen, T.C.; Liu, J. Single-kernel maize analysis by near-infrared hyperspectral imaging. Trans. Am. Soc. Agric. Eng. 2004, 47, 311–320. [Google Scholar] [CrossRef]
  40. An, D.; Cui, Y.; Liu, X.; Jia, S.; Zheng, S.; Che, X.; Liu, Z.; Zhang, X.; Zhu, D.; Li, S. Effects of varieties, producing areas, ears, and ear positions of single maize kernels on near-infrared spectra for identification and traceability. PLoS ONE 2016, 11, 1–12. [Google Scholar] [CrossRef] [PubMed]
  41. Swarbrick, B. Chemometric techniques for robust calibration development. In Proceedings of the 16th Australian NIR Spectroscopy Conference, Coffs Harbour, Australia, 4–7 May 2014; Australian Near Infrared Spectroscopy Group: Coffs Harbour, NSW, Australia, 2014. [Google Scholar]
  42. Williams, P.J.; Geladi, P.; Britz, T.J.; Manley, M. Growth characteristics of three Fusarium species evaluated by near-infrared hyperspectral imaging and multivariate image analysis. Appl. Microbiol. Biotechnol. 2012, 96, 803–813. [Google Scholar] [CrossRef] [PubMed]
  43. Zhao, X.; Wang, W.; Chu, X.; Li, C.; Kimuli, D. Early detection of Aspergillus parasiticus infection in maize kernels using near-infrared hyperspectral imaging and multivariate data analysis. Appl. Sci. 2017, 7, 90. [Google Scholar] [CrossRef]
  44. Dahm, D.J.; Dahm, K.D. The physics of near-infrared scattering. In Near-Infrared Technology in the Agricultural and Food Industries; Williams, P.C., Norris, K.H., Eds.; American Association of Cereal Chemists: St Paul, MN, USA, 2001; pp. 1–19. [Google Scholar]
  45. Reich, G. Near-infrared spectroscopy and imaging: Basic principles and pharmaceutical applications. Adv. Drug Deliv. Rev. 2005, 57, 1109–1143. [Google Scholar] [CrossRef] [PubMed]
  46. Manley, M. Near-infrared spectroscopy and hyperspectral imaging: Non-destructive analysis of biological materials. Chem. Soc. Rev. 2014, 43, 8200–8214. [Google Scholar] [CrossRef] [PubMed]
  47. Barnes, R.; Dhanoa, M.; Lister, S. Standard normal variate transformation and de-trending of near-infrared diffuse reflectance spectra. Appl. Spectrosc. 1989, 43, 772–777. [Google Scholar] [CrossRef]
  48. Wang, X.; Larkins, B.A. Genetic analysis of amino acid accumulation in opaque-2 maize endospoerm. Plant Physiol. 2001, 125, 1766–1777. [Google Scholar] [CrossRef] [PubMed]
  49. Afuakwa, J.J.; Crookston, K.R. Using the kernel milk line to visually monitor grain maturity in maize. Crop Sci. 1983, 24, 687–691. [Google Scholar] [CrossRef]
  50. Li, L.; Blanco, M.; Jane, J. Physicochemical properties of endosperm and pericarp starches during maize development. Carbohydr. Polym. 2007, 67, 630–639. [Google Scholar] [CrossRef]
  51. Manley, M.; Williams, P.; Nilsson, D.; Geladi, P. Near infrared hyperspectral imaging for the evaluation of endosperm texture in whole yellow maize (Zea maize L.) kernels. J. Agric. Food Chem. 2009, 57, 8761–8769. [Google Scholar] [CrossRef] [PubMed]
Figure 1. (a) Near infrared (NIR) spectral pattern of uninoculated maize kernels from 1100–2600 nm; (b) 1100 nm–2600 nm after spectral treatment by first derivative Savitzky-Golay (1d-SG) + multiplicative scatter correction (MSC).
Agriculture 07 00077 g001aAgriculture 07 00077 g001b
Figure 2. (a) Principal component analysis (PCA) scores plot of raw NIR spectral data from maize kernels in stage categories; (b) Loadings plots for PCA plots of maize kernels in stage categories.
Agriculture 07 00077 g002aAgriculture 07 00077 g002b
Figure 3. PCA scores plot of treated (1d-SG + MSC) spectral data from maize kernels in stage categories.
Agriculture 07 00077 g003
Figure 4. NIR spectral pattern of inoculated maize kernels from 800–2600 nm.
Agriculture 07 00077 g004
Figure 5. PCA scores plot for raw NIR spectra of inoculated kernel stage categories in stage-dose classifications with samples divided into 2 main clusters (A and B).
Agriculture 07 00077 g005
Figure 6. PC loadings plot for 1d-SG + MSC-treated NIR spectra of inoculated kernels in stage-dose classifications.
Agriculture 07 00077 g006
Figure 7. Regression plots for model using 2189 nm wavelength for (a) control and (b) inoculated samples at milk, dough and dent stages of maturity (with offset for control samples closer to target line) for categorical classification into control and inoculated sample groups. Red font and line represent validation data, blue font and line represent calibration data, black line represents the target.
Agriculture 07 00077 g007

