Article

Living Mulch Performance in a Tropical Cotton System and Impact on Yield and Weed Control

by
Vinay Bhaskar
1,*,
Robin R. Bellinder
1,†,
Antonio DiTommaso
2 and
Michael F. Walter
3
1
Horticulture Section, School of Integrative Plant Science, Cornell University, 236 Tower Rd., Ithaca, NY 14853, USA
2
Soil and Crop Sciences Section, School of Integrative Plant Science, Cornell University, 306 Tower Rd., Ithaca, NY 14853, USA
3
Department of Biological and Environmental Engineering, Cornell University,111 Wing Dr., Ithaca, NY 14853, USA
*
Author to whom correspondence should be addressed.
Deceased.
Agriculture 2018, 8(2), 19; https://doi.org/10.3390/agriculture8020019
Submission received: 19 November 2017 / Revised: 20 January 2018 / Accepted: 25 January 2018 / Published: 31 January 2018
(This article belongs to the Special Issue Sustainable Crop Production Intensification)

Abstract

:
Cotton (Gossypium hirsutum L.) is a major crop in the Vidarbha region of central India. The vertisol soils on which much of the cotton is grown have been severely degraded by the tropical climate, excessive tillage and depletion of organic matter. Living mulches have the ability to mitigate these problems but they can cause crop losses through direct competition with the cotton crop and unreliable weed control. Field experiments were conducted in 2012 and 2013 at four locations in Vidarbha to study the potential for growing living mulches in mono-cropped cotton. Living mulch species evaluated included gliricidia [Gliricidia sepium (Jacq.) Kunth ex Walp.], sesbania [Sesbania sesban (L.) Merr.], sorghum sudan grass [Sorghum bicolor (L.) Moench × Sorghum bicolor (L.) Moench ssp. Drummondii (Nees ex Steud.) de Wet & Harlan] and sunnhemp (Crotalaria juncea L.). Living mulch height was controlled through mowing and herbicides were not used. Living mulches generated 1 to 13 tons ha−1 of dry matter across sites and years. Weed cover was negatively correlated with both living mulch biomass and cover. Where living mulches were vigorous and established quickly, weed cover was as low as 7%, without the use of herbicides, or inter-row tillage. In a dry year, living mulch growth had a negative impact on cotton yield; however, in a year when soil moisture was not limiting, there was a positive relationship between cotton yield and living mulch biomass. Use of living mulches in cotton production in the Vidarbha region of India is feasible and can lead to both effective weed suppression and acceptable cotton yields.

1. Introduction

Cotton (Gossypium hirsutum L.) is a high value crop in the tropical, semi-arid Vidarbha region of central India. These tropical regions have inherently low levels of soil carbon [1]. Current farming practices further exacerbate this problem because the aboveground plant residue is used for animal feed or fuel [2]. A dry matter return of 2 to 3 kg m−2 is required to maintain soil organic carbon levels, but in cotton production systems, dry matter return is typically only 0.8 to 1.2 kg m−2 [3]. Since cotton plants do not produce much leaf litter, preservation of soil organic matter through conservation tillage practices and organic matter inputs using cover crops is especially valuable [4].
The dominant soils in Vidarbha are vertisols, which are difficult to work. These soils are hard when dry and sticky when wet, and are highly susceptible to erosion because of their fine clay texture and poor infiltration rates when wet [5]. The sticky nature of these soils when wet makes timely weed control operations problematic. This is because weed management typically involves multiple inter-row cultivations and occurs primarily during the rainy months of June through August [2]. Since initial growth of cotton plants is slow, during the wettest weeks of the growing season, the cotton crop covers only a small portion of the soil surface, leaving these soils prone to erosion. Poor water infiltration rates in these soils can also lead to puddling of water, which can increase susceptibility of the crop to abiotic stresses and diseases.
Reduced tillage practices in the Vidarbha region have been reported to decrease weed biomass and increase cotton yields [2,6]. Blaise [7] reported no adverse effects from reduced tillage on cotton fiber quality. In Australia, improvements in cotton yields with reduced tillage practices have been attributed to more favorable soil moisture conditions [8,9,10]. This is an important consideration in a water-limited environment like Vidarbha where cotton production typically occurs from June to January and is largely rainfed. Precipitation usually ceases by September and the summers (February to May) are hot and dry. This makes maintenance of perennial mulches, or establishment of cover crops after cotton harvest, impractical due to limited access to water for irrigation.
One suitable strategy to increase soil organic matter in this region may be the use of living mulches. Well-established living mulch stands can reduce soil erosion and increase the removal of stagnant water through transpiration. With the planting of a living mulch, inter-row soil disturbance is minimized and this reduction in tillage prevents further deterioration in soil quality and improves soil physical properties [8]. Furthermore, living mulches not only reduce the availability of nutrients to weeds earlier in the season but they can also release these nutrients to the cotton crop later in the season because cotton is a long duration crop [11].
Reduced nitrogen availability in the inter-rows caused by a rapidly growing living mulch can affect early weed growth more than crop growth [12], because crops generally have larger seed reserves [13], which enable them to withstand soil nutrient limitations better than weeds produced from smaller seeds. Therefore, living mulches can selectively suppress weeds early in the season [14]. Plants compete for light asymmetrically such that an inter-seeded cover crop that is taller and more abundant than weeds but shorter than the crop, is likely to adversely affect weeds more than the crop plants [15]. Living mulches compete with weeds during most of a weed’s life cycle [16] and the longer a living mulch stand is in place, the more effective the weed control [17]. This is especially important in a wide row-spaced (1.2 to 1.5 m), slow-growing crop like cotton, which takes 3 to 4 months to effectively shade the soil. Living mulches, unlike plant residues, can inhibit phytochrome-mediated germination of weed seeds [18] and clippings left on the soil surface can physically smother emerging weed seedlings [19].
A common intercropping practice in Vidarbha is the planting of cotton between rows of pigeon pea [Cajanus cajan (L.) Millsp.]. However, this system does not provide the many benefits of a living mulch system because pigeon pea, like cotton, is a slow-growing crop producing residues that are also removed at harvest. Green manure species like sunnhemp (Crotalaria juncea L.) and sesbania [Sesbania sesban (L.) Merr.] can produce considerably greater biomass [20] and fix more nitrogen [21] than pigeon pea, thereby offering potentially greater advantages as intercrops.
A group of studies conducted in the Vidarbha region [6] reported that a short-duration sunnhemp intercrop, in combination with reduced tillage practices did not contribute to weed suppression. However, few studies have examined the management and impact of long duration living mulch stands in long duration crops such as cotton under tropical climates. The overall goal of this study was to assess the feasibility of incorporating living mulches into typical cotton production systems in the Vidarbha region of central India. The specific objectives were to evaluate (1) the performance, including weed suppressive ability of different living mulch species and (2) their effects on the growth and yield of cotton.

2. Materials and Methods

Field trials were conducted during 2012 and 2013 at four locations in the Akola district of the Vidarbha region of India (Maharashtra State: 20.70° N, 77.07° E), hereafter referred to as Sites 1, 2, 3 and 4. In collaboration with the local agricultural university, the Panjabrao Deshmukh Krishi Vidyapeet (PDKV), Site 1 was located at their research farm. Sites 2, 3 and 4 were on private farms, located approximately 2 to 5 km from each other and approximately 20 to 25 km from Site 1. Cotton crops at all on-farm trials received drip irrigation, while Site 1 was mostly rainfed and irrigated only when necessary. Village level rainfall data could not be obtained. However, district level information gathered from the India Meteorological Department [22] indicated total rainfall of approximately 800 mm in 2012 and 1300 mm in 2013 during the growing season (May to December). Vertisols in the Akola district are Typic Chromusterts/Vertic Ustropepts [23]. Soil texture at the four sites were: Site 1 (13.5% sand, 49.7% silt, 36.8% clay); Site 2 (7.9% sand, 44.7% silt, 47.5% clay); Site 3 (10.4% sand, 37% silt, 52.7% clay); and Site 4 (11.5% sand, 38% silt, 50.6% clay). All soils were alkaline with a pH around 7.8.

2.1. Experimental Setup and Treatments

Recommended practices for cotton production in the Vidarbha region were adopted at Site 1. At other sites, growers attended to the trial areas similarly to the rest of their field, with the exception that no herbicide applications or inter-row hoeing were carried out after living mulches were planted. Site 1 was deep-plowed (30 cm) during Year 1 (2012) using a mold-board plow and harrowed twice (crosswise) using double-row disks. Partially composted and dried cow dung was broadcast at approximately 5 tons ha−1 and incorporated at a depth of 15 to 20 cm using a tractor-driven flat pan that also acted as a leveling implement. No manure was applied during Year 2 (2013) and a shallow (20 cm) chisel plow was used as the primary tillage tool. Field preparation was similar at the on-farm sites, but the secondary tillage operations were carried out using C-tined cultivators and bullock-driven wooden planks.
At each site, living mulch treatments plus a control were set up in a randomized complete block design with four replicates (Table 1). Individual plots were 7.6 by 6.1 m. Control plots did not have living mulches and were kept weed free by hand weeding. Sesbania [Sesbania sesban (L.) Merr.], gliricidia [Gliricidia sepium (Jacq.) Kunth ex Walp.], sorghum sudan grass [Sorghum bicolor (L.) Moench × Sorghum bicolor (L.) Moench ssp. Drummondii (Nees ex Steud.) de Wet & Harlan] and sunnhemp (Crotalaria juncea L.) were the living mulch species used (see Table 1 for seeding rates). The gliricidia treatment and Sites 3 and 4 were used only during Year 2; and sorghum sudan grass and gliricidia did not establish at all sites (Table 1). Also, a combination of sesbania, gliricidia, sorghum sudan grass and sunnhemp at seeding rates of 11, 26, 11 and 14 kg ha−1, respectively, was tested as a ‘mixture’ treatment during Year 2 (Table 1) to study the effect of species mixtures. Although sorghum sudan grass was expected to be a competitive species in a living mulch system, this grass species (all others being legumes) was included to increase the types of plant species used and because sorghum sudan grass was easily available locally.
Mucuna [Mucuna bracteata (DC.) ex Kurz] and pueraria [Pueraria phaseoloides (Roxb.) Benth.] were two other living mulch species evaluated during Year 1, but did not establish at any site despite repeated planting. Hence, these species were not used during Year 2. Lablab [Lablab purpureus (L.) Sweet] was tested as a potential marketable intercrop during Year 2. However, the lablab plants became unmanageable 2 to 3 months after planting and the bamboo poles used for their support could no longer hold their weight. So, they were uprooted and laid in the inter-rows as mulch. No lablab pod/seed yield was obtained from any site. Therefore, mucuna, pueraria and lablab treatments are not discussed here.
Although the planting of cotton and the living mulches on the same day was not possible at every site, living mulches were planted no more than 2 to 4 weeks after cotton (Table 2). Living mulches were manually seeded into three or four furrows (made with a pull-behind wooden marker) between the cotton rows, at a depth of approximately 3 cm.

2.2. Management and Data Collection

Frequent inter-row cultivation for weed control is common in cotton production in the Vidarbha region. This is followed by hand-weeding within the rows. This latter operation was carried out in all treatment plots (approximately twice a season). Since cultivation tools could not be maneuvered through the individual plots, control plots were only hand weeded. At Site 1, the recommended rates of 100 kg ha−1 nitrogen, 50 kg ha−1 phosphorous and 50 kg ha−1 potassium were applied as diammonium phosphate and muriate of potash, near the base of each cotton plant. Half of the nitrogen was applied at planting and the rest was split into two equal side-dresses, applied in mid-August and early October. On the private farms, growers were asked to follow their typical fertilization and pest management practices. The fertilization rates were similar to the recommended rates for Site 1 but included additional foliar applications of the micronutrients boron, iron, magnesium, and/or zinc, at approximately 5, 5, 10 and 10 kg ha−1, respectively. At all sites, no inter-row cultivation, herbicide application, or additional fertilization (to compensate for the living mulch) was used in the treatment plots.
When living mulches reached a height of 20 to 30 cm below the top of the cotton canopy, they were cut back to a height suitable for their regeneration (approximately 30 to 40 cm from the soil surface). Even though the living mulch species varied in their growth and recovery, using this as a common mowing height was expected to adequately relieve the cotton crop from living mulch competition, while leaving sufficient soil cover and recovery capability. In 2012, mowing operations were carried out using a weed whacker fitted with a flail type nylon blade; in 2013, garden shears were used.
Ground cover (percent) of the living mulches and weeds was visually estimated multiple times during the season and averaged. It was recorded as the percent soil surface covered by living mulch alone or weed alone in the three central inter-row spaces. Living mulch and weed densities and living mulch biomass were determined from sampling four randomly selected areas within the two central inter-row areas using a 0.5 by 0.5 m quadrat. Biomass was measured immediately after cutting and following oven-drying at 75 °C for 5 days. After cotton harvest, the living mulches were left in the fields until they were plowed under at the end of the growing season in February/March. But living mulch or weed data were not collected beyond November.
Cotton plants in the three (four in Site 2-Year 2) central rows of each plot were used to determine the number of bolls per plant, plant height and yield. Cotton plant height and boll counts were estimated in October from 10 randomly selected plants. Cotton was picked manually, and because of its indeterminate growth, harvesting was carried out every 2 to 3 weeks from November through early January. Cotton yield included both lint and seed yields.

2.3. Data Analyses

Analysis of Variance (ANOVA) and regression analyses were carried out at 5% level of significance. Treatment differences were compared using the Tukey’s HSD test. Statistical analyses were carried out using JMP Pro 11.0.0 (2013 SAS Institute Inc., Cary, NC, USA) software. The effects of cotton growth, living mulch and weeds on each other were not always similar. In assessing the effects of living mulch treatments on cotton yield and weed suppression, data from all sites and years were also considered together to increase the power of the statistical analyses. Regression analyses were also conducted on this pooled data to identify broader relationships between cotton yield, weed pressure and living mulch vigor. The number and type of treatments across the sites and years and the number of sites used during the two trial years were not uniform (Table 1). Therefore, broader analyses across treatments, trial sites and years were conducted on sub-datasets, which were created to prevent analyses using incomplete blocks. Sub-datasets were created by pooling trial sites and treatments such that the treatments were equally represented between trial sites and the trial sites were equally represented between years. In ANOVA tests, treatment and year were considered fixed effects and trial site was considered a random effect. Replication was considered as a random effect nested within trial site.

3. Results and Discussion

Living mulches generated substantial biomass and effectively suppressed weeds in plots where they established well. Where emergence of the living mulch was high and 80% cover was reached within 3 to 4 weeks after planting, weed densities were below 15 plants m−2 (Table 2). Numerous weed species occurred at the four trial sites; and no single weed species dominated any site-year, except parthenium (Parthenium hysterophorus L.) in Site 1-Year 1. Abundant weeds included Indian copperleaf (Acalypha indica L.), tropical whiteweed (Ageratum conyzoides L.), sessile joyweed [Alternanthera sessilis (L.) R. Br. ex DC.], slender amaranth (Amaranthus viridis L.), spurge [Chamaesyce hirta (L.) Millsp.], Benghal dayflower (Commelina benghalensis L.), purple nutsedge (Cyperus rotundus L.), crowfoot grass [Dactyloctenium aegyptium (L.) Willd.], viper grass [Dinebra retroflexa (Vahl) Panzer], Japanese lovegrass [Eragrostis amabilis (L.) Wight & Arn. ex Nees] and common wireweed (Sida acuta Burm. f.). Weed species that emerged early in the season included purple nutsedge, Benghal dayflower, spurge and Amaranthus spp. Benghal dayflower and spurge were particularly prolific alongside drip irrigation lines (located within the cotton rows). Grass weeds such as crowfoot grass, viper grass and Japanese lovegrass occurred much later in the season towards the start of the harvest period.

3.1. Cotton Growth and Yield

Sesbania and sunnhemp were the two living mulch treatments that were successfully evaluated during both Years 1 and 2, at all trial sites. The other species lacked vigor and reliability in establishing. From data pooled across Years 1 and 2, Sites 1 and 2, and sesbania and sunnhemp treatments, there was no treatment by year interaction (p = 0.9). Cotton yields from sesbania (1540 kg ha−1) and sunnhemp (1522 kg ha−1) plots were not statistically different from the hand-weeded control (1809 kg ha−1) (p = 0.23) (Table 3). No treatment by year interaction was found for cotton height (p = 0.74) and boll number (p = 0.53). Cotton height and boll number in sesbania (112 cm and 31, respectively) and sunnhemp (119 cm and 32, respectively) were not different from the control (114 cm and 43, respectively) (p = 0.56 and 0.06, respectively).
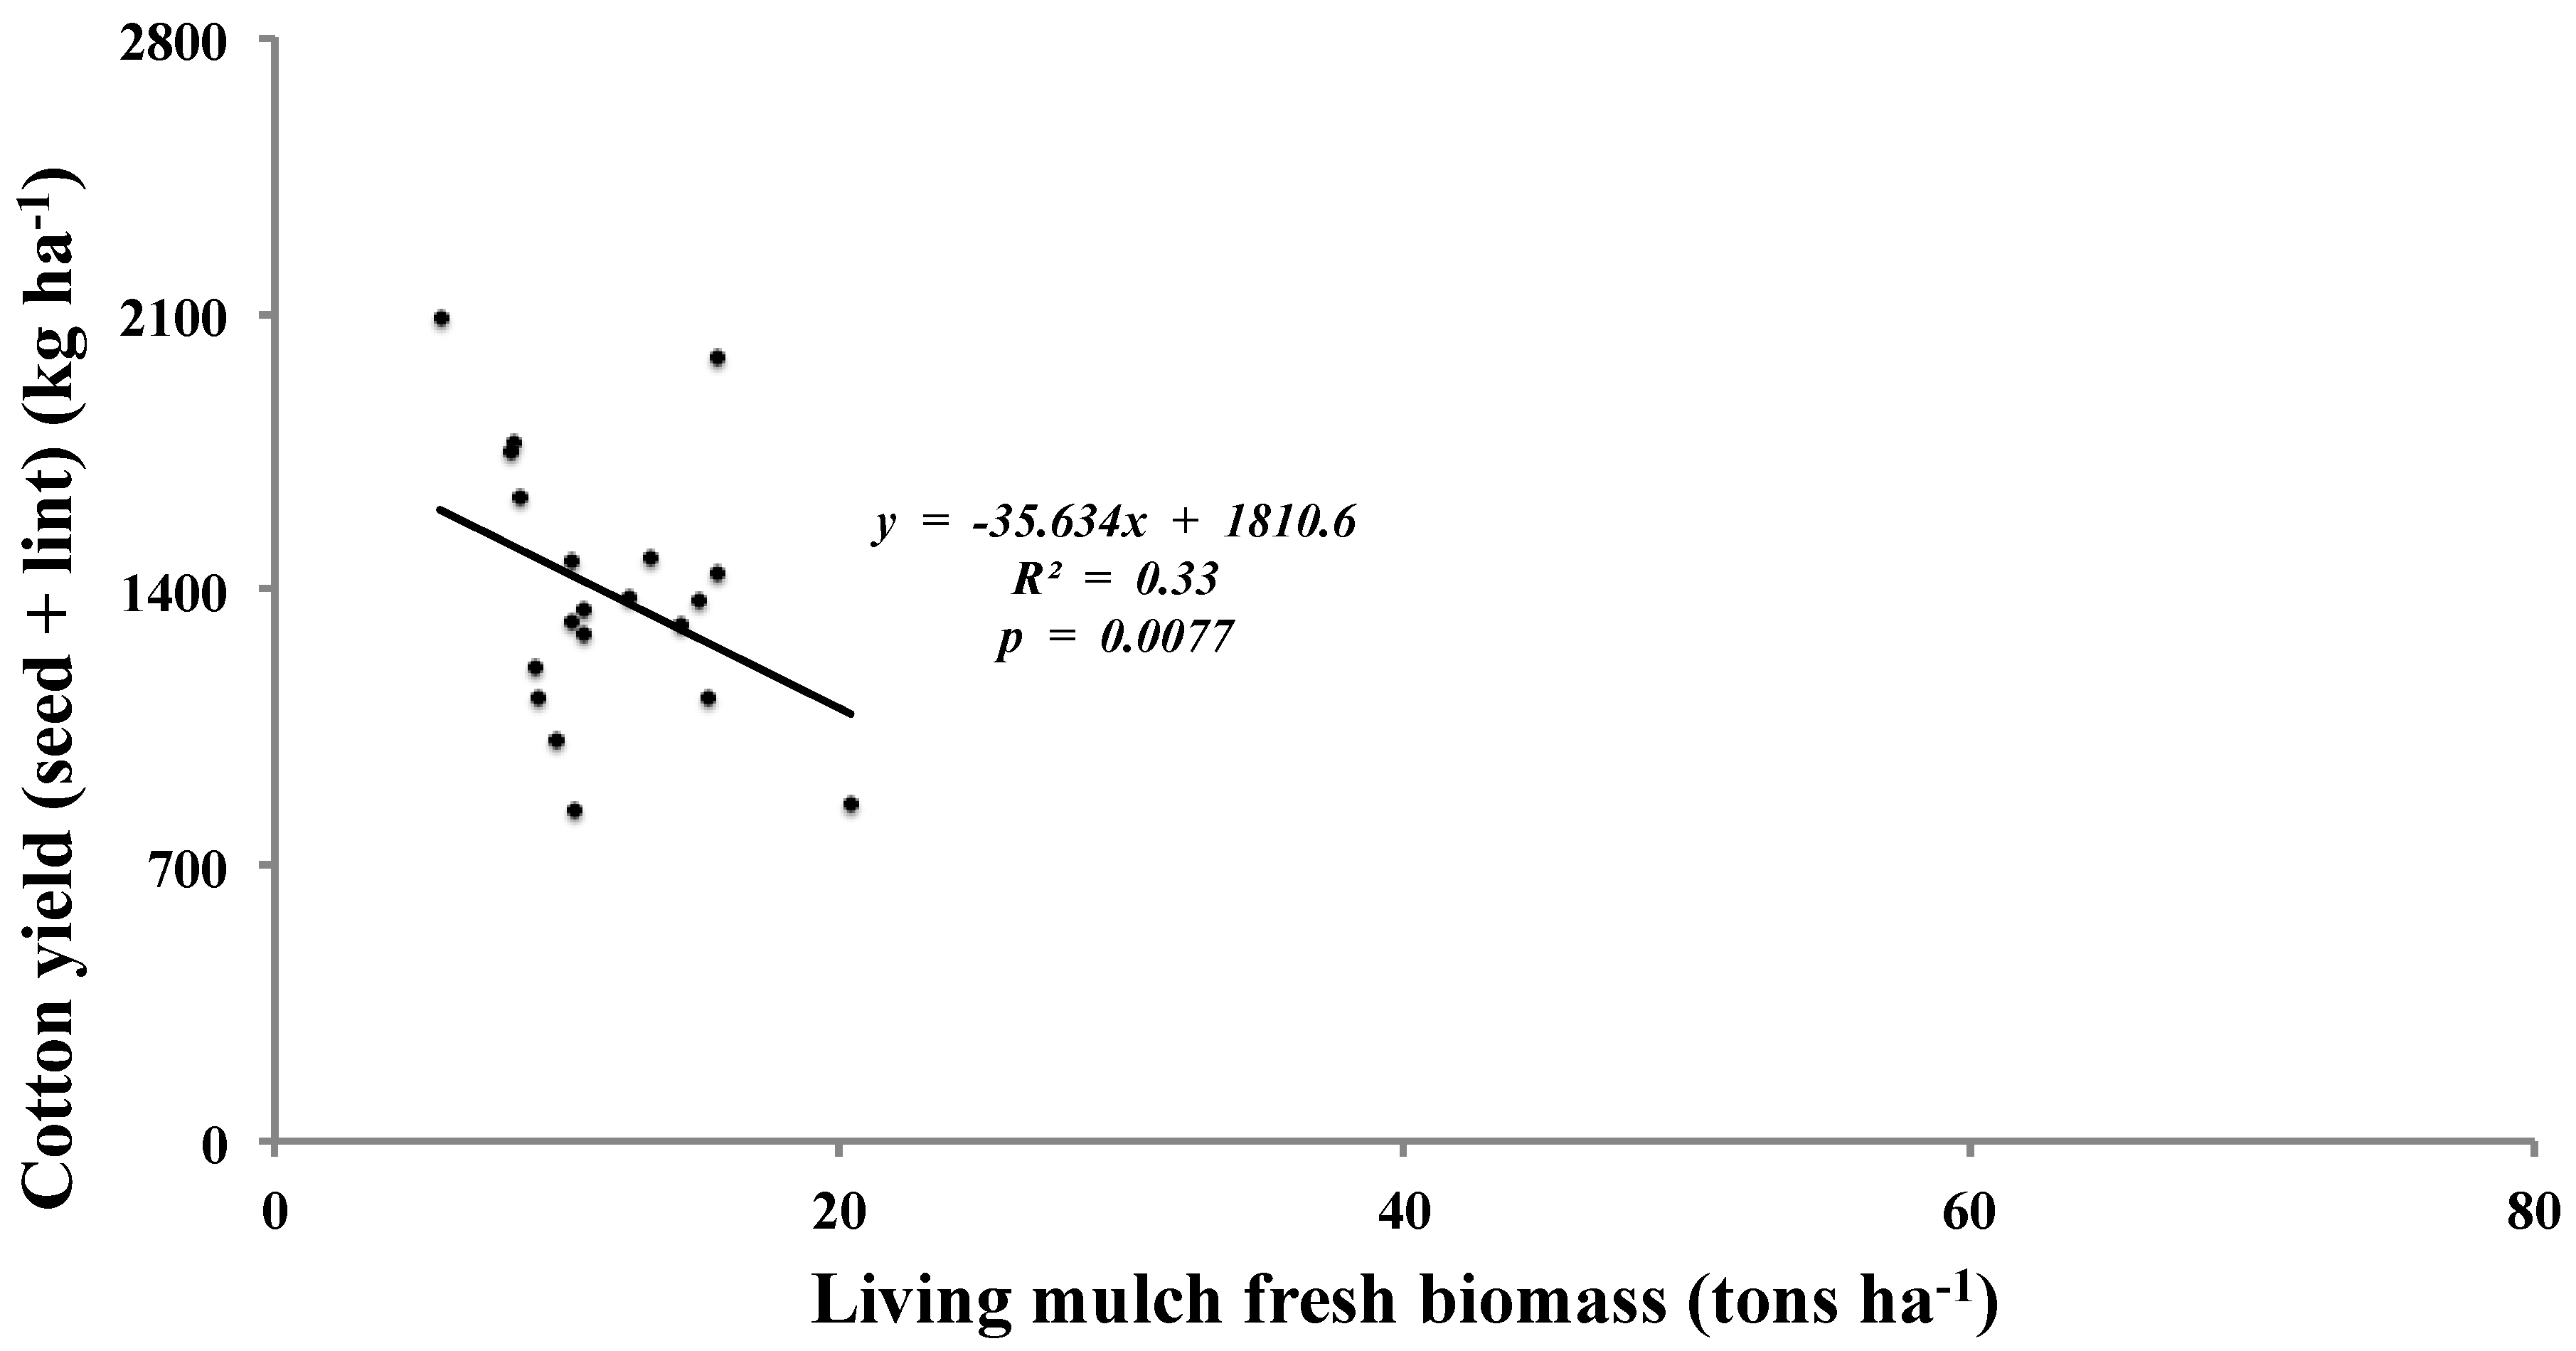
Although no treatment by year interaction was found for the sesbania and sunnhemp treatments, all cotton parameters differed in Year 1 and Year 2- yield (1467 and 1780 kg ha−1, respectively; p = 0.04), height (92 and 139 cm, respectively; p < 0.0001) and boll count (27 and 44, respectively; p = 0.0002). In Year 1, across Sites 1 and 2, cotton yields from all the living mulch treatments (sesbania (1343 kg ha−1), sunnhemp (1380 kg ha−1) and sorghum sudan grass (1315 kg ha−1)) did not differ from each other or the control (1585 kg ha−1) (p = 0.19) (Table 4). Although the treatments did not have any effect on cotton yields, there was a negative correlation (p = 0.0077) between cotton yield and living mulch biomass (Figure 1).
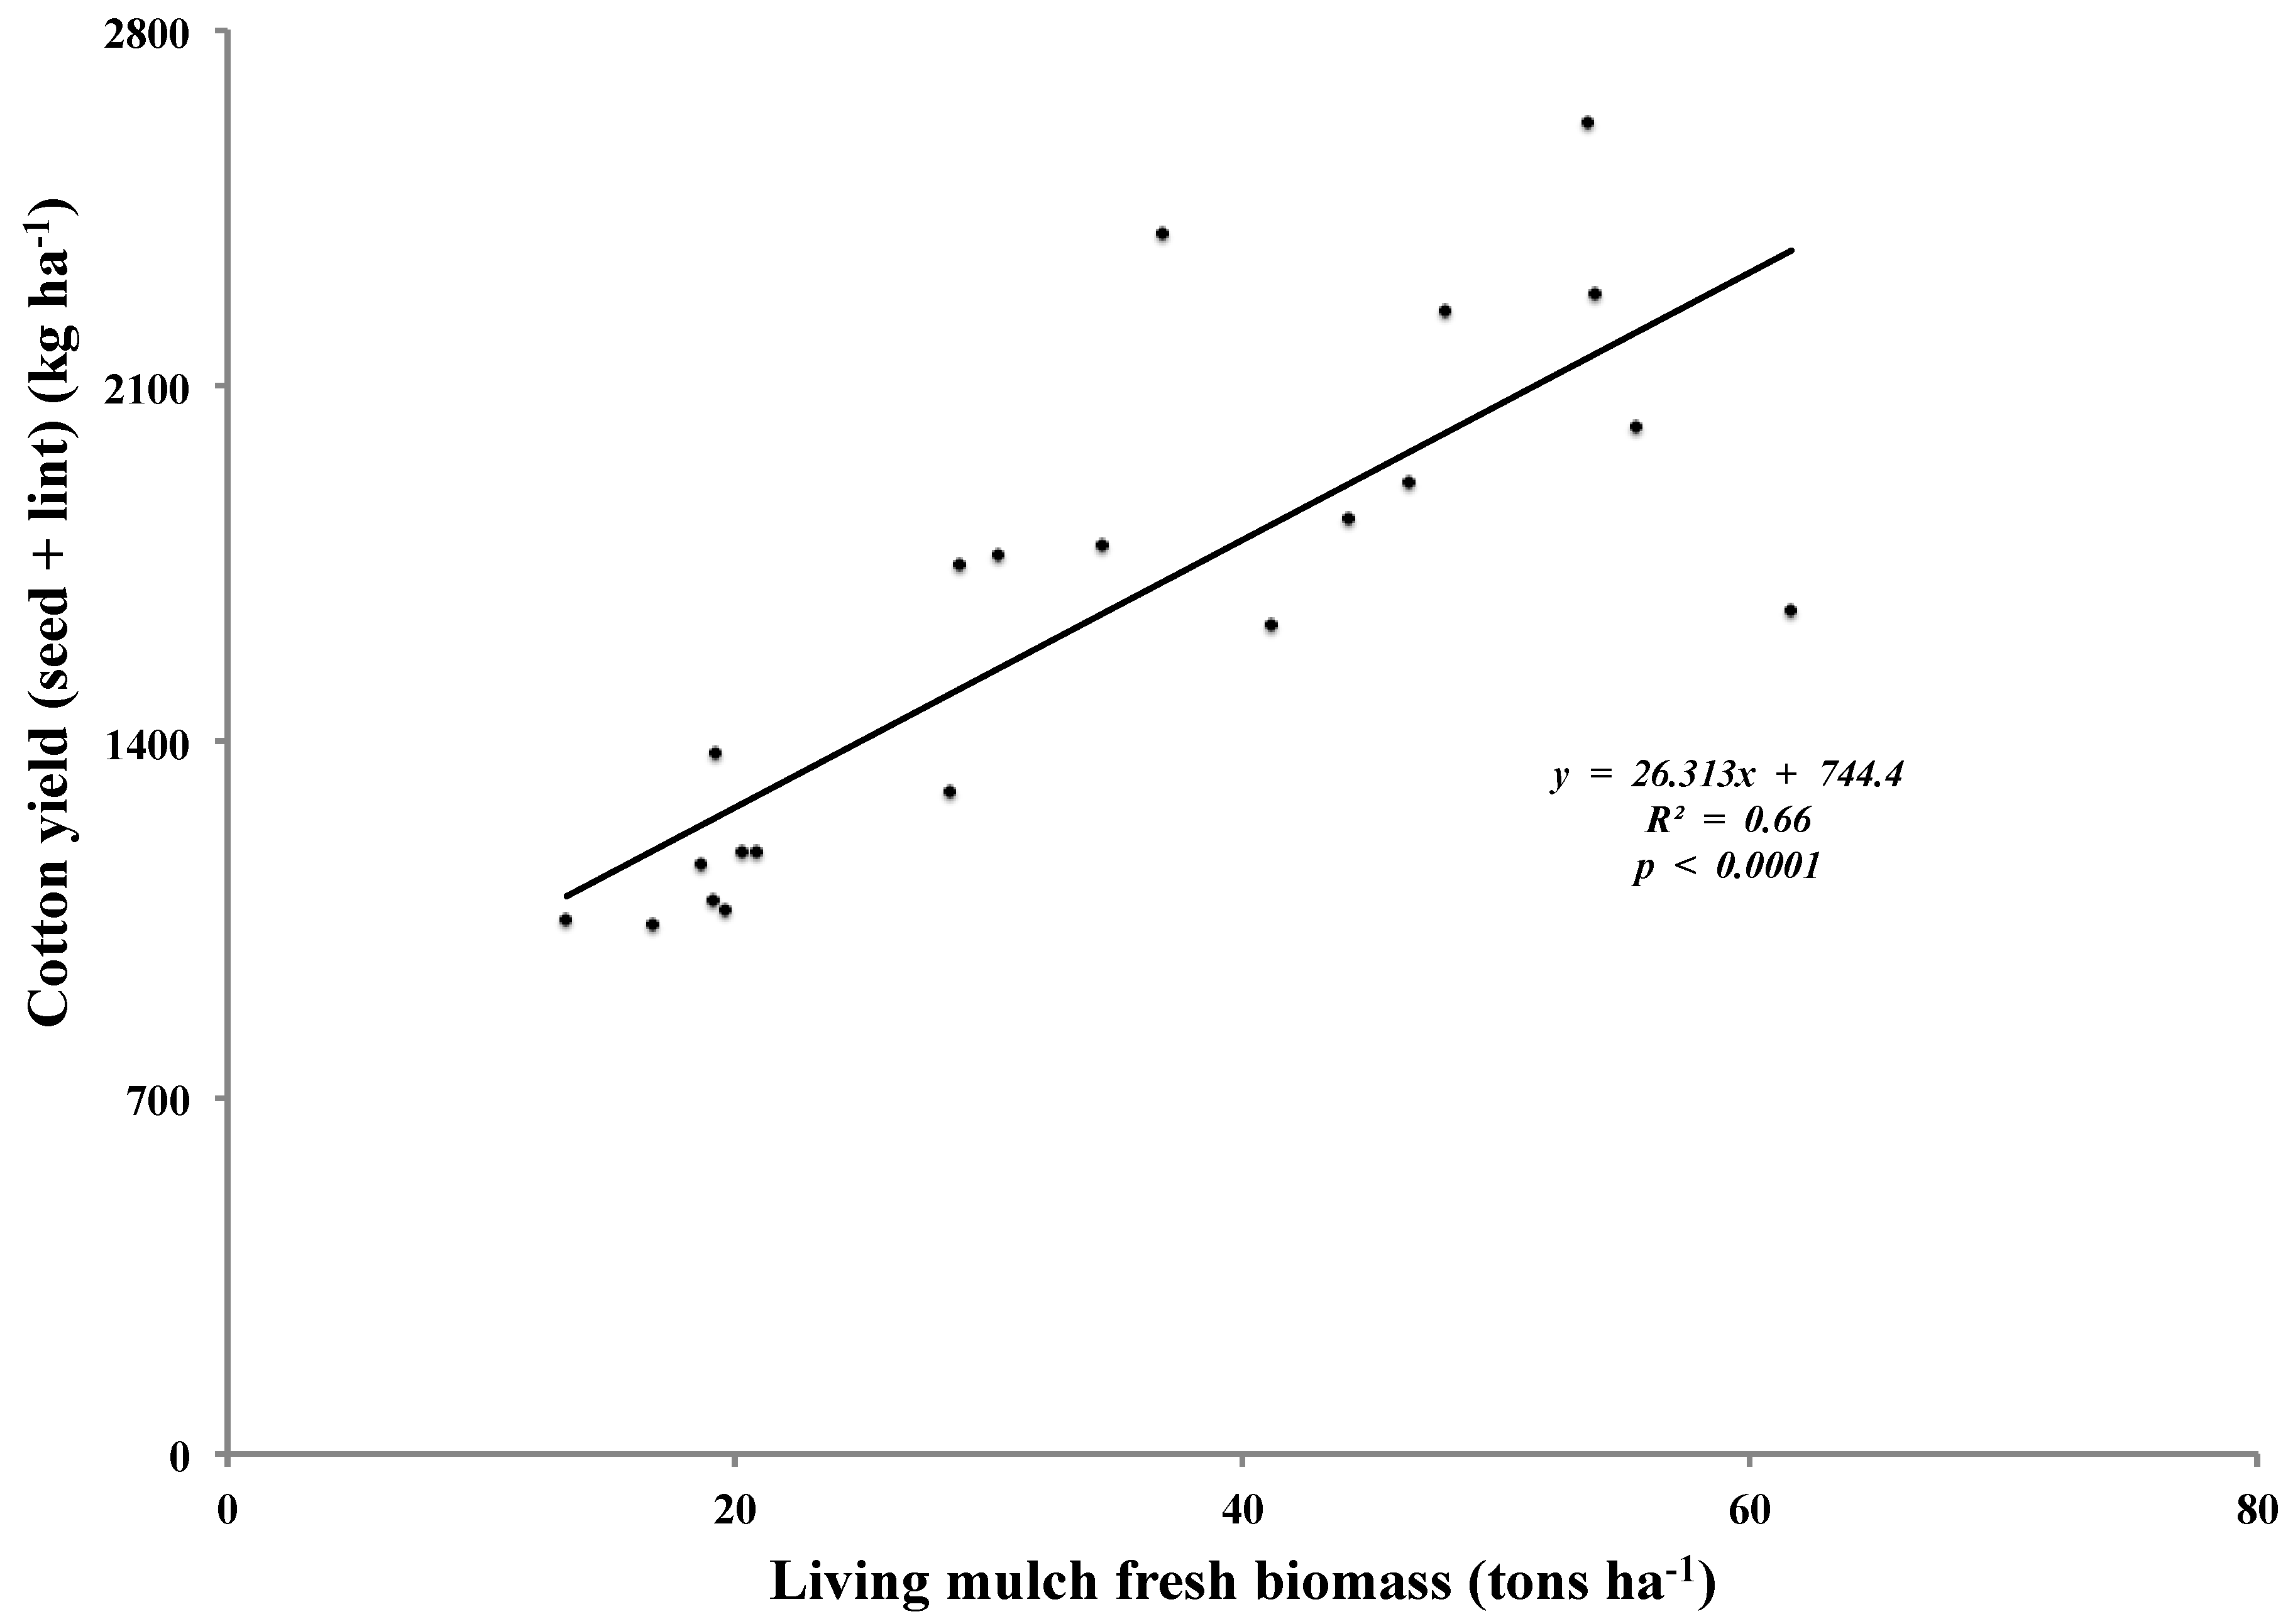
This relationship between cotton yield and living mulch biomass during Year 1 was in contrast to that in Year 2. When sesbania and sunnhemp treatments from Year 2 were considered, there was a strong positive correlation between cotton yield and living mulch biomass (p < 0.0001) (Figure 2). Site 3 was excluded from this regression analysis due to overall poor cotton yield at this site, resulting from untimely planting during wet conditions. Gliricidia, sorghum sudan grass and the mixture treatments were also excluded since they were not present at all trial sites. Even though, in 2012, limited overhead irrigation was provided at Site 1 and drip irrigation was provided at Site 2, these contrasting results were probably due to the dry conditions in 2012 relative to 2013 [22].
Sesbania and sunnhemp data from all trial sites during Year 2 were used to examine treatment effects on cotton (Table 5). Cotton yields from sesbania (1476 kg ha−1) or sunnhemp (1462 kg ha−1) plots were not statistically different (p = 0.25) from control (1643 kg ha−1) plots. This suggests that the planting and management techniques used for these living mulch treatments were successful in preventing competition with the cotton crop. Reduced tillage and use of a short duration sunnhemp intercrop has been previously reported to improve cotton yields in the Vidarbha region [6]. However, in the Blaise [6] study, sunnhemp was planted late and incorporated into the soil relatively early. This resulted in sunnhemp dry matter production of only about 1 ton ha−1 and necessitated an inter-row tillage operation for incorporation of the sunnhemp intercrop.
In Year 2-Site 3, sorghum sudan grass plots were associated with the greatest weed cover and least cotton yield (Table 6). Only at this site and in this treatment, were the effects of competition between living mulch and cotton apparent. Cotton plants in these plots had chlorotic leaves, were severely stunted, had sparse canopies, and small bolls. These bolls only opened partially and dried up prematurely. Such effects were not visible in the legume living mulch plots even though these legumes produced substantially more biomass than the sorghum sudan grass. Therefore, competition between sorghum sudan grass and cotton was more likely for nitrogen than water, especially given that irrigation was provided at this site. It was not clear why, but these visible effects of competition did not reflect on cotton yield (Table 6); and cotton yield from sorghum sudan grass plots was not different from sunnhemp and sesbania plots. During Year 2, lower cotton yields at Site 1 compared with yields at Sites 2 and 4 (Table 6) were likely due to a severe outbreak of black root rot [Thielaviopsis basicola (Berk. And Br.) Ferraris]. Even though only a few cotton plants died from the disease, plants were weakened.
Prolonged nitrogen and water availability due to presence of living mulch and abundant surface mulch could have increased cotton yields in plots with well-established living mulches. Such improved growing conditions can prolong cotton boll development and enhance boll filling [24]. Earlier in the season, the living mulches likely tied up considerable amounts of fertilizer nitrogen in their tissue, thus minimizing nitrogen losses via leaching and decreasing availability to weeds [21,25]. In a long duration crop like cotton, this nitrogen, along with biologically-fixed nitrogen, would likely become available to the crop later in the season [11]. Leaves of the legume living mulches falling on the soil surface following mowing can also release nitrogen very rapidly [26].
Boll weight was not measured but bolls associated with more vigorous living mulch stands were observed to be generally larger. This is corroborated by the lower boll count in plots with living mulches compared with the control plots, even though differences in cotton yields between them were absent. In Year 2, when sesbania (34 bolls per plant) and sunnhemp (32) treatments across all trial sites were compared with the control (41), boll counts in these treatments were lower (p = 0.0005) (Table 5). And, although living mulch biomass was positively correlated with cotton yield, there was a strong negative correlation (p < 0.0001) between living mulch biomass and boll count.
However, in case of plant height, cotton plants in the sunnhemp treatment plots were taller (125 cm) than in the control (111 cm) plots (p = 0.04) (Table 5). During the wetter Year 2, in plots with vigorous living mulches, new apical shoot growth and new boll formation were observed in cotton plants at the beginning of the harvest period. This was likely due to enhanced soil moisture and nitrogen availability [27]. Increases in cotton yields from adoption of reduced tillage and cover crops, as a result of higher soil moisture availability, have been previously reported [8,10]. This late-season growth extended harvest by more than a month and could have contributed to the increase in cotton yield in these plots. Soil moisture levels during Year 2 were probably more effectively conserved in plots with vigorous living mulch stands as more surface residue was produced from their clipping [28].
The cut plant material, which was not incorporated but left as surface mulch where it fell, could also have moderated soil surface temperatures. Evapo-transpiration losses of soil moisture from within living mulch stands were likely reduced later in the season because of (1) surface residue and (2) loss of living mulch vigor with both age and stress from multiple clippings. The presence of a mulch layer, the consequent increase in soil moisture and absence of inter-row tillage can also prevent crusting of the soil surface [29,30], which is a severe problem in the clayey soils of Vidarbha.

3.2. Living Mulch Performance and Weed Suppression

Overall, living mulches produced 8 to 79 tons ha−1 of fresh biomass corresponding to 1 to 12.7 tons ha−1 of dry matter. During the latter part of the growing season, surface mulch at Sites 2, 3 and 4 were several centimeters thick and completely covered the soil surface. In order to compare living mulch biomass between Year 1 and Year 2, sesbania and sunnhemp data from Sites 1 and 2 were pooled. Average living mulch biomass production in Year 2 (29 tons ha−1) was higher (p = 0.0002) than in Year 1 (12 tons ha−1). One possible contributing factor for low biomass production during Year 1 may have been the use of flail-type blades, which were unable to make clean cuts, for mowing during that year. Hence, during Year 2, garden shears were used to clip the living mulches.
The difference in the amount of rainfall between the two years could also have influenced this outcome. Year 1 was a dry year, while Year 2 was a wet year, facilitating better living mulch recovery during Year 2. Final clippings were done in September during Year 1 and in November during Year 2. Although irrigation was provided at all the on-farm sites, the more precise delivery of water to the cotton plants using drip irrigation likely prevented any considerable impact of irrigation on the living mulches. It is expected that longer lasting living mulch stands, like in Year 2, will generate greater biomass. Previous studies in green manure sesbania have reported that 36-day old crops (DOC) produced 1.5 tons ha−1 more dry matter than 24 DOC, and 48 DOC produced 3 tons ha−1 more than 36 DOC [31], suggestive of a progressively greater rate of biomass accumulation.
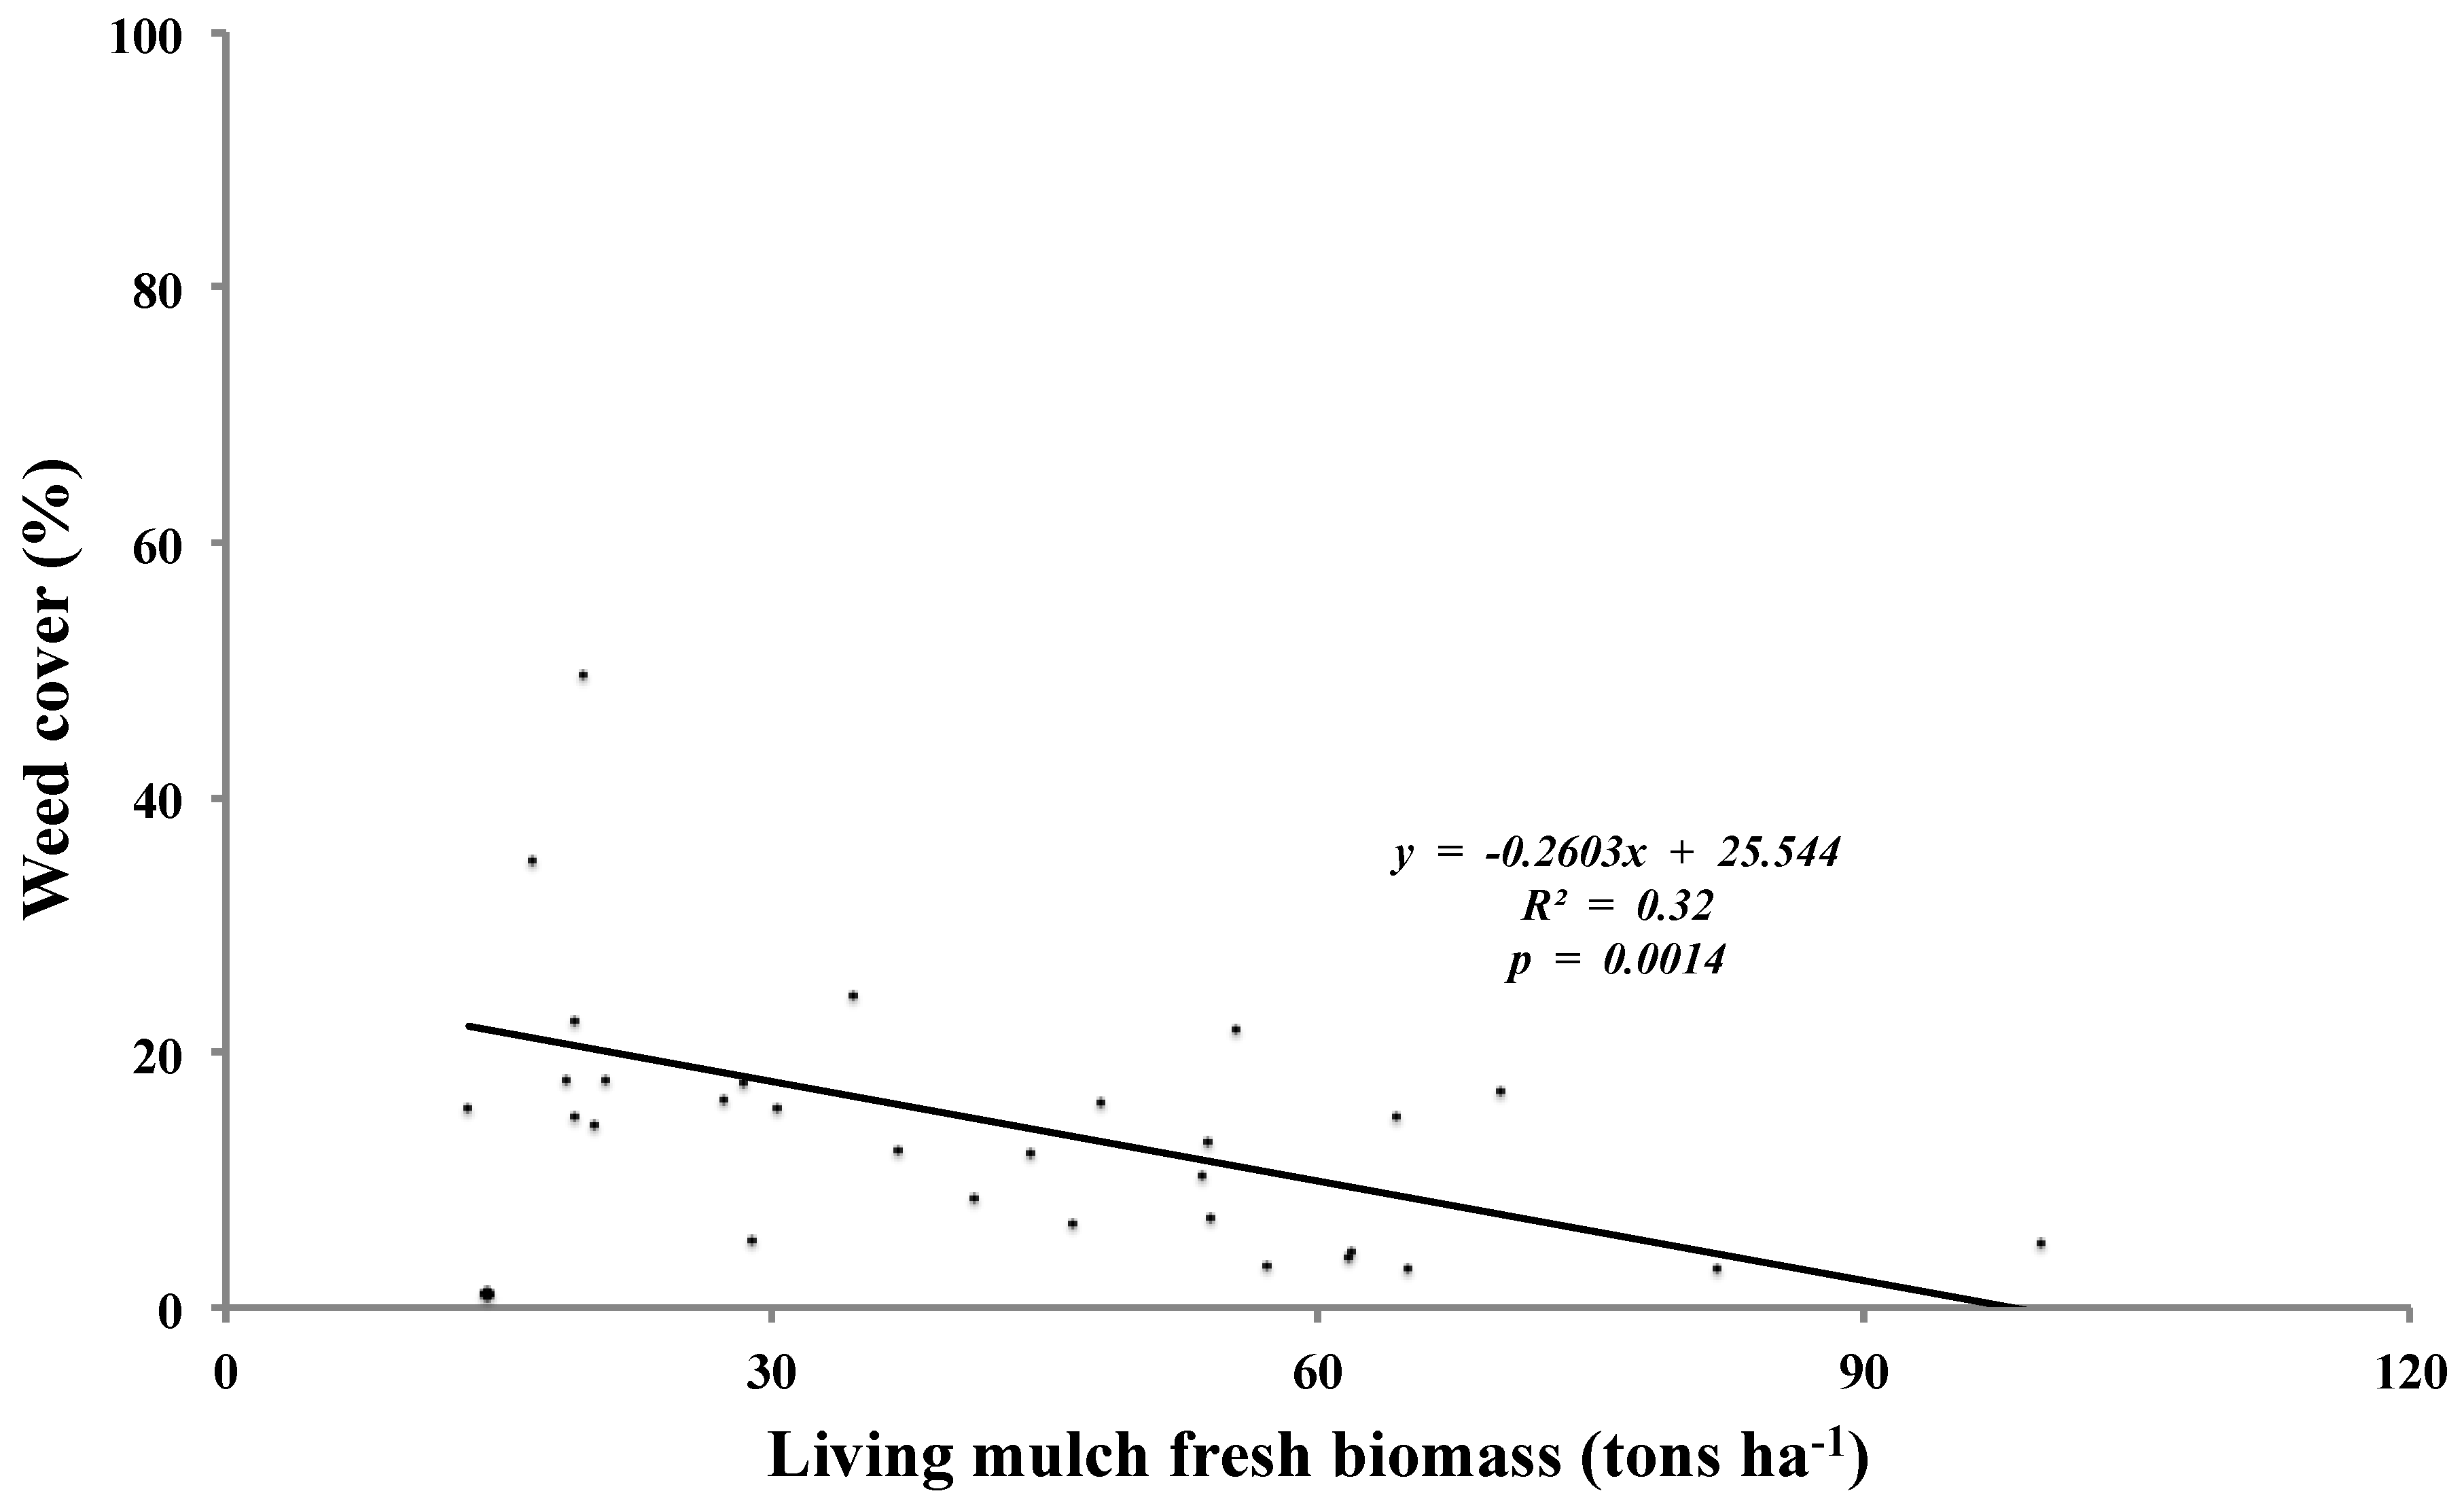
From Year 1 sesbania and sunnhemp data, there was no correlation (p = 0.84) between weed cover and living mulch biomass. In contrast, Year 2 data from the same treatments showed a negative relationship (p = 0.0014) between weed cover and living mulch biomass (Figure 3). Living mulch performance was greatest at Site 3 and here, weed suppression was excellent (Table 6). At this site, high living mulch vigor and regeneration and healthy, long-lasting stands led to multiple successful mowing operations (Table 2) and consequently, thick surface mulch. Sesbania and sunnhemp produced an average of 59 and 79 tons ha−1 of fresh biomass, respectively, the greatest amounts recorded in these trials (Table 6). Average living mulch ground cover in sesbania and sunnhemp plots at Site 3 were 85 and 97%, respectively. These living mulch stands were so vigorous that average weed cover was only 7% in both treatments. Living mulches at Site 3 remained healthy through cotton harvest in December. At Sites 1 and 2, the living mulches began to dry up and senesce by October.
Vigorous living mulch stands were cut back more often than weaker stands (Table 2). This could have greatly improved weed control since weed biomass decreases rapidly with increasing frequency of mowing [32]. In healthy living mulch stands, taller weeds like Amaranthus spp., Japanese lovegrass, parthenium and pigmy groundcherry (Physalis minima L.) were more abundant than short or prostrate weeds like sessile joyweed, spurge, Benghal dayflower and common wireweed. The latter weeds were more prominent in weaker, less dense intercrop stands. Such differences in weed growth responses have been previously documented [32,33,34,35,36] in environments where light competition occurs. These weed responses could explain how mowing might have controlled weeds that grew quickly towards the top of the living mulch canopy, where light availability increases rapidly [34]. Competition for light also drives movement of photosynthates from roots to shoots [37]. Hence, living mulches, in tandem with the mowing operations, can suppress perennial weeds, which are difficult to control in reduced tillage systems [38]. Stimulation of weed seed germination through primary tillage, followed by subsequent mowing, is also an effective strategy to exhaust the weed seed bank [39,40].

3.3. Individual Living Mulch Species

3.3.1. Sesbania

Sesbania produced an average of 5.4 tons ha−1 of dry matter across trial sites during Year 2. In vertisol soils of Ethiopia, sesbania subjected to multiple cuts has been reported to produce up to 1.5 tons ha−1 of dry matter in 105 days [41]. Onim et al. [20] reported 14 tons ha−1 of aboveground dry matter from a 12-month sesbania crop in western Kenya. Therefore, sesbania has the capacity to use a longer growing season to produce large quantities of biomass. Onim et al. [20] also estimated nitrogen fixation by the sesbania crop at approximately 450 kg ha−1. In our trials, considering an average dry matter production of 5 tons ha−1, sesbania could have contributed 170 kg ha−1 of nitrogen, which is more than the recommended rate of nitrogen (100 kg ha−1) for cotton cultivation in Vidarbha. Plants had large, dense crowns that provided an extensive top canopy. This growth habit allowed sesbania to consistently, along with sunnhemp, be the first living mulch to achieve more than 80% cover (Table 2). Average ground cover for sesbania across all trial sites was 68% in Year 1 and 71% in Year 2. Sesbania biomass (data from all sites) during Year 2 had a strong negative relationship (p = 0.001) with weed cover.
However, soil cover provided by sesbania stands was not correlated (p = 0.36) with weed cover. The lower strata of the sesbania canopy were sparse. So, when the top layer was removed during mowing, inter-row cover was observed to be poor for 2-to-3 weeks until new growth closed canopy. This slow canopy recovery sometimes led to severe weed infestation. Especially noteworthy in these situations was Benghal dayflower, which sometimes covered the entire soil surface of treatment plots, along with spurge and sessile joyweed. But, sesbania controlled weeds effectively in plots having vigorous stands. In Site 1-Year 1 and Sites 1, 2 and 4, during Year 2, the average initial weed cover in sesbania plots was 45%; approximately a month later, weed cover dropped to 13%. The regenerative ability of sesbania was slightly inferior compared with sunnhemp or gliricidia. On two occasions in Year 1, sesbania plants did not recover from the first mowing and subsequently dried up (Table 2). Other studies have reported more than 50% reduction in sesbania biomass when it was cut back twice compared with one cutting [41]. The short duration of sesbania stands in Year 1 resulted in 55% average weed cover in these plots.

3.3.2. Gliricidia

From data pooled across Sites 1 and 3 (Year 2), weed cover was negatively correlated with both gliricidia biomass (p = 0.019) and soil cover (p = 0.04). However, gliricidia required 10 to 15 days following seeding to attain maximum emergence and initial growth was slow. From planting, 8 to 16 weeks were required to attain more than 80% cover (Table 2). As such, weed pressure in gliricidia was high earlier in the season and plots were hand-weeded at least once at all sites to prevent stunting and death of gliricidia plants.
At Site 3, gliricidia was vigorous and generated 42 tons ha−1 of fresh biomass (Table 6). Corresponding weed density and weed cover were only 13 plants m−2 and 10%, respectively. But, 60 to 70 days were still required to achieve >80% cover (Table 2). It is possible that this slow initial growth was due to gliricidia being grown from seed. Traditionally, gliricidia is propagated using stem cuttings. Further research is required to determine if planting stem-cuttings can improve early vigor. Upon cutting, all living mulches exhibited signs of stress and at times, they dried up after the first mowing. The negative impact of mowing was substantially lower in gliricidia compared with the other living mulch species, and gliricidia was always quickest to regrow. This was expected since, in many parts of Asia, gliricidia is a popular multipurpose shrub used in hedge rows and agroforestry systems, valued for its ability to withstand frequent lopping [42]. Root length of the living mulches was not measured; however, casual field observations indicated that at all sites, gliricidia had deep roots. At Site 3, gliricidia stands survived the dry conditions until early March.

3.3.3. Sorghum Sudan Grass

The performance of sorghum sudan grass was not acceptable at any of the four sites; emergence was unreliable and stand densities were erratic (Table 6). In Site 1-Year 1 and Site 3, establishment and initial stands were satisfactory but vigor declined quickly, resulting in patchy stands by mid-season. Sorghum sudan grass produced 17 and 14 tons ha−1 at Sites 1 and 2, respectively, during Year 1 (Table 6). But these were from a small number (46 and 8 plants m−2 at Site 1 and Site 2, respectively) of large plants, which were unable to provide sufficient soil cover, leading to high weed pressure (55 and 59% weed cover at Site 1 and Site 2, respectively).
Sorghum sudan grass was planted twice in Site 2-Year 1 and in Site 1-Year 2, sorghum sudan grass failed to establish even after it was planted three times. At Site 3, more than 80% cover was attained in 20 to 30 days (Table 2) but this stand deteriorated 20 to 25 days later. Average weed cover in sorghum sudan grass plots at this site was 28%, which was greater (p = 0.002) compared with other treatments (Table 6). At Site 3, cotton yield from sorghum sudan grass (456 kg ha−1) was lower (p = 0.045) than that from the control (744 kg ha−1). Even though not a major crop, grain sorghum [Sorghum bicolor (L.) Moench ssp. bicolor] is widely cultivated in the Vidarbha region and tolerates both drought and water-logged conditions. Hence, the reason for the poor emergence and establishment of sorghum sudan grass in our study is not clear. Perhaps, our method of planting the seeds manually in shallow furrows may not have been appropriate for sorghum sudan grass.

3.3.4. Sunnhemp

Sunnhemp was the most reliable living mulch species and exhibited excellent emergence, establishment, biomass production and weed suppression (Table 2 and Table 6). Average ground cover across sites for sunnhemp was 79% in Year 1 and 84% in Year 2. Sunnhemp canopy was uniformly dense from the soil level to the top and this provided a consistent cover following mowing. The erect growth habit of sunnhemp not only simplified mowing but also minimized disturbance to the cotton canopy. The erect feature of another Crotalaria species, slender leaf rattlebox (Crotalaria ochroleauca G. Don), has been considered when selecting companion plants for food crops [29]. During Year 2, across all sites, sunnhemp maintained 87% cover even after being cut back three times. However, recovery from mowing was poor in Site 1-Year 1. Other studies using sunnhemp as a green manure crop have reported five clippings within a five-month dry period [21]. So, our contrasting results were perhaps due to the combination of dry conditions during Year 1 and the use of flail mowing. However, before the sunnhemp stands dried up in mid-August, weed cover in these plots (0.3%) was lower (p = 0.012) than in any other treatment.
At Site 3, sunnhemp produced more than 65 tons ha−1 of fresh biomass with more than 95% cover in every replicate plot and averaged 13 tons ha−1 of dry matter. Up to 100 tons ha−1 of fresh biomass (17 tons ha−1 dry matter) was produced in one sunnhemp plot. In an earlier study conducted in Asia, 7.7 tons ha−1 of sunnhemp dry matter was reported to contain 210 kg ha−1 of fixed nitrogen [21]. In our trials, if sunnhemp, which averaged more than 8 tons ha−1 of dry matter in Year 2, had fixed nitrogen similarly, its contribution would have been more than twice the recommended amount for cotton. Wortmann et al. [43] had previously considered nitrogen concentration in sunnhemp tissue (dry, aboveground) to be 2.6%. Using this estimate, the sunnhemp biomass in our trials contained, on average, approximately 200 kg ha−1 of nitrogen.
Average weed cover in sunnhemp plots across all trial sites during Year 2 was only 14%. In Site 1-Year 2, a weed cover of 48%, recorded when sunnhemp stands achieved 80% ground cover (Table 2), was reduced to 9% about 30 days later. An earlier study in cotton in the same region had reported however, that intercropped sunnhemp had no effect on weeds [6]. Average weed dry matter, 100 days after cotton planting, in treatment plots with sunnhemp during two years of the experiment, were 0.15 and 0.17 tons ha−1, compared with 0.16 and 0.15 tons ha−1, respectively, from plots without sunnhemp. Differences in results between this study and ours is likely because, in the Blaise [6] study, sunnhemp was grown for a very short period of time (approximately 40 days) and planted later in the season (30-to-35 days after cotton planting), which might have led to poor competition with weeds. Upward movement of weed seeds from deeper soil layers, caused by the inter-row tillage operations (after cotton planting) carried out for planting and incorporation of sunnhemp [44], could also have contributed to increased weed pressure.
A late-planting strategy is usually intended to decrease competition with the cash crop [29], but this compromises many of the soil conserving qualities of living mulches and diminishes their weed suppressive capacity [45]. For example, in the case of slender leaf rattlebox grown as an intercrop, biomass increased by 64% when planted along with the main crop compared with planting three weeks later [29]. In addition to increased biomass production, weed suppression and nitrogen-fixation [41], longer lasting stands increase the C/N ratio of living mulches [46], which delays decomposition and provides a longer period of soil protection.

3.3.5. Mixture

The living mulch mixture treatment produced substantial amounts of biomass (Table 6). During mid-October, average weed cover in the mixture treatment was 20% at Site 2 and 32% at Site 4. Data from Sites 2 and 4 (Year 2) were analyzed together (excluding gliricidia) to study the mixture treatment (Table 7). Weed cover in the mixture treatment was only 16% and was comparable (p = 0.61) to weed cover in sesbania (13%) and sunnhemp (12%) treatments. In case of cotton yield, the mixture (2054 kg ha−1) was not different from the control (2289 kg ha−1) and therefore successful in preventing undue competition with the cotton crop.
Combinations of grasses and legumes have been documented to more effectively suppress weeds compared with cover crop stands of a single species [47]. However, among the living mulch species included in the mixture, sorghum sudan grass did not emerge and so, it did not have any impact on weed suppression. Gliricidia also did not have any considerable effect because its slow initial growth resulted in its suppression by the more aggressive sesbania and sunnhemp. At Site 2, average living mulch cover in the mixture treatment was only 53% (Table 6) and this was probably due to the absence of sorghum sudan grass and the poor vigor of gliricidia in the mixture stands.

4. Conclusions

Effective weed control using reduced tillage and green manure practices in the cotton-growing Vidarbha region of central India have been previously reported [6,7]. However, cotton yield declines were observed when inter-row tillage was eliminated in the absence of green manures [7]. This is because surface residue or intercrops can be key components in these systems [30]. Another reason to have living mulches is to improve weed control. Current weed control practices in Vidarbha, which center around frequent inter-row hoeing, not only require excessive time and labor, but they can also be difficult to carry out in a timely manner. Soil degradation from these tillage practices is yet another concern.
In our experiments, sesbania and sunnhemp were able to provide quick and long-lasting soil cover, while precluding inter-row tillage operations. Sorghum sudan grass showed poor establishment, along with undue competition with cotton. Gliricidia was too slow in establishment with little capacity for weed suppression. And the mixture treatment, in terms of vigor and weed suppression, did not perform as well as sesbania or sunnhemp alone. Minimum row spacing for cotton should be 150 cm and appropriate planting time for living mulches should be immediately before or after cotton planting. While the living mulches did not affect the cotton crop too severely, an increase in the distance between the cotton and living mulch rows from 30 to 40 cm in our trials, to about 50 cm might be advantageous in further reducing disturbance to the cotton canopy. Irrigation might be essential to prevent excessive living mulch-cotton competition, and absence of extended drought may be essential for adequate living mulch vigor and recovery. Selection of the mowing device may also be an important factor for quick living mulch recovery and maintenance of living mulch vigor. The cuts made by the device, especially during drier years, must be as clean as possible in order to facilitate quicker living mulch healing and regrowth, and to preclude disease infections. So, rotary metal blades or sickle bar type mowing attachments might be a better choice than flail type blades. Findings from our two-year, multi-location field trials reveal that long duration companion cropping in cotton cultivation in the Vidarbha region can provide substantial amounts of plant residue and prolonged surface cover without compromising cotton yield, while simultaneously providing adequate weed suppression especially during years when water is not limiting.

Acknowledgments

We acknowledge the valuable help and co-operation of the faculty and staff at PDKV University. We are also immensely grateful to the growers who allowed us to work on their farms. We thank the Tata-Cornell Initiative for Agriculture and Nutrition (now TCi) for their financial support.

Author Contributions

V.B., R.R.B and M.F.W. conceived and designed the experiments; V.B. and R.R.B. performed the experiments; V.B. analyzed the data; V.B. wrote the paper; A.D. reviewed multiple iterations of the paper.

Conflicts of Interest

The authors declare no conflict of interest.

References

  1. Tiessen, H.; Feller, C.; Sampaio, E.V.S.B.; Garin, P. Carbon sequestration and turnover in semiarid savannas and dry forest. Clim. Chang. 1998, 40, 105–117. [Google Scholar] [CrossRef]
  2. Blaise, D.; Ravindran, C.D. Influence of tillage and residue management on growth and yield of cotton grown on a vertisol over 5 years in a semi-arid region of India. Soil Tillage Res. 2003, 70, 163–173. [Google Scholar] [CrossRef]
  3. Hulugalle, N.R.; Scott, F. A review of the changes in soil quality and profitability accomplished by sowing rotation crops after cotton in Australian Vertosols from 1970 to 2006. Aust. J. Soil Res. 2008, 46, 173–190. [Google Scholar] [CrossRef]
  4. Causarano, H.J.; Franzluebbers, A.J.; Reeves, D.W.; Shaw, J.N. Soil organic carbon sequestration in cotton production systems of the southeastern United States: A review. J. Environ. Qual. 2006, 35, 1374–1383. [Google Scholar] [CrossRef] [PubMed]
  5. Burnett, E. Land and water management practices for vertisols. In Management of Vertisols for Improved Agricultural Production, Proceedings of an International Board for Soil Research and Management Inaugural Workshop, ICRISAT, Patancheru, Andhra Pradesh, India, 18–22 February 1985; Burford, J.R., Sahrawat, K.L., Eds.; ICRISAT Center: Delhi, India, 1985; pp. 133–145. [Google Scholar]
  6. Blaise, D. Tillage and green manure effects on Bt transgenic cotton (Gossypium hirsutum L.) hybrid grown on rainfed Vertisols of central India. Soil Tillage Res. 2011, 114, 86–96. [Google Scholar] [CrossRef]
  7. Blaise, D. Effect of tillage systems on weed control, yield and fibre quality of upland (Gossypium hirsutum L.) and Asiatic tree cotton (G. arboreum L.). Soil Tillage Res. 2006, 91, 207–216. [Google Scholar] [CrossRef]
  8. Constable, G.A.; Rochester, I.J.; Daniells, I.G. Cotton yield and nitrogen requirement is modified by crop rotation and tillage method. Soil Tillage Res. 1992, 23, 41–59. [Google Scholar] [CrossRef]
  9. Hulugalle, N.R.; Lobry de Bruyn, L.A.; Entwistle, P. Residual effects of tillage and crop rotation on soil properties, soil invertebrate numbers and nutrient uptake in an irrigated Vertisol sown to cotton. Appl. Soil Ecol. 1997, 7, 11–30. [Google Scholar] [CrossRef]
  10. Triplett, G.B.; Dabney, S.M.; Siefker, J.H. Tillage systems for cotton on silty upland soils. Agron. J. 1996, 88, 507–512. [Google Scholar] [CrossRef]
  11. Ofori, F.; Stern, W.R. Cereal-legume intercropping systems. Adv. Agron. 1987, 41, 41–90. [Google Scholar]
  12. Seibert, A.C.; Pearce, R.B. Growth analysis of weed and crop species with reference to seed weight. Weed Sci. 1993, 41, 52–56. [Google Scholar]
  13. Westoby, M.; Leishman, M.; Lord, J.; Poorter, H.; Schoen, D.J. Comparative ecology of seed size and dispersal. Philos. Trans. R. Soc. B Biol. Sci. 1996, 351, 1309–1318. [Google Scholar] [CrossRef]
  14. Liebman, M.; Davis, A.S. Integration of soil, crop and weed management in low-external-input farming systems. Weed Res. 2000, 40, 27–47. [Google Scholar] [CrossRef]
  15. Weiner, J. Asymmetric competition in plant populations. Trends Ecol. Evol. 1990, 5, 360–364. [Google Scholar] [CrossRef]
  16. Teasdale, J.R.; Brandsæter, L.O.; Calegari, A.; Skora, N.F. Cover crops and weed management. In Non-chemical Weed Management: Principles, Concepts and Technology; Upadhyaya, M.K., Blackshaw, R.E., Eds.; CAB International: Oxfordshire, UK, 2007; pp. 49–64. [Google Scholar]
  17. Blackshaw, R.E.; Anderson, R.L.; Lemerle, D. Cultural weed management. In Non-Chemical Weed Management: Principles, Concepts and Technology; Upadhyaya, M.K., Blackshaw, R.E., Eds.; CAB International: Oxfordshire, UK, 2007; pp. 35–48. [Google Scholar]
  18. Teasdale, J.; Daughtry, C. Weed suppression by live and desiccated hairy vetch (Vicia villosa). Weed Sci. 1993, 41, 207–212. [Google Scholar]
  19. Teasdale, J.R.; Mohler, C.L. The quantitative relationship between weed emergence and the physical properties of mulches. Weed Sci. 2000, 48, 385–392. [Google Scholar] [CrossRef]
  20. Onim, J.F.M.; Mathuva, M.; Otieno, K.; Fitzhugh, H.A. Soil fertility changes and response of maize and beans to green manures of leucaena, sesbania and pigeonpea. Agrofor. Syst. 1990, 12, 197–215. [Google Scholar] [CrossRef]
  21. Ladha, J.K.; Kundu, D.K.; Angelo-Van Coppenolle, M.G.; Carangal, V.R.; Peoples, M.B.; Dart, P.J. Legume productivity and soil nitrogen dynamics in lowland rice-based cropping systems. Soil Sci. Soc. Am. J. 1996, 60, 183–192. [Google Scholar] [CrossRef]
  22. Customized Rainfall Information System. India Meteorological Department. Available online: Http://hydro.imd.gov.in/hydrometweb/(S(3cr4xaryukys30fi4sens2em))/landing.aspx (accessed on 14 September 2017).
  23. Challa, O.; Vadivelu, S.; Sehgal, J. Soils of Maharashtra for Optimising Land Use; National Bureau of Soil Survey and Land Use Planning: Nagpur, India; NBSS Publishing: Nagpur, India, 1995; pp. 25–49. [Google Scholar]
  24. Hearn, A.B. Response of cotton to water and nitrogen in a tropical environment. II. Date of last watering and rate of application of nitrogen fertilizer. J. Agric. Sci. 1975, 84, 419–430. [Google Scholar] [CrossRef]
  25. Meisinger, J.J.; Hargrove, W.L.; Mikkelsen, R.L.; Williams, J.R.; Benson, V.W. Effects of cover crops on groundwater quality. In Cover Crops for Clean Water, Proceedings of an International Conference, West Tennessee Experiment Station, Jackson, TN, USA, 9–11 April 1991; Hargrove, W.L., Ed.; Soil and Water Conservation Society: Ankeny, IA, USA, 1991; pp. 793–799. [Google Scholar]
  26. Palm, O.; Weerakoon, W.L.; Silva, M.A.P.; Rosswall, T. Nitrogen mineralization of Sesbania sesban used as green manure for lowland rice in Sri Lanka. Plant Soil 1988, 108, 201–209. [Google Scholar] [CrossRef]
  27. Scarsbrook, C.E.; Bennett, O.L.; Pearson, R.W. The interaction of nitrogen and moisture on cotton yields and other characteristics. Agron. J. 1959, 51, 718–721. [Google Scholar] [CrossRef]
  28. Thomas, G.W.; Blevins, R.L.; Phillips, R.E.; McMahon, R.L. Effect of a killed sod mulch on nitrate movement and corn yield. Agron. J. 1973, 65, 736–739. [Google Scholar] [CrossRef]
  29. Fischler, M.; Wortmann, C.S.; Feil, B. Crotalaria (C. ochroleuca G. Don.) as a green manure in maize-bean cropping systems in Uganda. Field Crop. Res. 1999, 61, 97–107. [Google Scholar] [CrossRef]
  30. Lal, R. No-tillage effects on soil properties and maize (Zea mays L.) production in Western Nigeria. Plant Soil 1974, 40, 321–331. [Google Scholar] [CrossRef]
  31. Morris, R.A.; Furoc, R.E.; Rajbhandari, N.K.; Marqueses, E.P.; Dizon, M.A. Rice response to waterlog-tolerant green manures. Agron. J. 1989, 81, 803–809. [Google Scholar] [CrossRef]
  32. Graglia, E.; Melander, B.; Jensen, R.K. Mechanical and cultural strategies to control Cirsium arvense in organic arable cropping systems. Weed Res. 2006, 46, 304–312. [Google Scholar] [CrossRef]
  33. Ballare, C.L.; Sánchez, R.A.; Scopel, A.L.; Casal, J.J.; Ghersa, C.M. Early detection of neighbour plants by phytochrome perception of spectral changes in reflected sunlight. Plant Cell Environ. 1987, 10, 551–557. [Google Scholar] [CrossRef]
  34. Brainard, D.C.; Bellinder, R.R.; DiTommaso, A. Effects of canopy shade on the morphology, phenology and seed characteristics of powell amaranth (Amaranthus powellii). Weed Sci. 2005, 53, 175–186. [Google Scholar] [CrossRef]
  35. Schmitt, J. Is photomorphogenic shade avoidance adaptive? Perspectives from population biology. Plant Cell Environ. 1997, 20, 826–830. [Google Scholar] [CrossRef]
  36. Sultan, S.E. Phenotypic plasticity for plant development, function and life history. Trends Plant Sci. 2000, 5, 537–542. [Google Scholar] [CrossRef]
  37. Causin, H.F.; Wulff, R.D. Changes in the responses to light quality during ontogeny in Chenopodium album. Can. J. Bot. 2003, 81, 152–163. [Google Scholar] [CrossRef]
  38. Koskinen, W.C.; McWhorter, C.G. Weed control in conservation tillage. J. Soil Water Conserv. 1986, 41, 365–370. [Google Scholar]
  39. Gallandt, E.R.; Fuerst, E.P.; Kennedy, A.C. Effect of tillage, fungicide seed treatment and soil fumigation on seed bank dynamics of wild oat (Avena fatua). Weed Sci. 2004, 52, 597–604. [Google Scholar] [CrossRef]
  40. Gallandt, E.R. How can we target the weed seedbank? Weed Sci. 2006, 54, 588–596. [Google Scholar] [CrossRef]
  41. Mengistu, S.; Keftasa, D.; Yami, A. Productivity of four sesbania species on two soil types in Ethiopia. Agrofor. Syst. 2002, 54, 235–244. [Google Scholar] [CrossRef]
  42. Liyanage, M.D.S. Gliricidia: A multipurpose leguminous tree. J. Natl. Inst. Plant Manag. 1989, 9, 1–6. [Google Scholar]
  43. Wortmann, C.S.; Isabirye, M.; Musa, S. Crotalaria ochroleuca as a green manure crop in Uganda. Afr. Crop Sci. J. 1994, 2, 55–61. [Google Scholar] [CrossRef]
  44. Mohler, C.L.; Frisch, J.C.; McCulloch, C.E. Vertical movement of weed seed surrogates by tillage implements and natural processes. Soil Tillage Res. 2006, 86, 110–122. [Google Scholar] [CrossRef]
  45. Brainard, D.C.; Bellinder, R.R. Weed suppression in a broccoli–winter rye intercropping system. Weed Sci. 2004, 52, 281–290. [Google Scholar] [CrossRef]
  46. Vanlauwe, B.; Diels, J.; Sanginga, N.; Merckx, R. Residue quality and decompostion: An unsteady relationship? In Driven by Nature: Plant Litter Quality and Decomposition; Cadisch, G., Giller, K., Eds.; CAB International: Wallingford, Oxon, UK, 1996; pp. 157–166. [Google Scholar]
  47. Liebman, M.; Dyck, E. Crop rotation and intercropping strategies for weed management. Ecol. Appl. 1993, 3, 92–122. [Google Scholar] [CrossRef] [PubMed]
Figure 1. Relationship (linear regression, α = 0.05) between cotton yield and living mulch biomass during Year 1. All treatments and trial sites are represented.
Agriculture 08 00019 g001
Figure 2. Relationship (linear regression, α = 0.05) between cotton yield and living mulch biomass during Year 2. Only data from sesbania and sunnhemp treatments are represented. Site 3 has been excluded.
Agriculture 08 00019 g002
Figure 3. Relationship (linear regression, α = 0.05) between cotton yield and living mulch biomass during Year 2. Only data from sesbania and sunnhemp treatments (all trial sites) are represented.
Agriculture 08 00019 g003
Table 1. Living mulch treatments used at each trial site during the two trial years. Cotton seeding rates and planting patterns are also listed a,b,c.
Cotton Treatment
YearSiteRow SpacingPlant SpacingPlants Per HillControl [-]Sesbania [46]Gliricidia [79]SS Grass [29]Mixture [62]Sunnhemp [57]
m
111.50.612 XX-X-X
21.50.612XX-X-X
211.50.612 XXX DNE-X
21.20.461XXDNE-XX
31.50.461XXX X-X
41.50.461XXX -XX
a Abbreviations: DNE, did not establish; SS grass, sorghum sudan grass. b ‘X,’ treatment was planted; ‘-,’ treatment was NOT planted; Sites 3 and 4, and treatments gliricidia, mixture and lablab, were not used during Year 1. c Living mulch seeding rates (kg ha−1) are shown in brackets next to each species.
Table 2. Cotton and living mulch planting dates at each site-year. Number of days required by living mulches to achieve 80% surface cover is also shown, along with corresponding living mulch stand density and weed cover at that time. Total number of clippings is also listed a,b,c.
TreatmentYearSiteCotton PlantingLiving Mulch PlantingTime to Attain 80% CoverLiving Mulch DensityWeed CoverNo. of Clippings
(Days)(Plants m−2)(%)
Sesbania1121 June21 June25 to 40144331
212 June17 June25 to 3557DNC2
2112 June17 June20 to 25DNC162
26 June20 June20 to 25190103
314 June23 June20 to 2519384
4Mid May6 July30 to 35308112
Gliricidia11NP
2NP
2112 June17 June100 to 11037171
2DNE
314 June23 June60 to 7068112
4Mid May6 JulyXXX1
SS grass1121 June21 JuneXXX4
25 June17 June60 to 7571552
21DNE
2NP
314 June23 June20 to 308983
4NP
Mixture11NP
2NP
21NP
26 June20 June60 to 7090203
3NP
4Mid May6 July30 to 35142<13
Sunnhemp1121 June21 June20 to 2596<12
25 June17 June25 to 3543DNC2
2112 June17 June25 to 30107482
26 June20 June23 to 28192134
314 June23 June20 to 2518834
4Mid May6 July20 to 3022193
a Abbreviations: DNC, data not collected; DNE, did not establish; SS grass, sorghum sudan grass; X, 80% cover was never attained; NP, treatment was not planted at that site-year. b Control plots had no intercrops; and lablab was evaluated as a marketable vegetable intercrop. Therefore, data from these treatments are not presented here. c Gliricida, mixture and lablab treatments, and Sites 3 and 4 were used only during Year 2.
Table 3. Least squares means of cotton, living mulch and weed parameters from sesbania and sunnhemp data pooled across Years 1 and 2, and Sites 1 and 2 a.
TreatmentLiving Mulch Weed Cotton
Fresh BiomassDry MatterCoverCoverHeightBolls Per PlantYield (lint + seed)
(tons ha−1)(%) b (cm)(kg ha−1)
Control--- - 68 a23 a1809 a
Sesbania18.8 a2.8 a73 ab38 a112 a31 a1540 a
Sunnhemp21.4 a3.9 a85 a17 b119 a32 a1522 a
Std. err.5.10.73642418
a Values within each column not followed by a same letter(s) are significantly different according to Tukey’s test (α = 0.05). b Visual estimations of living mulch and weed cover were made in absolute terms and as such, living mulch and weed cover may not add to 100%.
Table 4. Least squares means of cotton, living mulch and weed parameters from data pooled across Sites 1 and 2 during Year 1 a,b.
TreatmentLiving Mulch Weed Cotton
Fresh BiomassDry MatterCoverCoverHeightBolls Per PlantYield (lint + seed)
(tons ha−1)(%) c (cm)(kg ha−1)
Control--- - 95 a32 a1585 a
Sesbania11.6 a1.6 a67 ab55 a91 a23 a1343 a
SS grass16.2 a2.5 a49 b57 a95 a26 a1315 a
Sunnhemp10.3 a1.5 a79 a16 b95 a28 a1380 a
Std. err.2.50.4711277195
a Abbreviations: SS grass, sorghum sudan grass. b Values within each column not followed by a same letter(s) are significantly different according to Tukey’s test (α = 0.05). c Visual estimations of living mulch and weed cover were made in absolute terms and as such, living mulch and weed cover may not add to 100%.
Table 5. Least squares means of cotton, living mulch and weed parameters from sesbania and sunnhemp data pooled across Sites 1, 2, 3 and 4 during Year 2 a.
TreatmentLiving Mulch Weed Cotton
Fresh BiomassDry MatterCoverCoverHeightBolls Per PlantYield (lint + seed)
(tons ha−1)(%) b (cm)(kg ha−1)
Control--- - 111 b41 a1643 a
Sesbania36.5 a5.3 a73 ab15 a113 ab34 b11476 a
Sunnhemp49.4 a8.2 a84 a13 b125 a32 b11462 a
Std. err.10.61.68449398
a Values within each column not followed by a same letter(s) are significantly different according to Tukey’s test (α = 0.05). b Visual estimations of living mulch and weed cover were made in absolute terms and as such, living mulch and weed cover may not add to 100%.
Table 6. Cotton, living mulch and weed parameters at each site-year a,b,c.
YearSiteTreatmentLiving Mulch Weed Cotton
Fresh BiomassDry MatterCoverCoverHeightBolls Per PlantYield (lint + seed)
(tons ha−1)(%) d (cm)(kg ha−1)
11Control--- - 68 a23 a1492 a
Sesbania14.7 a1.9 a68 ab52 a64 a18 a1052 a
GliricidiaNP
SS grass18.5 a3.1 a61 b 55 a 66 a19 a1212 a
MixtureNP
LablabNP
Sunnhemp9.8 a1.4 a80 a 0 b 70 a20 a1266 a
Std. err.3.40.44.51142.4120
2Control--- - 121 a42 a1666 a
Sesbania7.8 a1.2 a67 ab58 a117 a28 b1689 a
GliricidiaNP
SS grass13.5 a1.8 a34 b 59 a 124 a33 ab1408 a
MixtureNP
LablabNP
Sunnhemp11.4 a1.7 a78 a 38 a 119 a36 ab1488 a
Std. err.1.60.211198.24.3164
21Control--- - 125 bc64 a1265 a
Sesbania19.9 a3.6 a83 a25 a138 ab53 a1148 ab
Gliricidia13.1 b2.5 a52 b26 a116 c61 a818 b
SS grassDNE
MixtureNP
LablabDNC 150 a50 a1354 a
Sunnhemp17.1 ab3.9 a89 a 22 a138 ab49 a1140 ab
Std. err.1.70.746.54593
2Control--- - 145 ab42 a2867 a
Sesbania30.9 b3.9 b70 b15 a127 b24 b2334 a
GliricidiaDNE
SS grassNP
Mixture33.8 b5.7 ab53 c 18 a 133 ab19 b2665 a
LablabDNC126 b21 b2234 a
Sunnhemp5.0 a8.9 a91 a 11 a152 a23 b2176 a
Std. err.30.83.64116.3532
3Control--- - 68 a19 a744 a
Sesbania59.3 ab9.5 ab85 ab7 b64 a17 ab627 abc
Gliricidia42.1 b7.7 b75 b10 b69 a15 bc713 ab
SS grass39.1 b6.2 b48 c28 a63 a12 c456 c
MixtureNP
LablabDNC 68 a15 bc481 c
Sunnhemp79.1 a12.7 a97 a 7 b70 a13 c561 bc
Std. err.614.7351.259
4Control--- - 109 a43 a1792 a
Sesbania35.1 b4.1 b53 a13 a121 a41 a1803 a
Gliricidia7.5 c1.2 b33 bDNC127 a42 a1494 a
SS grassNP
Mixture50.4 a7.4 a55 a 15 a 107 a42 a1532 a
LablabDNC136 a40 a1420 a
Sunnhemp52.3 a7.4 a62 a 14 a141 a42 a1940 a
Std. err.3.40.84.33.68.42161
a Abbreviation: SS grass, sorghum sudan grass; NP, not planted; DNE, did not establish; DNC, data not collected. b Living mulches were not planted in control plots. Living mulch and weed data were not collected from lablab treatment because lablab was evaluated as a marketable vegetable. c In each site-year, values within each column not followed by a same letter(s) are significantly different according to Tukey’s test (α = 0.05). d Visual estimations of living mulch and weed cover were made in absolute terms and as such, living mulch and weed cover may not add to 100%.
Table 7. Least squares means of cotton, living mulch and weed parameters from mixture treatment data pooled across Sites 2 and 4 during Year 2 a.
TreatmentLiving Mulch Weed Cotton
Fresh BiomassDry MatterCoverCoverHeightBolls Per PlantYield (lint + seed)
(tons ha−1)(%) b (cm)(kg ha−1)
Control--- - 125 ab41 a2289 a
Sesbania32.8 b4.1 a62 ab13 a125 ab32 a2066 a
Mixture42.8 a6.7 a55 b16 a119 b31 a2054 a
Sunnhemp50.7 a8.1 a76 a12 b147 a33 a2077 a
Std. err.4.40.582118408
a Values within each column not followed by a same letter(s) are significantly different according to Tukey’s test (α = 0.05). b Visual estimations of living mulch and weed cover were made in absolute terms and as such, living mulch and weed cover may not add to 100%.