Determining the Stability of Sugarcane Filtercake Biochar in Soils with Contrasting Levels of Organic Matter


1
Institute for Resources, Environment and Sustainability, University of British Columbia, Vancouver, BC V6T 1Z4, Canada
2
Departament de Biologia, Sanitat i Medi Ambient, Facultat de Farmàcia i Ciències de l’Alimentació, Universitat de Barcelona, 08028 Barcelona, Spain
3
Centre de Ciència i Tecnologia Forestal de Catalunya, Ctra. de Sant Llorenç de Morunys, km 2, 25280 Solsona, Spain
4
Department of Earth, Ocean and Atmospheric Sciences, University of British Columbia, Vancouver, BC V6T 1Z4, Canada
*
Author to whom correspondence should be addressed.
Agriculture 2018, 8(6), 71; https://doi.org/10.3390/agriculture8060071
Submission received: 18 April 2018
/
Revised: 14 May 2018
/
Accepted: 22 May 2018
/
Published: 26 May 2018
(This article belongs to the Special Issue Biochar and Soil: What Is behind Its Impacts?)
Abstract
:Sugarcane filtercake is a nutrient-rich residue produced prior to sugarcane distillation and is commonly disposed of by applying directly to agricultural fields, often causing high decomposition and leaching rates. Transforming this material into biochar could improve its stability in the soil. In this 92-day incubation study, filtercake biochar produced at 400 °C (BC400) and 600 °C (BC600) was used to trace biochar stability when mixed with two soils with different organic matter levels: an agricultural field (1.2% carbon (C)) and a forest (2.8% C) soil. Based on δ13C isotope analysis, biochar decreases in the field soil mostly occurred in the coarse silt fraction. In contrast, biochar decreases in forest soil appeared to be more equally distributed in all particle size fractions. A negative priming effect in biochar-amended soils was noticeable, mainly in the forest soil. Cumulative CO2 emissions were greater in soils with BC400 than in those with BC600 for both field and forest soils, while adding biochar increased CO2 emissions only in field soils. This increase did not appear to affect native soil organic matter pools. High-temperature filtercake biochar could thus be a more stable alternative to the current practice of raw filtercake applications.
1. Introduction
Soil organic matter (SOM) is essential in providing structure and nutrients to soils. As carbon (C) in SOM comprises 80% of the terrestrial C pool, SOM is considered an important C sink for mitigating the greenhouse effect [1]. It can also be a C source, however, as C is lost to the atmosphere in the form of carbon dioxide (CO2), depending on land use and soil, water, and vegetation management [2]. Adding organic matter (OM) to the soil is considered key in building up SOM, particularly for agricultural soils, which are generally C depleted. However, not all OM is retained in the soil, and OM stability depends on its quality (e.g., more labile sources decompose more quickly than more recalcitrant sources) [3], as well as the soil’s ability to physically stabilize OM.
Biochar is a recalcitrant soil amendment that has received attention in the last few years. Biochar is charcoal derived from pyrolized waste biomass and is considered stable in the long-term [4,5]. It has been shown to improve soil fertility and C sequestration [6], and its use as a soil amendment has been proposed as a strategy for climate change mitigation [7]. Nevertheless, there is uncertainty as to how biochar can affect native soil organic C (SOC) when added to the soil, where it can either stimulate (positive priming) or suppress (negative priming) mineralization of native SOC [8]. Positive priming can occur if microorganisms are stimulated by the presence of biochar contributing additional substrate and/or providing habitat, while negative priming can occur if labile OM is directly sorbed onto and within biochar and/or biochar contributes to its stabilization or protection within soil organo-mineral fractions [9]. Soluble OM components sorbed within biochar micropores are physically protected from mineralization, because microoganisms cannot fit inside the micropores [10]. Understanding the stability of biochar in the soil is of particular interest because it determines the amount of time biochar C is sequestered in the soil, as well as for how long biochar additions might affect soil respiration rates, potentially reducing C emissions from the soil and further mitigating climate change effects. In addition, as a soil amendment, knowing biochar’s stability helps determine how long it can contribute to SOM stabilization [11].
Although short-term studies cannot provide much information on the long-term stability of biochar, they can quantify the labile C fraction of biochar, providing an estimate of how much biochar ultimately is likely to remain in the soil [11]. Less understood is where the biochar C stabilizes in the soil matrix, and whether its stabilization can be driven by microbial or physico-chemical processes. Furthermore, C stabilization varies between soils with different OM content. Several studies have suggested that soils with high OM content have lower C stabilization efficiency when compared with the same soils with low OM content [12,13,14].
In this laboratory incubation study, soils with biochar derived from sugarcane (a C4 plant) filtercake were examined using δ13C isotope analysis. Filtercake is a waste residue produced prior to sugarcane distillation. It is high in nutrients and often applied directly on fields as fertilizer. However, it is rapidly mineralized and can potentially lead to nutrient runoff and eutrophication [15], as well as greenhouse gas emissions [16]. Transforming this nutrient-rich residue into biochar may increase its stability in the soil and slow down microbial activities. While other studies have observed filtercake biochar’s contribution to soil nutrients, plant growth, water retention, and C and nitrogen (N) losses [15,17,18,19,20], here we examined its stability in soil fractions. This study had two objectives: (1) to determine the degree of physical stabilization of biochar C from two filtercake biochars of low and high temperatures in soil fractions of soils with different OM contents; and (2) to determine whether filtercake biochar has synergistic (e.g., positive priming) or antagonistic (e.g., negative priming) effects on microbial activities by measuring respiration rates and stabilization in soil particle size fractions. We expected that the soil with high OM would retain less biochar C, and thus would not have any priming when compared with the low OM soil.
2. Materials and Methods
2.1. Soil Selection and Biochar Production
Soils were collected from an agricultural field and from a holm oak (Quercus ilex L.)-cork oak (Q. suber L.) mixed forest adjacent to the field, located about 60 km northeast of the city of Barcelona, NE Spain (41°41′ N 2°29′ E, 153 m a.s.l.). Both the field and forest soils are Inceptisols based on the USDA soil taxonomy, and developed on schists. The field and forest soils both have a sandy loam texture, pHs of 5.8 and 5.3, and C/N ratios of 11 and 14, respectively, and do not contain carbonates. The topsoil of the agricultural field and the upper mineral layer of the forest soil (top 20 cm for both) were chosen to represent soils with low (1.2% C) and high (2.8% C) OM content, respectively. Soil samples were collected with a spade at several spots in the middle of the field and in the adjacent forest, and mixed together in bags to have representative samples of each soil.
Biochar was commercially produced (SPPT Ltd., Mogi Morim, São Paulo, Brazil) from sugarcane filtercake pyrolyzed at two different temperatures, 400 °C and 600 °C. Biochars of low (BC400) and high (BC600) temperatures of pyrolysis were used to compare biochars of different stability, because biochar becomes more resistant to decomposition with increasing temperatures [21]. BC400 contained 19.3% ± 0.4% C and 1.6% ± 0.04% N, and BC600 contained 23.3% ± 1.2% C and 1.8% ± 0.1% N. Physico-chemical properties of the biochars are further described in Speratti et al. [17,19].
2.2. Laboratory Incubation and CO2 Analysis
Plastic sample cups (100 mL) were filled with 40 g of air-dried soils. Filtercake biochars were applied at a rate of 1.25% by soil weight (equivalent to 17.5 t ha−1 to 10 cm soil depth) into each cup, except for the control soils, which received no biochar. The amount of C added was 2.4 g C kg−1 and 2.9 g C kg−1 for BC400 and BC600, respectively. All substrates were wet to 60% field capacity. The open cups were then placed in 1 L MasonTM jars containing 20 mL of distilled water to maintain a moist atmosphere, together with a second plastic cup containing 15 mL of 0.5 M sodium hydroxide (NaOH) solution to trap CO2. This made for a total of 28 Mason jars: 2 soil types × 3 biochar treatments (soil without biochar, soil + BC400, and soil + BC600) × 4 replicates = 24 plus 4 blanks. The Mason jars were sealed and incubated in a dark room at 33 °C for 91 days. The NaOH solutions were removed for CO2 analysis and immediately replaced with new cups on days 8, 15, 22, 36, 43, 50, and 71. Each time, dissolved inorganic C in the NaOH solution was determined by performing hydrochloric acid (0.5 M HCl) titration and mg CO2-C kg−1 was calculated [22].
2.3. Soil Fractionation and Isotope Analysis
Physical fractionation of soils before and after incubation was performed by wet sieving of soil samples [23]. Before sieving, soil–water suspensions (10 g soil in 15 mL deionized water) were dispersed with an ultrasonic sonifier [24] using a sonicator (Branson Sonifier 250, Emerson Industrial, Ferguson, MO, USA) at a nominal power of 100 W for 5 min. The soil suspensions were then sifted in an electronic sifter (Filtra FT-91) with two sieves of different mesh sizes: >50 µm for sand, 50–20 µm for coarse silt, and <20 µm for fine silt + clay. One milliliter of a saturated solution of aluminum potassium sulfate (AlK(SO4)2) was added per liter of fine silt + clay suspensions to cause the fine silt and clay to precipitate by flocculation. Fractions were then oven dried at 60 °C. Once dried, all fractions were finely ground using an automatic mortar grinder (RM 200, RETSCH, Haan, Germany) and a manual mortar and pestle.
Whole soil samples and soil fractions were analyzed for δ13C on an elemental analysis–isotope-ratio mass spectrometer (Flash 2000 HT, Thermo Fisher Scientific, Bremen, Germany) in order to trace the fate of biochar C in the soils before and after the incubation. The proportional contribution of biochar C in the biochar–soil mixtures and their fractions was calculated by mass balance, taking the δ13C of the biochar and soils as endmember values. The total amount of biochar C (mg Cbc g−1) was then determined from the biochars’ proportional contributions to the total C in the sample, multiplied by the biochar total C, as shown in the equation below [25]:
where δ13Cs represents the soil δ13C, δ13Cbc+s the δ13C of the biochar-soil mixture , δ13Cbc the δ13C of the biochar, and Cbc the biochar total C (mg C g−1).
The amount of C lost from biochar could be determined based on the loss of biochar C during incubation. An estimate of CO2 derived from native soil C was then calculated by subtracting biochar CO2-C from total CO2-C. The priming effect was then estimated as the difference between native CO2 derived from soils amended with biochar and CO2 derived from unamended soils.
2.4. Soil Analysis
Concentrations of dissolved organic C (DOC), ammonium (N-NH4+), nitrate (N-NO3−), and total nitrogen (NH4+ + NO3− + organic N) were determined from 0.5 M K2SO4 soil extracts (1:4 soil/extractant) of pre- and post-incubation soil samples. The colorimetric method after potassium dichromate (K2CrO7) oxidation was used to measure DOC concentration [26]. Total N was determined from extracts mixed with an alkaline persulfate (K2S2O8) solution and autoclaved at 120 °C for 30 min. DOC, mineral N, and total N concentrations were determined using a spectrophotometer (CE7200, Cecil Instruments, Cambridge, England). Dissolved organic N (DON) was calculated as the difference between total N and NO3−-N + NH4+-N [27].
2.5. Statistical Analysis
Percentages of biochar C remaining post-incubation in whole soils and soil fractions were normalized by taking the arcsine of the square root of the values. Significant differences between the percentage of biochar C in whole soils with biochar were then determined by univariate analysis of variance (ANOVA), followed by a post-hoc Tukey test (p < 0.05). Significant differences between biochar C in biochar treatments pre- and post-incubation were determined in the same manner. The effect of soil and biochar on soil properties pre- and post-incubation was determined by ANOVA and, where differences were significant, a post-hoc Tukey test (p < 0.05) was used to compare means. The effect of soil and biochars on cumulative soil respiration was also evaluated by ANOVA, and the increased CO2 was evaluated by one sample t-test (p < 0.05). All statistical analyses were carried out in R version 3.4.1 using RStudio [28]. Values are presented in tables and graphs as means ±1 standard error (S.E.).
3. Results
3.1. Biochar C in the Soils
For field soils amended with BC600, the biochar C content was not statistically different from the start to the end of the incubation. In contrast, forest soils showed large decreases of both biochars (Figure 1).
The amounts of biochar C in soil fractions were similar for both field and forest soils, with the sand fraction having the highest amount, followed by the fine silt + clay fraction, and lastly the coarse silt fraction (Figure 2). There were no significant differences between the two biochar types, but biochar C levels for both decreased significantly (p < 0.05) over time in the field soil’s coarse silt fraction. In contrast, biochar C in the different soil fractions did not vary significantly over time for the forest soil (Figure 2).
3.2. CO2 Fluxes
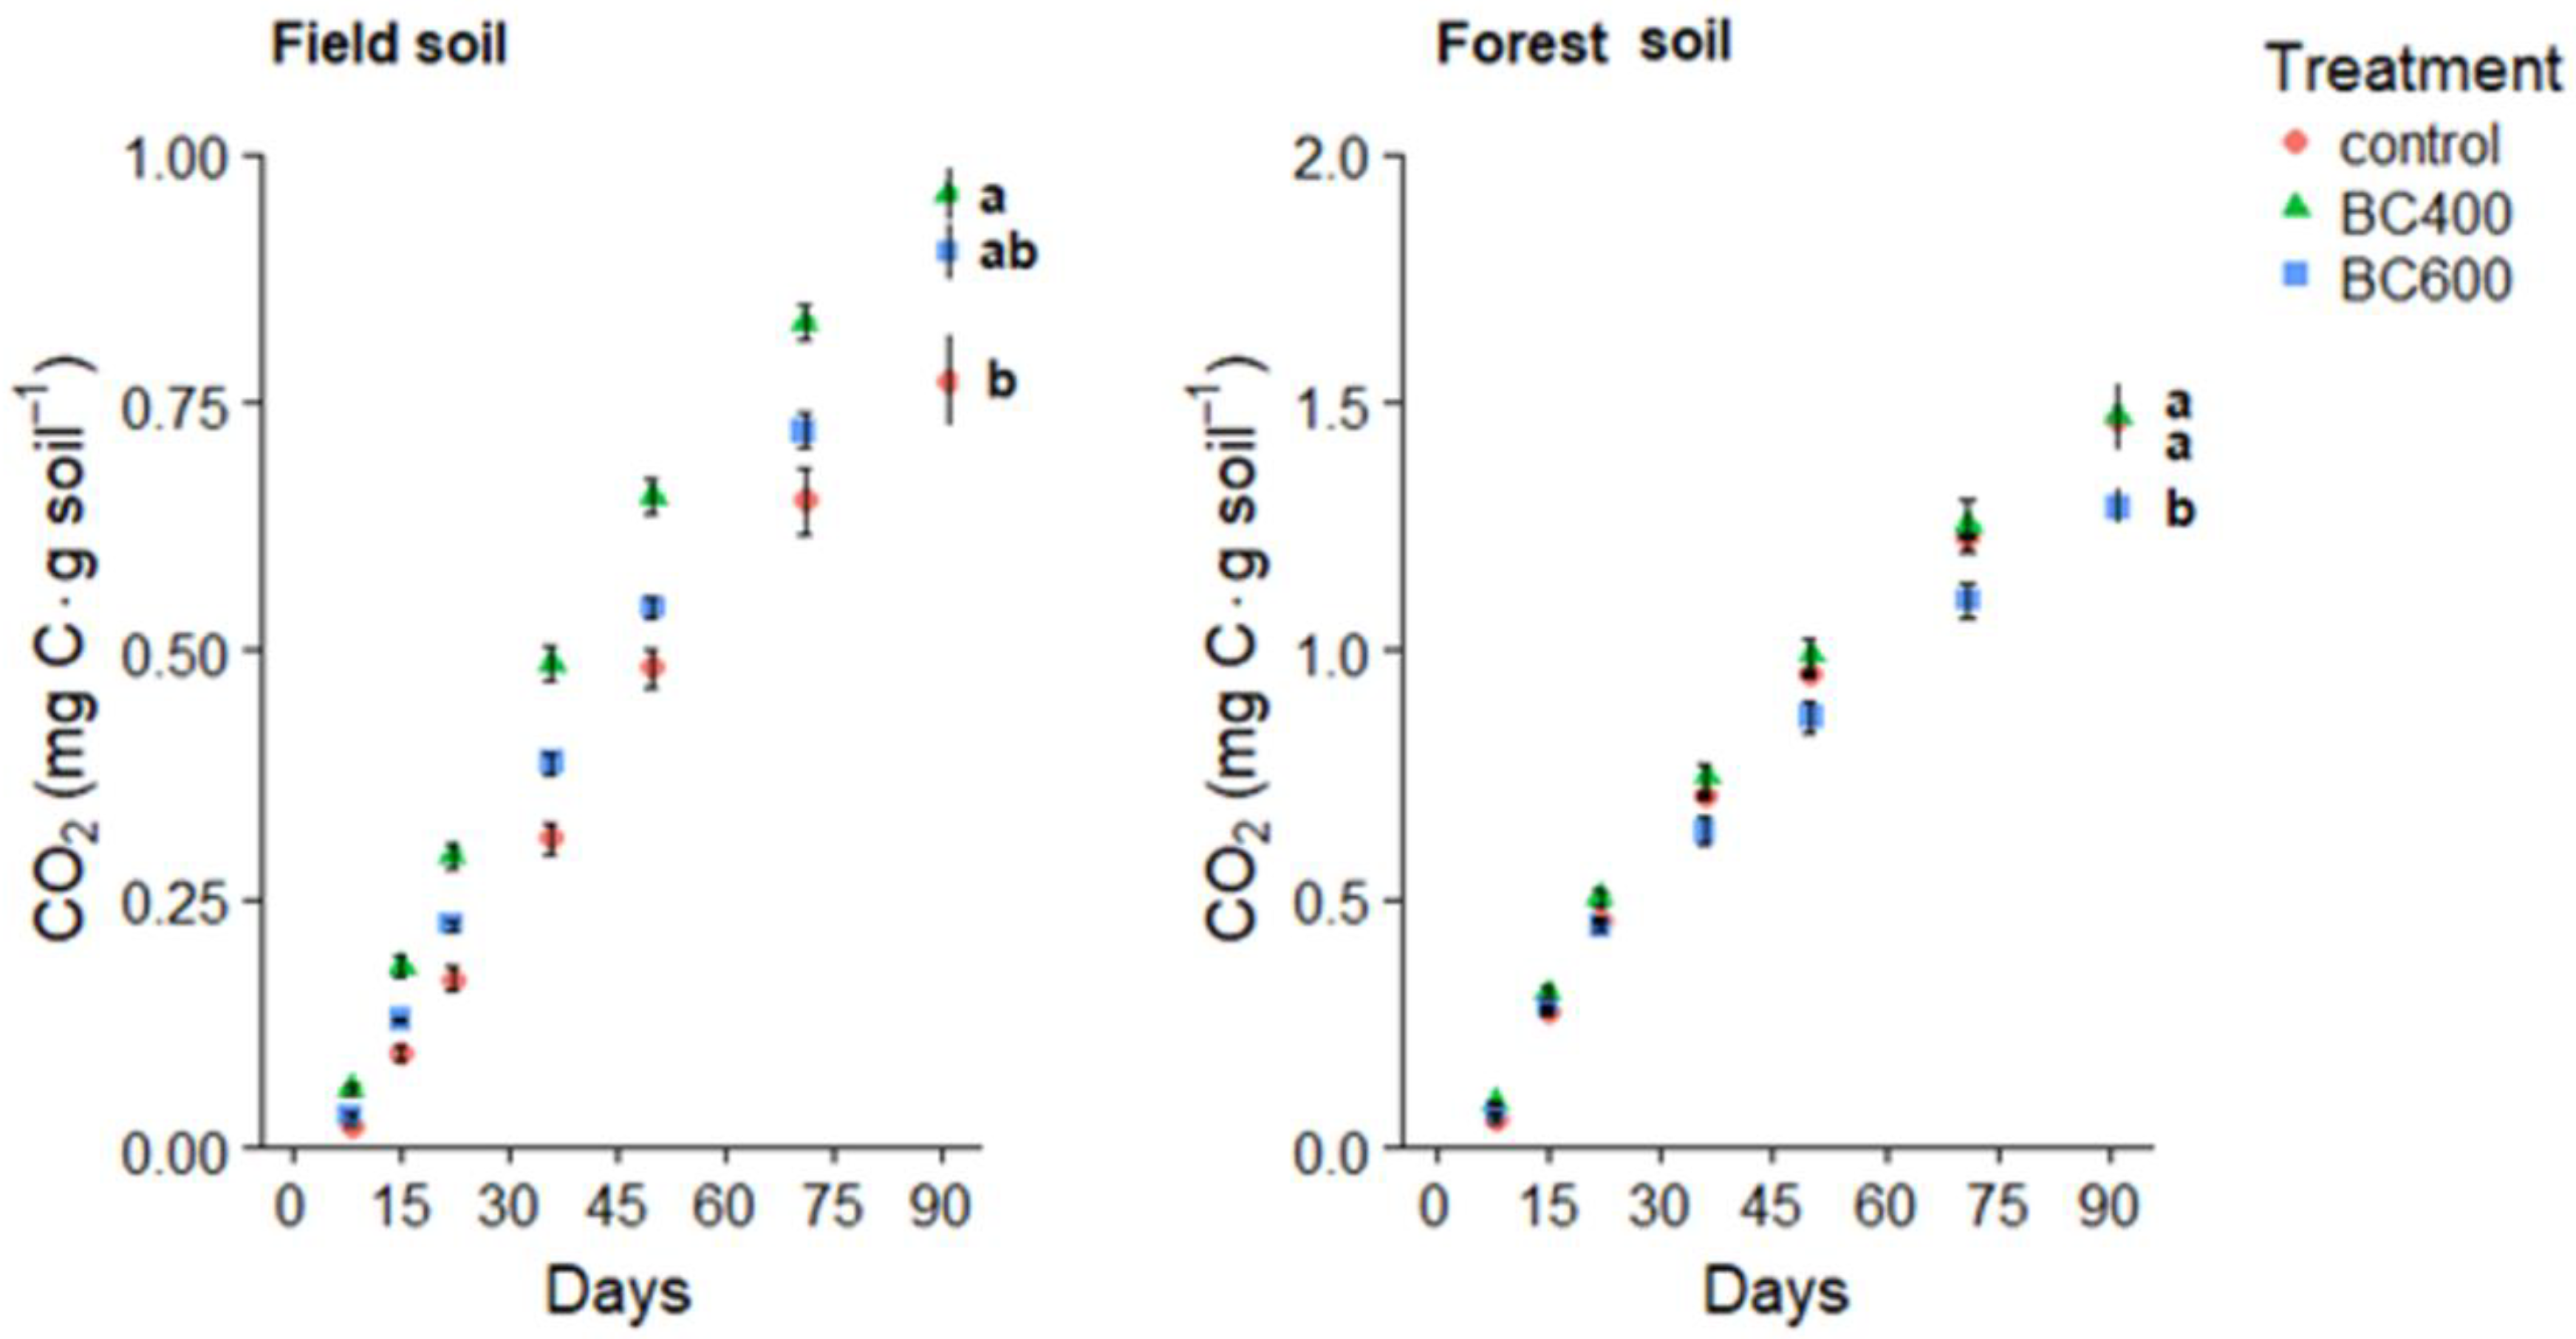
Cumulative CO2 efflux for the agricultural field soil varied significantly (p < 0.05) between BC400 and the control, with BC400 leading to higher CO2 emissions (Table 1). CO2 emissions from soils with BC600 were lower than those from soils with BC400, while greater than those from the control, but not significantly different from either (Figure 3). For the forest soil, BC400 led to significantly greater cumulative CO2 emissions when compared with BC600, but not greater than the control, while BC600 had significantly lower emissions than the control (Figure 3).
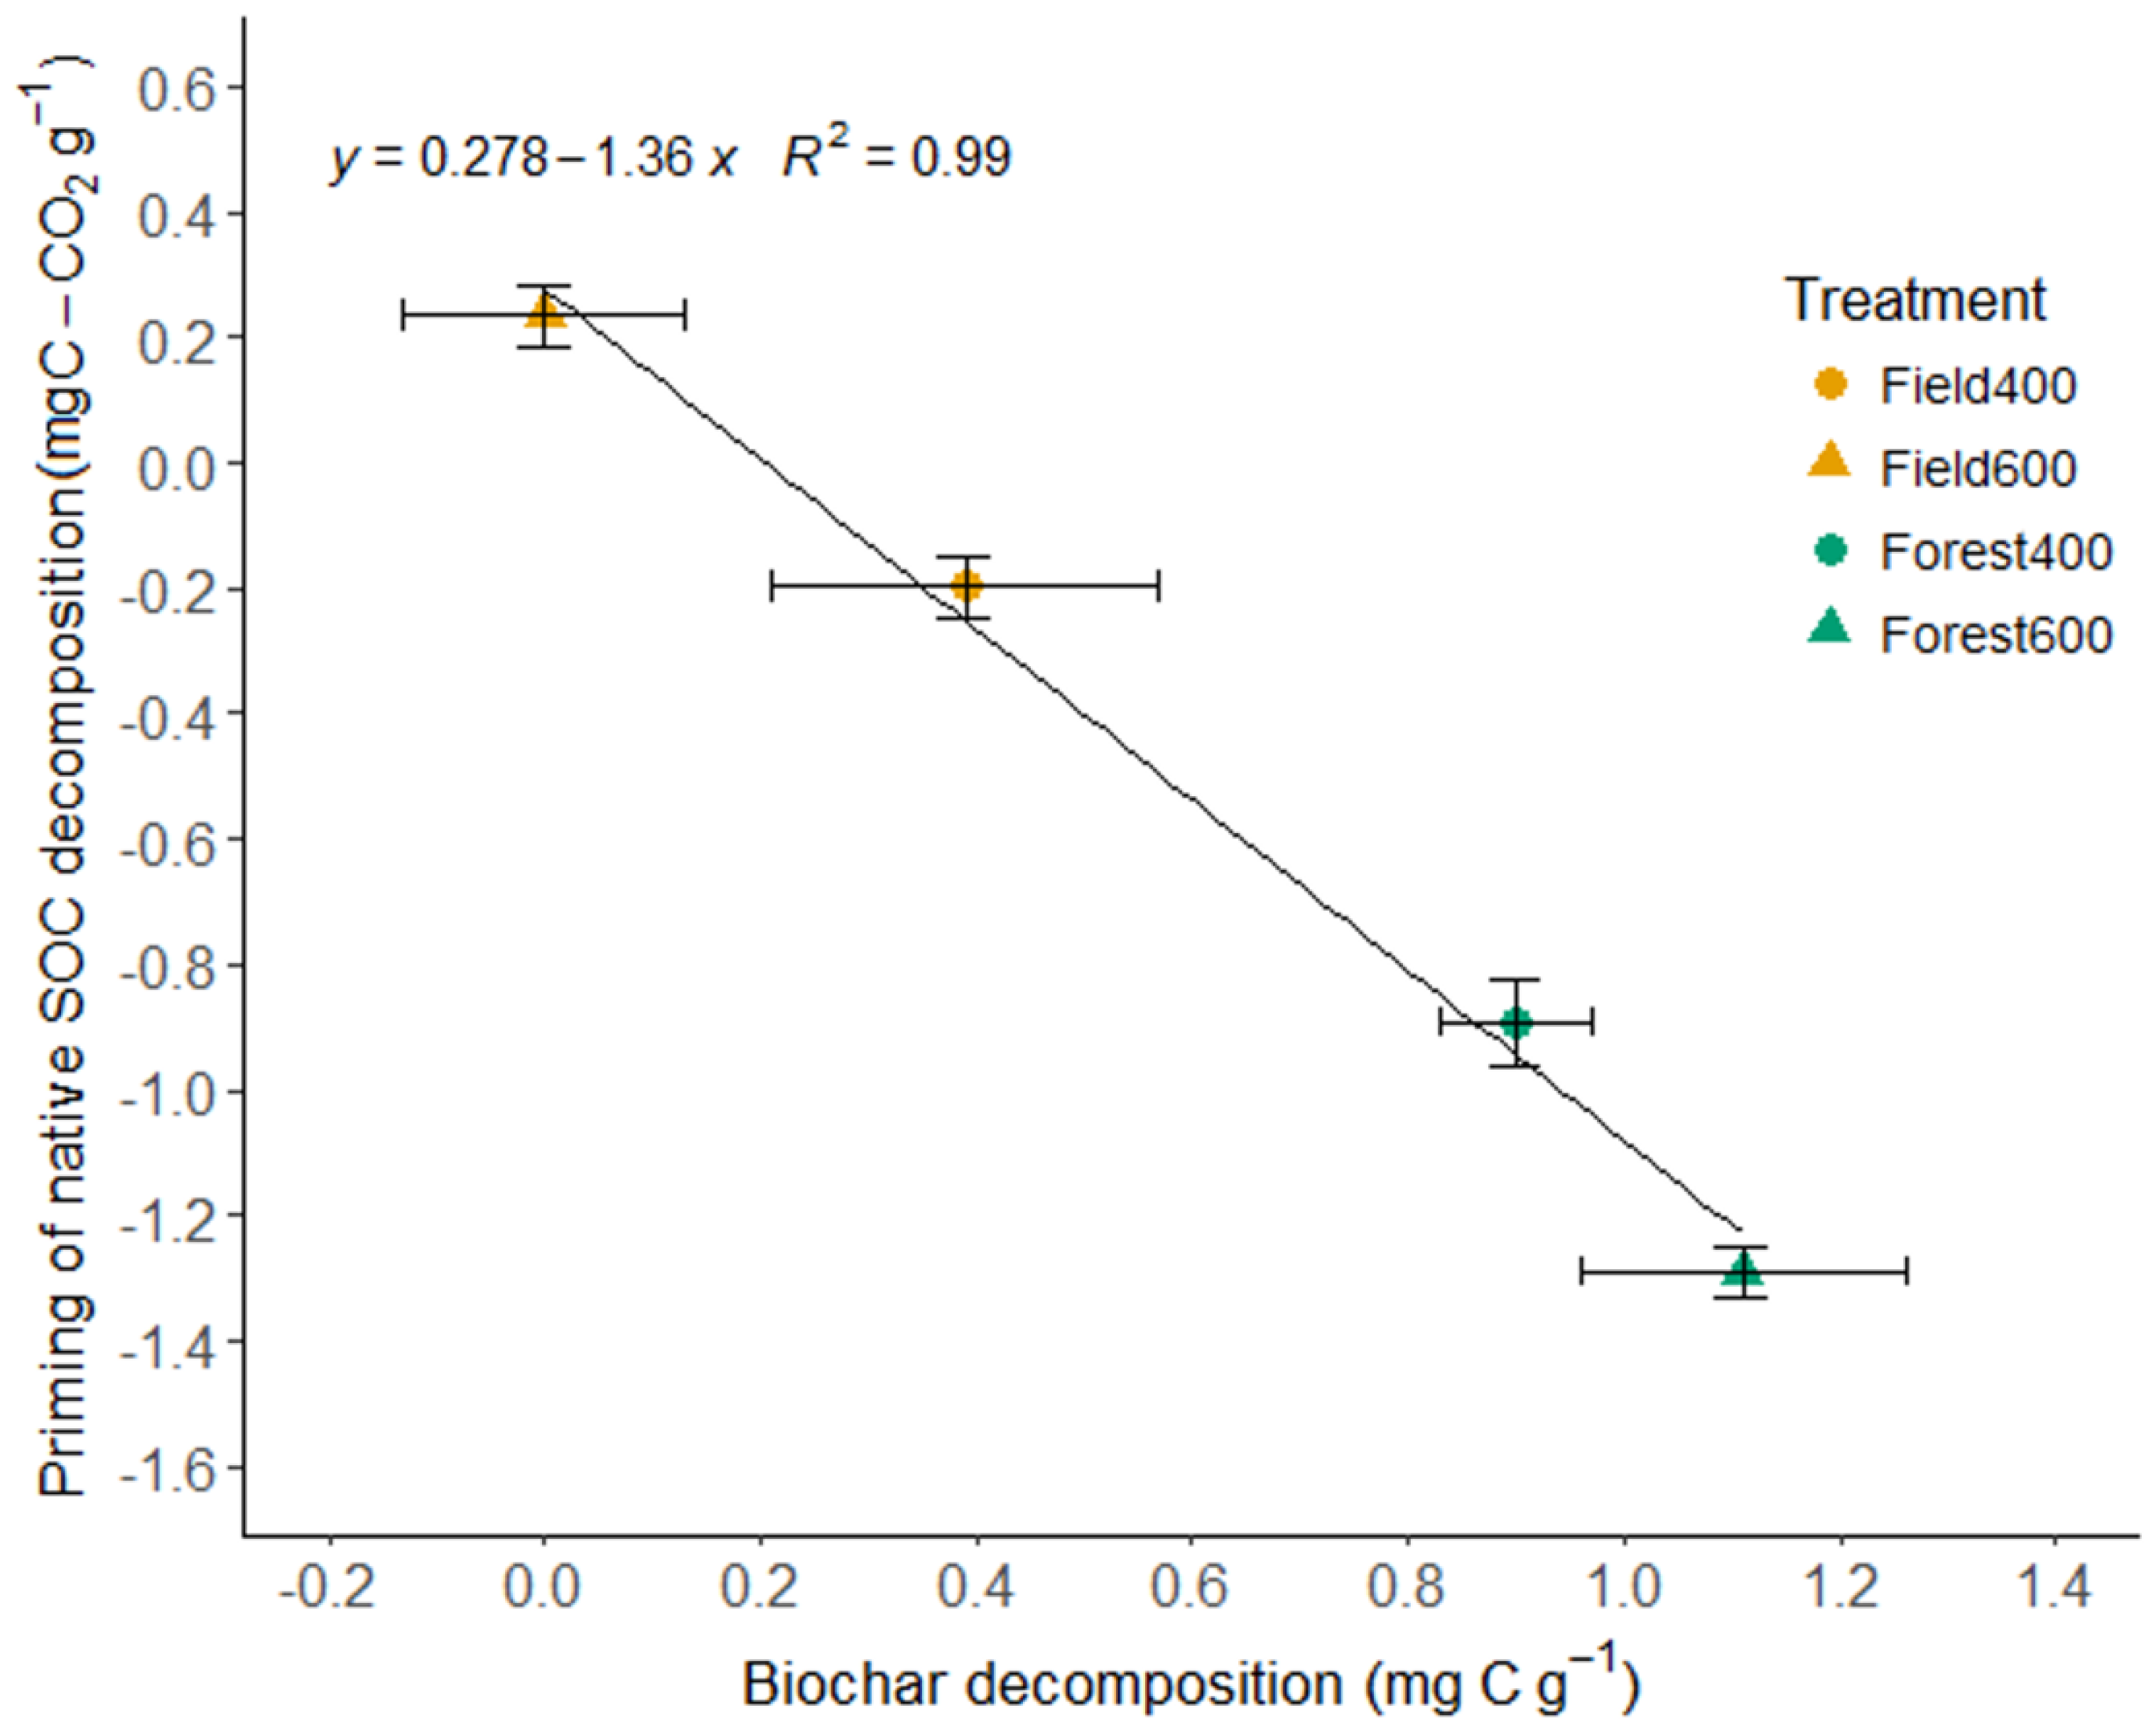
CO2 emissions from the field soil increased by 25% with BC400 and 20% with BC600 compared to the control, while CO2 emissions from the forest soil decreased by 1.7% with BC400 and 14% with BC600. Field soil with BC400 lost 0.58 ± 0.1 mg C g−1 from native SOC, and 0.89 ± 0.1 mg C g−1 with BC600 (Table 2). Forest soils showed large losses of biochar, irrespective of the biochar type. The highest native SOC losses occurred in field soil amended with BC600, and the lowest occurred in the forest soil amended with the same biochar. The negative priming was especially high in the forest soils for both tested biochars, while it was much lower in the field soils. The priming effect linearly decreased with biochar C decomposition (Figure 4).
3.3. Soil Analysis
Soil chemical properties varied significantly, both over time (pre- and post-incubation) and between the biochars (Table 2). Total organic C levels were significantly higher in biochar treatments than in the control for both field and forest soils, but these levels did not vary over time for either soils. Total N levels displayed a similar pattern as total organic C levels with no changes over time. In contrast, mineral N increased with time for both soil types. Extractable NO3− concentrations increased with time and were higher in the field soil’s BC600 treatment when compared with BC400. N mineralization in field soil with BC600 was also higher than with BC400 and coincided with higher levels of DOC.
Both extracted DOC and DON levels reflected mostly a decreasing trend over time for all treatments with the two soil types, although the difference was not always significant (Table 2). DOC in the field soil decreased significantly over time in the BC600 treatment only, whereas it decreased significantly for all treatments in the forest soils, including the control. DON in the field soil decreased significantly over time in the biochar treatments, but not in the control. In the forest soil, DON decreased over time in the control and BC600 treatments, but not in the BC400 treatment. Field soils with BC400 showed similar DOC levels to control soils at the start of the incubation, while DON largely decreased. No differences in N mineralization nor in DOC levels were observed for the forest soils. Net nitrification, ammonification, and N mineralization, along with changes in DOC and DON (post-incubation levels relative to pre-incubation levels), are summarized in Table 3. All tested soils showed positive net N mineralization. In forest soils, biochar addition increased net nitrification and depressed net ammonification. In contrast, in field soils, biochar addition increased net ammonification while net nitrification only occurred in BC600 amended soils.
4. Discussion
4.1. Biochar C Stabilization
In this three-month incubation study, δ13C isotope analysis showed that the amount of biochar C in all soil largely decreased in the forest soil, while in the field soil, it only decreased for soil with BC400. The higher temperature biochar appeared to be more stable than the lower temperature biochar only in the case of field soils. Lower temperature biochars normally have a higher non-aromatic fraction, making them more accessible for microbial activities, such as decomposition, when compared with high-temperature biochars [29]. A previous study showed that BC400 contained more labile C than BC600 because of its lower aromaticity [19]. High-temperature biochars, which have a higher sorptive capacity, have shown lower SOC mineralization, and the decreased SOC mineralization may be associated with biochar’s more recalcitrant fractions [30]. However, the OM-rich forest soil was able to decompose a significant proportion of the added biochars, irrespective of their characteristics, while the differences in biochar quality only affected biochar decomposition in field soils.
Biochar C from both BC400 and BC600 decreased over time in the coarse silt fraction of the field soil, while remaining the same in the forest soil. Biochar C losses may have been more equally distributed in the forest soil fractions, while in the field soil they were concentrated in the coarse silt fraction. Despite its expected higher recalcitrance, BC600 biochar C appeared to be similarly unprotected in the field soil’s coarse silt fraction, contributing to its loss. Somewhat surprisingly, biochar in the unprotected sand fraction did not appear to decompose, especially in the field soil, although the high variability in this fraction may have occluded significant effects.
Decomposition in soils with low OM content that received biochar amendments has been observed to increase when compared with soils with high OM content, because of biochar’s contribution to the microbial habitat and available C. Soils with low OM also contain soil bacteria that are more adapted to nutrient limitations than those in soils with high OM [10,31]. While the addition of labile biochar C may cause decomposition of native SOM, the increased microbial activity can also lead to biochar decomposition, a priming effect known as “co-metabolic decomposition” [10,32]. Total soil respiration rates from field soil with BC400 and BC600 were greater than the control (Figure 3, Table 1) only when the biochar C losses were included. Therefore, for the BC400 treatment, part of the C loss was from the co-metabolic decomposition of biochar, while the soil C losses were much lower than for the control soils. This lowering of native soil C losses was particularly high in the forest soil amended with both biochars when compared with the control, suggesting negative priming, or reduced native soil organic C decomposition, as described by Whitman et al. [30].
In our study, the negative priming strongly and negatively correlated with biochar decomposition (Figure 4), suggesting that biochar co-metabolically substituted native soil substrates in the soil, which were more readily decomposed. Other possible mechanisms for decreases in SOM mineralization can be what has been defined as substrate switching (i.e., where the labile part of biochar is consumed preferentially), and dilution, where the labile biochar is used in addition to labile SOC, contributing to a large available C pool that the microbial population is not yet large enough to fully exploit [33]. Another possible reason for the negative priming may be native SOM stabilization by adsorption into biochar particle pores or sorbed onto its surface, rendering SOM less available to microorganisms [33,34]. We suggest that both biochar C as a substrate substitute and native SOM sorption were likely the main drivers for the observed negative priming in our soils.
4.2. Biochar Effect on Respiration Rates
The high CO2 emissions observed in the field soil with BC400 coincide with the treatment’s low N mineralization, low DOC, and lower decrease in DOC over time when compared with the other soil (Table 2). Microbial activity in the field soil may have been stimulated by unprotected particulate organic matter (POM), likely in the coarse silt fraction (Figure 2). St. Luce et al. [35] noted that N mineralization rates decreased in agricultural soils of different textures with N-poor POM inputs, compared with the same soils with N-rich POM. In our experiment, biochar addition in SOM-poor field soils may have provided an N-rich substrate, particularly BC600 (Table 2), that increased soil respiration. In contrast, in forest soils with higher SOM levels, BC400 and BC600 both decreased native SOC mineralization.
In both the field and forest soils, BC400 treatments had higher mean cumulative CO2 emissions than BC600 treatments (Figure 3). Eykelbosh et al. [15] observed a positive priming effect when applying sugarcane filtercake biochar (575 °C) to a sandy clay-loam Ferralsol in a three-week laboratory experiment. The authors suggested the increased CO2 efflux was a result of the easily degradable residual cellulose and hemicellulose measured in their filtercake biochar. At 400 °C, our BC400 likely also had more residual labile C than BC600, contributing to greater CO2 rates compared with the control in the field soil and with BC600 in the forest soil (Figure 3). Furthermore, biochar’s high porosity can stimulate microbial activity by providing increased suitable habitat and microbe protection within pores [30]. However, as Whitman et al. [30] acknowledge, other mechanisms must take place simultaneously, because higher temperature biochars have a greater surface area and porosity, yet usually cause lower SOC mineralization rates than low temperature biochars. While microorganisms can seek protection from predation in biochar pores, native SOC can also be sorbed into biochar micropores, providing it physical protection from microorganisms and preventing further C mineralization [10]. Biochar microporosity increases with the temperature of pyrolysis [36], creating smaller pores (nm scale) in which microorganisms (µm scale) cannot fit [10]. However, some microorganisms may fit and thus be protected from larger ones. Ameloot et al. [37] observed that CO2 emissions were highest from sandy loam soil with two different biochar feedstocks pyrolyzed at 350 °C, compared with the same two feedstocks pyrolyzed at 700 °C. The 700 °C biochars had a larger average pore size than the 350 °C biochars, which may have increased the protection of small bacteria from bacterial grazers. This might have led to the less active microbial community in the higher temperature biochar treatments. BC600 also had a greater surface area and total micropore area than BC400 [17]. Thus, in our study, greater SOC sorption and small microorganism protection from predation in BC600 treatments may have caused lower total SOC mineralization in both the field and forest soils when compared with BC400 (Figure 3).
N mineralization in the field soils coincided with the increase in cumulative CO2 in the BC600 treatment. In contrast, no increased N mineralization nor CO2 emissions were observed in the biochar-amended forest soils (Table 2). Despite its greater aromaticity [19], the lower SOC and N in the field soil may have led to BC600 providing additional N that stimulated the microbial community, and thus BC600 had a greater increase in cumulative CO2 emissions in the field soil than in the forest soil, with higher native SOC and N (Table 1). Increased CO2 emissions in BC400 amended field soils did not coincide with increases in N mineralization. Thus, these increases may be attributed to the labile C pools of the low temperature biochar. Such increases were not observed in the case of forest soils (Figure 3).
Differences in CO2 emissions between the OM-poor and OM-rich soils may also be related to the microbial communities, with low fungal/bacterial ratios observed in arable soils [38], along with lower microbial biomass when compared with forests and grasslands [39]. In the OM-poor field soil, biochar addition may have stimulated the bacterial population more than in the forest soil (likely by increasing surrounding soil pH, which stimulates bacterial more than fungal growth) [39,40]. This may have also contributed to loss of labile BC400 biochar C in field soils (Table 1). In turn, the higher OM and possibly larger fungal community in the forest soil may have contributed to high biochar C loss due to fungi’s ability to degrade biochar, although their mycelia can also help stabilize biochar in soil aggregates [41]. In soils where organic C is very readily available, biochar additions usually have less of an effect on CO2 evolution [41]. Furthermore, in soils with high organic C, biochar decomposition appeared more distributed among the different particle size fractions when compared with soils with low organic C, where the biochar losses concentrated in the coarse silt fraction (Figure 2).
4.3. Biochar Influence on Soil Chemical Properties
Overall, mean DOC and DON concentrations in our study decreased over time in both soil types (Table 2 and Table 3). DOC concentrations were initially higher in field soils with BC600 when compared with BC400 and control. More DOC in the field soil BC600 treatment may have contributed to its high soil C losses (Table 1), as the increased DOC could provide additional microbial substrate. In contrast, in forest soil, both BC400 and BC600 increased DOC, suggesting that BC400 DOC was also retained in the soil matrix. Yet, increased DOC in forest soil did not increase soil C losses (Table 1).
Examining the DOC fluorescence characteristics of these two filtercake biochars showed that BC400 and BC600 water extracts both contained mostly labile and microbially-derived DOC [19]. However, when mixed with soil, the biochars contributed to different amounts of DOC in biochar–soil leachate. Speratti et al. (2018) found that DOC leachate concentrations in a six-week greenhouse experiment, including these filtercake biochars applied at 5% w/w to a sandy soil, were significantly greater (p < 0.05) for the BC400 treatment (93.7 ± 12.0 mg L−1) than for the BC600 amended soil (20.2 ± 0.9 mg L−1) and the unamended control (44.6 ± 4.8 mg L−1). In addition, DOC components leached from BC400 treatments were mostly labile and of microbial origin, while DOC components from BC600 leachate (which also had the lowest DOC concentrations in leachate) were mostly humic of terrestrial origin [19]. Thus, the DOC in the field soil with BC600 in the present study was likely composed of humic materials that may be decomposed in a forest soil environment, while they may remain partly undecomposed in field soil (Table 2). In contrast, BC400 DOC appeared to be equally decomposed in all tested soils.
While DOC and DON concentrations decreased, N mineralization increased in all treatments at the end of the experiment, mostly from nitrification of NH4+ to NO3− (Table 2 and Table 3). Other studies likewise observed lower NH4+ and greater NO3− at the end of incubation experiments in which biochar was added to sandy [16] and sandy loam [37] soils. N mineralization increases were higher in the forest soil when compared with the field soil (Table 3), consistent with Ameloot et al. [42], who observed that both N mineralization and immobilization with biochar additions were highest in an OM-rich soil when compared with an OM-poor soil. Higher N mineralization and immobilization rates in OM-rich soils compared with OM-poor soils may be a result of higher native SOM and N content available for microbial activity, greater native soil microbial biomass and activity, or a microbial community better adapted to decomposing more resistant biochar compounds (e.g., large fungal population), because the OM-rich soil holds relatively more stable SOM [42]. Final mineral N concentrations did not differ significantly from the controls of each soil, but for the field soil, BC600 had significantly higher mineral N and NO3− concentrations than BC400. This suggests greater N immobilization in the microbial biomass in the BC400 treatment than in BC600, perhaps contributing to its higher respiration rates (Figure 3) and to priming of SOM pools in search of N in the N-poor field soil. A higher proportion of labile C in the BC400 treatment may have resulted in greater demand for inorganic N, thus leading to N immobilization [16]. The forest soil had higher cumulative CO2 emissions from the BC400 treatment when compared with the BC600 (Figure 3), but its N mineralization rates did not vary significantly (p > 0.05), although BC400 had higher NH4+ levels than BC600 (Table 3). The lower NH4+ levels in the forest soil BC600 treatment may have been a result of greater sorption to BC600 [43], lowering the accessibility needed to reduce to NO3−, or the physical entrapment of NH4+ ions in biochar pores [44], with BC600 having greater micropore surface area than BC400 [17]. Singh and Cowie [9] suggest improved nutrient cycling as a positive outcome of short-term biochar-induced positive priming. However, SOC losses in biochar treatments did not increase significantly when compared with the control with no biochar, thus biochar could contribute to stabilizing SOM in these soils.
5. Conclusions
In this short-term biochar–soil incubation study, the amount of biochar C from BC400 in field soil decreased over time compared with biochar C from BC600, in accordance with high temperature biochars being more stable than low temperature biochars. However, forest soils were able to decompose BC600 at similar rates to BC400. Negative priming was higher in the OM-rich forest soil, where a more diverse biochar-decomposing microbial population was likely distributed more evenly among all soil particle size fractions. In contrast, the decomposition of labile biochar C in the OM-poor field soil was concentrated in the coarse silt fraction, and showed low negative priming. In addition, BC600 did not reduce N mineralization in the soil, which is beneficial for crop production in the field. However, adding biochar to an OM-poor soil may contribute to more labile C in the soil, causing a greater synergistic effect on microbial activities that could lead to increased C emissions. In contrast, adding biochar, such as sugarcane filtercake biochar pyrolyzed at 600 °C, to an OM-rich soil may reduce native SOC losses, while potentially increasing inorganic N levels. This study highlights the importance of considering native SOM levels when adding biochar to soil, particularly agricultural soils. Increased C mineralization in OM-poor soils with biochar amendments may occur in the short term, but these increases do not appear to affect native OM pools. The long-term contribution of these sugarcane filtercake biochars to SOC could be beneficial, providing a better alternative to raw filtercake soil applications, but remains to be verified.
Author Contributions
A.B.S. and J.R. conceived and designed the experiment; A.B.S. performed the experiment; A.B.S., J.R., and J.G-P. analyzed the data; M.S.J. contributed biochar and analysis tools; A.B.S. wrote the paper with input from J.R., J.G-P., and M.S.J.
Acknowledgments
The authors thank Anna Saez for assistance with sample weighing, Pilar Rubio for carrying out the δ13C isotope analysis, and Pere Rovira for guidance on soil fractionation. This work was funded by the Natural Sciences and Engineering Research Council of Canada (NSERC) through an NSERC Postgraduate Scholarships-Doctoral award, support through the NSERC-CREATE TerreWEB program, and an Erasmus Mundus-Nova Domus CHEMEDPHO scholarship award, in addition to an NSERC research grant in partnership with the Belmont Forum and the G8 Research Councils Freshwater Security program (G8PJ-437376-2012).
Conflicts of Interest
The authors declare no conflict of interest. The funding sponsors had no role in the design of the study; in the collection, analyses, or interpretation of data; in the writing of the manuscript; and in the decision to publish the results.
References
- Leifeld, J.; Kögel-Knabner, I. Soil organic matter fractions as early indicators for carbon stock changes under different land-use? Geoderma 2005, 124, 143–155. [Google Scholar] [CrossRef]
- Lal, R. Challenges and opportunities in soil organic matter research. Eur. J. Soil Sci. 2009, 60, 158–169. [Google Scholar] [CrossRef]
- Angers, D.A.; Chantigny, M.H.; MacDonald, J.D.; Rochette, P.; Côté, D. Differential retention of carbon, nitrogen and phosphorus in grassland soil profiles with long-term manure application. Nutr. Cycl. Agroecosyst. 2010, 86, 225e229. [Google Scholar] [CrossRef]
- Lehmann, J. A handful of carbon. Nature 2007, 447, 10–11. [Google Scholar] [CrossRef] [PubMed]
- Clough, T.J.; Condron, L.M. Biochar and the nitrogen cycle: Introduction. J. Environ. Qual. 2010, 39, 1218–1223. [Google Scholar] [CrossRef] [PubMed]
- Lehmann, J.; Joseph, S. Biochar for environmental management: An introduction. In Biochar for Environmental Management: Science and Technology; Lehmann, J., Joseph, S., Eds.; Earthscan: London, UK, 2009; pp. 1–12. [Google Scholar]
- Woolf, D.; Amonette, J.E.; Street-Perrott, F.A.; Lehmann, J.; Joseph, S. Sustainable biochar to mitigate global climate change. Nat. Commun. 2010, 1, 56. [Google Scholar] [CrossRef] [PubMed]
- Woolf, D.; Lehmann, J. Modelling the long-term response to positive and negative priming of soil organic carbon by black carbon. Biogeochemistry 2012, 111, 83–95. [Google Scholar] [CrossRef]
- Singh, B.P.; Cowie, A.L. Long-term influence of biochar on native organic carbon mineralisation in a low-carbon clayey soil. Sci. Rep. 2015, 4, 3687. [Google Scholar] [CrossRef] [PubMed]
- Ameloot, N.; Graber, E.R.; Verheijen, F.G.A.; De Neve, S. Interactions between biochar stability and soil organisms: Review and research needs. Eur. J. Soil Sci. 2013, 64, 379–390. [Google Scholar] [CrossRef]
- Lehmann, J.; Czimczik, C.; Laird, D.; Sohi, S. Stability of biochar in the soil. In Biochar for Environmental Management: Science and Technology; Lehmann, J., Joseph, S., Eds.; Earthscan: London, UK, 2009; pp. 183–205. [Google Scholar]
- Six, J.; Conant, R.T.; Paul, E.A.; Paustian, K. Stabilization mechanisms of soil organic matter: Implications for C-saturation of soils. Plant Soil 2002, 241, 155–176. [Google Scholar] [CrossRef]
- Stewart, C.; Paustian, K.; Conant, R.; Plante, A.; Six, J. Soil carbon saturation: Concept, evidence and evaluation. Biogeochemistry 2007, 86, 19–31. [Google Scholar] [CrossRef]
- Kimetu, J.M.; Lehmann, J. Stability and stabilization of biochar and green manure in soil with different organic carbon contents. Aust. J. Soil Res. 2010, 48, 577–585. [Google Scholar] [CrossRef]
- Eykelbosh, A.J.; Johnson, M.S.; Santos de Queiroz, E.; Dalmagro, H.J.; Guimarães Couto, E. Biochar from sugarcane filtercake reduces soil CO2 emissions relative to raw residue and improves water retention and nutrient availability in a highly-weathered tropical soil. PLoS ONE 2014, 9, e98523. [Google Scholar] [CrossRef] [PubMed]
- Abbruzzini, T.F.; Oliveira Zenero, M.D.; de Andrade, P.A.M.; Dini Andreote, F.; Campo, J.; Pellegrino Cerri, C.E. Effects of biochar on the emissions of greenhouse gases from sugarcane residues applied to soils. Agric. Sci. 2017, 8, 869–886. [Google Scholar] [CrossRef]
- Speratti, A.B.; Johnson, M.S.; Martins Sousa, H.; Nunes Torres, G.; Guimarães Couto, E. Impact of different agricultural waste biochars on maize biomass and soil water content in a Brazilian Cerrado Arenosol. Agronomy 2017, 7, 49. [Google Scholar] [CrossRef]
- Speratti, A.B.; Johnson, M.S.; Martins Sousa, H.; Dalmagro, H.J.; Guimarães Couto, E. Biochars from local agricultural waste residues contribute to soil quality and plant growth in a Cerrado region (Brazil) Arenosol. GCB Bioenergy 2017, 12, 3218–3221. [Google Scholar] [CrossRef]
- Speratti, A.B.; Johnson, M.S.; Martins Sousa, H.; Dalmagro, H.J.; Guimarães Couto, E. Biochar feedstock and pyrolysis temperature effects on leachate: DOC characteristics and nitrate losses from a Brazilian Cerrado Arenosol mixed with agricultural waste biochars. J. Environ. Manag. 2018, 211, 256–268. [Google Scholar] [CrossRef] [PubMed]
- Eykelbosh, A.J.; Johnson, M.S.; Couto, E.G. Biochar decreases dissolved organic carbon but not nitrate leaching in relation to vinasse application in a Brazilian sugarcane soil. J. Environ. Manag. 2015, 149, 9–16. [Google Scholar] [CrossRef] [PubMed]
- Kleber, M.; Hockaday, W.; Nico, P.S.; Chia, C.H.; Downie, A.; Munroe, P. Characteristics of biochar: Macro-molecular properties. In Biochar for Environmental Management: Science, Technology, and Implementation; Lehmann, J., Joseph, S., Eds.; Earthscan: New York, NY, USA, 2015; pp. 11–137. [Google Scholar]
- Anderson, J. Soil respiration. In Methods of Soil Analysis. Part 2. Chemical and Microbiological Properties, 2nd ed.; Page, A.L., Ed.; American Society of Agronomy, Inc.; Soil Science Society of America, Inc.: Madison, WI, USA, 1982; pp. 831–871. [Google Scholar]
- Rovira, P.; Jorba, M.; Romanyà, J. Active and passive organic matter fractions in Mediterranean forest soils. Biol. Fertil. Soils 2010, 46, 355–369. [Google Scholar] [CrossRef]
- Edwards, A.P.; Bremner, J.M. Dispersion of soil particles by sonic vibration. J. Soil Water Conserv. 1967, 18, 47–63. [Google Scholar]
- Cerri, C.; Feller, C.; Balesdent, J.; Victoria, R.; Plenecassagne, A. Application du traçage isotopique naturel en 13C, à l’étude de la dynamique de la matière organique dans le sols. C. R. Acad. Sci. Ser. 2 1985, 9, 423–428. [Google Scholar]
- Nelson, D.; Sommers, L. Total carbon, organic carbon and organic matter. In Methods of Soil Analysis. Part 2. Chemical and Microbiological Properties; Page, A.L., Miller, R., Keeney, D., Eds.; American Society of Agronomy, Inc.; Soil Science Society of America, Inc.: Madison, WI, USA, 1982; pp. 539–579. [Google Scholar]
- Cabrera, M.L.; Beare, M.H. Alkaline persulfate oxidation for determining total nitrogen in microbial biomass extracts. Soil Sci. Soc. Am. J. 1993, 57, 1007–1012. [Google Scholar] [CrossRef]
- R Core Team. R: A Language and Environment for Statistical Computing; R Foundation for Statistical Computing: Vienna, Austria, 2017. [Google Scholar]
- Joseph, S.D.; Camps-Arbestain, M.; Lin, Y.; Munroe, P.; Chia, C.H.; Hook, J.; van Zwieten, L.; Kimber, S.; Cowie, A.; Singh, B.P.; et al. An investigation into the reactions of biochar in soil. Aust. J. Soil Res. 2010, 48, 501–515. [Google Scholar] [CrossRef]
- Whitman, T.; Singh, B.; Zimmerman, A. Priming effects in biochar-amended soils: Implications of biochar-soil organic matter interactions for carbon storage. In Biochar for Environmental Management: Science, Technology, and Implementation; Lehmann, J., Joseph, S., Eds.; Routledge: New York, NY, USA, 2015; pp. 455–487. [Google Scholar]
- Steinbeiss, S.; Gleixner, G.; Antonietti, M. Effect of biochar amendment on soil carbon balance and soil microbial activity. Soil Biol. Biochem. 2009, 41, 1301–1310. [Google Scholar] [CrossRef]
- Keith, A.; Singh, B.; Singh, B. Interactive priming of biochar and labile organic matter mineralization in a smectite-rich soil. Environ. Sci. Technol. 2011, 45, 9611–9618. [Google Scholar] [CrossRef] [PubMed]
- Whitman, T.; Enders, A.; Lehmann, J. Pyrogenic carbon additions to soil counteract positive priming of soil carbon mineralization by plants. Soil Biol. Biochem. 2014, 73, 33–41. [Google Scholar] [CrossRef]
- Zimmerman, A.R.; Gao, B.; Ahn, M.Y. Positive and negative carbon mineralization priming effects among a variety of biochar-amended soils. Soil Biol. Biochem. 2011, 43, 1169–1179. [Google Scholar] [CrossRef]
- St. Luce, M.; Whalen, J.K.; Ziadi, N.; Zebarth, B.J. Net nitrogen mineralization enhanced with the addition of nitrogen-rich particulate organic matter. Geoderma 2016, 262, 112–118. [Google Scholar] [CrossRef]
- Downie, A.; Crosky, A.; Munroe, P. Physical properties of biochar. In Biochar for Environmental Management: Science and Technology; Lehmann, J., Joseph, S., Eds.; Earthscan: London, UK, 2009; pp. 13–32. [Google Scholar]
- Ameloot, N.; De Neve, S.; Jegajeevagan, K.; Yildiz, G.; Buchan, D.; Funkuin, Y.N.; Prins, W.; Bouckaert, L.; Sleutel, S. Short-term CO2 and N2O emissions and microbial properties of biochar amended sandy loam soils. Soil Biol. Biochem. 2013, 57, 401–410. [Google Scholar] [CrossRef]
- Six, J.; Frey, S.D.; Thiet, R.K.; Batten, K.M. Bacterial and fungal contributions to carbon sequestration in agroecosystems. Soil Sci. Soc. Am. J. 2006, 70, 555–569. [Google Scholar] [CrossRef]
- van Leeuwen, J.P.; Djukic, I.; Bloem, J.; Lehtinen, T.; Hemerik, L.; de Ruiter, P.C.; Lair, G.J. Effects of land use on soil microbial biomass, activity and community structure at different soil depths in the Danube floodplain. Eur. J. Soil Biol. 2017, 79, 14–20. [Google Scholar] [CrossRef]
- Blagodatskaya, E.V.; Anderson, T.-H. Interactive effects of pH and substrate quality on the fungal-to-bacterial ratio and qCO2 of microbial communities in forest soils. Soil Biol. Biochem. 1998, 30, 1269–1274. [Google Scholar] [CrossRef]
- Thies, J.E.; Rillig, M.C.; Graber, E.R. Biochar effects on the abundance, activity and diversity of the soil biota. In Biochar for Environmental Management: Science, Technology, and Implementation; Lehmann, J., Joseph, S., Eds.; Earthscan: New York, NY, USA, 2015; pp. 327–389. [Google Scholar]
- Ameloot, N.; Sleutel, S.; Das, K.C.; Kanagaratnam, J.; de Neve, S. Biochar amendment to soils with contrasting organic matter level: Effects on N mineralization and biological soil properties. Glob. Chang. Biol. Bioenergy 2015, 7, 135–144. [Google Scholar] [CrossRef]
- Lehmann, J.; Rillig, M.C.; Thies, J.; Masiello, C.A.; Hockaday, W.C.; Crowley, D. Biochar effects on soil biota—A review. Soil Biol. Biochem. 2011, 43, 1812–1836. [Google Scholar] [CrossRef]
- Späth, A.; König, B. Molecular recognition of organic ammonium ions in solution using synthetic receptors. Beilstein J. Org. Chem. 2010, 6, 32. [Google Scholar] [CrossRef] [PubMed]
Figure 1.
Biochar carbon (C) remaining (%) after the incubation period for whole field and forest soils (mean ± standard error (S.E.)). Lowercase letters indicate significant differences between the soil–biochar treatments (Tukey test, p < 0.05). BC400—biochar produced at 400 °C; BC600—biochar produced at 600 °C.

Figure 2.
Share of incubated biochar C (% from the sum of the three fractions) recovered in each soil fraction pre- and post-incubation in field soil and forest soil. Lowercase letters indicate significant differences between time (Tukey test, p < 0.05).
Figure 2.
Share of incubated biochar C (% from the sum of the three fractions) recovered in each soil fraction pre- and post-incubation in field soil and forest soil. Lowercase letters indicate significant differences between time (Tukey test, p < 0.05).

Figure 3.
Cumulative CO2 (mg C·g soil−1) from soils with and without biochars. Letters indicate significant differences between cumulative CO2 for each biochar–soil treatment (Tukey test, p < 0.05). Bars represent S.E.
Figure 3.
Cumulative CO2 (mg C·g soil−1) from soils with and without biochars. Letters indicate significant differences between cumulative CO2 for each biochar–soil treatment (Tukey test, p < 0.05). Bars represent S.E.

Figure 4.
Priming effect and biochar decomposition in field and forest soils (means ± S.E.). SOC—soil organic C.
Figure 4.
Priming effect and biochar decomposition in field and forest soils (means ± S.E.). SOC—soil organic C.


Table 1.
Means ± standard error (S.E.) of biochar carbon (C) and soil organic C (SOC) lost in field and forest biochar treatments (BC400—biochar produced at 400 °C, and BC600—biochar produced at 600 °C) compared to C lost from control field and forest soils (no biochar). The analysis of variance (ANOVA) shows differences between the soils, the biochars, and the soil*biochar interaction effect. n.s. = not significant.
| Treatment | Biochar C (mg C g−1) | Native SOC (mg C-CO2 g−1) | Priming (mg C-CO2 g−1) | Total CO2 (mg C-CO2 g−1) |
|---|---|---|---|---|
| Field400 | 0.39 ± 0.10 | 0.58 ± 0.10 | −0.19 ± 0.12 | 0.96 ± 0.03 |
| Field600 | 0.00 ± 0.10 | 0.89 ± 0.11 | 0.11 ± 0.12 | 0.90 ± 0.03 |
| Field0 | NA | 0.77 ± 0.05 | 0.77 ± 0.05 | |
| Forest400 | 0.90 ± 0.02 | 0.57 ± 0.07 | −0.89 ± 0.07 | 1.47 ± 0.07 |
| Forest600 | 1.11 ± 0.11 | 0.17 ± 0.11 | −1.29 ± 0.12 | 1.29 ± 0.03 |
| Forest0 | NA | 1.47 ± 0.01 | 1.47 ± 0.01 | |
| ANOVA p values | ||||
| Soil | 0.0001 | 0.0001 | 0.0001 | 0.0001 |
| Biochar | n.s. | n.s. | n.s. | 0.015 |
| Soil*Biochar | 0.025 | 0.0001 | 0.0001 | n.s. |
Table 2.
Chemical properties of field and forest soils with biochar treatments (means ± S.E.). Lowercase letters indicate significant differences between the biochar treatments (400 and 600), including control (0), while asterisks (*) indicate significant differences between pre- and post-incubation (Tukey test, p < 0.05). N—nitrogen; DOC—dissolved organic C; DON—dissolved organic N.
| Condition | Treatment | Total Organic C (%) | Total N (%) | NO3− (mg N g soil−1) | NH4+ (mg N g soil−1) | Mineral N (mg N g soil−1) | DOC (µg C g soil−1) | DON (µg N g soil−1) |
|---|---|---|---|---|---|---|---|---|
| Pre-incubation | Field0 | 1.2 ± 0.03 b | 0.11 ± 0.002 b | 39.8 ± 2.7 | 2.8 ± 0.3 b | 42.7 ± 3.0 | 95.8 ± 6.1 b | 53.1 ± 2.6 |
| Field400 | 1.5 ± 0.03 a | 0.13 ± 0.001 a | 36.3 ± 1.2 | 6.1 ± 1.0 a | 42.5 ± 0.5 | 105.8 ± 5.2 b | 46.7 ± 1.8 | |
| Field600 | 1.5 ± 0.03 a | 0.12 ± 0.002 a | 30.8 ± 3.6 | 5.3 ± 0.4 a,b | 36.1 ± 3.6 | 238.0 ± 14.3 a | 49.0 ± 1.9 | |
| Post-incubation | Field0 | 1.1 ± 0.07 b | 0.11 ± 0.004 | 70.4 ± 5.0 a,b,* | 1.1 ± 0.1 * | 71.3 ± 5.0 a,b,* | 101.4 ± 3.8 | 16.5 ± 2.0 * |
| Field400 | 1.5 ± 0.03 a | 0.12 ± 0.005 | 62.5 ± 7.4 b,* | 0.9 ± 0.6 * | 62.8 ± 7.7 b,* | 84.0 ± 24.7 | 20.6 ± 8.7 * | |
| Field600 | 1.4 ± 0.00 a | 0.12 ± 0.002 | 91.3 ± 6.6 a,* | 0.9 ± 0.3 * | 92.2 ± 7.0 a,* | 123.3 ± 13.3 * | 10.7 ± 4.2 * | |
| Pre-incubation | Forest0 | 2.7 ± 0.07 b | 0.19 ± 0.004 b | 0 | 12.0 ± 0.3 | 3.4 ± 0.3 | 180.4 ± 5.3 b | 34.6 ± 2.2 |
| Forest400 | 3.3 ± 0.13 a | 0.23 ± 0.008 a | 0 | 10.0 ± 0.6 | 6.5 ± 1.4 | 255.3 ± 7.2 a | 43.6 ± 0.3 | |
| Forest600 | 3.2 ± 0.03 a | 0.22 ± 0.005 a | 0 | 11.2 ± 0.6 | 5.4 ± 0.4 | 277.9 ± 11.1 a | 45.1 ± 4.3 | |
| Post-incubation | Forest0 | 2.8 ± 0.09 | 0.20 ± 0.004 | 129.2 ± 9.4 * | 54.2 ± 0.5 a,* | 183.4 ± 9.0 * | 135.9 ± 7.5 * | 0 * |
| Forest400 | 3.0 ± 0.12 | 0.21 ± 0.009 | 164.1 ± 6.3 * | 4.7 ± 1.8 b,* | 168.8 ± 5.2 * | 136.6 ± 3.7 * | 20.4 ± 12.0 | |
| Forest600 | 3.2 ± 0.18 | 0.22 ± 0.013 | 167.2 ± 13.8 * | 0.2 ± 0.1 c,* | 159.7 ± 12.3 * | 133.2 ± 13.0 * | 7.4 ± 7.4 * |
Table 3.
Net N and C changes during incubation period (post-incubation level minus pre-incubation level, means ± S.E.). Letters indicate significant differences between the treatments for each soil (Tukey test, p < 0.05).
Table 3.
Net N and C changes during incubation period (post-incubation level minus pre-incubation level, means ± S.E.). Letters indicate significant differences between the treatments for each soil (Tukey test, p < 0.05).
| Treatment | Net Nitrification (mg N g soil−1) | Net Ammonification (mg N g soil−1) | Net N Mineralization (mg N g soil−1) | Change in DOC (µg C g soil−1) | Change in DON (µg N g soil−1) |
|---|---|---|---|---|---|
| Field0 | 30.1 ± 8.7 a,b | −1.8 ± 0.4 a | 28.1 ± 5.7 a,b | 5.7 ± 7.3 a | −37.0 ± 5.3 a |
| Field400 | 25.1 ± 7.2 b | −5.2 ± 0.7 b | 20.3 ± 7.7 b | −30.4 ± 31.0 a | −26.1 ± 9.5 a |
| Field600 | 60.5 ± 7.0 a | −4.4 ± 0.6 b | 56.0 ± 7.4 a | −114.8 ± 4.3 b | −38.4 ± 4.4 a |
| Forest0 | 129.2 ± 9.4 a | 42.2 ± 0.4 a | 180.0 ± 9.2 a | −46.1 ± 9.0 a | −34.6 ± 2.2 a |
| Forest400 | 164.1 ± 6.3 a | −5.4 ± 2.1 b | 161.4 ± 4.4 a | −118.8 ± 6.0 b | −23.2 ± 12.1 a |
| Forest600 | 167.2 ± 13.8 a | −11.1 ± 0.9 c | 154.4 ± 12.3 a | −144.7 ± 15.6 b | −40.8 ± 10.3 a |
© 2018 by the authors. Licensee MDPI, Basel, Switzerland. This article is an open access article distributed under the terms and conditions of the Creative Commons Attribution (CC BY) license (http://creativecommons.org/licenses/by/4.0/).
Share and Cite
MDPI and ACS Style
Speratti, A.B.; Romanyà, J.; Garcia-Pausas, J.; Johnson, M.S. Determining the Stability of Sugarcane Filtercake Biochar in Soils with Contrasting Levels of Organic Matter. Agriculture 2018, 8, 71. https://doi.org/10.3390/agriculture8060071
AMA Style
Speratti AB, Romanyà J, Garcia-Pausas J, Johnson MS. Determining the Stability of Sugarcane Filtercake Biochar in Soils with Contrasting Levels of Organic Matter. Agriculture. 2018; 8(6):71. https://doi.org/10.3390/agriculture8060071
Chicago/Turabian StyleSperatti, Alicia B., Joan Romanyà, Jordi Garcia-Pausas, and Mark S. Johnson. 2018. "Determining the Stability of Sugarcane Filtercake Biochar in Soils with Contrasting Levels of Organic Matter" Agriculture 8, no. 6: 71. https://doi.org/10.3390/agriculture8060071
Note that from the first issue of 2016, this journal uses article numbers instead of page numbers. See further details here.