Sampling Stratification Using Aerial Imagery to Estimate Fruit Load in Peach Tree Orchards


Departamento de Agronomía, Biotecnología y Alimentación, Universidad Pública de Navarra, 31006 Pamplona, Spain
*
Author to whom correspondence should be addressed.
Agriculture 2018, 8(6), 78; https://doi.org/10.3390/agriculture8060078
Submission received: 30 April 2018
/
Revised: 29 May 2018
/
Accepted: 30 May 2018
/
Published: 4 June 2018
(This article belongs to the Special Issue Precision Agriculture)
Abstract
:A quick and accurate sampling method for determining yield in peach orchards could lead to better crop management decisions, more accurate insurance claim adjustment, and reduced expenses for the insurance industry. Given that sample size depends exclusively on the variability of the trees on the orchard, it is necessary to have a quick and objective way of assessing this variability. The aim of this study was to use remote sensing to detect the spatial variability within peach orchards and classify trees into homogeneous zones that constitute sampling strata to decrease sample size. Five mature peach orchards with different degrees of spatial variability were used. A regular grid of trees was established on each orchard, their trunk cross-sectional area (TCSA) was measured, and yield was measured as number of fruits/tree on the central tree of each one of them. Red Vegetation Index (RVI) was calculated from aerial images with 0.25 m·pixel−1 resolution, and used, either alone or in combination with TCSA, to delineate sampling strata using cluster fuzzy k-means. Completely randomized (CRS) and stratified samplings were compared through 10,000 iterations, and the Minimum Sample Size required to obtain estimates of actual production for three quality levels of sampling was calculated in each case. The images allowed accurate determination of the number of trees, allowing a proper application of completely randomized sampling designs. Tree size and the canopy density estimated by means of multispectral indices are complementary parameters suitable for orchard stratification, decreasing the sample size required to determine fruit count up to 20–35% compared to completely randomized samples.
1. Introduction
Providing appropriate risk management tools for agriculture is a key challenge for agricultural development, and agricultural insurance systems play a central role in that process. In Spain, for instance, the insurance industry represents a large market of 13,500 million euros, and, in 2017 alone, more than 105 claims related to damages caused by weather events were made, for a net worth of indemnities paid of around 450 million euros [1]. The Spanish agricultural insurance system is claim-based, which means that once a meteorological event, such as a frost or hail, has caused damage in an orchard, the grower must present a claim to the insurer. The insurer must check the claim and determine the incidence of such damage and to calculate the indemnities paid by the insurance companies. In fruit trees, the specific rule for damage inspection in fruit orchards [2] states that both the damage verification and yield estimation must be performed in the orchard using a ground-based completely randomized sampling (CRS) procedure or a systematic one, stratifying if it is appropriate.
A CRS allows to reliably know the probability that the values obtained approximate the true values in the orchard and, if the sample size is insufficient, how many additional trees should be sampled. To apply a CRS properly [3], all trees in the orchard must have the same probability to be chosen; therefore, the number of trees must be known to avoid bias. The size of the sample needed to obtain an adequate assessment of the population mean depends on three criteria: the level of precision, the level of confidence or risk, and the degree of within-orchard variability in the parameter being measured [4], but in practice, most sampling protocols recommend modest number of samples out of practical considerations: for crop insurance companies, a single frost or hail event generally can affect a large number of orchards in the same region. In those cases, the minimum sample size (MSS) required for a determination with adequate levels of precision and confidence could be easily larger than what is feasible for many orchards. To overcome this, stratified sampling, the process of balancing sampling frequency among mutually exclusive strata, has been demonstrated to improve sampling efficiency by reducing standard error of samples and can be used to estimate population means and standard deviations [5]. A well-established approach to recognize homogeneous grouping in data is cluster analysis [6]. Several methods have been developed for agricultural data, and one of the most widely used algorithms is fuzzy k-means clustering [7]. This algorithm uses a weighting exponent to control the degree to which membership sharing occurs between classes and has been extensively used to classify yield and quality data with remotely sensed images [6,7,8,9,10].
Tree fruit differs from most annual crops in that plants are clonal, suggesting that there should be minimal variability between them compared with annual crops. However, orchard management and site-specific soil and climate effects accumulated over the years lead to significant within-orchard spatial variability that influences yield [11,12]. In this context, remote sensing could improve the efficiency of ground sampling protocols for yield assessments by (i) identifying the exact number of bearing trees in the orchard and (ii) detecting the spatial variability using auxiliary variables such as the Normalized Difference Vegetation Index (NDVI) or crown size [3] so that precision agriculture (PA) techniques would aid in classifying trees into homogeneous zones, which constitute sampling strata, lowering the MSS required.
In agriculture, many authors have shown that remote sensing and vegetation indexes such as Red Vegetation Index (RVI) or NDVI were correlated with the spatial variation of tree characteristics and yield [11,12,13,14,15,16]. However, contributions attempting to apply remote sensing in sampling designs are recent and mostly focused mostly in viticulture. To date, aerial NDVI images have been used to optimize sampling protocols in vineyards resulting in significant sample size reductions compared to random sampling used alone [14,16] or in combination with ancillary information [17]. The aim of this work has been to use remote sensing to detect the spatial variability within peach (Prunus persica L. Batsch) orchards and classify trees into homogeneous zones that constitute sampling strata to decrease sample size.
2. Materials and Methods
2.1. Data Acquisition
The research was conducted in 2015, in five mature commercial peach orchards located in Tudela (Southern Navarre, Spain). Orchards were trained as 3-scaffold vase (open center) and were chosen to encompass a wide range of within-field variability in tree size or abundance of canopy vegetation. Description of the orchards, including cultivars, orchard ages, and areas are provided in Table 1 and Figure 1.
A staggered regular sampling grid was defined for every orchard. Each node in the grid was composed by 6 trees in two consecutive rows (3 × 2). Nodes were placed at 10 tree intervals in the row along two staggered rows (Figure 2). This resulted in a total of 143 to 192 sampling nodes (SN) per orchard, depending on their shape and area (Table 1).
Canopy reflectance information was extracted from 0.25 m·pixel−1 resolution images acquired by an airborne RGB-NIR sensor, gathered in a commercial mission performed by a private company (Agropixel SA, Lleida, Spain) on 10 August 2015 using a high-resolution airborne multispectral sensor (HiRAMS) system with a four-channel camera mounted on a Cessna 172 Skyhawk. The sensor filters were adjusted to 450 nm (blue, band one), 550 nm (green, band two), 670 nm (red, band three) and 780 nm (near infrared, NIR, band four). The spectral bands were pre-processed by the provider to compensate for mis-registration due to lens distortion (<0.2 pixels).
Prior to applying vegetation index to the mosaicked imagery, the provider performed a canopy classification procedure, separating image pixels dominated by tree canopy from those containing soil and/or inter-row vegetation. Following the classification procedure, RVI was calculated as the ratio between RED/NIR bands, and RVI values were normalized to an 8-bit scale (0–255). The image area corresponding to the six adjacent trees was cropped, and its mean RVI value was determined.
In summer, after thinning and before harvest, trunk size (TCSA, cross-sectional area 15 cm above grafting point, cm2) was recorded on each tree in the SN, whereas fruit number (fruit·tree−1) was recorded in the tree with TCSA closer to the average of the six trees in the SN.
2.2. Data Analysis
2.2.1. Delineation of Sampling Strata
Unsupervised clustering was performed using trunk size and RVI information in combination, using the fuzzy k-means algorithm to delineate sampling strata. Euclidean distance was used, considering the variables to be independent, and a stopping criterion of 0.0001 was used to obtain good convergence [8]. Cluster analysis was performed testing fuzzy exponents (m) that ranged between 1 and 2 at 0.1 intervals [18], considering 2, 3, and 4 as potential number of clusters (C), since greater sub-divisions would not be practical for sampling purposes. In order to determine the optimum C, the fuzziness performance index (FPI) and the modified partition entropy (MPE) as defined by [18] were calculated. Cluster number was chosen to obtain the smaller values for FPI and MPE. The trees in the sampling grid were then assigned to their respective homogeneous zones (strata). All the calculations were performed using FuzME v3.5c software (Australian Centre for Precision Agriculture, Sydney, Australia), accessible as freeware.
2.2.2. Definition of Sample Sizes
Sample size for complete randomized samples (SSCRS) was set on each orchard to the minimum sample size (MSS) suggested by the variability found within all the trunk sizes measured in the SPs. MSS was defined as (Equation (1), [4]),
where Z2 is the abscissa of the normal curve that cuts off an area α at the tails (1 − α equals the desired confidence level), e is the desired level of precision, p is the estimated proportion of the attribute, and q is 1 − p. SSOr was calculated for a 95% confidence interval, 10% precision, assuming maximum variability (p = 0.5), and corrected for small population size [4].
Sample size within the strata identified on stratified samplings (SSSTR) was defined as (Equation (2)):
where SE is the number of sampling strata identified in the orchard. SSSTR were rounded up to the next integer.
2.2.3. Sampling Methods
Each type of sampling (completely randomized or stratified) was repeated 104 times by means of a script using the sample function of R v3.2.2 statistic package [19] with RStudio v0.99.489 [20]. The MSS required to obtain estimates of actual production was calculated in each case for three sampling quality levels.
- Fair: 90% confidence level, 15% precision;
- Good: 95% confidence level, 15% precision;
- Excellent: 95% confidence level, 10% precision.
The performance of sampling strata at reducing MSS regarding complete randomized samples (CRS) was evaluated comparing the 95% confidence intervals for the mean of the MSSs obtained on each sampling type.
3. Results
The orchards used in this study included high coefficients of variation (CV) for the ground-measured parameters tree size, evaluated by means of TCSA, and fruit count (Table 2), which indicates the existence of considerable within-field variability. However, RVI was generally less variable than TCSA, and the variability was inversely correlated (R2 = 0.71, p < 0.0001) to the mean RVI values. The particularly low variability in RVI found in VAL_02 and BOL_01, compared to the much higher CV values found for TCSA is probably indicating a saturation effect that appears once the vegetation density increases beyond a threshold value [21].
With regards to the clusters obtained with tree size and RVI combined, for all the runs, the optimum fuzziness exponents ranged between 1.2 and 1.3 depending on the orchard. FPI and MPE agreed that the number of clusters was 2 (MCI_01 and VAL_02) or 3 (all other orchards). In all cases, the values of both indices were closer to 0 than 1, which indicates a high degree of organization [22].
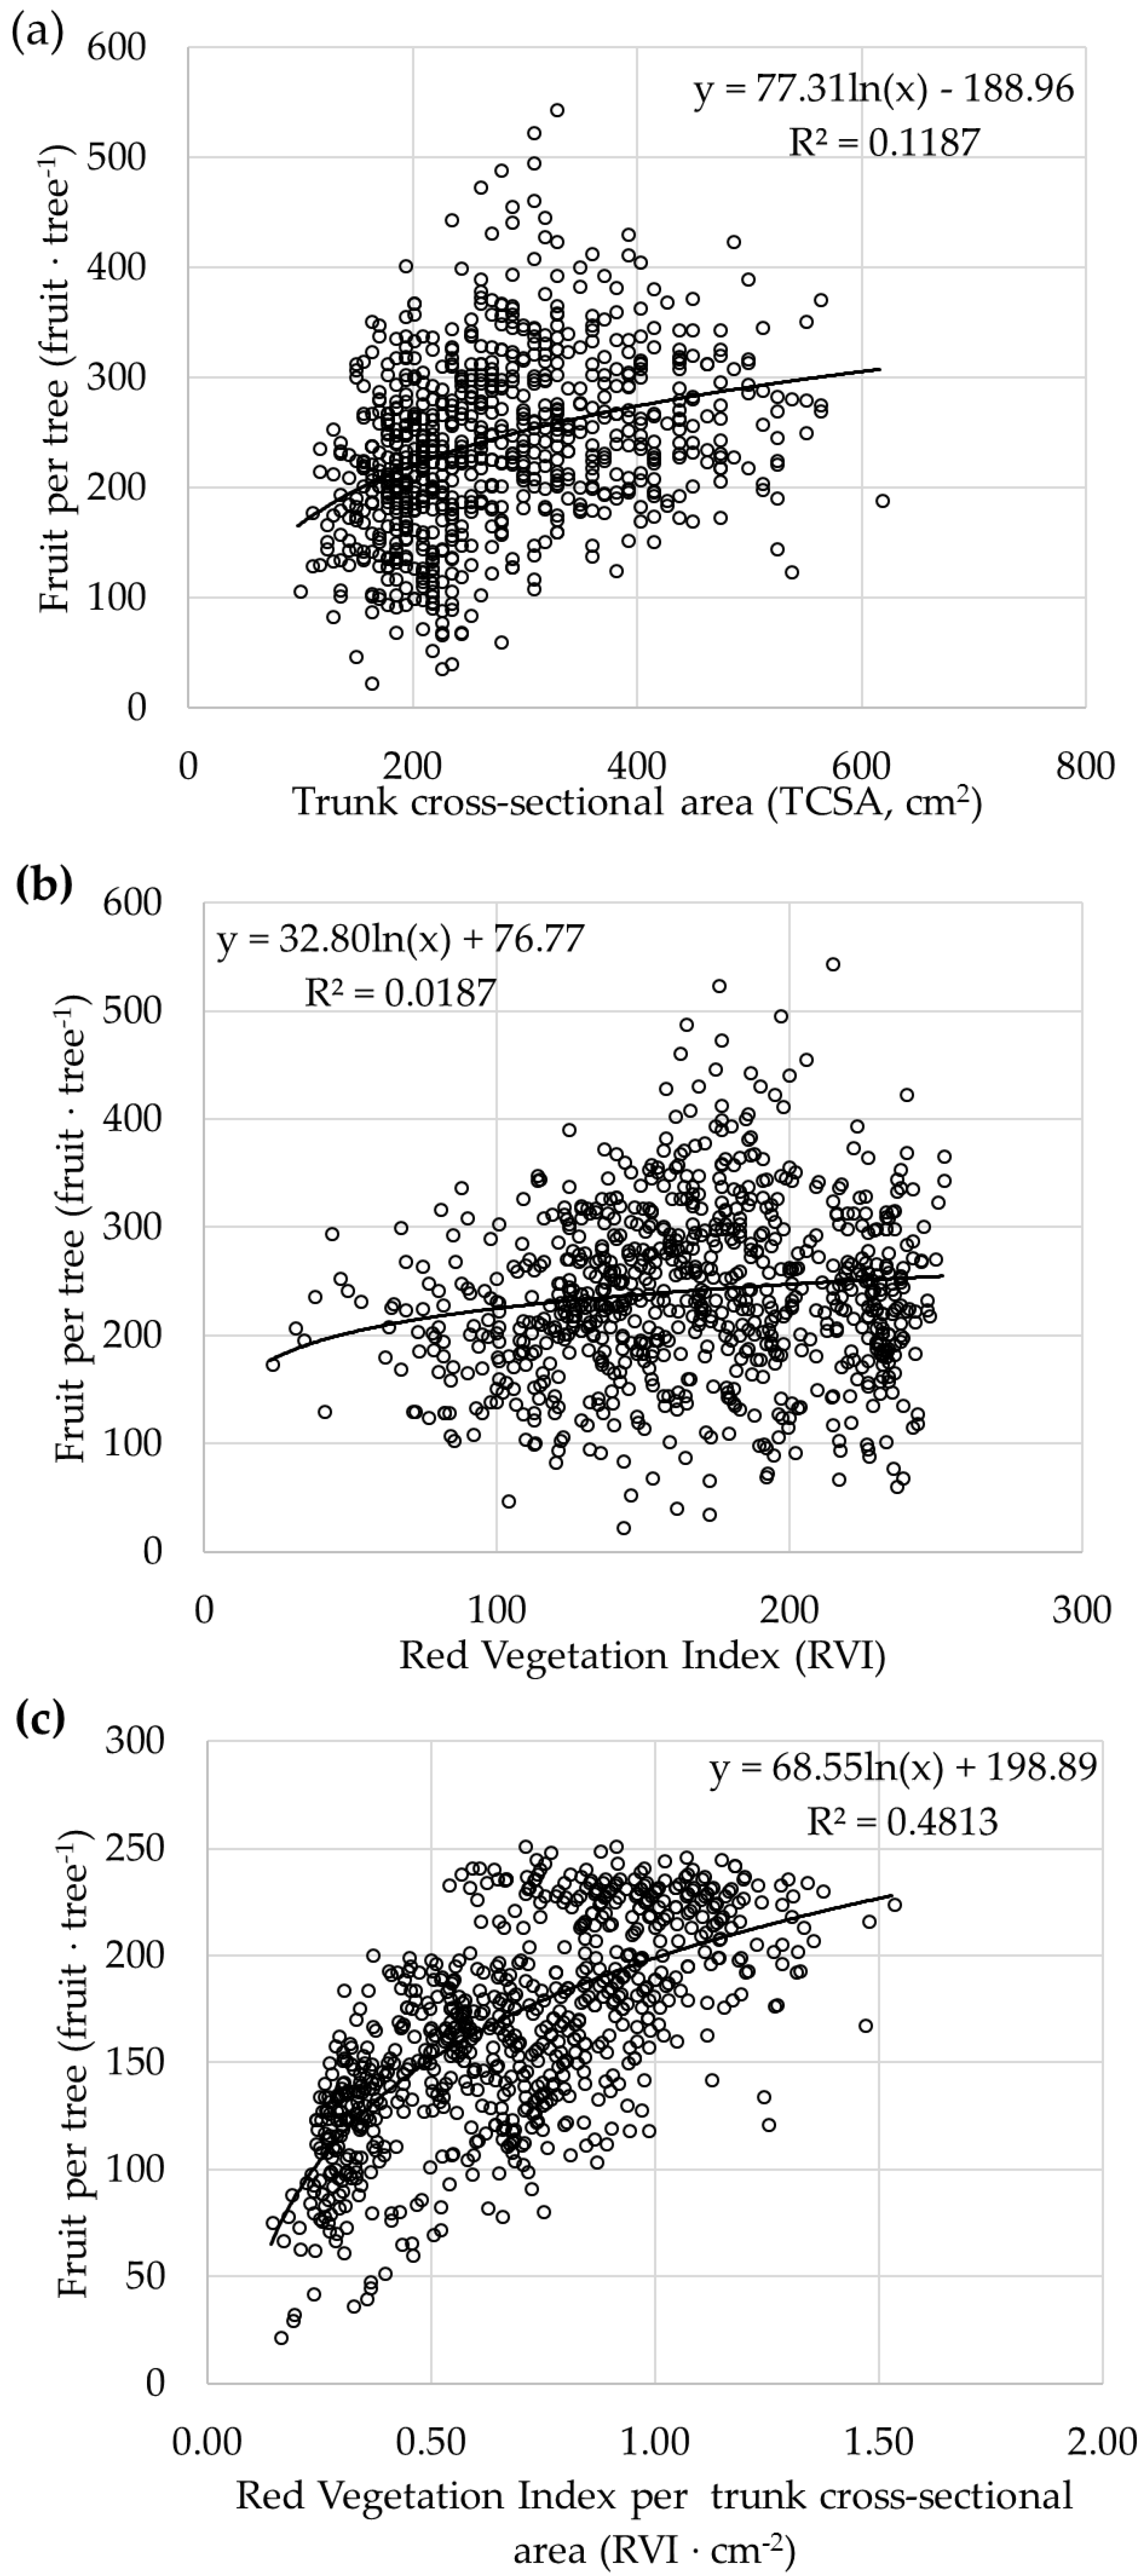
Considered individually, both TCSA and RVI were poorly related to fruit count (Figure 3), but when they were combined (RVI·TCSA−1), the relationship with fruit count improved significantly. As expected, within-cluster variability for TCSA and RVI was significantly (p < 0.001) lower than within-orchard (Table 3), with average reductions in CV ranging from 19 to 42%. However, the clusters were less efficient in decreasing internal variability in fruit count, as average CV reductions were below 10% in four orchards. Furthermore, in MCI_01, which was the least variable orchard in the study, clusters were not significantly different (p = 0.217).
Once the trees in the sampling grid were assigned to their respective sampling strata, the MSS needed to determine fruit count was calculated (Table 4) and compared to that in the completely randomized sampling (CRS). In all orchards, MSS increased steeply when higher quality estimates were required: in average, getting from “Fair” to “Good” quality estimates increased MSS by 30–40% but from “Good” to “Excellent” doubled it (and tripled MSS in “Fair”). The number of trees required for “Fair” or “Good” estimates was rather moderate in most orchards, which highlights the relevance of using truly random sampling methods. However, when within-orchard variability was very high, as it was the case in ABL_01, the MSS required even for “Fair” quality estimates was much higher. In the three quality levels tested, the stratified sampling procedure effectively decreased MSS in most orchards, and in the worst case (MCI_01) did not increased it. Reduction was more evident as higher sampling quality was required, quality sample size decreased from 0 to 25% for “Fair,” whereas reductions from 10 to 35% were obtained for “Excellent” sampling quality specifications.
4. Discussion
In peach trees, fruit load can be estimated with sufficient precision from tree size, planting density, and total shoot length per TCSA [23]. The latter acts on a peach variety as a surrogate for the number of leaves and, therefore, could be considered a vegetation index analogous to RVI. The results of this study show that using a vegetation index RVI in combination with a tree size estimator (TCSA) provided clusters significantly different in fruit load and more homogeneous internally than the whole orchard. Consequently, clustering has been of value to reduce the effort required to obtain accurate fruit load estimations in the peach orchards using stratified sampling strategies. Indeed, the sample size required to estimate fruit load for a given quality of the estimation could be decreased up to 35% using stratified sampling compared to CRS.
In precision agriculture, sampling methods defined according to auxiliary data have been used for the calibration of spatial models [14,24], and vegetation indexes have been considered as relevant auxiliary information to optimize sampling for yield estimations. In fact, many authors have shown that vegetation indexes are correlated with yield or yield components at the within-field level [13,14,15,25] in several perennial crops (grapevine, apple trees, or citrus, to cite some). However, to date, there are few contributions attempting to apply remote sensing in sampling designs for permanent crops, mostly focused in viticulture [5,14,16,17]. Our results are consistent with those obtained by [5,14]. The former decreased sample sizes up to a 24% using a spatially weighted template sampling instead of random sampling, whereas the latter used NDVI-based sampling strategies that improved vine yield estimates by at least 5–7% compared to the random method.
This study offers promising results for improving yield sampling in peach orchards, but some practical issues should be solved before the methodology could be routinely implemented. We combined aerial, high-resolution multispectral information (RVI) with discrete, ground-based estimators of tree size (TCSA). However, RVI showed little sensitivity in some orchards, probably due to the decreased reflectance of NIR in dense canopies [21]. Using a multispectral index better adapted to those situations, like the ones proposed by [21], could improve the efficiency of the clustering process. Additionally, it would also be desirable to have continuous high-resolution aerial information for tree geometry and size, which could substitute the TCSA information measured in this study. In this regard, the high-resolution images provided by unmanned aerial vehicles (UAVs) could be used successfully to characterize the volumetric configuration (i.e., size) of the canopy [26].
5. Conclusions
A quick and accurate sampling method for determining losses could lead to better crop management decisions, more accurate insurance claim adjustment, and reduced expenses for the insurance industry. Therefore, the insurance industry may constitute an important application field for remote sensing. In fact, our results suggest that remote sensing could constitute a powerful tool for saving time and effort in the damage and yield assessing processes. Tree size and canopy density estimated by means of multispectral indices are complementary parameters, allowing a proper application of completely randomized sampling designs, which decrease the sample size required to determine yield up to 20–35% compared to completely randomized samples.
Author Contributions
Conceptualization, C.M. and J.B.R.; Methodology, C.M. and L.G.S.; Formal Analysis, C.M.; Investigation, C.M., J.U., M.L.; Writing-Original Draft Preparation, C.M., L.G.S.; Writing-Review & Editing, C.M., L.G.S., J.U., M.L., J.B.R.; Funding Acquisition, J.B.R.
Funding
This research was funded by the Agrupación Española de Entidades Aseguradoras de los Seguros Agrarios Combinados (AGROSEGURO, S.A.), Madrid, Spain.
Acknowledgments
The authors also would like to express their gratitude to the owners and technical staff of the orchards for their cooperation and valuable help to perform this field experiment.
Conflicts of Interest
The authors declare no conflict of interest. The founding sponsors had no role in the design of the study; in the collection, analyses, or interpretation of data; in the writing of the manuscript, and in the decision to publish the results.
References
- Agroseguro. Informe Anual (Annual Report); Agroseguro: Madrid, Spain, 2013. [Google Scholar]
- Boletín Oficial del Estado. Orden PRE/1950/2005, de 17 de Junio, por la que se Aprueba la Norma Específica de Peritación de Daños en la Producción de Frutales, Amparados por el Seguro Agrario Combinado; Ministerio de la Presidencia: Madrid, Spain, 2005; pp. 22172–22176.
- Wulfsohn, D.; Zamora, F.A.; Téllez, C.P.; Lagos, I.Z.; García-Fiñana, M. Multilevel systematic sampling to estimate total fruit number for yield forecasts. Precis. Agric. 2012, 13, 256–275. [Google Scholar] [CrossRef]
- Cochran, W.G. Sampling Techniques, 3rd ed.; John Wiley & Sons: New York, NY, USA, 1977; ISBN 047116240X. [Google Scholar]
- Meyers, J.; Sacks, G.; van Es, H.; Vanden Heuvel, J.E. Improving vineyard sampling efficiency via dynamic spatially explicit optimisation. Aust. J. Grape Wine Res. 2011, 17, 306–315. [Google Scholar] [CrossRef]
- Peeters, A.; Zude, M.; Käthner, J.; Ünlü, M.; Kanber, R.; Hetzroni, A.; Gebbers, R.; Ben-Gal, A. Getis-Ord’s hot- and cold-spot statistics as a basis for multivariate spatial clustering of orchard tree data. Comput. Electron. Agric. 2015, 111, 140–150. [Google Scholar] [CrossRef]
- Fridgen, J.J.; Kitchen, N.R.; Sudduth, K.A.; Drummond, S.T.; Wiebold, W.J.; Fraisse, C.W. Management Zone Analyst (MZA): Software for Subfield Management Zone Delineation. Agron. J. 2004, 96, 100–108. [Google Scholar] [CrossRef]
- Fridgen, J.; Fraise, C.; Kitchen, N.; Sudduth, K. Delineation and analysis of site-specific management zones. In Proceedings of the Second International Conference on Geospatial Information in Agriculture and Forestry, Lake Buena Vista, FL, USA, 10–12 January 2000; ERIM International: Ann Arbor, MI, USA, 2000; pp. 402–411. [Google Scholar]
- Santesteban, L.G.; Urretavizcaya, I.; Miranda, C.; García, A.; Royo, J.B. Agronomic significance of the zones defined within vineyards early in the season using NDVI and fruit load information. Papers Presented at the 9th European Conference on Precision Agriculture, ECPA 2013, Lleida, Spain, 7–11 July 2013; pp. 641–647. [Google Scholar]
- Urretavizcaya, I.; Santesteban, L.G.; Tisseyre, B.; Guillaume, S.; Miranda, C.; Royo, J.B. Oenological significance of vineyard management zones delineated using early grape sampling. Precis. Agric. 2014, 15, 111–129. [Google Scholar] [CrossRef]
- Perry, E.M.; Dezzani, R.J.; Seavert, C.F.; Pierce, F.J. Spatial variation in tree characteristics and yield in a pear orchard. Precis. Agric. 2010, 11, 42–60. [Google Scholar] [CrossRef]
- Uribeetxebarria, A.; Daniele, E.; Escolà, A.; Arnó, J.; Martínez-Casasnovas, J.A. Spatial variability in orchards after land transformation: Consequences for precision agriculture practices. Sci. Total Environ. 2018, 635, 343–352. [Google Scholar] [CrossRef] [PubMed]
- Zude-Sasse, M.; Fountas, S.; Gemtos, T.A.; Abu-Khalaf, N. Applications of precision agriculture in horticultural crops. Eur. J. Hortic. Sci. 2016, 81, 78–90. [Google Scholar] [CrossRef]
- Carrillo, E.; Matese, A.; Rousseau, J.; Tisseyre, B. Use of multi-spectral airborne imagery to improve yield sampling in viticulture. Precis. Agric. 2016, 17, 74–92. [Google Scholar] [CrossRef]
- Liakos, V.; Tagarakis, A.; Fountas, S.; Nanos, G.D.; Tsiropoulos, Z.; Gemtos, T. Use of NDVI to predict yield variability in a commercial apple orchard. In Precision Agriculture ’15; Wageningen Academic Publisher: Wageningen, The Netherlands, 2015; pp. 553–560. [Google Scholar]
- Meyers, J.M.; Vanden Heuvel, J.E. Use of normalized difference vegetation index images to optimize vineyard sampling protocols. Am. J. Enol. Vitic. 2014, 65, 250–253. [Google Scholar] [CrossRef]
- Araya-Alman, M.; Acevedo-Opazo, C.; Guillaume, S.; Valdés-Gómez, H.; Verdugo-Vásquez, N.; Moreno, Y.; Tisseyre, B. Using ancillary yield data to improve sampling and grape yield estimation of the current season. Adv. Anim. Biosci. Precis. Agric. 2017, 8, 515–519. [Google Scholar] [CrossRef]
- McBratney, A.; Moore, A. Application of fuzzy sets to climatic classification. Agric. For. Meteorol. 1985, 35, 165–185. [Google Scholar] [CrossRef]
- R Core Team. R: A Language and Environment for Statistical Computing; R Foundation for Statistical Computing: Vienna, Austria, 2018; Available online: http://www.r-project.org (accessed on 25 April 2018).
- RStudio Team. RStudio: Integrated Development for R; RStudio, Inc.: Boston, MA, USA, 2015; Available online: http://www.rstudio.com (accessed on 25 April 2018).
- Gitelson, A.A.; Kaufman, Y.J.; Stark, R.; Rundquist, D. Novel algorithms for remote estimation of vegetation fraction. Remote Sens. Environ. 2002, 80, 76–87. [Google Scholar] [CrossRef] [Green Version]
- Boydell, B.; McBratney, A. Identifying potential within-field management zones from cotton-yield estimates. Precis. Agric. 2002, 3, 9–23. [Google Scholar] [CrossRef]
- Jiménez, C.M.; Royo Díaz, J.B. A statistical model to estimate potential yields in peach before bloom. J. Am. Soc. Hortic. Sci. 2003, 128, 297–301. [Google Scholar]
- Lesch, S. Sensor-directed response surface sampling designs for characterizing spatial variation in soil properties. Comput. Electron. Agric. 2005, 46, 153–179. [Google Scholar] [CrossRef]
- Bramley, R.G.V.; Hamilton, R.P. Understanding variability in winegrape production systems 1. Within vineyard variation in yield over several vintages. Aust. J. Grape Wine Res. 2005, 10, 32–45. [Google Scholar] [CrossRef]
- Matese, A.; Di Gennaro, S.F.; Miranda, C.; Berton, A.; Santesteban, L.G. Evaluation of spectral-based and canopy-based vegetation indices from UAV and Sentinel 2 images to assess spatial variability and ground vine parameters. Adv. Anim. Biosci. 2017, 8, 817–822. [Google Scholar] [CrossRef]
Figure 1.
Cadaster images and location of the orchards used in the study. (a) VAL_01; (b) VAL_02; (c) ABL_01; (d) MCI_01; (e) BOL_01; (f) Location of the study area, indicated by a black dot.
Figure 1.
Cadaster images and location of the orchards used in the study. (a) VAL_01; (b) VAL_02; (c) ABL_01; (d) MCI_01; (e) BOL_01; (f) Location of the study area, indicated by a black dot.

Figure 2.
Close-up schematic of the upper part of VAL_02 orchard, indicating the sampling grid.

Figure 3.
Relationships between tree size, evaluated by different methods, and fruits per tree. (a) Trunk cross-sectional area (TCSA); (b) Red Vegetation Index (RVI); (c) RVI per TCSA. Each dot corresponds to a sampling node (n = 950).
Figure 3.
Relationships between tree size, evaluated by different methods, and fruits per tree. (a) Trunk cross-sectional area (TCSA); (b) Red Vegetation Index (RVI); (c) RVI per TCSA. Each dot corresponds to a sampling node (n = 950).

Table 1.
Description of the characteristics of the five orchards used in the study.
| Cultivar | Orchard | Area (ha) | Age (years) | Row Spacing (m) | Tree Spacing (m) | Trees/Orchard | Sampling Nodes (SN) |
|---|---|---|---|---|---|---|---|
| Catherine | BOL_01 | 8.9 | 12 | 6.0 | 3.9 | 3800 | 192 |
| Tochino | MCI_01 | 8.1 | 10 | 6.0 | 4.0 | 3200 | 150 |
| Baby Gold 6 | VAL_01 | 9.7 | 22 | 6.0 | 4.5 | 3400 | 176 |
| Miraflores | VAL_02 | 8.4 | 22 | 6.0 | 5.0 | 2650 | 159 |
| Venus | ABL_01 | 4.5 | 20 | 5.0 | 2.5 | 3420 | 143 |
Table 2.
Descriptive statistics (means and coefficient of variation, CV) for the characteristics measured in the trees of the sampling grids and sample sized used on complete randomized samples (SSCRS) and stratified samples (SSSTR).
Table 2.
Descriptive statistics (means and coefficient of variation, CV) for the characteristics measured in the trees of the sampling grids and sample sized used on complete randomized samples (SSCRS) and stratified samples (SSSTR).
| TCSA (cm2) | RVI | Fruits·Tree−1 | Sample Size | |||||
|---|---|---|---|---|---|---|---|---|
| Orchard | Mean | CV (%) | Mean | CV (%) | Mean | CV (%) | SSCRS | SSSTR |
| BOL_01 | 236.7 | 30.3 | 225.5 | 5.9 | 240.6 | 25.4 | 35.3 | 12.0 |
| MCI_01 | 190.5 | 20.9 | 157.0 | 16.0 | 245.5 | 21.7 | 16.8 | 9.0 |
| VAL_01 | 395.6 | 23.4 | 121.0 | 21.0 | 241.4 | 23.5 | 21.1 | 8.0 |
| VAL_02 | 318.8 | 23.1 | 171.9 | 11.5 | 312.9 | 24.2 | 20.5 | 11.0 |
| ABL_01 | 187.4 | 26.9 | 143.1 | 36.9 | 147.7 | 36.9 | 27.9 | 10.0 |
Table 3.
Number of sampling strata identified in the orchards, mean decrease in variability (CV, %) of tree characteristics within each stratum compared to the variability detected in the whole orchard.
Table 3.
Number of sampling strata identified in the orchards, mean decrease in variability (CV, %) of tree characteristics within each stratum compared to the variability detected in the whole orchard.
| Orchard | Sampling Strata (n°) | Mean Decrease in CV | ||
|---|---|---|---|---|
| TCSA | RVI | Fruit·Tree−1 | ||
| BOL_01 | 3 | 30 | 34 | 3 |
| MCI_01 | 2 | 23 | 32 | 0 1 |
| VAL_01 | 3 | 26 | 42 | 10 |
| VAL_02 | 2 | 19 | 26 | 5 |
| ABL_01 | 3 | 27 | 28 | 25 |
1 Strata were not significantly different (p > 0.05) for this parameter.
Table 4.
Minimum sample sizes (MSS) required to estimate fruit count in the orchards using completely randomized (CRS) or stratified samplings (Stratified). Values correspond to the 95% confidence intervals in 104 replicated samplings.
Table 4.
Minimum sample sizes (MSS) required to estimate fruit count in the orchards using completely randomized (CRS) or stratified samplings (Stratified). Values correspond to the 95% confidence intervals in 104 replicated samplings.
| Orchard | Fair Quality 1 | Good Quality | Excellent Quality | |||
|---|---|---|---|---|---|---|
| CRS | Stratified | CRS | Stratified | CRS | Stratified | |
| BOL_01 | 7–8 | 7–8 | 10–12 | 9–11 | 23–27 | 20–23 |
| MCI_01 | 5–7 | 5–6 | 7–10 | 7–9 | 17–23 | 16–19 |
| VAL_01 | 6–8 | 5–6 | 9–11 | 6–8 | 20–25 | 14–17 |
| VAL_02 | 6–8 | 5–7 | 9–12 | 8–10 | 20–27 | 16–21 |
| ABL_01 | 14–18 | 12–14 | 20–25 | 16–19 | 45–56 | 31–36 |
| Mean | 8–10 | 7–8 | 11–14 | 9–11 | 25–31 | 19–23 |
1 Fair: MSS required to obtain estimates with confidence level = 90% and precision = 15%. Good: confidence level = 95%, precision = 15%. Excellent: confidence level = 95%, precision = 10%.
© 2018 by the authors. Licensee MDPI, Basel, Switzerland. This article is an open access article distributed under the terms and conditions of the Creative Commons Attribution (CC BY) license (http://creativecommons.org/licenses/by/4.0/).
Share and Cite
MDPI and ACS Style
Miranda, C.; Santesteban, L.G.; Urrestarazu, J.; Loidi, M.; Royo, J.B. Sampling Stratification Using Aerial Imagery to Estimate Fruit Load in Peach Tree Orchards. Agriculture 2018, 8, 78. https://doi.org/10.3390/agriculture8060078
AMA Style
Miranda C, Santesteban LG, Urrestarazu J, Loidi M, Royo JB. Sampling Stratification Using Aerial Imagery to Estimate Fruit Load in Peach Tree Orchards. Agriculture. 2018; 8(6):78. https://doi.org/10.3390/agriculture8060078
Chicago/Turabian StyleMiranda, Carlos, Luis G. Santesteban, Jorge Urrestarazu, Maite Loidi, and José B. Royo. 2018. "Sampling Stratification Using Aerial Imagery to Estimate Fruit Load in Peach Tree Orchards" Agriculture 8, no. 6: 78. https://doi.org/10.3390/agriculture8060078
Note that from the first issue of 2016, this journal uses article numbers instead of page numbers. See further details here.