Utilisation of Ground and Airborne Optical Sensors for Nitrogen Level Identification and Yield Prediction in Wheat

1
Department of Agronomy (340a), Institute of Crop Science, University of Hohenheim, Fruwirthstraße 23, 70599 Stuttgart, Germany
2
Department of Weed Science (360b), Institute of Phytomedicine, University of Hohenheim, Otto-Sander-Straße 5, 70599 Stuttgart, Germany
*
Author to whom correspondence should be addressed.
Agriculture 2018, 8(6), 79; https://doi.org/10.3390/agriculture8060079
Submission received: 24 April 2018
/
Revised: 31 May 2018
/
Accepted: 6 June 2018
/
Published: 8 June 2018
(This article belongs to the Special Issue Sensors Application in Agriculture)
Abstract
:A healthy crop growth ensures a good biomass development for optimal yield amounts and qualities. This can only be achieved with sufficient knowledge about field conditions. In this study we investigated the performance of optical sensors in large field trails, to predict yield and biomass characteristics. This publication investigated how information fusion can support farming decisions. We present the results of four site-year studies with one fluorescence sensor and two spectrometers mounted on a ground sensor platform, and one spectrometer built into a fixed-wing unmanned aerial vehicle (UAV). The measurements have been carried out in three winter wheat fields (Triticum aestivum L.) with different Nitrogen (N) levels. The sensor raw data have been processed and converted to features (indices and ratios) that correlate with field information and biological parameters. The aerial spectrometer indices showed correlations with the ground truth data only for site-year 2. FERARI (Fluorescence Excitation Ratio Anthocyanin Relative Index) and SFR (Simple Fluorescence Ratio) from the Multiplex® Research fluorometer (MP) in 2012 showed significant correlations with yield (Adj. r≤ 0.63), and the NDVI (Normalised Difference Vegetation Index) and OSAVI (Optimized Soil-Adjusted Vegetation Index) of the FieldSpec HandHeld sensor (FS) even higher correlations with an Adj. r≤ 0.67. Concerning the available N (N), the REIP (Red-Edge Inflection Point) and CropSpec indices from the FS sensor had a high correlation (Adj. r ≤ 0.86), while the MP ratio SFR was slightly lower (Adj. r≤ 0.67). Concerning the biomass weight, the REIP and SAVI indices had an Adj. r≤ 0.78, and the FERARI and SFR ratios an Adj. r ≤ 0.85. The indices of the HandySpec Field spectrometer gave a lower significance level than the FS sensor, and lower correlations (Adj. r≤ 0.64) over all field measurements. The features of MP and FS sensor have been used to create a feature fusion model. A developed linear model for site-year 4 has been used for evaluating the rest of the data sets. The used model did not correlate on a significant de novo level but by changing only one parameter, it resulted in a significant correlation. The data analysis reveals that by increasing mixed features from different sensors in a model, the higher and more robust the r values became. New advanced algorithms, in combination with existent map overlay approaches, have the potential of complete and weighted decision fusion, to ensure the maximum yield for each specific field condition.
1. Introduction
Agricultural systems using Precision Farming (PF) technologies have already been introduced in the market. The range varies from entry level guidance to data acquisition systems integrated into the farm management software. Most of these systems gather tractor-implement information, or perform tailor made applications [1]. The more intensive the crop production system is, the more advanced the technology adaptation on farms is [2]. This serves the goal of higher yields and better crop quality, with the support of sensor systems. The increasing number of available sensors, along with the high diversity of sensor technologies, e.g., imaging sensors, multi- and hyperspectral optical sensors, fluorometers, etc., has increased the possibility for integrating these sensor systems into the daily farm operation. Each sensor has advantages and disadvantages, and can provide important information concerning the field status [2,3,4]. Yet each sensor type has limitations to overcome. By merging the data of different sensors and sensor types, their limitations can be reduced, since data can be complementary or more informative [5]. In that sense, data fusion approaches are necessary, achieving better results by merging numerous sensor data deriving from the field and comparing them with ground truth data like yield or biomass.
Hall and Llinas [6] defined data fusion as “the integration of information from multiple sources to produce specific and comprehensive unified data about an entity”. Brooks and Iyengar [5] classified four categories for sensor data fusion: (1) redundant; (2) complementary; (3) coordinated; or (4) independent fusion. Dasarathy [7] defined three levels: (I) raw data fusion; (II) feature fusion with feature extraction; and (III) decision fusion, which includes inter alia weighted decision methods [8]. Many different terms are used in literature to describe and discuss “fusion” concerning data. Dasarathy [9] also decided to use “information fusion” instead, as the overall term. In all cases, fusion of the sensor information can improve our knowledge of the field conditions [6].
For agricultural applications many sensors have been proposed. Several research studies based on spectral data are available, e.g., using data mining techniques with a genetic algorithm for nitrogen (N) status and grain yield estimation [10], or acquiring multispectral aerial images for the detection of wheat crop and weeds [11]. They are often based on measurements with one single sensor. There is a lack of information, of how informative different sensors and combination of sensors are, in the variability presented at the field level. Peteinatos et al. [12] measured stress levels in outdoor wheat pots with three optical sensors. Yet there is work to be done, connecting ground data with aerial data, even more in real field conditions. Using mobile platforms for data acquisition offers the possibility of system automation with fusion approaches. The advantage of ground platforms is their ability of carrying higher loads and more equipment than it would be possible with Unmanned Aerial Vehicles (UAV) [13].
In the current paper, the investigated research fields were planted with winter wheat utilising different N levels. These fields were examined with a fluorescence sensor and spectrometers, one spectrometer installed on an UAV, the other two spectrometers and the fluorescence sensor on a ground platform. The aim of this research was to test research sensors on field trails close to normal, practical farming conditions. This publication will discuss redundant and complementary fusion approaches, on a raw data and feature fusion level. It investigates the questions; (i) how the used research sensors perform in a large field; (ii) which of the calculated features are statistically significant for assessments of wheat yield, biomass and the available N for the plant; and (iii) how information fusion can support farming decisions.
2. Material and Methods
2.1. Experimental Site
The investigations have been made at the facility Ihinger Hof in Renningen (Germany), an institution of the University of Hohenheim, Stuttgart in South-West Germany. The location of Ihinger Hof (N 48°41, E 8°5526) has a mean annual precipitation of 690 mm (710 mm in 2011 and 727 mm in 2012), and an average annual temperature of 7.9 °C. The measurements about four site-years have been carried out with winter wheat (Triticum aestivum L., cv. Toras and Schamane) on the experimental fields “Inneres Täle” in 2011 respectively site-year (1), “Riech” in 2011 and 2012 (2) + (3), as well as “Lammwirt” in 2012 (4). The term “site-year” is a combination of two factors site and year, according to Beres et al. [14], where site relates to an individual field of a farm.
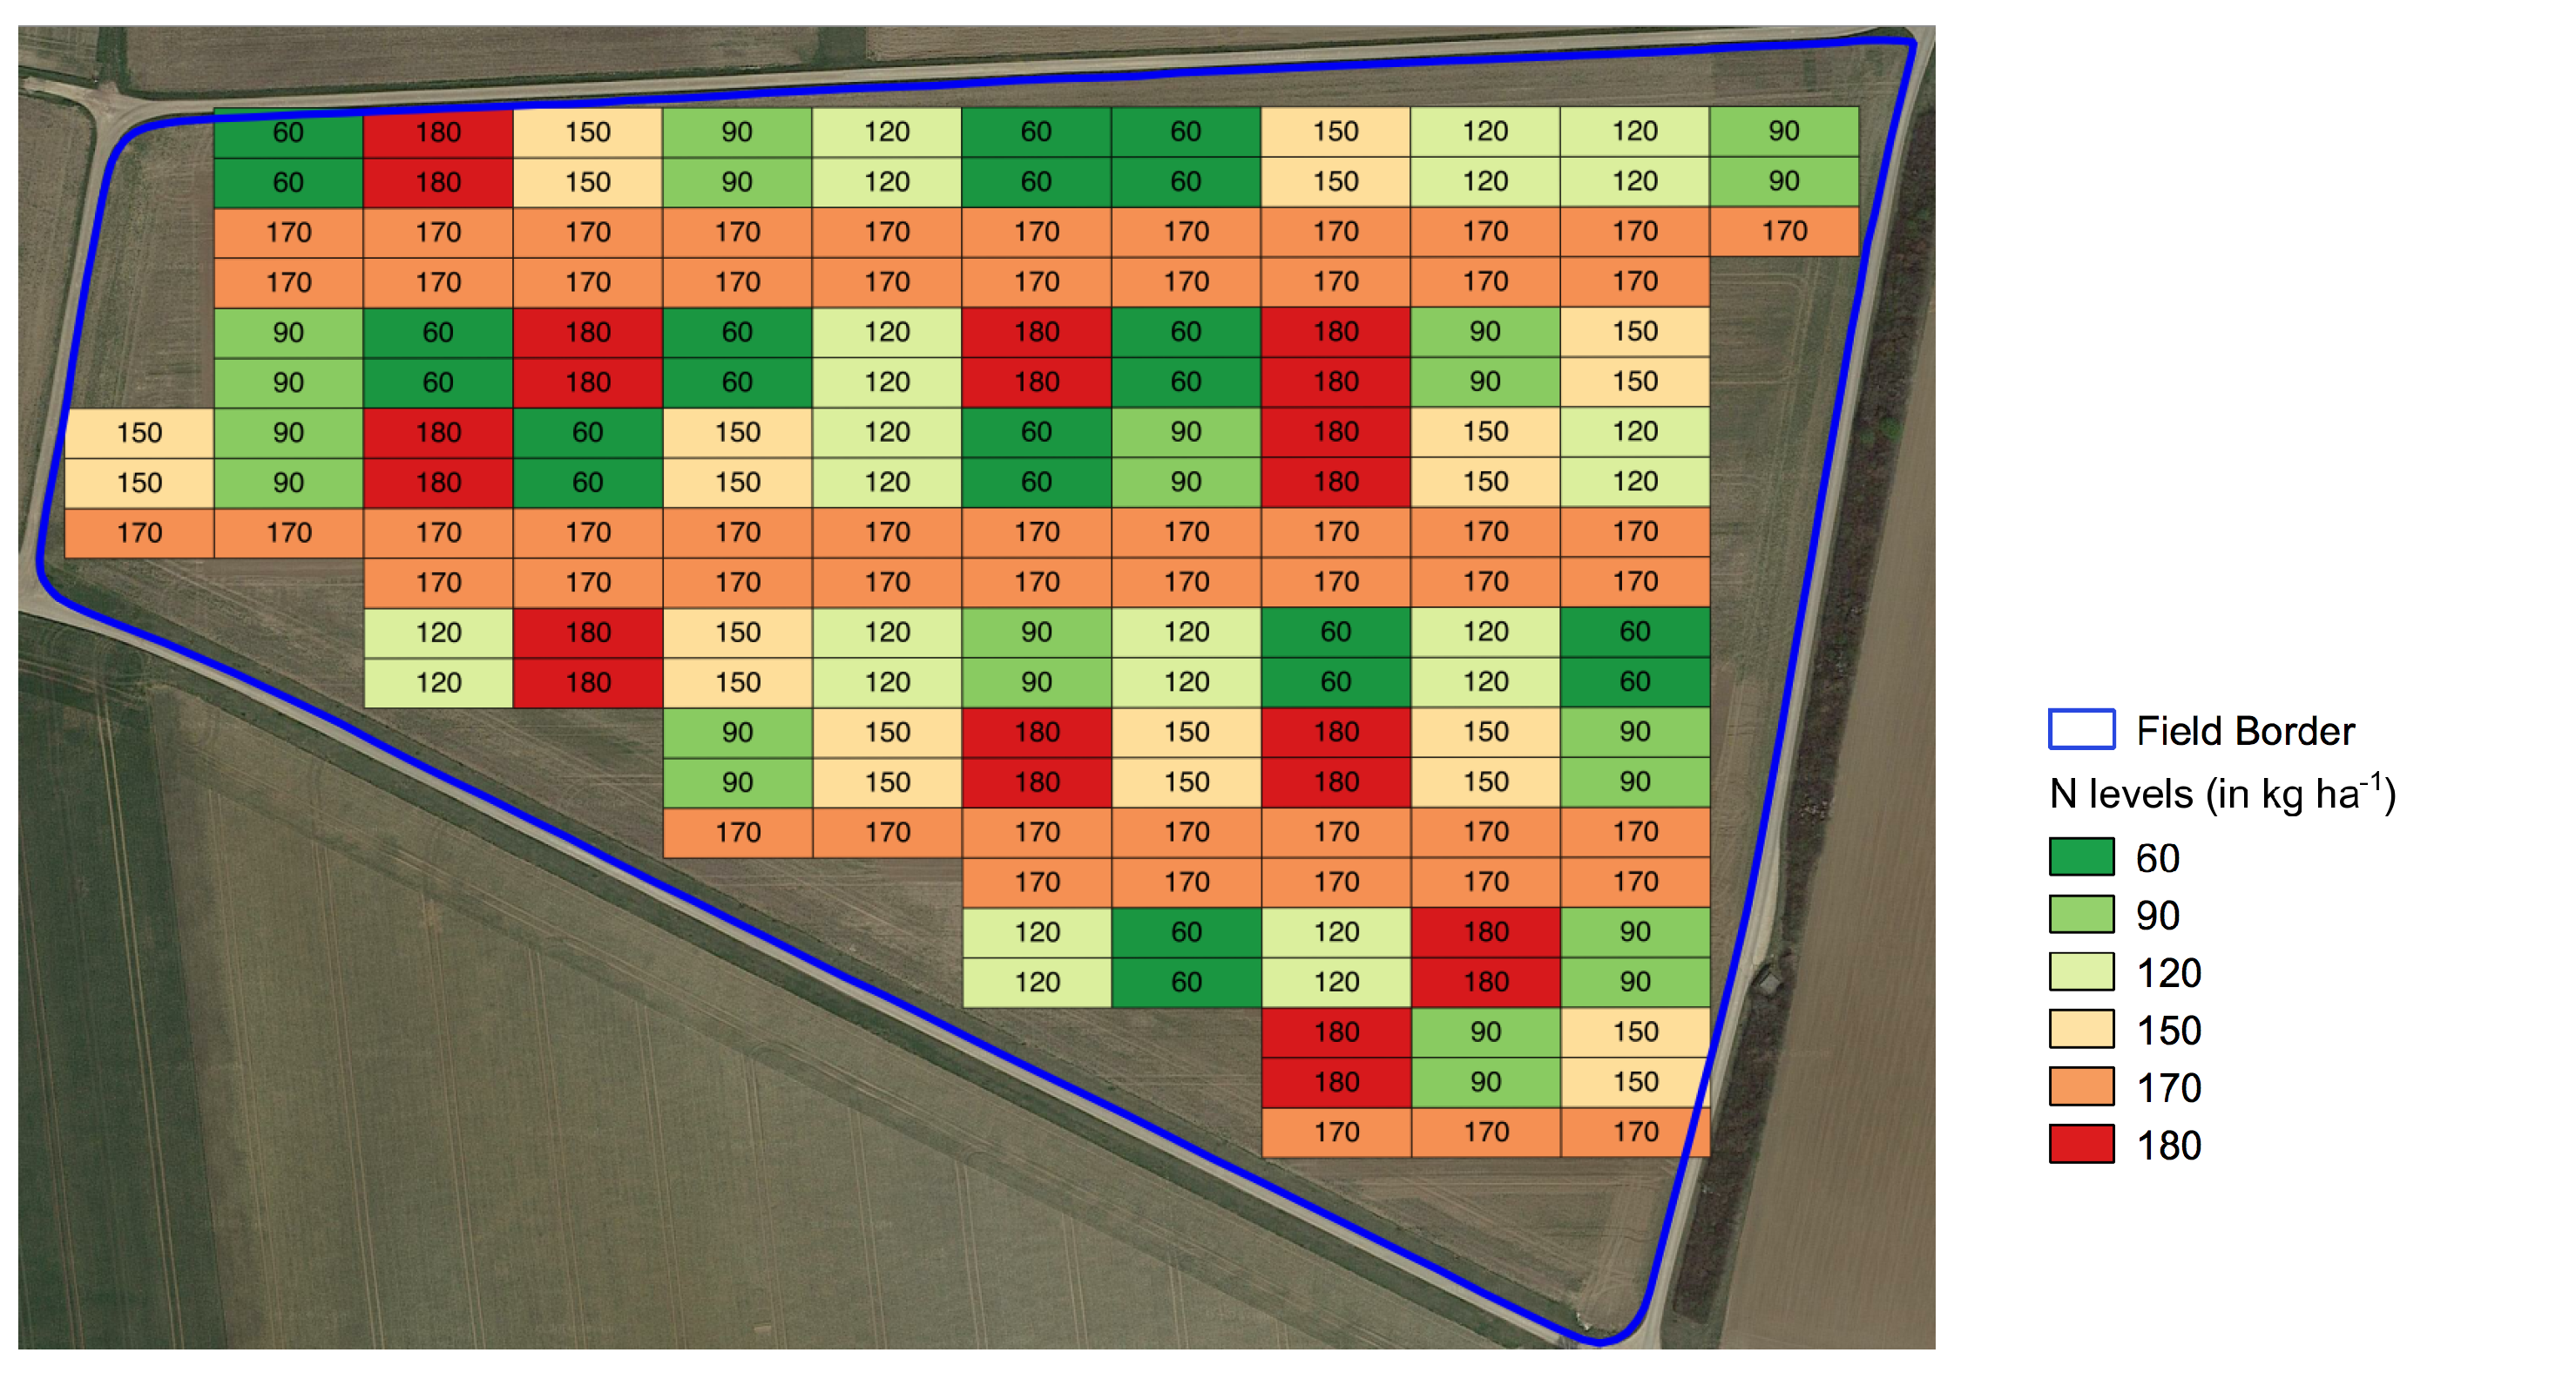
On site-year 1 and 4, the N levels ranged from 60 to 180 kg N·ha in five distinct levels. Additionally a dosage of 170 kg N·ha, that is usually applied on this farm, were used as the conventional application level. Figure 1 represents the N levels of site-year 1; site-year 4 had the same levels. Nitrogen was distributed in three fertiliser applications in the early growing periods (Zadoks’ Scale (Z) 27–Z 47) [15] with a pneumatic fertiliser spreader and a tractor with an automatic steering system and GPS Real-Time Kinematic (RTK) precision (approx. ±2.5 cm). The first N application of 60 kg N·ha has been distributed equally over the whole field. The second application had 0–80 kg N·ha based on the treatment; and the third application has been carried out with 0–40 kg·N ha to reach the planned total amount of N for the respective N level.
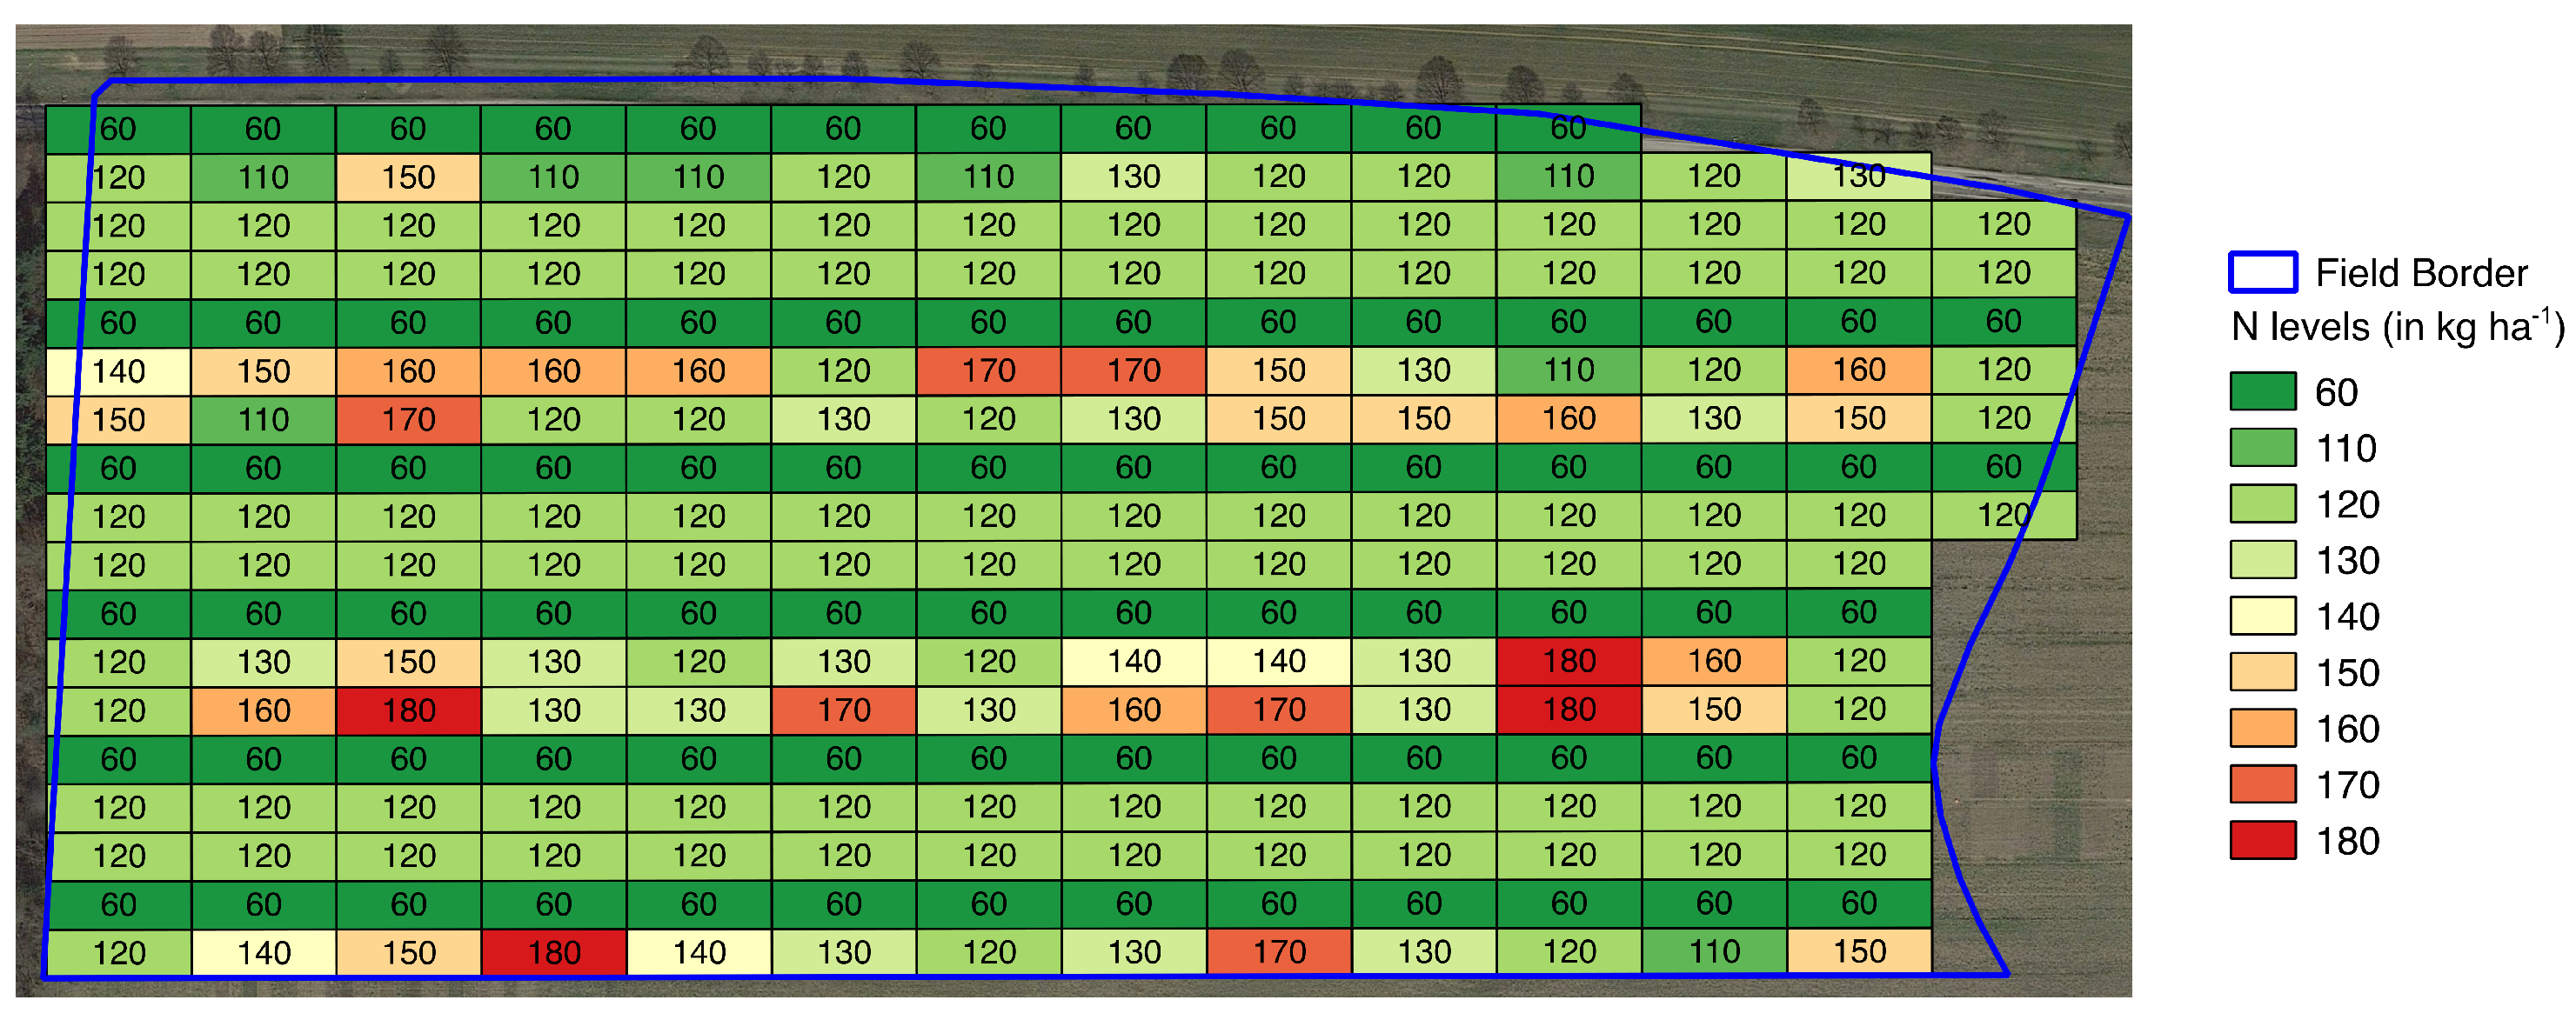
For site-year 2 + 3, the fertilisation was applied in repeating rows over the whole field: (1) control; (2) APOLLO model output [16]; and (3) Yara N-sensor control. The field design in this case was different compared to site-year 1 and 4, however it provided the required randomisation for the data analysis, with N levels from 60–170 kg N·ha in eight distinct levels (see Figure 2).
Table 1 gives an overview of the site characteristics for the research fields. The research fields at the location Ihinger Hof have a high, natural field variability with soil types reaching from pure clay to silty loam. All fields of the location Ihinger Hof were investigated in the year 2009 on their electrical soil conductivity with an EM38 sensor (Geonics Limited, Mississauga, ON, Canada).
On all four site-years, biomass (BM) samples have been collected over the whole field at three growing stages: stem elongation (approx. Z 35), flowering (approx. Z 61), and before harvest (approx. Z 93). To determine the N content in the soil (N-method), the samples were analysed on three soil depths: (1) 0–30 cm; (2) 30–60 cm; and (3) 60–90 cm. This took place at the end of tillering (Z 29) and after the harvest. The BM samples have been analysed for grains per ear, the number of tillers, the protein content and the BM weight. The wheat fields have been harvested with a standard New Holland combine harvester, equipped with a header of 6 m cutting width and a GPS receiver with RTK precision to geo-reference the yield data. The laboratory analysis and the yield logging are considered in the current manuscript as the ground truth data, with which the sensor data will be compared. The available N for the plant (N), used in this manuscript, is defined as the sum of N and applied N until the respective sensor measurement date. N is a simplified form to express the N supply for the plants in field, as atmospheric entries and mineralisation may provide additional N during the growing season. In spring, soil samples over the whole field have been taken and after harvesting. Table 2 gives an overview of the measurement dates for the ground and UAV mounted sensors for site-year 1. A similar frequency of the field sampling applies to the rest of the site-years.
2.2. Measurement Set-Up
The sensor measurements derive from data of three sensors, two spectrometer devices, FieldSpec Handheld (FS—Analytical Spectral Devices, Boulder, CO, USA), HandySpec Field (HS—tec5 AG, Oberursel, Germany), and the fluorescence sensor Multiplex Research (MP—Force-A, Orsay, France). The ground sensors (Table 3) were mounted on a rebuilt self propelled Hege 76 multi-equipment carrier (Wintersteiger AG, Ried, Austria), the so called Hohenheim multi-sensor platform ”Sensicle”; for more information and image see Keller et al. [3] and Zecha et al. [4]. The sensors mounted to the Sensicle have been adjusted at every measurement date at a specific height for each sensor relative to the canopy (Table 3). The spectrometers are passive sensors, highly dependent on the sun illumination. On the other hand, the MP fluorometer is insensitive to the ambient light conditions due to its light-emitting diodes (LEDs) used for signal excitation. More information about the sensors can be found in Table 3.
The Monolithic Miniature-Spectrometer (MMS) 1 NIR enhanced (Carl Zeiss Jena GmbH, Jena, Germany & tec5 AG, Oberursel, Germany) has been selected due to the compact dimension, the low weight of only 500 g, and the high spectral resolution [17]. It has similar technical properties like the HS sensor mounted on the Sensicle ground platform (Table 3). It was mounted in the centre of a fixed-wing UAV pointing with the detector to the ground and set to a flight altitude of 100 m above ground; for more information and images see Link et al. [17].
2.3. Information Fusion and Statistical Data Analysis
The ground sensor software for triggering the measurements has been developed by the respective sensor hardware companies. The data logging software for the aerial spectrometer has been developed in C++ for Windows mobile 5 on a Personal Digital Assistant (PDA) [17]. The sensor raw data have been processed and converted to features (indices and ratios) that correlate with field information and biological parameters. This has been done using Unix-Shell and awk scripts on Ubuntu 12.04 Long Term Support, in combination with the statistical software R [18]. For the spectral data, several indices were derived, allowing a comparison with other sensor data. Common plant characteristics like the chlorophyll content, are commonly used to determine the presence of stress or correlate with the field biomass [19,20]. In the current measurements, the following indices were calculated:
Red-Edge Inflection Point [21]
Normalised Difference Vegetation Index [22]
CropSpec [23]
Hyperspectral Vegetation Index e.g., [24]
For our analysis, a specific L value (canopy background adjustment factor) was used, 0.16 for OSAVI and 0.20 for SAVI. Concerning the Multiplex Research fluorescence sensor, the following signals and ratios were used, as described in Cerovic et al. [27] and Ghozlen et al. [28]. The index denotes the fluorescence type while the subindex denotes the wavelength excitation of the LEDs:
Anthocyanins
Flavonols
Fluorescence Excitation Ratio Anthocyanin Relative Index
Simple Fluorescence or Chlorophyll Ratio
The geographic information system (GIS) Quantum GIS [29] has been used for data visualisation and for merging the geo-referenced features in form of indices, signals and ratios with the field design. Linear regression, analysis of variance (ANOVA) and branch-and-bound algorithm have been employed to the sensor data features with the aid of R. After post-processing the data, all features (independent variables—IDV) have been intensively analysed and correlated against the ground truth data (dependent variables—DV).
3. Results
3.1. Field Conditions
The average yield amounts of all site-years per N level are presented in Table 4.
For the six N levels of site-year 1, yield showed an increasing amount with more N, except for the N level of 60 kg·ha (Table 4). The 60 kg·ha plots had a similar yield than the plots at a higher N level. On site-year 4, the average yield increased with the N levels until the level of 150 kg·ha. For the treatments of 150–180 kg·ha, the yield remained on a similar amount. For site-years 2 and 3, these fields have been fertilised with a different strategy, so the average yield amounts per N level are not directly comparable to site-years 1 and 4. As shown in Table 1, all fields used in this research have a high deviation for the electrical soil conductivity with values ranging from to Milli-Siemens (mS). The field belonging to site-year 2 and 3 has the highest range of all investigated fields.
3.2. Regression Analysis
The feature extraction of the sensor raw data, presented as wavelength indices and fluorescence ratios, have been taken as independent variables (IDV) for the linear regression. As dependent variables (DV) for the following results have been chosen: (1) wheat yield; (2) BM weight; (3) leaf area index (LAI); and (4) available N (N). The data analysis was carried out separately for each measurement date, to better observe the changes in correlation over time.
The linear regression results of the aerial sensor MMS1 data with the IDV’s of site-years 2 and 3 are shown in Table 5. These results were not significant for DV’s (1) and (3) of site-years 2 and 3, whereas DV LAI showed low correlations for site-year 2. The correlations with the DV’s BM and LAI could not be measured for site-year 3. The number of valid UAV data fitting to the design layout of site-years 1 and 4 was too low for a significant data analysis.
Table 6 and Table 7 present the correlation results of site-year 4 for the ground sensors MP and FS, only for Adj. r values > 0.46. The FERARI and SFR ratios are significant with yield and BM weight for end of heading and flowering growing stages onwards; the Yellow Fluorescence (BGF) correlates already at the beginning of stem elongation. For N, the SFR ratio and the RF signal show significant results (Table 6). The calculated indices HVI, NDVI, OSAVI of the FS sensor show correlations with yield over several measurements of the growing season. The CropSpec and REIP indices highly correlate with N for the end of heading stage and further on, HVI and NDVI on the other hand have a lower correlation (Table 7).
3.3. Data Validation
Basis of the data validation were the results of Zecha et al. [4], in which four mixed correlation models were presented, based on measurements with the same spectral and fluorescence sensors. From this research, Model 4 is proposed by the authors for cross-validation with the sensor data of site-years 1–3. The parameters A, B, C and D denominate the modelled coefficients of the linear regression—Model 4 as shown in [4]:
By cross-validating the above model with the data from site-years 1–3, the correlations were low. Using a Find-Best-Model-Algorithm in R for the data sets of all site-years, the following yield model has been discovered:
Table 8 highlights the corresponding correlations for Model 4 of site-year 4 and for the new model Yield, employed to the data sets of all site-years.
4. Discussion
This study describes the performance of the used optical sensors, and their ability of wheat yield, biomass and N assessment. Based on the yield amounts, the crop development had a steady growth for all site-years, despite of an irregular high yield amount of site-year 1 at the field plots with an N level of 60 kg·ha. The reason for this irregularity may be caused by the previous season in 2010. There, corn was planted which can have positive effects on the organic humus content of the field, e.g., Singh Brar et al. [30]. For site-years 1 and 4, the yield at N levels between 150 an 180 kg N·ha had no increasing effect on the grain quantity or quality [4]. A lower N level can be recommended for the fertiliser management of these fields for the cultivation of wheat. The total average yield of site-year 3 was 26.7% higher than on site-year 2, which is an indication of more BM in the field, that is able to produce more grain.
The UAV MMS1 spectrometer has similar technical properties like the HS spectrometer, however, the results of both sensors are on a different prediction level for the IDV’s in the presented research design. The analysis with the chosen DV’s yield and N for the MMS1 spectrometer data did not show any correlations. For site-year 2, there are low correlations for BM Weight and LAI; they were not repeatable for site-year 3 (Table 5). Reasons for the low or non existent correlations, based on the findings of Link et al. [17], are (1) a limited path accuracy with the consequence of outlaying data points not fitting to the research field design; (2) height inaccuracy of the UAV; (3) a short flight time of 15 min which required several flight missions to cover the entire research field; (4) that data post processing relies on accurate data from the autopilot system for pitch and roll correction of each data point, and on the control measurement of the MMS1 sensor at the start of the UAV. As the sensor in this setup only could be configured for continuous measurements, a lot of the logged data were of no use as they included the necessary flight turns and the surface measurements on the flight to the research field, Changing light conditions during the following flight mission affected the measurement precision in each design plot; and (5) the sensor footprint of 50.27 m with an overlapping factor of 0.33 [17], covering a larger area at each measurement than the ground sensors were able to acquire (Table 3). As a consequence, the MMS1 data had a higher averaged value than the ground sensor data, which results in a lower resolution and a lower detection accuracy. However, this may be sufficient depending on other investigation purposes, ensuring a stable flight altitude and an integrated fusion approach on a raw data or feature fusion level. Other aerial platform approaches, like an electric multicopter, may lead to better results due to its better flight stability and easier point to point navigation behaviour. Geipel et al. [31] took the same MMS1 spectrometer like in the presented manuscript and mounted it to a hexacopter. With the same ground-truth information via sampling the above-ground BM they were able to measure higher correlations with BM and grain yield, taking into account a data acquisition system for all involved sensors [32].
The MP fluorometer was able to detect significant correlations with grain yield (Adj. r of 0.48–0.63), notably in the ratios SFR with green and red excitation as well as in FERARI. They are linked to the chlorophyll content of the crop [33,34]. The correlations with the available N are high and reach Adj. r values of 0.63–0.67 at a later growing stage (Z 59 and Z 66) with the RF signal and the SFR ratio. The highest correlations are with BM related properties. The correlations with the BM weight range from an Adj. r of 0.46 at the early growing stage (Z 31), up to an Adj. r of 0.86 at ripening (Z 85) and senescence (Z 91) stages. Fluorescence sensors for agricultural usage on tractors or other mobile platforms are barely in use. Their required contact with the crop canopy is one of the reasons why most of the used agricultural sensors are based on spectral characteristics [35]. However, due to the active LED emission source of the MP sensor, it provides a profound, reliable and repeatable technology especially for measurements on the field with changing illumination. Hyperspectral line scanners do not require close contact with the crop canopy and use sun induced fluorescence, however their field application is still in discussion and used on a research level [36].
Spectral sensors are already well adopted at large modern farms, and are able to fuse the measured data with previously gathered data sets via a map overlay approach [2,37,38]. Also in scientific research spectral sensors have a high acceptance, as more than 90% of the spectral information on crop canopy is contained in the red and near infrared (NIR) spectral bands [39,40]. For the FS indices HVI, NDVI, OSAVI, REIP and CropSpec, the correlations with yield increased, starting at heading stage (Z 51) to a high level of an Adj. r = 0.67 at ripening stage (Z 85). Especially the indices CropSpec and REIP correlate very high with N and provide an Adj. r up to 0.86. For the BM characteristics, REIP, SAVI and CropSpec have high Adj. r values > 0.63 already from stem elongation stage onwards (Z 30). The r values of the HandySpec sensor data analysis was at a lower level than the ones from the FieldSpec sensor. They conclude in a maximum correlation of an Adj. r≤ 0.64 at a significance level <0.05, with the presented DV’s and IDV’s.
For research, the high correlations of the MP fluorometer and the FS sensor can be merged on a feature fusion level. This has been done by Zecha et al. [4] and in the presented manuscript with a data post-processing method. The developed Model 4 from site-year 4 has been applied to the data sets of site-years 1–3. Model 4 did not correlate on a significant level with the gathered sensor data in these three site-years. However, a similar combination of indices and ratios (model Yield) resulted in significant correlations for all four site-years, by changing only one parameter (FERARI with CropSpec). By this change, the Adj. r was between 0.32 and 0.74 two months before harvest for all site-years. The data analysis reveals that the more mixed indices and ratios are in a model, the higher and more robust the Adj. r values became, like RF and HVI, combined with index CropSpec or ratio FERARI, in the investigated linear models.
This model has a potential to continue working. Three out of the four parameters are exactly the same, providing results for the other three site-years. On the other hand, the ability of the presented model, predicting wheat yield by using unknown or different data, has not yet been validated, e.g., with machine learning methods proposed by Peña et al. [41] or as comparison with the linear models of Mortensen et al. [42] estimating above-ground biomass and N-uptake through aerial images. Future work needs to be done to train and test the real capabilities of this model, and to prove if it works.
5. Conclusions
- (i)
- The used aerial data collection system, as a combination of a fixed wing UAV and the MMS1 spectrometer, cannot be recommended for multispectral data acquisition like it has been done in the presented setup. A limited path accuracy, a short flight time of approx. 15 min including take-off, flight turns and landing, the MMS1 sensor setup in continuous measurement mode, independent sensor data logging and the related huge post-processing efforts, and the footprint along with an overlap of 30% make it unfavorable for a qualitative data analysis and feature correlation with ground truth data. For the aerial data acquisition, the authors recommend an integrated data acquisition system with all sensors connected via a sensor data infrastructure.
- (ii)
- Two ground sensors mounted to the Sensicle platform, the fluorometer Multiplex Research (MP) and the FieldSpec HandHeld (FS) spectrometer, had high correlations with wheat yield, available nitrogen and the sampled biomass characteristics from the field plots. The HandySpec Field (HS) spectrometer had lower significant correlations in all site-year than the FS sensor. The usage of the three ground sensors in continuous measurement mode is most reliable for the fluorometer MP. With an internal GPS sensor and an active LED source, measurement starts with one click and data storage on a SD card. The FS and HS spectrometer require an additional device for measurement triggering, and do rely on an external GPS receiver. The raw data post-processing cannot be handled without scripts, converting the raw data in features like indices, while calculating them with the white reference measurements, taken at the start of each continuous measurement series. The ability of the presented model, predicting wheat yield by using unknown or future data, has not yet been validated. Recommending the developed model for a general performance, further model training and model testing need to take place.
- (iii)
- An enhanced algorithm during the raw data calculation of the spectrometer, taking into account the ambient solar radiation during each continuous measurement mission, may improve the correlations and make the developed model more robust to apply it in earlier growing stages with high correlations. Advanced algorithms considering the factors (1) ambient solar radiation; (2) electrical soil conductivity; (3) aerial images with feature extraction; or (4) soil scoring may result in better yield predictions by providing the right decision for each spot in a field. In combination with the existent map overlay approaches of today’s spectral sensor systems, these complete and weighted decision can save field inputs and ensure the perfect crop development to reach the maximum yield for the specific field. Once, the field data collection and analysis process can be accomplished with sensors and software in an convenient way also for a farmer, the adoption of sensor technology in agriculture will increase.
Author Contributions
C.W.Z. collected the field data, made the statistical analysis and wrote the manuscript. G.G.P. contributed to the sensor data analysis and reviewed the document. J.L. proposed the field trial design, supported with the aerial data collection and the publication review. W.C. proposed the idea for the study and supported with editorial contributions.
Funding
The authors thank the Carl-Zeiss-Foundation (Carl-Zeiss-Stiftung, Germany) for funding this work as part of the collaborative project SenGIS at the University of Hohenheim (Stuttgart, Germany).
Acknowledgments
A special thanks to all colleagues within the SenGIS team, namely Johanna Link, Martin Weis, Gerassimos Peteinatos, Markus Jackenkroll, Martina Keller and Jakob Geipel, for all their support. Moreover, the authors acknowledge Andrea Richter for their support in the field.
Conflicts of Interest
The authors declare no conflict of interest.
References
- Auernhammer, H. Precision farming—The environmental challenge. Comput. Electron. Agric. 2001, 30, 31–43. [Google Scholar] [CrossRef]
- Adamchuk, V.I.; Rossel, R.A.V.; Sudduth, K.A.; Lammers, P.S. Sensor Fusion for Precision Agriculture. In Sensor Fusion—Foundation and Applications; Thomas, C., Ed.; InTech: Rijeka, Croatia, 2011; Chapter 2. [Google Scholar] [CrossRef] [Green Version]
- Keller, M.; Zecha, C.; Weis, M.; Link, J.; Gerhards, R.; Claupein, W. Competence centre SenGIS-exploring methods for georeferenced multi-sensor data acquisition, storage, handling and analysis. In Proceedings of the 8th European Conference on Precision Agriculture (ECPA), Prague, Czech Republic, 11–14 July 2011; Czech Centre for Science and Society: Ampthill, UK; Prague, Czech Republic, 2011; pp. 491–500. [Google Scholar]
- Zecha, C.W.; Link, J.; Claupein, W. Fluorescence and reflectance sensor comparison in winter wheat. Agriculture 2017, 7, 78. [Google Scholar] [CrossRef]
- Brooks, R.R.; Iyengar, S. Multi-Sensor Fusion: Fundamentals and Applications with Software; Prentice-Hall, Inc.: Upper Saddle River, NJ, USA, 1998. [Google Scholar]
- Hall, D.L.; Llinas, J. A challenge for the data fusion community I: Research imperatives for improved processing. In Proceedings of the 7th National Symposium on Sensor Fusion, Albuquerque, NM, USA, 16–18 March 1994. [Google Scholar]
- Dasarathy, B. Sensor fusion potential exploitation-innovative architectures and illustrative applications. Proc. IEEE 1997, 85, 24–38. [Google Scholar] [CrossRef]
- Elmenreich, W. An Introduction to Sensor Fusion; Technical Report; Vienna University of Technology, Department of Computer Engineering: Vienna, Austria, 2002. [Google Scholar]
- Dasarathy, B.V. Information Fusion—What, where, why, when, and how? Inf. Fusion 2001, 2, 75–76. [Google Scholar] [CrossRef]
- Thorp, K.R.; Wang, G.; Bronson, K.F.; Badaruddin, M.; Mon, J. Hyperspectral data mining to identify relevant canopy spectral features for estimating durum wheat growth, nitrogen status, and grain yield. Comput. Electron. Agric. 2017, 136, 1–12. [Google Scholar] [CrossRef]
- Mesas-Carrascosa, F.J.; Torres-Sánchez, J.; Clavero-Rumbao, I.; García-Ferrer, A.; Peña, J.M.; Borra-Serrano, I.; López-Granados, F. Assessing optimal flight parameters for generating accurate multispectral orthomosaicks by UAV to support site-specific crop management. Remote Sens. 2015, 7, 12793–12814. [Google Scholar] [CrossRef]
- Peteinatos, G.G.; Korsaeth, A.; Berge, T.W.; Gerhards, R. Using optical sensors to identify water deprivation, nitrogen shortage, weed presence and fungal infection in wheat. Agriculture 2016, 6, 24. [Google Scholar] [CrossRef]
- Zecha, C.W.; Link, J.; Claupein, W. Mobile sensor platforms: Categorisation and research applications in precision farming. J. Sens. Sens. Syst. 2013, 2, 51–72. [Google Scholar] [CrossRef]
- Beres, B.L.; Turkington, T.K.; Kutcher, H.R.; Irvine, B.; Johnson, E.N.; O’Donovan, J.T.; Harker, K.N.; Holzapfel, C.B.; Mohr, R.; Peng, G.; et al. Winter wheat cropping system response to seed treatments, seed size, and sowing density. Agron. J. 2016, 108, 1101–1111. [Google Scholar] [CrossRef]
- Zadoks, J.C.; Chang, T.T.; Konzak, C.F. A decimal code for the growth stages of cereals. Weed Res. 1974, 14, 415–421. [Google Scholar] [CrossRef]
- Link, J.; Graeff, S.; Batchelor, W.D.; Claupein, W. Evaluating the economic and environmental impact of environmental compensation payment policy under uniform and variable-rate nitrogen management. Agric. Syst. 2006, 91, 135–153. [Google Scholar] [CrossRef]
- Link, J.; Senner, D.; Claupein, W. Developing and evaluating an aerial sensor platform (ASP) to collect multispectral data for deriving management decisions in precision farming. Comput. Electron. Agric. 2013, 94, 20–28. [Google Scholar] [CrossRef]
- R Development Core Team. R: A Language and Environment for Statistical Computing; R Foundation for Statistical Computing: Vienna, Austria, 2008; ISBN 3-900051-07-0. [Google Scholar]
- Thenkabail, P.S.; Lyon, J.G.; Huete, A. (Eds.) Hyperspectral Remote Sensing of Vegetation, 1st ed.; Crc Press Inc.: Boca Raton, FL, USA, 2012. [Google Scholar] [CrossRef]
- Weis, M.; Andújar, D.; Peteinatos, G.G.; Gerhards, R. Improving the determination of plant characteristics by fusion of four different sensors. In Precision Agriculture ‘13; Stafford, J.V., Ed.; Wageningen Academic Publishers: Wageningen, The Netherlands, 2013; pp. 63–69. [Google Scholar]
- Horler, D.N.H.; Dockray, M.; Barber, J. The red edge of plant leaf reflectance. Int. J. Remote Sens. 1983, 4, 273–288. [Google Scholar] [CrossRef]
- Rouse, J.; Haas, R.; Schell, J.; Deering, D. Monitoring vegetation systems in the Great Plains with ERTS. In Third ERTS Symposium; NASA SP-351; Freden, S.C., Becker, M.A., Eds.; NASA: Washington, DC, USA, 1973; pp. 309–317. [Google Scholar]
- Reusch, S.; Jasper, J.; Link, A. Estimating crop biomass and nitrogen uptake using Cropspec, a newly developed active crop-canopy reflectance sensor. In Proceedings of the 10th International Conference on Positron Annihilation (ICPA), Denver, CO, USA, 18–21 July 2010; p. 381. [Google Scholar]
- Thenkabail, P.S.; Smith, R.B.; De Pauw, E. Hyperspectral vegetation indices and their relationships with agricultural crop characteristics. Remote Sens. Environ. 2000, 71, 158–182. [Google Scholar] [CrossRef]
- Huete, A. A soil-adjusted vegetation index (SAVI). Remote Sens. Environ. 1988, 25, 295–309. [Google Scholar] [CrossRef]
- Haboudane, D.; Miller, J.R.; Tremblay, N.; Zarco-Tejada, P.J.; Dextraze, L. Integrated narrow-band vegetation indices for prediction of crop chlorophyll content for application to precision agriculture. Remote Sens. Environ. 2002, 81, 416–426. [Google Scholar] [CrossRef]
- Cerovic, Z.; Moise, N.; Agati, G.; Latouche, G.; Ben Ghozlen, N.; Meyer, S. New portable optical sensors for the assessment of winegrape phenolic maturity based on berry fluorescence. J. Food Compos. Anal. 2008, 21, 650–654. [Google Scholar] [CrossRef]
- Ghozlen, N.B.; Cerovic, Z.G.; Germain, C.; Toutain, S.; Latouche, G. Non-destructive optical monitoring of grape maturation by proximal sensing. Sensors 2010, 10, 10040–10068. [Google Scholar] [CrossRef] [PubMed]
- QGIS Development Team. QGIS Geographic Information System; Open Source Geospatial Foundation: Chicago, IL, USA, 2009. [Google Scholar]
- Singh Brar, B.; Singh, J.; Singh, G.; Kaur, G. Effects of long term application of inorganic and organic fertilizers on soil organic carbon and physical properties in maize–wheat rotation. Agronomy 2015, 5, 220–238. [Google Scholar] [CrossRef]
- Geipel, J.; Link, J.; Wirwahn, J.A.; Claupein, W. A Programmable aerial multispectral camera system for in-season crop biomass and nitrogen content estimation. Agriculture 2016, 6. [Google Scholar] [CrossRef]
- Geipel, J.; Jackenkroll, M.; Weis, M.; Claupein, W. A sensor web-enabled infrastructure for Precision Farming. ISPRS Int. J. Geo-Inf. 2015, 4, 385–399. [Google Scholar] [CrossRef]
- Lichtenthaler, H.; Buschmann, C.; Rinderle, U.; Schmuck, G. Application of chlorophyll fluorescence in ecophysiology. Radiat. Environ. Biophys. 1986, 25, 297–308. [Google Scholar] [CrossRef] [PubMed]
- Buschmann, C. Variability and application of the chlorophyll fluorescence emission ratio red/far-red of leaves. Photosynth. Res. 2007, 92, 261–271. [Google Scholar] [CrossRef] [PubMed]
- Tremblay, N.; Wang, Z.; Cerovic, Z.G. Sensing crop nitrogen status with fluorescence indicators. A review. Agron. Sustain. Dev. 2011, 32, 451–464. [Google Scholar] [CrossRef]
- Broge, N.; Mortensen, J. Deriving green crop area index and canopy chlorophyll density of winter wheat from spectral reflectance data. Remote Sens. Environ. 2002, 81, 45–57. [Google Scholar] [CrossRef]
- Bill, R.; Nash, E.; Grenzdörffer, G. GIS in Agriculture. In Springer Handbook of Geographic Information; Danko, D.M., Kresse, W., Eds.; Springer: Berlin/Heidelberg, Germany, 2011; pp. 461–476. [Google Scholar]
- Stone, M.L.; Raun, W.R. Sensing Technology for Precision Crop Farming. In Precision Agriculture Technology for Crop Farming; Zhang, Q., Ed.; CRC Press: Boca Raton, FL, USA, 2015; Chapter 2; pp. 21–54. [Google Scholar]
- Sheffield, C. Selecting band combinations from multispectral data. Photogramm. Eng. Remote Sens. 1985, 51, 681–687. [Google Scholar]
- Li, H.; Zhao, C.; Yang, G.; Feng, H. Variations in crop variables within wheat canopies and responses of canopy spectral characteristics and derived vegetation indices to different vertical leaf layers and spikes. Remote Sens. Environ. 2015, 169, 358–374. [Google Scholar] [CrossRef]
- Peña, J.M.; Gutiérrez, P.A.; Hervás-Martínez, C.; Six, J.; Plant, R.E.; López-Granados, F. Object-based image classification of summer crops with machine learning methods. Remote Sens. 2014, 6, 5019–5041. [Google Scholar] [CrossRef]
- Mortensen, A.K.; Gislum, R.; Larsen, R.; Jørgensen, R.N. Estimation of above-ground dry matter and nitrogen uptake in catch crops using images acquired from an octocopter. In Precision Agriculture ’15; Wageningen Academic Publishers: Wageningen, The Netherlands, 2015; pp. 227–234. [Google Scholar]
Figure 1.
The colored plots reflect the different N levels in kg N·ha for site-year 1, as shown in the legend. Each plot has a size of 36 m × 12 m (L × W).
Figure 1.
The colored plots reflect the different N levels in kg N·ha for site-year 1, as shown in the legend. Each plot has a size of 36 m × 12 m (L × W).

Figure 2.
The colored plots reflect the different N levels for site-years 2 and 3, as shown in the legend. Each plot has a size of 36 m × 12 m (L × W).
Figure 2.
The colored plots reflect the different N levels for site-years 2 and 3, as shown in the legend. Each plot has a size of 36 m × 12 m (L × W).


Table 1.
Site characteristics for winter wheat (Triticum aestivum L.): plant density (No.·m), seeding and harvest dates, and electrical soil conductivity (mS), of the three research fields Inneres Täle (IT), Riech (RI) and Lammwirt (LW) at experimental site Ihinger Hof, Renningen (Germany). C = Corn, WW = Winter wheat, OSR = Oilseed rape, T = Toras, S = Schamane, SD = Standard deviation.
| Site-Year | Site | Year | Previous Crop | Variety | Plant Density | Seeding Date | Harvesting Date | Soil Conductivity | |||
|---|---|---|---|---|---|---|---|---|---|---|---|
| Min | Mean | Max | SD | ||||||||
| 1 | IT | 2011 | C | T | 340 | 27 November 2010 | 11 August 2011 | 19.68 | 38.19 | 56.98 | 4.93 |
| 2 | RI | 2011 | WW | S | 300 | 14 October 2010 | 4 August 2011 | 14.48 | 31.82 | 69.53 | 6.01 |
| 3 | RI | 2012 | WW | S | 300 | 17 October 2011 | 31 July 2012 | 14.48 | 31.82 | 69.53 | 6.01 |
| 4 | LW | 2012 | OSR | T | 300 | 14 October 2011 | 1 August 2012 | 52.49 | 64.48 | 85.57 | 6.38 |
Table 2.
Exemplary for the other site-years, the overview shows the dates for site-year 1 (2011) regarding ground and aerial sampling in the different growing stages (Z). A = aerial spectrometer, G = ground spectrometer.
Table 2.
Exemplary for the other site-years, the overview shows the dates for site-year 1 (2011) regarding ground and aerial sampling in the different growing stages (Z). A = aerial spectrometer, G = ground spectrometer.
| Z | Spectrometer | Fluorescence Sensor |
|---|---|---|
| 30 | G: 28 April 2011 | 28 April 2011 |
| 37 | A + G: 20 May 2011 | 20 May 2011 |
| 75 | G: 16 June 2011 | 16 June 2011 |
| 77 | G: 28 June 2011 | 28 June 2011 |
| 85 | A: 4 July 2011, G: 6 July 2011 | 6 July 2011 |
Table 3.
Used sensor devices and sensor details. BGF = Blue-Green Fluorescence; RF = Red Fluorescence; FRF = Far-Red Fluorescence.
Table 3.
Used sensor devices and sensor details. BGF = Blue-Green Fluorescence; RF = Red Fluorescence; FRF = Far-Red Fluorescence.
| Type | Manufacturer | Sensor Model | Wavelength Range | Spectral Resolution | Footprint | Classification |
|---|---|---|---|---|---|---|
| Spectrometry | Analytical Spectral Devices | FieldSpec Handheld | 325–1075 nm | 1 nm | 2.74 m | Passive, Ground |
| tec5 AG | HandySpec Field | 360–1000 nm | 10 nm | 0.44 m | Passive; Ground | |
| Carl Zeiss Jena GmbH & tec5 AG | MMS1 NIR enhanced | 310–1110 nm | 3.3 nm | 50.27 m | Passive, Aerial | |
| Fluorescence | Force-A | Multiplex Research | BGF, RF and FRF | – | 0.005 m | Active, Ground |
Table 4.
Average grain yield (t·ha) for winter wheat (Triticum aestivum L.) with 14% grain moisture content at the different N levels (kg·ha) of the four site-years.
Table 4.
Average grain yield (t·ha) for winter wheat (Triticum aestivum L.) with 14% grain moisture content at the different N levels (kg·ha) of the four site-years.
| Site-Year | Yield for N Levels | |||||
|---|---|---|---|---|---|---|
| 60 | 90 | 120 | 150 | 170 | 180 | |
| 1 | 7.2 | 6.7 | 6.7 | 7.1 | 7.3 | 7.3 |
| 2 | 4.9 | - | 4.9 | 5.4 | 5.3 | 5.9 |
| 3 | 6.5 | - | 6.3 | 6.6 | 6.9 | 6.6 |
| 4 | 6.2 | 6.5 | 7.5 | 7.8 | 7.9 | 7.9 |
Table 5.
Linear regression analysis of UAV MMS1 sensor indices for site-years 2 and 3. Z = Zadoks’ Scale, DV = Dependent Variable, IDV = Independent Variable, RMSE = Root mean square error, BM = Biomass, LAI = Leaf Area Index, HVI = Hyperspectral Vegetation Index, OSAVI = Optimized Soil-Adjusted Vegetation Index, REIP = Red-Edge Inflection Point, PVR = Plant Vigor Ratio, TCARI = Transformed Chlorophyll Absorption Reflectance Index.
| Season | Z | DV | IDV | Adj. r | RMSE | p-Value |
|---|---|---|---|---|---|---|
| 2011 | 73 | LAI | HVI | 0.15 | 0.31 | 0.0144 |
| 73 | NDVI | 0.24 | 0.30 | 0.0020 | ||
| 73 | OSAVI | 0.23 | 0.30 | 0.0024 | ||
| 73 | REIP | 0.18 | 0.31 | 0.0077 | ||
| 66 | BM Weight | HVI | 0.13 | 1521.64 | 0.0000 | |
| 73 | HVI | 0.21 | 852.72 | 0.0039 | ||
| 34 | NDVI | 0.22 | 794.57 | 0.0246 | ||
| 73 | NDVI | 0.23 | 838.76 | 0.0022 | ||
| 34 | OSAVI | 0.22 | 793.42 | 0.0240 | ||
| 73 | OSAVI | 0.23 | 842.12 | 0.0025 | ||
| 34 | PVR | 0.19 | 812.01 | 0.0374 | ||
| 73 | REIP | 0.17 | 875.04 | 0.0095 | ||
| 2012 | 61 | LAI | REIP | 0.09 | 0.47 | 0.0153 |
| 85 | NDVIg | 0.08 | 0.49 | 0.0286 | ||
| 85 | HNDVI | 0.08 | 0.49 | 0.0304 | ||
| 85 | OSAVI | 0.07 | 0.49 | 0.0315 | ||
| 85 | NDVI | 0.07 | 0.49 | 0.0332 | ||
| 61 | BM Weight | TCARI | 0.08 | 117.17 | 0.0229 |
Table 6.
Linear regression analysis of signals and ratios from Multiplex Research fluorescence sensor for site-year 4. Z = Zadoks’ Scale, DV = Dependent Variable, IDV = Independent Variable, RMSE = Root mean square error, BM = Biomass, FERARI = Fluorescence Excitation Ratio Anthocyanin Relative Index, SFR = Simple Fluorescence Ratio, BGF = Yellow Fluorescence. Significance level: p-value < 0.001.
| Z | DV | IDV | Adj. r | RMSE |
|---|---|---|---|---|
| 66 | Yield | FERARI | 0.48 | 0.75 |
| 85 | FERARI | 0.49 | 0.74 | |
| 59 | SFR | 0.53 | 0.71 | |
| 85 | SFR | 0.61 | 0.65 | |
| 59 | SFR | 0.56 | 0.69 | |
| 85 | SFR | 0.63 | 0.64 | |
| 59 | N | SFR | 0.67 | 16.52 |
| 66 | RF | 0.63 | 26.77 | |
| 31 | BM Weight | BGF | 0.46 | 97.66 |
| 59 | BGF | 0.61 | 83.32 | |
| 85 | BGF | 0.73 | 69.21 | |
| 91 | BGF | 0.74 | 68.11 | |
| 85 | FERARI | 0.83 | 55.25 | |
| 85 | FLAV | 0.62 | 81.98 | |
| 85 | FRF | 0.86 | 50.40 | |
| 85 | RF | 0.83 | 54.91 | |
| 85 | SFR | 0.85 | 52.14 |
Table 7.
Linear regression analysis of indices from spectrometer FieldSpec HandHeld for site-year 4. Z = Zadoks’ Scale, DV = Dependent Variable, IDV = Independent Variable, RMSE = Root mean square error, BM = Biomass. Significance level: p-value < 0.001.
Table 7.
Linear regression analysis of indices from spectrometer FieldSpec HandHeld for site-year 4. Z = Zadoks’ Scale, DV = Dependent Variable, IDV = Independent Variable, RMSE = Root mean square error, BM = Biomass. Significance level: p-value < 0.001.
| Z | DV | IDV | Adj. r | RMSE |
|---|---|---|---|---|
| 59 | Yield | HVI | 0.56 | 0.68 |
| 66 | HVI | 0.54 | 0.70 | |
| 85 | HVI | 0.59 | 0.65 | |
| 66 | NDVI | 0.56 | 0.70 | |
| 85 | NDVI | 0.63 | 0.62 | |
| 59 | OSAVI | 0.55 | 0.69 | |
| 85 | OSAVI | 0.67 | 0.58 | |
| 85 | REIP | 0.54 | 0.69 | |
| 85 | CropSpec | 0.53 | 0.70 | |
| 59 | N | CropSpec | 0.79 | 13.12 |
| 66 | CropSpec | 0.68 | 24.57 | |
| 85 | CropSpec | 0.78 | 20.56 | |
| 59 | HVI | 0.69 | 15.98 | |
| 66 | HVI | 0.67 | 25.08 | |
| 85 | HVI | 0.68 | 24.78 | |
| 66 | NDVI | 0.62 | 27.15 | |
| 85 | NDVI | 0.62 | 26.91 | |
| 59 | REIP | 0.86 | 10.76 | |
| 66 | REIP | 0.76 | 21.40 | |
| 85 | REIP | 0.83 | 18.04 | |
| 31 | BM Weight | REIP | 0.78 | 67.07 |
| 85 | SAVI | 0.75 | 67.22 |
Table 8.
Adj. r values of Model 4 and model Yield for the corresponding FS indices and MP signal, grouped by months and site-years. n.a. = not available, n.s. = not significant. p-values for Model 4 < 0.05. p-values for Yield< 0.001.
Table 8.
Adj. r values of Model 4 and model Yield for the corresponding FS indices and MP signal, grouped by months and site-years. n.a. = not available, n.s. = not significant. p-values for Model 4 < 0.05. p-values for Yield< 0.001.
| Model | Site-Year | April | May | June | July |
|---|---|---|---|---|---|
| Model 4 | 4 | 0.52 | 0.52 + 0.79 | 0.75 + 0.77 | 0.20 |
| Yield | 1 | 0.18 | 0.24 | 0.40 + 0.47 | 0.47 |
| 2 | 0.17 | n.a. | 0.32 | 0.37 | |
| 3 | n.s. | 0.31 | 0.40 | 0.39 | |
| 4 | 0.26 + 0.40 | 0.50 + 0.71 | 0.64 + 0.74 | 0.66 |
© 2018 by the authors. Licensee MDPI, Basel, Switzerland. This article is an open access article distributed under the terms and conditions of the Creative Commons Attribution (CC BY) license (http://creativecommons.org/licenses/by/4.0/).
Share and Cite
MDPI and ACS Style
Zecha, C.W.; Peteinatos, G.G.; Link, J.; Claupein, W. Utilisation of Ground and Airborne Optical Sensors for Nitrogen Level Identification and Yield Prediction in Wheat. Agriculture 2018, 8, 79. https://doi.org/10.3390/agriculture8060079
AMA Style
Zecha CW, Peteinatos GG, Link J, Claupein W. Utilisation of Ground and Airborne Optical Sensors for Nitrogen Level Identification and Yield Prediction in Wheat. Agriculture. 2018; 8(6):79. https://doi.org/10.3390/agriculture8060079
Chicago/Turabian StyleZecha, Christoph W., Gerassimos G. Peteinatos, Johanna Link, and Wilhelm Claupein. 2018. "Utilisation of Ground and Airborne Optical Sensors for Nitrogen Level Identification and Yield Prediction in Wheat" Agriculture 8, no. 6: 79. https://doi.org/10.3390/agriculture8060079
Note that from the first issue of 2016, this journal uses article numbers instead of page numbers. See further details here.