Article

Does Solar Radiation Affect the Distribution of Dubas Bug (Ommatissus lybicus de Bergevin) Infestation

by
Rashid H. Al Shidi
1,2,*,
Lalit Kumar
1,
Salim A. H. Al-Khatri
2,
Mohammed S. Alaufi
2 and
Malik M. Albahri
2
1
Ecosystem Management, School of Environmental and Rural Science, University of New England, Armidale, NSW 2351, Australia
2
Directorate General of Agriculture and Livestock Research, Ministry of Agriculture and Fisheries, P.O. Box 50, PC 121 Seeb, Sultanate of Oman
*
Author to whom correspondence should be addressed.
Agriculture 2018, 8(7), 107; https://doi.org/10.3390/agriculture8070107
Submission received: 30 May 2018 / Revised: 28 June 2018 / Accepted: 2 July 2018 / Published: 5 July 2018
(This article belongs to the Special Issue Remote Sensing in Agricultural System)

Abstract

:
The Dubas bug Ommatissus lybicus is a serious pest of date palms. The infestation level of the Dubas bug varies from location to location, as well as from one season to the next. Climate factors are considered to be the main drivers for fluctuations in infestation levels. Few studies have examined the effects of solar radiation on O. lybicus infestation. This study was undertaken to examine the effect of solar radiation on O. lybicus infestation levels in Oman. Infestation data were collected during the spring infestation seasons of 2009 and 2016 from 49 and 69 locations, respectively, from seven governorates of North Oman. The monthly clear-sky potential solar radiation was calculated from a digital elevation model (DEM) with 20-m resolution in the ArcGIS environment, and the average daily solar radiation was calculated for each month. Ordinary least square regression (OLS) and geographic weight regression (GWR) models were run to find the relationship between infestation levels and solar radiation. The infestation level ranged from 0.02 insect/leaflet to 32.98 insects/leaflet, with an average of 7.50 insects/leaflet in 2009 and 0.17 insect/leaflet to 17.52 insects/leaflet, with an average of 4.38 insects/leaflet in 2016. The highest solar radiation was recorded in June, with an average of 27.7 MJ/m2/day, and the minimum was in December, with an average of 14.1 MJ/m2/day. The higher infestation rate showed a weak correlation with solar radiation.

1. Introduction

The Dubas bug, Ommatissus lybicus de Bergevin (Hemiptera: Tropiduchidae), is the main and most serious crop pest of the date palms Phoenix dactylifera Linnaeus (Arecales: Arecaceae) in Oman [1,2], and in other regions of the Middle East and North Africa. It is considered a monophagous insect, as it attacks only P. dactylifera [3]. It has two generations each year, during which the bugs actively feed, the nymphs develop into different stages and into adults, and the females lay eggs. The two generations occur in the spring and autumn. In the first generation, eggs start to hatch around February to March, and the presence of nymphs and adults extends to May. The adults lay eggs that diapause until next season. In the autumn generation, eggs start to hatch in August, and the nymphs and adults extend until November and laid eggs that diapause until next February (spring season). Nymphs and adults feed by sucking sap from the palm fronds, thereby draining the date palm trees of nutrients. The insects expel excess honeydew as they feed on the date plants [1,4,5,6,7,8]. Honeydew accumulation on date palm surfaces promotes fungus growth on the leaves and affects photosynthesis, which in turn leads to a reduction in date palm growth and productivity. In addition, the presence of honeydew makes the trees and the immediate surrounding land sticky, thereby complicating cultural practices, plantation management, and services. The economic impact of O. lybicus is estimated at around 28% in Oman [9,10].
The effects of solar radiation on crop pest factors such as infestation, population, crop damage, impact, biological growth rate, and ecology have been studied by many researchers over the past five decades. For instance, Mazza et al. [11] found direct and indirect relationships between solar radiation and infestation by the thrip Caliothrips phaseoli Hood and the soybean worm Anticarsia gemmatalis Hübner on soybean crops. Kampichler and Teschner [12] found a higher infestation by Mikiola fagi Hartig on plant canopies exposed to high solar radiation. Mezei et al. [13] found a significant positive relationship between the pheromone trap catches of spruce bark beetle Ips typographus Linnaeus and solar radiation. Pepper and Hastings [14] found that solar radiation increased the body temperature of three species of grasshopper by 12 °C, even at low air temperatures. Cena and Clark [15] found that the honey bee thorax temperature was higher under sunny conditions than under cloudy conditions. Nel and Hewitt [16] found a negative effect of solar radiation on the harvester termite Hodotermes mossambicus Hagen, in which the mortality rate of both larvae and adults increased as the duration of sunlight increased. Odera [17] found that the death rate for cone insects on eastern white pine Pinus strobus Linnaeus was higher for insects exposed to solar radiation than for insects in shaded areas. Battisti et al. [18] studied the effect of solar radiation on the initial larval stage of Thaumetopoea pinivora Treitschke feeding on Pinus sylvestris Linnaeus plants, and reported that the larval growth rate increased with solar radiation. de Groot and Kogoj [19] found a positive relation between solar radiation and the population size of Cheilosia fasciata. Schiner and Egger and Selas et al. [20], who studied the effect of sun patches on the populations of different moths in a birch forest in central Norway, reported that moth larvae preferred plants that were exposed to direct sunlight in the winter periods; however, the population decreased significantly with increases in sun patches. Conte et al. [21] found that Culicoides imicola Kieffer preferred areas exposed to sunlight compared with Obsoletus Complex Culicoides pulicaris Linnaeus, which preferred sheltered and dense plant areas.
Obtaining a clear relationship between solar radiation and living organisms requires that solar radiation be measured in small sized patches (fine spatial resolution) to provide a good representation of the spatial variation in solar radiation at every location [22]. The geographic information system (GIS) has become a key platform for solar radiation modeling because it easily handles spatial data. A digital elevation model (DEM) is used in a GIS to estimate the viewshed of a certain point/area toward the sky [23,24,25]. Kumar et al. [22] proposed a widely used GIS-based solar radiation model that could calculate the received solar radiation on a daily basis, and then be integrated with other spatial data to study the relationship between solar radiation and plant/animal species.
Many studies have been undertaken to understand the various biological parameters of O. lybicus [2,26,27,28]. These studies represent the fundamental basis of insect ecology [29,30]. In addition, general temporal seasonal patterns have been documented in most countries where O. lybicus is a serious pest. However, this temporal scenario is subject to variances due to differences in climate, weather, and environment from year to year. Oman has a wide geographic variance, which increases the importance of the climate difference from location to location; therefore, O. lybicus infestation varies temporally with differences in temperature and humidity within the season itself, as well as from season to season and from year to year [2,31]. Mahmoudi et al. [32] found a negative relationship between the hourly solar radiation and O. lybicus populations in Hormozgan and the southern Fars province, Iran.
Despite these previous studies, no study has been undertaken that investigates the relationship between the O. lybicus and solar radiation in relation to topography variance, especially at broad scales. The aim of this study was to model spatial and temporal variation in solar radiation based on fine resolution DEM layers using a GIS, and then to use the obtained data and data on the presence and density of O. lybicus infestation in Oman to understand the relationship between solar radiation and the infestation levels and spatial distribution of O. lybicus. This is the first study of this kind to investigate the relationship between solar radiation and the presence and density of O. lybicus across a country.

2. Materials and Methods
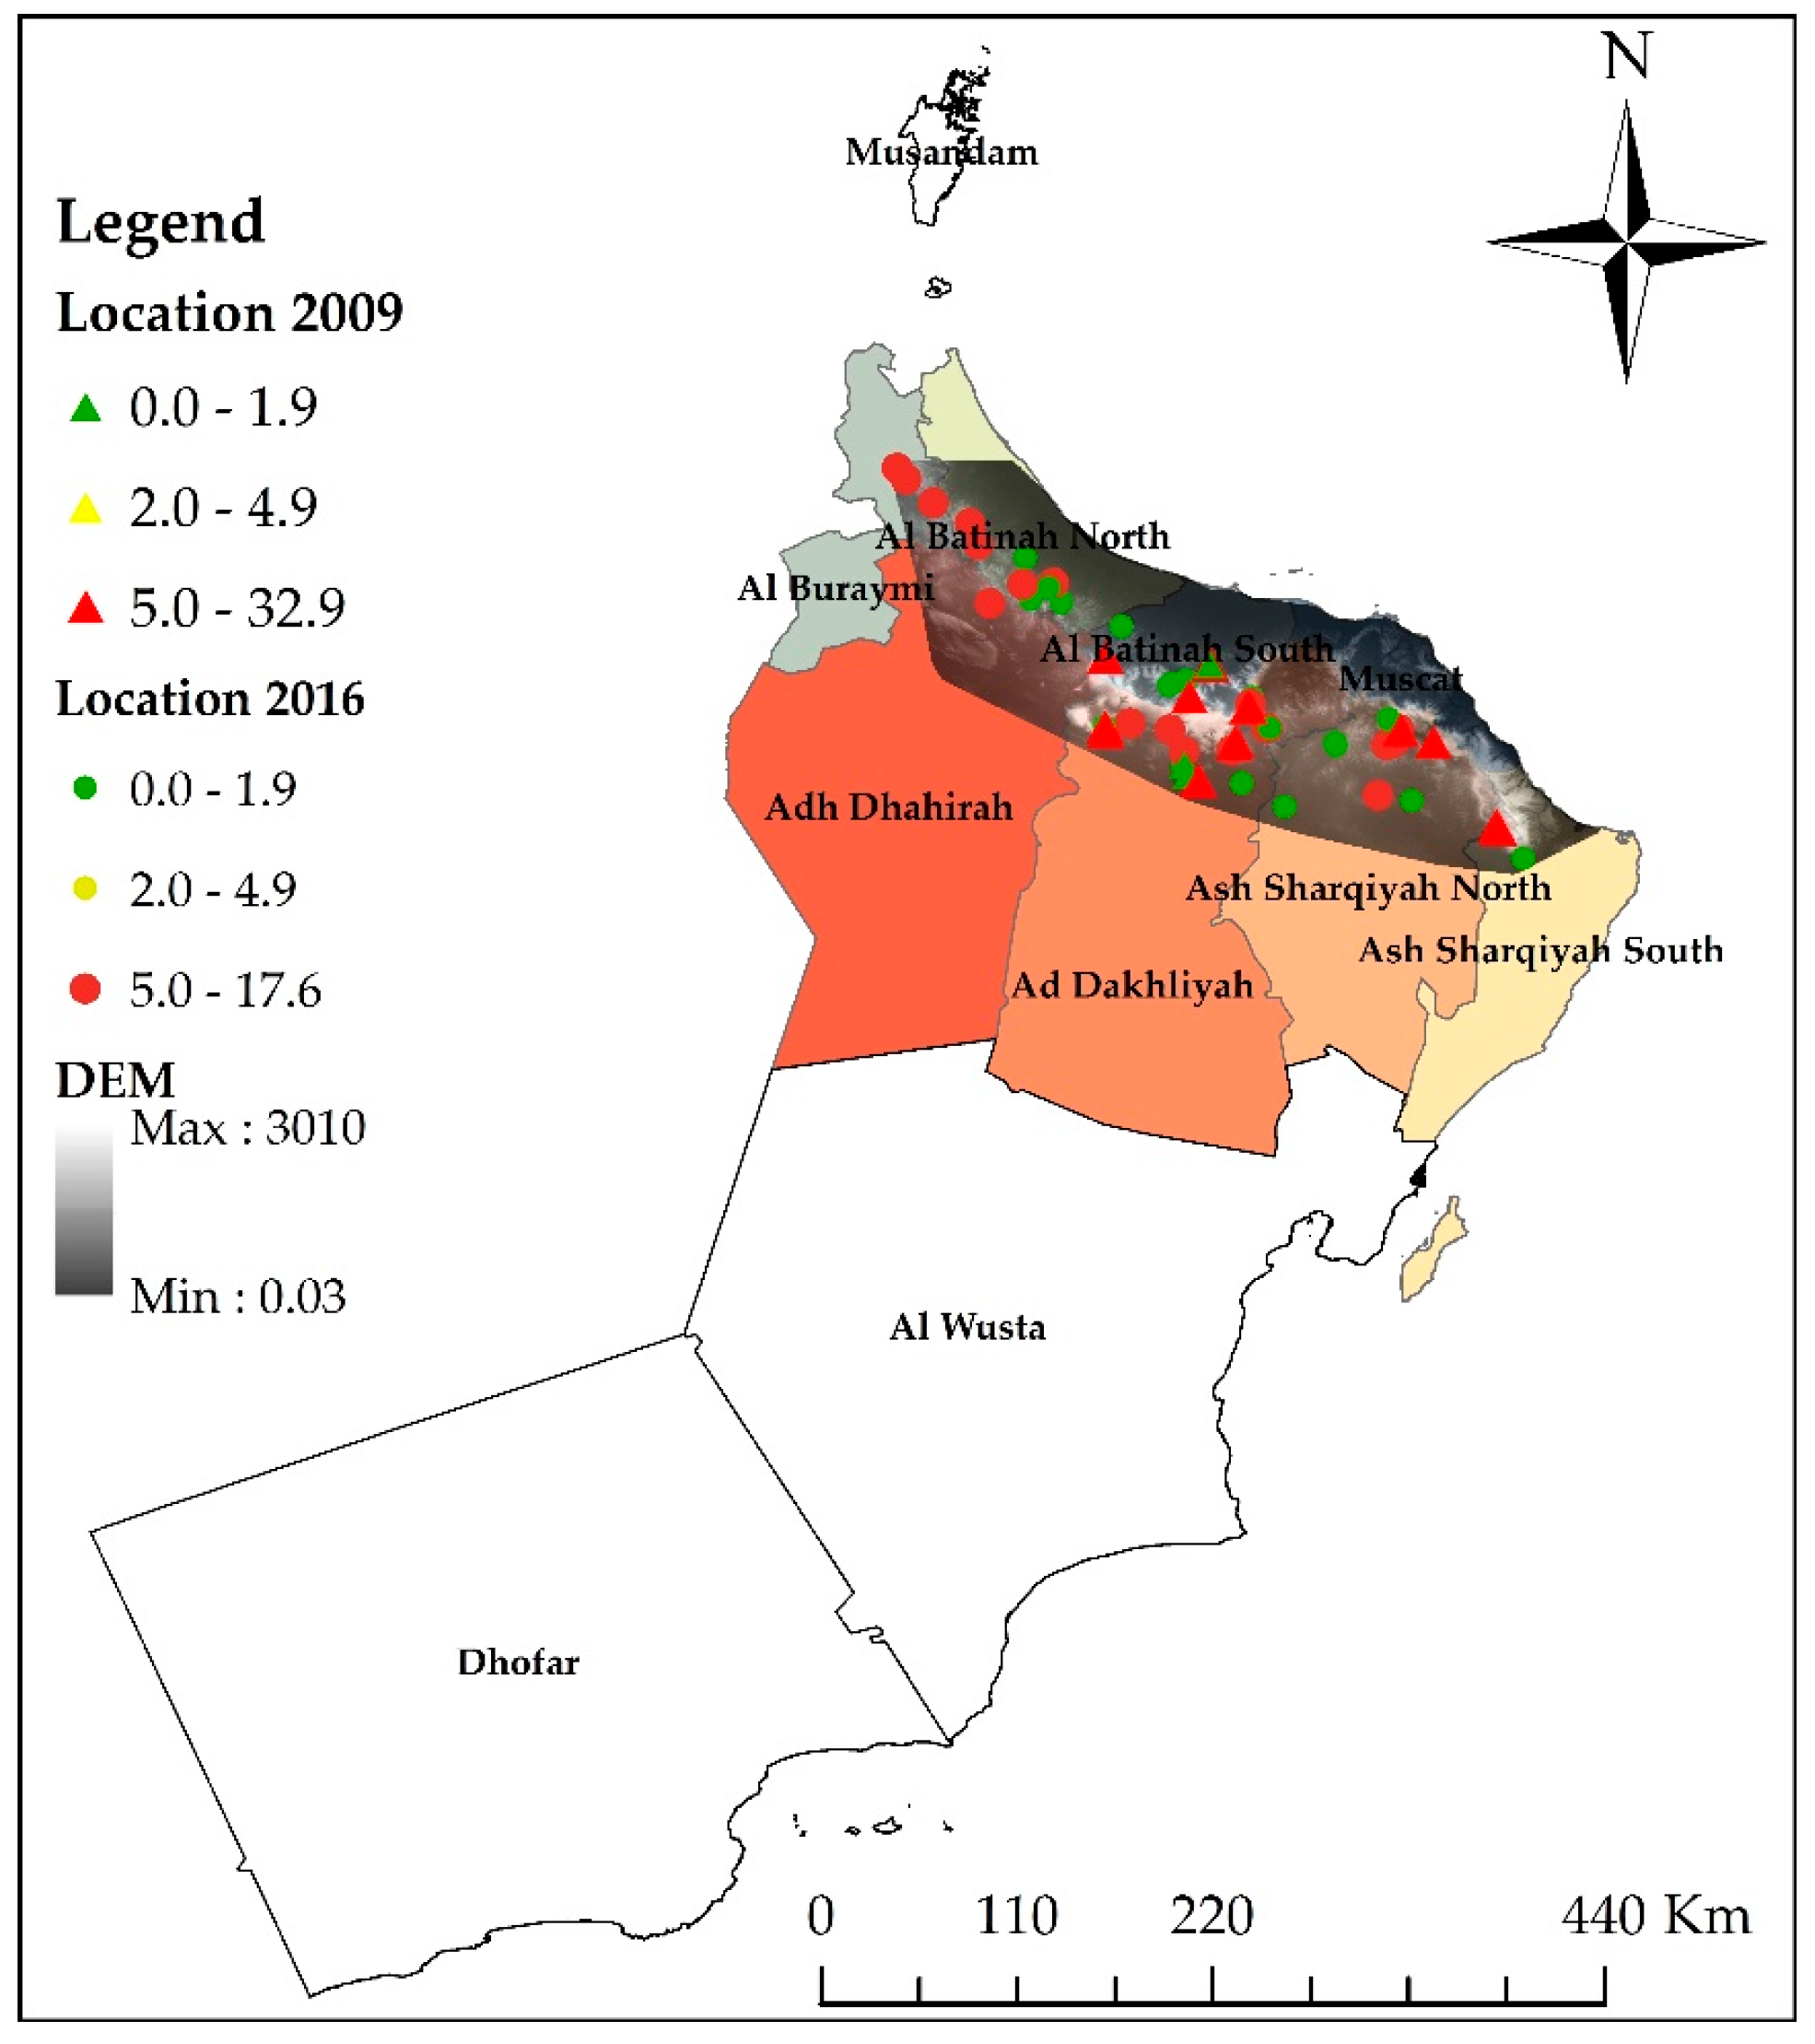
2.1. Study Area

The study area included 49 villages (locations) in 2009, and 69 villages in 2016, which were isolated from each other in the northern governorates of Oman where date palm is cultivated (Table 1 and Figure 1). The total area of Oman is 309,500 square kilometers; however, the study location was limited to the northern part of Oman (North 26°00′ N, 56°00′ E and Far East 22°00′ N, 59°00′ E) where date palm is cultivated as the main crop. The elevation in Oman varies from 0 m to 3000 m (the highest point is Jebel Al-Akhdar). In general, the climate of Oman can be classified as arid to semiarid, including hot wet areas near the sea coast to hot dry areas in the interior of Oman farther away from the sea. The average annual precipitation is 62 mm/year; it ranges from 20 mm/year in desert areas to 300 mm/year in mountainous areas [33]. In the study area, the elevation ranged from 200 m (Hamim village) to 820 m (Al-Hajer village).

2.2. Infestation Data

Infestation data were obtained from the Directorate General of Agriculture and Livestock Research, Ministry of Agriculture and Fisheries, Oman. The date palm plantations that had been evaluated during the spring seasons of 2009 and 2016 before aerial spraying represented the infestation level at each location. Data were collected from the end of March to mid-April in 2009 and 2016. The infestations at these locations were evaluated by a technique developed by Mjeni and Mokhtar [4] that involved the direct counting of the number of nymphs on 60 leaflets of three fronds from five randomly selected trees in 2009, and 40 leaflets of two fronds from 10 randomly selected trees in 2016. The mean number of insect counts per each location was calculated. The infestation levels were classified based on the average of the total number of insects per leaflet at each location, as low (average number was less than two), medium (average per leaflet was at least two, but less than five) and high (five insects and above). Data for infestation for all of the locations with their coordinate system were prepared in Excel, and saved as a comma delimited (CVS) file to be interpolated in ArcGIS software (ESRI Inc., Redlands, CA, USA).

2.3. Solar Radiation Data

Solar radiation can be measured through the use of weather stations or specific instruments installed at particular locations; however, these instruments measure the solar beam falling on the measurement instrument only and not on surrounding locations, thus yielding readings that represent only the point of the weather station or instrument [34,35]. Solar radiation varies spatially due to differences in land topography, such as elevation, aspect, slope, and hillshading of the location, as well as due to weather conditions and sky cloudiness. It also varies temporally due to the position of the sun in the sky [36,37]. Solar radiation is not a variable such as rainfall that can be measured at particular locations within close proximity and interpolated to provide a spatial layer for surrounding regions. For correlation analysis and overlaying on other spatial layers, solar radiation needs to be calculated for every single pixel. GIS-based solar radiation modeling does exactly this [22]. The output is a continuous layer that can be overlaid on other layers for spatial analysis. Kumar et al. [36] used weather station data from across Australia to show that solar radiation modeled in a GIS environment using the Kumar et al. [34] model had an accuracy rate of around 99% under clear sky conditions when compared to actual instrument measured data, thus enabling modeled solar radiation data to be used with confidence with other spatial data layers.
A 5-m resolution DEM (WGS 1984 UTM zone 40N) of Oman was obtained from the Oman National Survey Authority. The DEM data were processed in ArcGIS 10.2 ESRI software. The files were mosaicked and projected as raster layers, and later clipped to enclose the study locations only. The DEM was resampled to a 20-m resolution to reduce the solar radiation calculation time that was required. The date plantations are large in area, so modeling the solar radiation at very fine scales was unnecessary.
Solar radiation was modeled using the DEM in an ArcInfo workstation (ESRI Inc., Redlands, CA, USA) by adapting the model developed by Kumar et al. [22]. Solar radiation (kJ/m2/h) was calculated at half-hour intervals for monthly intervals in the year. The average daily solar radiation for each month (MJ/m2/day) was then calculated. Polygons were delineated on the date palm plantation area for all of the locations that were evaluated during the two years on Google Earth. The polygons were later imported to ArcMap (ESRI Inc., Redlands, CA, USA), and the mean value of solar radiation for each location was extracted for correlation with infestation data.

2.4. Analyses

Since the field data were collected in the period from the end of March to mid-April, regression analysis was run with infestation and solar radiation data from February (one month before the readings and around the commencement of hatching), data from March, cumulative data from January and February, cumulative data from January, February, and March; cumulative data from February and March, and the minimum and maximum solar radiation for the year for each location.
Ordinary least square regression (OLS) was used to compute the global relation between the infestation average (dependent variable) and the daily average solar radiation (independent variable). However, the interpretation of the results showed high collinearity between the solar radiation data (independent variables from February and March, cumulative data from January and February, cumulative data from January, February and March; cumulative data from February and March, and the minimum). The independent variables, which showed a higher variance inflation factor (VIF), were removed from model, and the OLS was run to obtain a good/best fit model. The Moran’s I index was run to find the spatial autocorrelation of the standard residual of OLS. The geographic weight regression (GWR) was run later to find the local correlation. GWR is a spatial statistical model that is an extension of the OLS model enabling the relationships between the independent and dependent variables to vary by location, thus adding a level of modeling sophistication [38,39]. It indicates where non-stationarity is occurring on the map or where the locally weighted regression coefficients are moving away from globally calculated values. The variation of local coefficients in space can be taken as an indication of non-stationarity.

3. Results

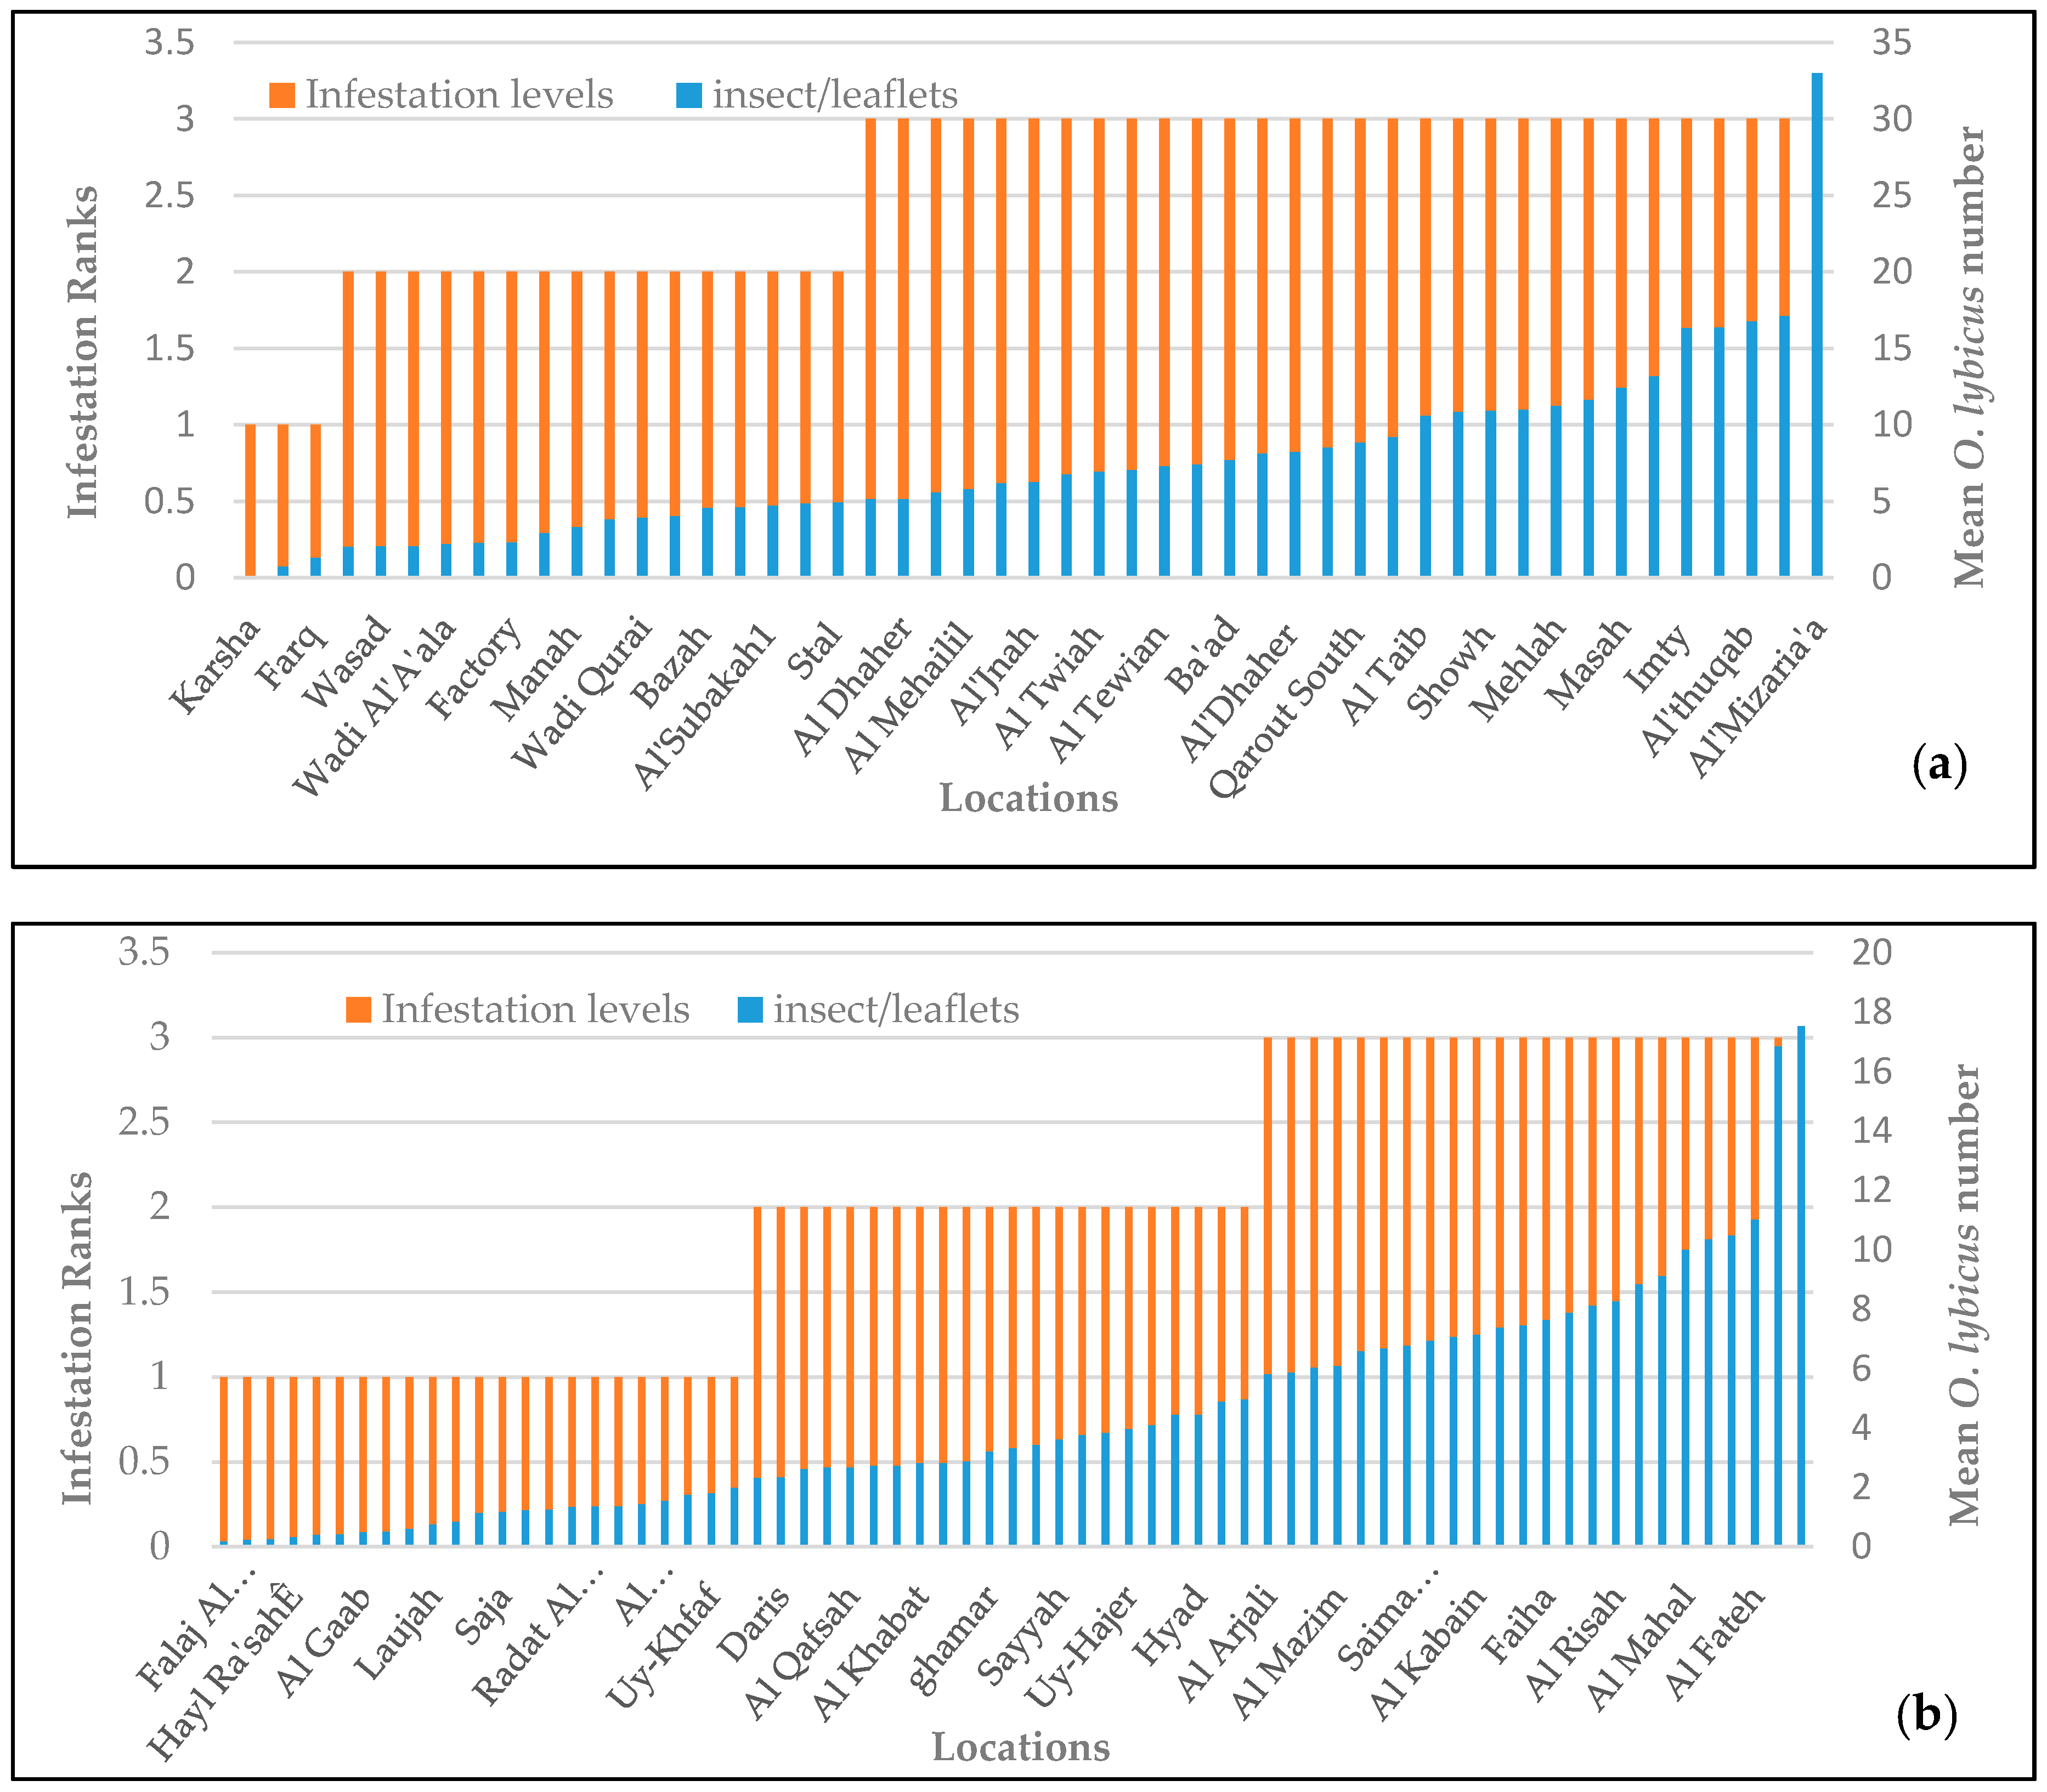
3.1. Infestation Data

The average infestation ranged from 0.02 insects/leaflet to 32.98 insects/leaflet, with an average of 7.50 insects/leaflet in 2009 (Figure 2a) and 0.17 insects/leaflet to 17.52 insects/leaflet, with an average of 4.38 insects/leaflet in 2016 (Figure 2b). Low, medium, and high levels of infestations were found at three, 16, and 30 locations, respectively, in 2009 and at 23, 22 and 24 locations, respectively, in 2016, based on the previously mentioned classification scheme.

3.2. Solar Radiation Data

The lowest solar radiation for the studied locations was recorded in December, at a minimum of 10.8 MJ/m2/day and a maximum of 15.9 MJ/m2/day, and an average of 13.9 MJ/m2/day in 2009 and 9.1 MJ/m2/day, 17.8 MJ/m2/day, and 14.3 MJ/m2/day, respectively, in 2016. The highest solar radiation was recorded in June at a minimum of 22.8 MJ/m2/day and maximum of 28.4 MJ/m2/day, and an average of 27.5 MJ/m2/day in 2009 and 25.2 MJ/m2/day, 28.6 MJ/m2/day, and 27.7 MJ/m2/day, respectively, in 2016. When compared with other months, most of the winter months (November, December, January, and February) showed considerably lower solar radiation, where the maximum did not exceed 22 MJ/m2/day (Figure 3). Figure 4 presents the gradual change of monthly solar radiation in the study location.

3.3. Ordinary Least Square Regression Results

The ordinary least square regression (OLS) model showed a high correlation among the independent variables. None of these showed significant correlation with infestation for the two years. The lowest VIF was found with maximum solar radiation readings of 5.8 and 4.4 for 2009 and 2016, respectively. The next lowest VIF was found with minimum solar radiation readings of 53.3 and 584.9 for 2009 and 2016, respectively. The minimum solar radiation reading showed a significant correlation, with R2 = 0.08, p = 0.02 for 2009 after dropping the variable with the higher VIF, and the model was run with maximum and minimum. The Jarque-Bera statistic of the OLS test was significant for both years, indicating that the residual was not normally distributed (Table 2 and Figure 5).

3.4. Autocorrelation Results

The results of autocorrelation showed low scores for Moran’s I index of 0.01 and 0.07 for 2009 and 2016, respectively, with a non-significant p-value > 0.05 (Table 3). This indicated that the standardized residual was randomly distributed.

3.5. Geographic Weight Regression Results

The GWR model run with the minimum solar radiation for two years showed an improvement in the coefficient of determination, R2, for 2009 (R2 = 0.28), but not for 2016 (Table 4). Akaike’s Information Criterion (AIC) for GWR for 2009 was (305) lower than the OLS (311.7), indicating an improvement of the prediction model.
Bandwidth is the exploratory distance in which the GWR constructs the relation between dependent (infestation) and independent (solar radiation) variables. The residual squares in 2009 are smaller than in 2016, indicating that the difference of estimated value for 2009 was more accurate than for 2016. ‘Effective Number’ represents the difference of fitted value and the bias of the estimated coefficient in relation to bandwidth, and how that is in agreement with the coefficient results. The value for 2016 is lower than for 2009, and the R2 (0.01) approaches zero for 2016. The two years showed a small value for sigma, indicating that the residual standard deviation is very low. Akaike’s Information Criterion (AIC) value is used to compare the fitness of the two models.

4. Discussion

The results of this study indicated a very weak negative relationship between the minimum solar radiation and the mean infestation in 2009. The coefficient of determination R2 = 0.28 improved with the GWR model when compared with the OLS model (R2 = 0.08), indicating a geographic effect on the infestation severity with the minimum solar reading in 2009. The coefficient of determination R2 for both the OLS and GWR models was lower than 0.5 (50%), which indicated a weak relationship between the infestations and solar radiation.
Solar radiation modeled within a GIS environment is mainly used to predict the amount of solar radiation in open places, without considering the microclimate, including the solar radiation, within the plantation [11]. By contrast, O. lybicus infestations flourish in dense plantations where all of the stages of O. lybicus insects are protected from the different harsh abiotic environmental factors [40], including, to some extent, solar radiation [41]. Dense planting is a common characteristic of traditional date palm crop plantations [42,43]. The current study investigated the relationship of solar radiation without considering other abiotic factors, such as temperature and relative humidity. Previous research has revealed a strong relationship between temperature and relative humidity on O. lybicus regulation [2,26,27]. Al Sarai Al Alawi [10] reported a higher population of O. lybicus on offshoots, which are protected from direct sun, compared to medium and high trees during the day, which could be one reason for the observed low influence of overall solar radiation on O. lybicus density. These factors all could contribute to the low effect of solar radiation on O. lybicus infestation.
The difference of other abiotic factors in the two years, such as precipitation, temperature, and humidity, could be the reason for the non-significant relation in 2016 and significant relation in 2009. 2009 had only one rainy day from February to end of March, in comparison to 13 days of rain during the same period in 2016 [44]. This could explain the lower infestation in 2016 and lower relationship between solar radiation and infestation.
Many studies have reported that solar radiation reduces the damage of insect pests on plants. For example, fewer leaf beetles were found where solar radiation was higher [45], and a negative effect of solar radiation was observed on thrip density and damage [11]. Solar radiation may affect the growth rate of insects; for instance, it reduces the growth rate and increases the death rate of Trichoplusia ni Hübner larvae [46]. Moumouni et al. [47] reported a zero egg hatch for Callosobruchus maculatus Fabricius kept under direct sun radiation when compared to laboratory conditions.
Other studies have shown a positive relationship between solar radiation and insect populations. For example, solar radiation increased the size of honeybee thoraxes and abdomens [15]. Battisti et al. [48] reported that solar radiation raised the colony temperature of Thaumetopoea pityocampa Denis and Schiffermüller, thereby increasing feeding action during the winter period. A strong positive correlation was reported with rice hopper Nephotettix lugens Stal and Nephotettix cincticeps Uhler numbers and solar radiation in combination with a negative relationship with air moisture [49]. Mezei et al. [13] reported that solar radiation influenced the catch of spruce bark beetle I. typographus. The effect of solar radiation may differ from insect to insect, as well as at the different life stages of a particular insect. For instance, high solar radiation may lead to the death of Sogatella furcifera Horváth nymphs, but not adults [49]. Clench [50] reported that the wings of butterflies are the body part that is responsible for heat exchange, and this could explain the deaths of S. furcifera nymphs, which lack wings, and the survival of adults.

5. Conclusions

Solar radiation seems to have a moderate impact on O. lybicus density with high infestation levels and little or no effect with low infestation. The low effect could be attributed to the dense date palm plantings, which limited the interaction of O. lybicus with solar radiation. Further investigation is required to overcome the limitations of this study, such as the number of sampling locations and the variations in tree distance. In addition, the study of solar radiation in combination with different abiotic factors is necessary to obtain a better understanding of the main factors driving infestation levels. Further research will also look at the duration of sunshine rather than total solar radiation alone.

Author Contributions

R.H.A.S. and L.K. devised the experiment; R.H.A.S. performed the experiment and analysis under the guidance of L.K.; S.A.H.A.-K., M.S.A. and M.M.A. helped with fieldwork and data collection.

Funding

We thank the Research Council, Oman for funding this research work.

Acknowledgments

We also thank the Ministry of Agriculture and Fisheries, Oman, for providing the data for Dubas bug infestation, the Oman National Survey Authority for providing the DEM data and all the technicians at the Plant Protection Research Centre, Directorate General of Agriculture and Livestock Research for their help in the field data collection.

Conflicts of Interest

The authors declare no conflict of interest.

References

  1. Abd-Allah, F.F.; Al-Zidjali, T.S.; Al-Khatri, S.A. Biology of Ommatissus lybicus Bergevin under field and laboratory conditions during spring 1995. In Proceedings of the International Conference on Integrated Pest Management, Muscat, Sultanate of Oman, 23–25 February 1998; pp. 75–79. [Google Scholar]
  2. Al-Khatri, S.A.H. Biological, Ecological and Phylogenic Studies of Pseudoligosita Babylonica Viggiani, a Native Egg Parasitoid of Dubas Bug Ommatissus lybicus de Bergevin, the Major Pest of Date Palm in the Sultanate of Oman. Ph.D. Thesis, University of Reading, Reading, UK, 2011. [Google Scholar]
  3. Howard, F.W. Sap-Feeders on Palms; CABI Publishing: Wallingford, UK, 2001. [Google Scholar]
  4. Mjeni, A.M.; Mokhtar, A. Comparison between Nogos and Malathion on Dubas bug. In Annual Report of Research Work (1979–1980); Ministry of Agriculture and Fisheries: Muscat, Sultanate of Oman, 1983; pp. 157–165. [Google Scholar]
  5. El Haidari, H.; Al Hafidh, E. Palm and Date Arthropod Pests in the Near East and North Africa; Food and Agriculture Organization (FAO): Baghdad, Iraq, 1986; p. 17. [Google Scholar]
  6. Elwan, A.; Al-Tamimi, S. Life cycle of dubas bug Ommatissus binotatus lybicus De Berg. (Homoptera: Tropiduchidae) in Sultanate of Oman. Egypt. J. Agric. Res. 1999, 77, 1547–1553. [Google Scholar]
  7. Thacker, J.; Al-Mahmooli, I.; Deadman, M. Population dynamics and control of the dubas bug Ommatissus lybicus in the Sultanate of Oman. In Proceedings of the BCPC International Congress—Crop Science and Technology, Glasgow, UK, 10–12 November 2003; pp. 987–992. [Google Scholar]
  8. Kinawy, M. Date palm and date pests in Oman. In Royal Court Affairs; Royal Gardens and Far: Muscat, Sultanate of Oman, 2005. [Google Scholar]
  9. Khan, N.A.; Mukhtar, A.; Alam, M. To assess the extent of the economic damage caused by Dubas bug Ommatissus binotatus on date palms with particular reference to yield and quality of fruits. In Annual Report of Research Work (1980–1981); Ministry of Agriculture and Fisheries: Muscat, Sultanate of Oman, 1983; pp. 170–179. [Google Scholar]
  10. Al Sarai Al Alawi, M. Studies on the Control of Dubas Bug, Ommatissus lybicus DeBergevin (Homoptera: Tropiduchidae), a Major Pest of Date Palm in the Sultanate of Oman. Ph.D. Thesis, Imperial College London, London, UK, 2015. [Google Scholar]
  11. Mazza, C.A.; Zavala, J.; Scopel, A.L.; Ballaré, C.L. Perception of solar UVB radiation by phytophagous insects: Behavioral responses and ecosystem implications. Proc. Natl. Acad. Sci. USA 1999, 96, 980–985. [Google Scholar] [CrossRef] [PubMed] [Green Version]
  12. Kampichler, C.; Teschner, M. The spatial distribution of leaf galls of Mikiola fagi (Diptera: Cecidomyiidae) and Neuroterus quercusbaccarum (Hymenoptera: Cynipidae) in the canopy of a Central European mixed forest. Eur. J. Entomol. 2002, 99, 79–84. [Google Scholar] [CrossRef]
  13. Mezei, P.; Jakus, R.; Blazenec, M.; Belánová, S.; Smidt, J. The relationship between potential solar radiation and spruce bark beetle catches in pheromone traps. Ann. For. Res. 2012, 55, 147. [Google Scholar] [CrossRef]
  14. Pepper, J.; Hastings, E. The effects of solar radiation on grasshopper temperatures and activities. Ecology 1952, 33, 96–103. [Google Scholar] [CrossRef]
  15. Cena, K.; Clark, J. Effect of solar radiation on temperatures of working honey bees. Nature 1972, 236, 222–223. [Google Scholar] [CrossRef]
  16. Nel, J.; Hewitt, P. Effect of solar radiation on the harvester termite, Hodotermes mossambicus (Hagen). Nature 1969, 223, 862–863. [Google Scholar] [CrossRef]
  17. Odera, J. The effect of solar radiation on cone insects of eastern white pine (Pinus strobus) in the Fredericton Area, New Brunswick1. Can. Entomol. 1971, 103, 605–609. [Google Scholar] [CrossRef]
  18. Battisti, A.; Marini, L.; Pitacco, A.; Larsson, S. Solar radiation directly affects larval performance of a forest insect. Ecol. Entomol. 2013, 38, 553–559. [Google Scholar] [CrossRef]
  19. de Groot, M.; Kogoj, M. Temperature, leaf cover density and solar radiation influence the abundance of an oligophagous insect herbivore at the southern edge of its range. J. Insect. Conserv. 2015, 19, 891–899. [Google Scholar] [CrossRef]
  20. Selås, V.; Hogstad, O.; Kobro, S.; Rafoss, T. Can sunspot activity and ultraviolet–B radiation explain cyclic outbreaks of forest moth pest species? Proc. R. Soc. Lond. B Biol. Sci. 2004, 271, 1897–1901. [Google Scholar] [CrossRef] [PubMed] [Green Version]
  21. Conte, A.; Goffredo, M.; Ippoliti, C.; Meiswinkel, R. Influence of biotic and abiotic factors on the distribution and abundance of Culicoides imicola and the Obsoletus Complex in Italy. Vet. Parasitol. 2007, 150, 333–344. [Google Scholar] [CrossRef] [PubMed]
  22. Kumar, L.; Skidmore, A.K.; Knowles, E. Modelling topographic variation in solar radiation in a GIS environment. Int. J. Geogr. Inf. Sci. 1997, 11, 475–497. [Google Scholar] [CrossRef]
  23. Fu, P.; Rich, P.M. Design and implementation of the solar analyst: An ArcView extension for modeling solar radiation at landscape scales. In Proceedings of the Nineteenth Annual ESRI User Conference, San Diego, CA, USA, 18–22 June 1999; pp. 1–31. [Google Scholar]
  24. Gastli, A.; Charabi, Y. Solar electricity prospects in Oman using GIS-based solar radiation maps. Renew. Sustain. Energy Rev. 2010, 14, 790–797. [Google Scholar] [CrossRef]
  25. Fu, P.; Rich, P.M. A geometric solar radiation model and its applications in agriculture and forestry. In Proceedings of the Second International Conference on Geospatial Information in Agriculture and Forestry, Lake Buena Vista, FL, USA, 10–12 January 2000; pp. 357–364. [Google Scholar]
  26. Mokhtar, A.M.; Al Nabhani, S.S. Temperature-dependent development of dubas bug, Ommatissus lybicus (Hemiptera: Tropiduchidae), an endemic pest of date palm, Phoenix dactylifera. Eur. J. Entomol. 2010, 107, 681. [Google Scholar] [CrossRef]
  27. Payandeh, A.; Dehghan, A. Life table parameters of the dubas bug, Ommatissus lybicus (Hem: Tropiduchidae) at three constant temperatures. Afr. J. Biotechnol. 2011, 10, 19489–19493. [Google Scholar] [CrossRef]
  28. Shah, A.; Naeem, M.; Nasir, M.F.; Irfan-ul-Haq, M.; Hafeez, Z. Biology of dubas bug, Ommatissus lybicus (Homoptera: Tropiduchidae), a pest on date palm during spring and summer seasons in Panjgur, Pakistan. Pak. J. Zool. 2012, 44, 1603–1611. [Google Scholar]
  29. Taghizadeh, R.; Fathipour, Y.; Kamali, K. Influence of temperature on life-table parameters of Stethorus gilvifrons (Mulsant) (Coleoptera: Coccinellidae) fed on Tetranychus urticae Koch. J. Appl. Entomol. 2008, 132, 638–645. [Google Scholar] [CrossRef]
  30. Chi, H.; Yang, T.-C. Two-sex life table and predation rate of Propylaea japonica Thunberg (Coleoptera: Coccinellidae) fed on Myzus persicae (Sulzer) (Homoptera: Aphididae). Environ. Entomol. 2003, 32, 327–333. [Google Scholar] [CrossRef]
  31. Ministry of Agriculture (MOA). Final Report of Aerial Application for Controlling Dubas Bug During Spring Generation of 2010; Ministry of Agriculture (MOA): Muscat, Sultanate of Oman, 2010; p. 42.
  32. MahmoudI, M.; Sahragard, A.; Pezhman, H.; Ghadamyari, M. Effect of climatic and management factors on the abundance of dubas bug, Ommatissus Lybicus bergevin (Hem.: Tropiduchidae) in Northern Hormozgan and Southern Fars Provinces. J. Plant Pests Res. 2013, 3, 63–76. [Google Scholar]
  33. Frenken, K. Irrigation in the Middle East Region in figures AQUASTAT Survey—2008; Water Report; Food and Agriculture Organization (FAO): Rome, Italy, 2009; ISBN 978-92-5-106316-3. [Google Scholar]
  34. Álvarez, J.; Mitasova, H.; Allen, H.L. Estimating monthly solar radiation in south-central Chile. Chil. J. Agric. Res. 2011, 71, 601. [Google Scholar] [CrossRef]
  35. Chrysoulakis, N.; Diamandakis, M.; Prastacos, P. GIS based estimation and mapping of local level daily irradiation on inclined surfaces. In Proceedings of the 7th AGILE Conference on Geographic Information Science, Heraklion, Greece, 29 April–1 May 2004. [Google Scholar]
  36. Kumar, L. A Comparison of ARCGIS modelled and ground recorded solar radiation data and opportunities for utilisation in environmental models. In Proceedings of the 10th SEASC: South East Asian Survey Congress, Nusadua, Indonesia, 4–7 August 2009; pp. 311–315. [Google Scholar]
  37. Huang, S.; Fu, P. Modeling small areas is a big challenge. ESRI ArcUser Online 2009, 2831, 2013. [Google Scholar]
  38. Fotheringham, A.S.; Crespo, R.; Yao, J. Geographical and temporal weighted regression (GTWR). Geogr. Anal. 2015, 47, 431–452. [Google Scholar] [CrossRef]
  39. Fotheringham, A.S.; Brunsdon, C.; Charlton, M. Geographically Weighted Regression: The Analysis of Spatially Varying Relationships; Fotherington, A.S., Brunsdon, C., Charlton, M., Eds.; Wiley: Hoboken, NJ, USA, 2002; ISBN 0471496162. [Google Scholar]
  40. Al Shidi, R.; Kumar, L.; Al-Khatri, S.; Albahri, M.; Alaufi, M. Relationship of date palm tree density to dubas bug Ommatissus lybicus infestation in Omani orchards. Agriculture 2018, 8, 64. [Google Scholar] [CrossRef]
  41. Talhouk, A. On the management of the date palm and its arthropod enemies in the Arabian Peninsula. J. Appl. Entomol. 1991, 111, 514–520. [Google Scholar] [CrossRef]
  42. Ali, H.G. Development of date palm cultivation and its role in sustainability of agriculture in Oman. In Proceedings of the IV International Date Palm Conference, Abu Dhabi, UAE, 15–17 March 2010; pp. 29–35. [Google Scholar]
  43. Ishag, K.H.M. Dates palm farming systems sustainability and risk efficiency in Oman. Sustain. Agric. Res. 2016, 6, 39. [Google Scholar] [CrossRef]
  44. National Oceanic and Atmospheric Administration. National Environmental Satellite, Data and Information Service. Available online: https://www7.ncdc.noaa.gov/CDO/cdo (accessed on 26 June 2018).
  45. Ballare, C.L.; Caldwell, M.M.; Flint, S.D.; Robinson, S.A.; Bornman, J.F. Effects of solar ultraviolet radiation on terrestrial ecosystems. Patterns, mechanisms, and interactions with climate change. Photochem. Photobiol. Sci. 2011, 10, 226–241. [Google Scholar] [CrossRef] [PubMed]
  46. McCloud, E.S. Stratospheric Ozone Depletion and Plant-Insect Interactions: Effects of UVB Radiation of Generalist and Specialist Herbivores on a Tropical Tree and a Temperate Forb. Ph.D. Thesis, University of Illinois at Urbana-Champaign, Champaign, IL, USA, 1995. [Google Scholar]
  47. Moumouni, D.; Doumma, A.; Seyni, I. Effect of solar drying on the biological parameters of the cowpea weevil, Callosobruchus maculatus Fab. (Coleoptera-Bruchinae), in Sahelian area. J. Appl. Biosci. 2014, 84, 7723–7729. [Google Scholar] [CrossRef]
  48. Battisti, A.; Stastny, M.; Netherer, S.; Robinet, C.; Schopf, A.; Roques, A.; Larsson, S. Expansion of geographic range in the pine processionary moth caused by increased winter temperatures. Ecol. Appl. 2005, 15, 2084–2096. [Google Scholar] [CrossRef]
  49. Pathak, M.D.; Khan, Z.R. Insect Pests of Rice; International Rice Research Institute: Los Baños, Philippines, 1994; ISBN 9712200280. [Google Scholar]
  50. Clench, H.K. Behavioral thermoregulation in butterflies. Ecology 1966, 47, 1021–1034. [Google Scholar] [CrossRef]
Figure 1. The study area showing the O. lybicus infestation location with different infestation levels during the spring seasons in 2009 and 2016, and a digital elevation model (DEM) layer showing the total study area location within the country.
Agriculture 08 00107 g001
Figure 2. Average number and rank of Dubas bug, O. lybicus, infestation in each location for 2009 (a) and 2016 (b).
Agriculture 08 00107 g002
Figure 3. Monthly minimum, maximum, and average solar radiation readings of the studied locations where the infestation was evaluated during 2009 (a) and 2016 (b).
Agriculture 08 00107 g003
Figure 4. The digital elevation model (DEM) layer overlaid on a shapefile of the whole country (a) showing the study area location, DEM (b) and the gradual change of monthly solar radiation of the study area (c).
Agriculture 08 00107 g004
Figure 5. Scatterplot showing the relation of the average infestation with minimum solar radiation during the spring seasons of 2009 and 2016.
Agriculture 08 00107 g005
Table 1. Number of locations included in the study in each governorate in the north of Oman.
GovernorateNumber of Locations
Ad Dakhliyah26
Al Batinah North and Al Batinah South19
Ash Sharqiyah North and Ash Sharqiyah South13
Al Buraymi8
Adh Dhahirah3
Table 2. The result of the second round of the ordinary least square regression (OLS) test for 2009 and 2016.
YearVariableCoefficientStandardized Errort-Statisticp-ValueVIF
2009Intercept31.4226.981.160.25
Minimum solar radiation−1.770.70−2.500.021.01
Maximum solar radiation0.030.940.030.981.01
2016Intercept−4.0225.70−0.160.88
Minimum solar radiation−0.290.39−7.500.461.04
Maximum solar radiation0.460.880.520.601.04
VIF: variance inflation factor.
Table 3. The Spatial Autocorrelation (Global Moran’s I) Summary for OLS model results for 2009 and 2016.
Indexes20092016
Moran’s I Index0.0108310.074506
Expected Index−0.020833−0.014706
Variance0.0326380.049531
Z-Score0.1752720.400851
p-Value0.8608660.688530
Table 4. The geographic weight regression (GWR) results for the correlation between by O. lybicus infestation and minimum solar radiation for 2009 and 2016. AIC: Akaike’s Information Criterion.
Variables20092016
Bandwidth4137.30
Residual Squares1123.851269.35
Effective Number5.372.00
Sigma5.0824.35
AIC305.02403.13
R20.280.01
R2 Adjusted0.210.00
Degrees of Freedom (df)4666

