A Review of the Available Land Cover and Cropland Maps for South Asia


Remote Sensing and GIS Division, ISD, International Crops Research Institute for the Semi-Arid Tropics (ICRISAT), Patancheru 502324, India
*
Author to whom correspondence should be addressed.
Agriculture 2018, 8(7), 111; https://doi.org/10.3390/agriculture8070111
Submission received: 17 May 2018
/
Revised: 20 June 2018
/
Accepted: 6 July 2018
/
Published: 8 July 2018
Abstract
:A lack of accuracy, uniqueness and the absence of systematic classification of cropland categories, together with long-pending updates of cropland mapping, are the primary challenges that need to be addressed in developing high-resolution cropland maps for south Asia. In this review, we analyzed the details of the available land cover and cropland maps of south Asia on national and regional scales in south Asia and on a global scale. Here, we highlighted the methodology adopted for classification, datasets used, classification system used for classifying different land covers and croplands and the resolution of datasets available. This listed review of different available datasets can help the reader to know which datasets to be used in their study and to understand which methodology to be chosen to further developing the accurate high-resolution land cover and cropland maps for advanced studies and for better understanding of ground reality in a timely updated version. We tried to identify the major concerns, particularly the inadequacy of knowledge regarding the spatial distribution of major crop types within south Asia, which hinder policy and strategic investment and delay the efforts to improve food security for a rapidly growing human population at a time of constant market instability and changing global climate. The overall focus of this paper is on reviewing the need for timely updated high-resolution cropland maps of south Asia.

1. Introduction
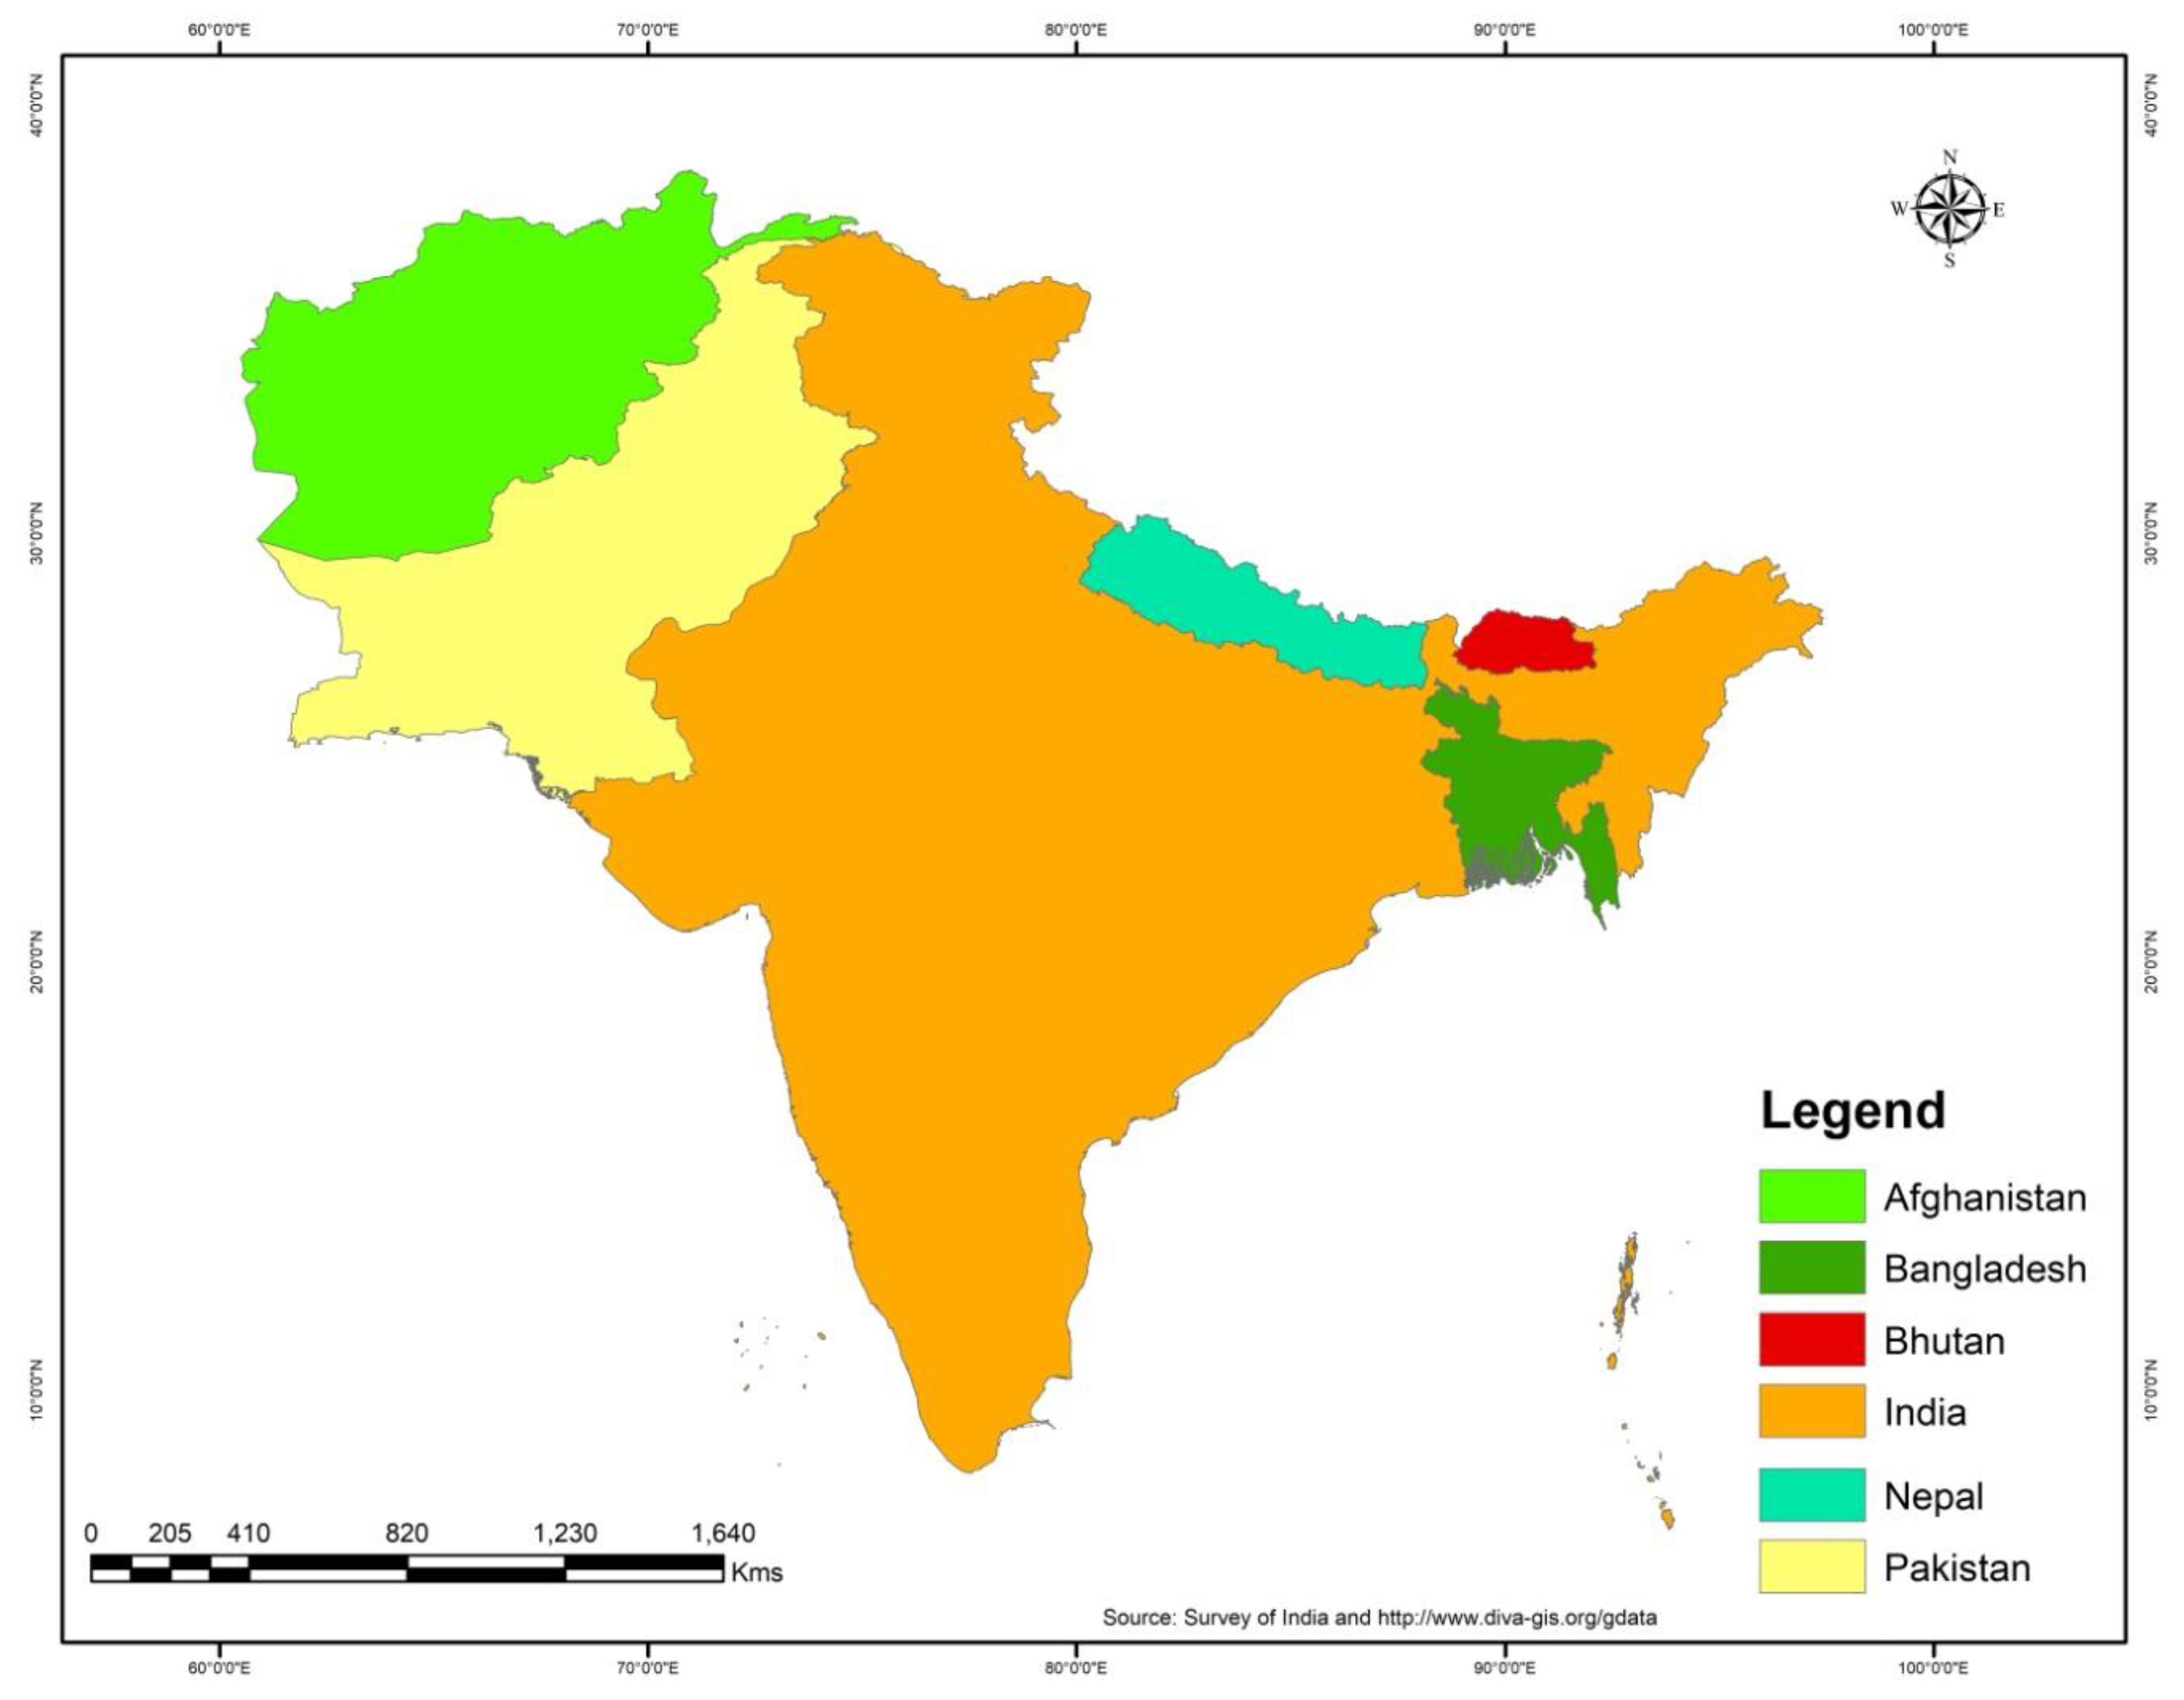
South Asia is an essentially low-latitude tropical region, the inhabitants of which mainly rely on agriculture as a primary source of employment, food, and economy [1,2,3]. In this region, the ongoing change in global climate has become a major concern for food security. In the region (Figure 1), approximately 70% of the population lives in rural areas, where agriculture is the main source of employment [1]. Agriculture generates approximately 18% of south Asia’s gross domestic product (GDP) and provides employment for 50% of the population [1,4,5]. Poverty in south Asia has constantly been at a high level, and the largest proportion of the world’s poor, approximately 43%, resides in this region. Furthermore, according to the latest Global Hunger Index (GHI = 29.4 points; GHI 2015), the level of hunger in south Asia is the second highest in the world. Owing to the rapidly growing population, increasing amounts of agricultural land are being lost to the spread of urban settlements in this region, and as a consequence, food security is gradually becoming a major burden and a key challenge for the scientific community, policy makers, and economists (Table 1). In the year 2050, the world population has been projected to exceed 9 billion, which represents a substantial increase from the over 7 billion in 2010 [6]. Due to the continuously growing wealth of low- and middle-income developing countries, an increase in annual food production of 60–70% will be required to feed their rapidly growing populations [1,3,7].
Mapping cropland extent can yield timely, updated, and accurate cropland information that provides essential inputs to crop monitoring systems and early warning systems, such as CropWatch, Global Information and Early Warning System (GIEWS), the Early Warning Crop Monitor and the Famine Early Warning Systems Network (FEWSNET), and Forecasting Agricultural output using Space, Agrometeorological and Land-based observations (FASAL) [9,10,11,12]. Such mapping represents an important step in agricultural production assessment and has direct benefits for the early forecasting of cropping pattern distribution and spread of diseases, and also provides information for climate change studies [13].
In the monitoring of croplands and climate change-related forecasting, cropland maps are used as a mask to separate cropland areas in order to assess and compare crop growth rates and conditions, and to study climatic change scenarios under different agricultural land uses. Additionally, remotesensing technology provides an opportunity to monitor global cropland in a spatially clear, cost-effective, well-organized and unbiased manner [14,15,16,17,18].
1.1. Croplands
Croplands are continuously monitored in near-real time by different organizations and research institutes at both national and global scales. For example, under the CropWatch program established by the Institute of Remote Sensing and Digital Earth (RADI), global cropland monitoring is carried out for 65 key countries [9]. The Group on Earth Observations Global Agricultural Monitoring (GEOGLAM) works globally in collaboration with the agricultural departments of many countries, and the Food and Agricultural Organization of the United Nations (FAO) offers continuously updated cropland information on a global basis [8].
1.2. Policy
At the national level, accurate and real-time cropland area and yield estimates are needed by the scientific community, policy makers, and economists in order to facilitate appropriate planning and decisions regarding the quantity of food that should be stored, circulated, or distributed, and to enable an evaluation of food losses that occur due to various adverse factors along the food supply chain. Inappropriate evaluations of food availability may affect trade decisions due to unpredictable price fluctuations and food shortages. At national, regional, and global levels, detailed high-resolution cropland maps and cropland range datasets can help the policy makers to identify where investment should be made by international bodies and national governments to increase cropland productivity in the agricultural sector. At the regional and national levels, this information is helpful for understanding the impacts of drought, application of chemical fertilizers and pesticides, and other natural and man-made disasters on cropland production [19]. At the national, sub-national, and farm levels, exact information on croplands can be used to study the factors affecting cropland productivity, and to evaluate the planning and appropriate management that may yield the projected results. Furthermore, high-resolution accurate cropland mapping is also required to study the multi-dimensional tasks associated with global ecological variation and the impacts of population growth and increased industrialization [20].
1.3. Yield Gaps
To address the growing demand for food in the near future, there will need to be either an increase in cropland area or an increase in productivity, through new innovations, in areas that are currently experiencing yield gaps [7,21,22,23,24]. There are also environmental impacts and transitions associated with both these paths of increasing cropland area and increasing productivity that need to be studied to identify options for reducing adverse effects [21]. Nevertheless, it is generally believed that a large expansion of existing cropland would be detrimental in the long term, due to intensification, and therefore it is very important to establish when, where, and how to increase crop production through systematic planning and scientific investigations of existing cropland production areas [6,21,24,25,26]. Hence, having detailed and accurate information on the extent of existing available cropland, through having access to high-resolution cropland maps based on remote sensing technology, is important for conducting advanced research on croplands.
1.4. Data Mismatches
Smith et al. (2010) [27] examined the outputs of a different number of unified assessment models in relation to global climate change in crop-growing areas as well as other land-use types for the years 2020 and 2050 under abundant drivers of change. They found that many of the predictions for cropland change using these models are within the uncertainty level of the 300 Mha range for total cropland area estimates derived from global land cover mapping. Different studies have concluded that model outputs and analyses can vary substantially depending upon the land cover product and the spatial resolution of maps [28,29]. However, the mismatches in the different available datasets on cropland extent and production are presently too high for use in various research applications. Recently, one study has reported that current global estimates of the total land under cropland differ by as much as 300 Mha. In this study, Fritz et al. (2011a) [30] compared two global land cover maps, one of which showed a cropland coverage of approximately 1600 Mha, whereas the other showed a coverage of approximately 1300 Mha. This type of mismatch among different studies highlights the uncertainties in considering how other important factors of change in agricultural systems, such as biofuel production, increasing demand for livestock products, and the continuous expansion of urban areas due to rapid population growth and climate change, might affect food production. Case studies such as those mentioned above indicate that there is a need for improved high-resolution cropland maps at global, regional, national, and sub-national levels, which can be used on multiple scales for planning, monitoring, and assessment from the farm to sub-national, sub-national to national, national to regional, and regional to global scales [20].
This article reviews various studies that have been carried out at national, regional, and global levels for the mapping of land cover and croplands and describes the classification methods and approaches used for satellite images of different spatial resolution at different scales. The overall focus of this paper is on reviewing the details of the available land cover and cropland maps of south Asia on national and regional scales in south Asia and on a global scale. We collected different published literatures of different levels of mapping land cover and cropland maps of national and regional scales in south Asia and on global scale. Here we highlighted the methodology adopted for classification, datasets used, classification system used for classifying different land covers and croplands and the resolution of datasets available for the need of timely updated high-resolution cropland maps for south Asia. The review has been done by knowing the details of the available land cover and cropland maps of national and regional scales in south Asia and on global scale from different published research articles.
2. Currently Available Satellite-Based Global, Regional, and National Land-Cover and Cropland Maps at Different Resolutions
The available literature suggests that the changes in global land use and land cover are among the main reasons for global climate change [25,31,32,33,34]. Accordingly, there is currently a concerted effort to map land cover and its changes on a global scale. Land cover and cropland information is being made increasingly available, by virtue of the current rapid advances in remote sensing technology. This technology delivers an objective, frequent, and consistent measure of what the Earth’s land cover looks like. There are, however, several limitations to remote sensing technology, e.g., in multispectral mode, the Earth cannot be observed through clouds, dust, and other atmospheric factors. Moreover, active global land cover maps, e.g., those based on Moderate Resolution Imaging Spectro radiometer (MODIS) data, can at best only be obtained at relatively low spatial resolutions, e.g., 1 km, 500 m, and 250 m, which is inadequate for capturing the land-use patterns, cropland changes, and distribution of different crop types in some complex landscapes [35]. Until recently, global land cover products were developed using coarse-resolution satellite images; however, with the opening up of the Landsat archive in 2008, which is freely available at a spatial resolution of 30 m, globally higher resolution land cover maps are now beginning to be available [36].
2.1. Currently Available Satellite-Based Global Land Cover and Croplands Maps
2.1.1. International Geosphere Biosphere Programme Data and Information Systems (IGBP-DIS)
A global land cover map with a spatial resolution of 1 km was derived via an unsupervised classification method using monthly 1-km spatial resolution Advanced Very High-resolution Radiometer (AVHRR) data for the period 1992–1993. A total of 17 general land cover classes were defined, in which agricultural land has been classified into two different classes: croplands and cropland/other vegetation mosaic, the overall accuracy of the map is 71.6% [37].
2.1.2. University of Maryland Global Land Cover (UMd-GLC)
A land cover classification map with a spatial resolution of 1 km was derived using AVHRR satellite data. The land cover comprises 12 classes, within which agricultural area has been classified in to a single class, i.e., croplands. Comparisons of the final product i.e., UMd-GLC global map derived from AVHRR data has been done with regional digital land cover maps derived from high-resolution remotely sensed data reveal general agreement, except for apparently poor depictions of temperate pastures within areas of agriculture. Distinguishing between forest and non-forest was achieved with agreements ranging from 81% to 92% for the regional subsets. The agreements for all classes varied from an average of 65% when viewing all pixels to an average of 82% when viewing only those 1 km pixels consisting of greater than 90% one class within the high-resolution data sets [38].
2.1.3. Global Land Cover SHARE (GLC-SHARE)
A land cover map with a spatial resolution of ~1 km2 was derived at the global level. It provides a set of 11 major thematic land cover layers obtained from the combination of “best available” datasets, e.g., high-resolution national, regional, and/or sub-national land cover databases with the accuracy of 80% [39].
2.1.4. Global Land Cover Map for the Year 2000 (GLC2000)
A global land cover map with a spatial resolution of 1 km2 was derived from daily data obtained by a SPOT-4 satellite (Centre national d'études spatiales – the French space agency, Toulouse, France). In this map, agricultural land has been classified in to three different classes: cultivated and managed areas, mosaic-cropland/tree/cover/other natural vegetation, and mosaic-cropland/shrub and/or grass cover with the overall accuracy of the product is 68.6% [40].
2.1.5. MODIS-Based MCD12Q1
A global land cover map with a spatial resolution of 1 km2 was derived using the MODIS land cover classification algorithm (MLCCA), which employs a supervised methodology that adopts the C4.5 algorithm as the primary classification. Among a total of 17 major classes, agricultural land has been classified in to two classes: croplands developed and mosaic lands and cropland/natural vegetation mosaics with the overall accuracy range from 75% to 79% [41].
2.1.6. Global Major Crops Distribution Map
A crop distribution map with a spatial resolution of ~10 km2 was derived using a combination of satellite-derived land cover data and agricultural census data, providing a dataset of the global distribution of 18 major crops. The dataset is representative of the early 1990s and describes the fraction of a grid cell that is occupied by each of the 18 crops worldwide. Although there has been research on how the major crop belts are formed worldwide by growing different crops in combination, this dataset is not particularly applicable to studies on a local scale. Nevertheless, the dataset can be used for the analysis of crop geography in a regional-to-global context. This dataset can also be used to determine the global patterns of farming systems in different agro-climatic zones for the study of food security, and to develop global ecosystem and climate models to predict the environmental consequences of cultivation of different crops [42].
2.1.7. Agricultural Lands in the Year 2000 (M3-Cropland and M3-Pasture Data)
Land-use datasets with a spatial resolution of ~10 km2 were derived by combining national-, state-, and county-level census statistics using a global dataset of croplands. The resulting land-use datasets describe the area (harvested) and yield of 175 distinct crops for the year 2000. By aggregating individual crop maps, fresh maps were produced for 11 major crop groups, crop net primary production, and the following four physiologically based crop types: annuals/perennials, herbaceous/shrubs/trees, C3/C4, and leguminous/non-leguminous crops [43].
2.1.8. Collection 5 MODIS Global Land Cover Type Product
A global land cover map with a spatial resolution of 500 m2 was derived with an increased spatial resolution compared to the Collection 4 MODIS Global Land Cover Type product (University of Maryland and the Pacific Northwest National Laboratory, College Park, Maryland, USA) [42]. Additionally, many parameters of the classification algorithm have been modified by reviewing the training site database and by adding the land surface temperature as an additional input feature. Furthermore, the use of ancillary datasets in the post-processing of joint decision tree outcomes has also been updated. Here, agriculture land has been classified in two classes: croplands and cropland/natural vegetation mosaics, its overall accuracy is 75% [44].
2.1.9. Global Land Cover by National Mapping Organizations (GLCNMO)
A global map with a spatial resolution of 1 km was derived by using eight periods of 16-day composite 7-band 1 km2 MODIS data for the year 2003. The dataset contains approximately 20 land cover classes, which were defined using the Land Cover Classification System (The classification is based on LCCS developed by FAO). Among these classes, 14 classes were derived using supervised classification. Agricultural land is classified into three classes: cropland, paddy field, and cropland/other vegetation mosaic, the overall accuracy is 76.5% and the overall accuracy with the weight of the mapped area coverage is 81.2% [35].
2.1.10. The Centre for Sustainability and the Global Environment (SAGE)
Global datasets of the distributions of croplands and pastures circa 2000 with a spatial resolution of ~10 km2 were derived by combining agricultural inventory data and satellite-derived land cover classification datasets. These land cover classification datasets have been generated using highly detailed agricultural inventory data, which were obtained by using a combination of two different satellite-derived products, i.e., Boston University’s MODIS-derived land cover product (BU-MODIS) [41] and the GLC2000 dataset, and also by including the statistical confidence intervals on estimates. Agricultural land has been classified into two classes: cropland and pasture. According to the data, there were 15.0 (90% confidence range of 12.2–17.1) million km2 of cropland (12% of the Earth’s ice-free land surface) and 28.0 (90% confidence range of 23.6–30.0) million km2 of pasture (22%) in the year 2000 [34].
2.1.11. History Database of the Global Environment (HYDE)
A global cropland database with a spatial resolution of ~10 km2 was derived using historical datasets collected over the past 12,000 years, with a consideration of the basic demographic and agricultural driving factors. By combining the historic population data and cropland and pasture statistics with satellite information and specific allocation algorithms that can change over time, spatially explicit maps have been derived, which are completely reliable and cover the period 10,000 BC to AD 2000. Agricultural land has been classified into two classes: cropland and pasture [45].
2.1.12. Global Irrigated Area Map (GIAM)
A global irrigated area map with a spatial resolution of 10 km2 was derived using multiple satellite datasets, Google Earth, and ground truth data. A single mega-file data-cube (MFDC) of the world with a total of 159 layers, corresponding to the hyperspectral dataset, was generated by the process of re-sampling different data types into a common 1-km2 spatial resolution. The MFDC was then segmented based on elevation, temperature, and precipitation zones. A global total of 28 irrigated cropland classes were accordingly obtained [25].
2.1.13. Global Map of Rainfed Cropland Areas (GMRCA)
A global rain-fed cropland area map with a spatial resolution of 1–10 km2 was derived using remote sensing data. The final outcome is an aggregated nine-class GMRC, and country-by-country rain-fed area statistics have also been calculated [46].
2.1.14. IIASA-IFPRI Cropland Percentage Map
A global cropland percentage map with a spatial resolution of 1 km2 was derived by combining individual cropland maps from global to regional to national scales, using the year 2005 as a baseline. The complete map products, together with the existing global land cover maps, such as GlobCover 2005 (produced by ESA/ESA Globcover 2005 Project, led by MEDIAS-France/POSTEL Image: ©ESA/ESA Globcover 2005 Project, led by MEDIAS-France/POSTEL)and MODIS v.5, regional maps, such as AFRICOVER, and national maps, can be procured from mapping agencies and other mapping organizations. All products are classified at the national level using crowd-sourced data from Geo-Wiki to derive a map that resembles and reflects the likelihood of cropland. Validation of the newly derived IIASA-IFPRI cropland maps has been performed using very high-resolution satellite imagery via Geo-Wiki with an overall accuracy of 82.4% [47].
2.1.15. Monthly Irrigated and Rain-Fed Crop Areas around the Year 2000 (MIRCA2000)
Global maps with a spatial resolution of ~9.2 km2, at a global-scale that is compatible with agricultural land-use practices, were derived for monthly irrigated and rain-fed cropland areas around the year 2000. The basic approach followed here was initially to define cropping periods and growing areas for 402 spatial units and then to downscale the information to a grid cell. MIRCA2000 (produced by Institute of Physical Geography, University of Frankfurt, Frankfurt am Main, Germany) provides agriculture classes under both irrigated and rain-fed crop areas of 26 crop classes for each month of the year [48].
2.1.16. GlobCover Global Land Cover Map
A global land cover map with a spatial resolution of 300 m2 was derived by using MEdium Resolution Imaging Spectrometer (MERIS, One of the main instruments on board the European Space Agency (ESA)'s Envisat platform) satellite data. The map has been classified by using different approaches in which the sub-system produces a global land cover map from cloud-free mosaics, and the classification runs separately for 22 equal-reasoning areas. The map has been classified into 23 different classes, among which agriculture has been classified into four classes: post-flooding or irrigated croplands, rain-fed croplands, mosaic cropland/vegetation (grassland, shrub land, and forest), and mosaic vegetation (grassland, shrub land, and forest)/cropland, the overall accuracy of this map is 67.5% [31,32].
2.1.17. Global Cropland Extent Map
A global cropland extent map with a spatial resolution of 250 m2 was derived by using MODIS data. A set of 39 multi-year MODIS metrics, including four MODIS bands, Normalized Difference Vegetation Index (NDVI), and thermal data, has been used to determine cropland phenology over the study period. Agricultural land has been classified in to a single class, i.e., cropland, the overall accuracy is 63% [49].
2.1.18. A Unified Global Cropland Layer
A combined global cropland map with a spatial resolution of 250 m2 was derived for the year 2014. The map has been produced by combining the fittest products, followed by very inclusive identification and collection of national to global land cover maps. In this process, a multi-criteria analysis was performed at the country level to identify the priority areas for mapping of croplands. It was assessed using global validation datasets and yields an overall accuracy ranging from 82–94% [50].
2.1.19. Finer Resolution Observation and Monitoring of Global Land Cover (FROM-GLC)
Global land cover maps with a 30-m2 spatial resolution were derived using Landsat Thematic Mapper (TM), and Enhanced Thematic Mapper Plus (ETM+) datasets distributed by U.S. Geological Survey (USGS). The datasets were generated using a total number of 91,433 training points and 38,664 test samples collected via human interpretation of TM/ETM+ images. Four datasets of global land cover maps were derived by using four types of supervised classifiers, including the conventional maximum likelihood classifier (MLC), the J4.8 decision tree classifier, the random forests ensemble classifier (RF), and the support vector machine. Agricultural land has been classified in to a single class, i.e., agriculture, the overall accuracy is 64.9% [51].
2.1.20. Fine Resolution Observation and Monitoring of Global Land Cover (FROM-GLC-SEG)
A global land cover map with a 30-m2 spatial resolution was derived using Landsat TM and ETM+ data. By following a segmentation-based approach to the Landsat imagery, MODIS data of spatial resolution 250 m2 has been downscaled along with the auxiliary data for 1 km2 to the segment scale based on TM data. Agricultural land has been classified into four classes: cropland (paddy rice, greenhouse, and others), orchard, managed grasslands, and temporally bare croplands, the overall accuracy is 67.08% [52].
2.1.21. Global Land Cover (GLC)
A global land cover map with a spatial resolution of 30 m2 was derived by using Landsat TM and ETM+ data following an approach based on the combination of pixel- and object-based methods with knowledge (POK-based), and by using supervised and decision tree classification methods. Agricultural land has been classified in to a single class, i.e., cultivated land, the overall accuracy is 80% [53].
In the global maps discussed above in the Section from Section 2.2.1 to Section 2.2.3 (Table 2), there are many lacking points with this maps that the spatial resolution of the maps is of coarser resolution i.e., from 250 m2 to 10 km2 due to which they are not accurate enough to provide a reliable estimate of spatial distribution of major croplands/crop types. For example, they are particularly poor at detecting croplands in areas of low agricultural intensification because the spectral signatures and temporal profiles are similar to grasslands; this would include most of Africa [49]. Other global cropland products are available (e.g., [46] but these are at an even coarser resolution of 10 km2. This lack of detail has led to the highly divergent estimates that one sees in today’s cropland and land cover maps. Globally, cropland estimates derived from GlobCover are 20% higher than those derived from MODIS [30,54]. These differences can be attributed to the use of different classification algorithms, different datasets used to train the algorithms, different satellite sensors, and different temporal windows used to develop these products, i.e., some use a single reference year while others use multiple years. The product that is used in subsequent monitoring and modeling exercises can therefore have a potentially large impact on the outcome. Remote sensing data provides an objective, frequent and consistent measure of land cover, croplands and forest areas, which are inadequate by having to see through clouds, dust and other atmospheric constituents from the atmosphere above the surface of the Earth. Moreover, the operational global products (e.g., based on MODIS) have a spatial resolution of the range 250 m2 to 500 m2 and have limited ability to capture land use patterns in complex landscapes [55]. Until recently, global land cover products were developed using moderate-resolution satellite imagery but with the opening up of the Landsat archive in 2008 [36] and in 2014 and 2015 Sentinel-1 and Sentinel-2 satellite data sets, higher resolution global land cover maps are now starting to appear, as described in the Section 2.1.19 to Section 2.1.21. The relative costs of this approach are also high, i.e., the investment in satellite technology and the costs associated with image acquisition. However, Landsat and Sentinel 1–2 is now free but higher resolution imagery, i.e., less than 10 m, is still costly.
2.2. Currently Available Regional Land Cover and Cropland Maps of South Asia
2.2.1. Rice Map of South Asia of the Year 2010
A rice/paddy map of south Asia with a spatial resolution of 500 m2 was derived by using MODIS satellite imagery and different classification approaches, i.e., spectral matching techniques, decision trees, and ideal temporal profile databanks. A fuzzy classification accuracy assessment for the 2000 to 2001 rice-map product, based on field-plot data, demonstrated accuracies from 67% to 100% for individual rice classes, with an overall accuracy of 80% for all classes [56]. Mapping of rainfed and irrigated rice-fallow cropland areas across South Asia, has been done by using MODIS 250 m2 time-series data and identify where the farming system may be intensified by the inclusion of a short-season crop during the fallow period. Rice-fallow cropland areas are those areas where rice is grown during the kharif growing season (June–October), followed by a fallow during the rabi season (November–February). These cropland areas are not suitable for growing rabi-season rice due to their high water needs but are suitable for a short -season (≤3 months), low water-consuming grain legumes such as chickpea (Cicer arietinum L.), black gram, green gram, and lentils. The correctness of rainfed and irrigated rice-fallow croplands for grain legume cultivation across South Asia were defined by these identifiers: (a) rice crop is grown during the primary (kharif) crop growing season or during the north-west monsoon season (June–October); (b) same croplands are left fallow during the second (rabi) season or during the south-east monsoon season (November–February); and (c) ability to support low water-consuming, short-growing season (≤3 months) grain legumes (chickpea, black gram, green gram, and lentils) during rabi season. The study established cropland classes based on the every 16-day 250 m2 normalized difference vegetation index (NDVI) time series for one-year (June 2010–May 2011) of Moderate Resolution Imaging Spectroradiometer (MODIS) data, using spectral matching techniques (SMTs), and extensive field knowledge. Map accuracy was evaluated based on independent ground survey data as well as compared with available sub-national level statistics. The producers’ and users’ accuracies of the cropland fallow classes were between 75% and 82%. The overall accuracy and the kappa coefficient estimated for rice classes were 82% and 0.79, respectively [57].
2.2.2. Rice Map of South Asia of the Years1993–1996
Rice maps of south, southeast, and East Asia have been derived by using information based mainly on statistical bulletins of the various countries, mostly dating from 1993 to 1996. These maps were made using geographic information system (GIS) techniques, without the use of computers, but with the use of a large light table for overlaying the various coverages offered by satellite imagery, detailed topographic maps, soils maps, and drainage maps. In addition, a great deal of “ground truth’’ was involved and literally hundreds of local specialists from all over monsoon Asia contributed their own evaluation of the local situation. The maps and the data from which they were developed are now seriously out of date. The data are presented in tabular form and provide considerable detail at the district, division, and township levels. The classification used is as follows: dryland rice, deep-water rice, irrigated wet season rice, irrigated dry season rice, shallow rain-fed rice areas with water depth in the 0–30-cm range, and intermediate rain-fed rice, subject to greater water depths of 30–100 cm.
For most countries, the area of each division is shown, as well as the total rice production and total population [58].
2.2.3. Rice Map of South Asia of the Year 2002
Paddy rice maps with a spatial resolution of 500 m2 were derived by using the 8-day composite images of MODIS satellite images obtained by the NASA EOS Terra satellite for the year 2002. Paddy rice fields are categorized by an early period of flooding and transplanting, during which there is a co-occurrence of surface water and rice seedlings. The maps were derived by applying a paddy rice mapping algorithm that uses the time series of MODIS-derived vegetation indices to identify the initial period of flooding and transplanting in paddy rice fields, based on the increased surface moisture, the overall accuracy of map is 85% [59].
In the above discussed regional maps in the section from Section 2.2.1 to Section 2.2.3 (Table 3), there are many lacking points with this maps that the spatial resolution of the maps is of coarser resolution i.e., 500 m due to which they are not accurate enough to provide a reliable estimate of spatial distribution of major croplands or paddy/rice crop. These maps are particularly poor at detecting croplands or paddy/rice crop in areas of low agricultural intensification because the spectral signatures and temporal profiles are similar to grasslands. The paddy/rice map produced by [58], these maps were made using geographic information system (GIS) techniques, without the use of computers, but with the use of a large light table for overlaying the various coverages offered by satellite imagery, detailed topographic maps, soils maps, and drainage maps. In addition, a great deal of “ground truth’’ was involved and literally hundreds of local specialists from all over monsoon Asia contributed their own evaluation of the local situation. The maps and the data from which they were developed are now seriously out of date.
2.3. Currently Available Satellite-Based National Land Cover and Cropland Maps within South Asia
2.3.1. Afghanistan
A land cover map with a spatial resolution of 20 m2 was derived using FAO/GLCN methodology and tools. The main data sources include satellite imagery from SPOT-4 (Centre national d'études spatiales – the French space agency, Toulouse, France). (2009–2011) and Global Land Survey (GLS-2011) Landsat satellites, high-resolution satellite imagery, very high resolution aerial photographs, and ancillary data. The national level legend has been organized by using the Land Cover Classification System (LCCS). FAO’s Mapping Device Change Analysis Tools (MADCAT) software has been used to create the database using object-based classification methodology. The full resolution land cover legend has 25 classes. To refine the interpretation, high-resolution images from various sources are used. A total of 25 original land cover classes have been aggregated into 11 generalized and self-explanatory classes. Agricultural land has been classified in to two classes [61] (http://www.glcn.org/activities/afg_lc_en.jsp).
2.3.2. Bhutan
The International Centre for Integrated Mountain Development (ICIMOD), has completed mapping of the land use/land cover of Bhutan at a spatial resolution of 180 m2 by acquiring WiFs satellite data for the period 1996–1999. For generating the training samples, a land use/land cover map of Bhutan for the year 1994 has been used. This map was produced using Landsat-TM satellite data at 30-m2 spatial resolution, which has been systematically field verified. Training samples within different major land use/land cover classes for digital classification of images have been generated by resampling of the available 1994 land use/land cover map using WiFs data at a spatial resolution of 180 m2, and different land cover has been identified within the area of interest. Training sample points with different land cover codes were converted to imagine format and used for the classification, in which a maximum likelihood classifier has been applied for image classification. Of the 13 major land cover classes defined using this approach, agricultural land has been classified as a single class, i.e., agriculture, the overall accuracy of map is 83.10% [62].
2.3.3. Bangladesh
Seasonal paddy rice maps with a spatial resolution of 500 m2 for the three seasons boro (December/January–April), aus (April/May–June/July), and aman (July/August–November/December) in Bangladesh were derived for the year 2000 by using MODIS NDVI maximum value composite data. Image classification was performed using an unsupervised classification method, whereas the grouping of similar classes was performed using decision tree classification algorithms and a spectral matching technique. In mapping the extent of the rice crop in Bangladesh, seasonal district-level rice area statistics were used to assess the accuracy of the rice area estimates. The maps of rice versus non-rice exceeded 90% accuracy in all three seasons and the accuracy of the five rice classes varied from 78% to 90% across the three seasons [63].
2.3.4. India
A national-level agriculture land cover-type map of India with a spatial resolution of 56 m2 was derived for the periods 2005–2006 and 2011–2012 for the study of spatial and temporal variability in agricultural land cover types during the aforementioned periods, using multidate and multispectral Advanced Wide Field Sensor (AWiFS) data from Resourcesat-1 and 2. The map was generated using an 18-fold classification system, and rule-based techniques along with a maximum-likelihood algorithm were used for classification of land cover information as well as changes occurring within the agricultural land cover classes. Six agricultural land classes were identified: Kharif (June–October), Rabi (November–April), Zaid (April–June), area sown more than once, fallow lands, and plantation crops, the overall accuracy of the map ranges from 87% to 96% [64]. In one of the case study in India an approach has been adopted to accurately separate out and quantify crop dominance areas in the major command area in the Krishna River Basin. Classification was performed using IRS-P6 (Indian Remote Sensing Satellite, series P6, launched by Indian Space Research Organization, India and MODIS eight-day time series remote sensing images with a spatial resolution of 23.6 m, 250 m for the year 2005. Temporal variations in the NDVI (Normalized Difference Vegetation Index) pattern obtained in crop dominance classes enables a demarcation between long duration crops and short duration crops. The NDVI pattern was found to be more consistent in long duration crops than in short duration crops due to the continuity of the water supply. The derived major crop land areas were highly correlated with the sub-national statistics with R2 values of 87% at the mandal (sub-district) level for 2005–2006. These results suggest that the methods, approaches, algorithms and datasets used in this study are ideal for rapid, accurate and large-scale mapping of paddy rice, as well as for generating their statistics over large areas. This study demonstrates that IRS-P6 23.6-m one-time data fusion with MODIS 250-m time series data is very useful for identifying crop type and the source of irrigation water. The accuracy assessment was performed based on ground-truth data through the error matrix method, with accuracies from 67% to 100% for individual crop dominance classes, with an overall accuracy of 79% for all classes [65]. A vegetation type map of India at the scale of 1: 50,000 prepared using medium-resolution IRS LISS-III satellite data. The map was created using an on-screen visual interpretation technique and has an accuracy of 90%, as assessed using 15,565 ground control points. India has hitherto been using potential vegetation/forest type map prepared by Champion and Seth in 1968. A remote sensing-amenable hierarchical classification scheme that accommodates natural and semi-natural systems were classified into forests, scrub/shrub lands and grasslands on the basis of the extent of green cover. Cultivated and managed systems were classified into orchards, croplands, long fallow/barren lands and water bodies. The forest class was further sub-divided into mixed forest formations, gregarious formations, locale-specific formations, degraded/succession types and plantations. Total 15,565 ground control points were used to assess the accuracy of products available globally (i.e., GlobCover, Holdridge’s life zone map and potential natural vegetation (PNV) maps). It is prepared using 23.5 m seasonal satellite remote sensing data, field samples and information relating to the biogeography, climate and soil [66].
2.3.5. Nepal
ICIMOD has completed mapping of the land use/land cover of Nepal at a spatial resolution of 180 m2. These maps were based WiFs satellite data acquired for the period 1996–1999 by generating sample points within different major land use/land cover classes for digital classification of images. Image classification was based on a supervised classification method and application of a maximum likelihood classifier. Within the 13 major land cover classes, agricultural land has been classified in a single class, i.e., agriculture, the overall accuracy of the map is 88% [62]. One case study has been done in Nepal to study the changes in rice-growing area over a decade (2000–2009) using geoinformatics techniques in combination with socioeconomic information and national statistics. Temporal rice area and land-use changes in Nepal were mapped using MODIS (MOD09A1) 500 m time-series data and spectral matching techniques (SMTs). This analysis presents mapped agricultural cropland change detected over a large area, where fuzzy classification accuracies range between 67% and 91% for various rice classes. The MODIS-derived rice areas for the districts were highly correlated with national statistical data with R2 values of 0.992 [67].
2.3.6. Pakistan
MODIS 250-m2 spatial resolution data obtained on a daily basis and SPOT VGT 1000-m2 spatial resolution data obtained on a 10-daily basis have been used to monitor the growth of crops. Multi-date SPOT-5 high-resolution datasets are also being acquired during each cropping season for assessment of land surface changes and size of cropped areas through image classification into different crop types and land cover classes, which has facilitated crop monitoring and forecasting [68].
In the above discussed country level maps of the south Asian nations in the section from Section 2.3.1 to Section 2.3.6 (Table 4). There are many lacking points with this maps that the spatial resolution of the maps ranges from high to coarser resolution i.e., 20 m2 to 1 Km2 due to which they are not accurate enough to provide a reliable estimate of spatial distribution of major croplands/crop types. These maps are particularly poor at detecting croplands/crop types in areas of low agricultural intensification because the spectral signatures and temporal profiles are similar to grasslands. These maps have on uniqness i.e., these maps are of different temporal resolution cropping season, spatial resolution, spectral resolution, method of classification etc. The unified land cover map of India at spatial resolution of 23.5 m2 by [66] in 2015. The satellite images used for north India, Wester-Ghats, central India etc. is of different time period even though the methodology is same. There are several satellite sources (e.g., Landsat and Sentinel, or the even more finely granulated satellite imagery such as IKONOS/Quickbird or GeoEye) that produce imagery of sufficient detail to capture croplands in regions with low agricultural intensification. A reasonable goal would be a cropland map that provides detail down to at least 30 m2 per pixel, if not lower, as the complexities of today’s land-use policy considerations demand increasingly precise and accurate mapping. Critics say the survey should use images now available that go down to 5.8 m2 per pixel. There is even discussion of seeking satellite imagery where resolutions are measured in cm per pixel. Although remote sensing is advancing rapidly and cropland maps should improve accordingly, the quest for a more finely-detailed cropland map is a long-term solution and is not likely to provide improved products over the short-term. Although, 30 m2 land cover maps are now starting to appear, their overall accuracy is still short of that required for food security applications [28,66,67]. Moreover, high resolution imagery may be needed to identify croplands but the final resolution of a useful global cropland extent map could still be medium resolution, such as 250 m2.
3. Discussion
A lack of details has led to the highly divergent estimates that one finds in the aforementioned land cover and cropland maps. Worldwide, cropland distribution estimates derived from GlobCover are more than 20% higher than those derived from MODIS [20,30,54]. These differences can be attributed to a number of factors, including the use of different classification algorithms with considerably diverse parameters, diverse satellite datasets used for different algorithms, dissimilar spatial resolutions, and the different temporal windows used to develop the land cover and cropland maps [9,10,11,12,28]. The land cover and cropland maps used for geospatial modeling can therefore have a theoretically huge influence on the outputs. Because of the vast areas of diverse types of cropland and due to the small land-holding capacity in the agricultural lands of south Asia, more attention should be focused on high- and very high-resolution cropland mapping that is updated on an annual or more regular basis. Recently, high- and very high-resolution satellite images, e.g., those obtained by Landsat 8 and Sentinel 1, 2, and 3, have become freely available also CBERS-4 satellite is a high spatial resolution, which has been launched in a partnership between China and Brazil space agencies which is freely available and has potential for mapping crops. Accordingly, any long-term solutions should look to benefit from these data-rich information streams and seek to exploit modern technology and the availability of user-friendly tools for processing huge numbers of satellite images within a short period of time to know and understand the major concerns, particularly the paucity of knowledge regarding the spatial distribution of major crop types within South Asia, and the knowledge in further proposing and developing the methodology for mapping the high-resolution cropland maps continuously for the South Asian region by ensuing and adopting the unique definition of cropland categories which can be applicable globally.
Ground data collection is a tedious process because of in accessibility of roads and time consuming. There are several numbers of ways to reduce this burden, including the use of swifter and less error-prone field data capture using smart phones, sensor webs, automated stations, and crowd sourcing of voluntary geographic information, to name a few tedious process through agriculture extension officers by using mobile applications. Still, field data collection can be the most expensive part of any remote sensing analysis, and hence unsupervised and automated mapping approaches that do not rely heavily on field data have also been used to map cropland areas over large geographic areas [57,63]. Estimating accurate area under different land uses was possible using the sub pixel information collected during field campaigns. Field data were also used to address the low spatial resolution problem that arises when data like MODIS is used to map and characterize ground features that are smaller than the pixel area, and when multiple features occupy the same pixel. The national statistics publication of agricultural land use is a good source of information for correlation with the estimated statistics. It produced a good correlation between the two estimates. However, there are corrections or adjustments done subsequently by the government due to delayed accumulation from all parts of the country. This is the reason for a varying correlation between the estimates for different years. This was compensated by using very high-resolution imagery from Google earth and other similar sources. This type of generation of specific information at the country level is unique and is the best way to plan for food security in the country.
4. Conclusions
Moving to produce a high-quality land cover and cropland maps which are updated on a regular basis will still require input from geoinformatics technique, local data and ground data. Given the availability of high and very high-resolution satellite imagery, any long-term solution should look to get the most out of on these data-rich information streams. This demanding need has been recognized recently in the context of monitoring deforestation [20,69]. A geoinformatics solution will be a little bit expensive than other techniques, but this can easily be implicated and used in the present free and rich available data sources. The total amount of money that has been invested in mapping projects, i.e., mapping of the land surface in the past, has been relatively very small when compared with the costs that is experienced as a result of climatic disasters i.e., droughts or mitigation of climate change in the agricultural sector [2].
Before commencing cropland mapping, it is essential to establish a suitable definition of cropland that is compatible with other cropland definitions, e.g., that of the FAO [60]. This is because, in different countries, the cropland or agricultural classes that are often used to describe different classes in land cover maps are not clearly defined, and there is no common agreement as to what they constitute, Hence, establishing a suitable definition of cropland will assist in the mapping of all the classes that come under the category of cropland/agricultural class [9,10,11,12,13,15,52]. Moreover, in future, this may also facilitate the sharing of data, thereby helping to ensure no large gaps in crop coverage or mismatches with other maps that are available globally. With the availability of high-quality accurate maps produced on a regularly updated basis at the spatial and temporal resolutions of land cover and croplands, policy makers at global, regional, national, and sub-national levels will be able to make considerably better decisions for reliably assessing land-use policies and exploring long-term sustainability replacements [23,60]. The above mentioned datasets in our study are doing the job and also helping in the food security by providing the information related to croplands and other land cover classes but to implication of better policies for the better management of croplands due to rapidly growing human population, urbanization, industrialization etc. Its important to get more accurate and continuous ground information for better management of croplands high resolution cropland mapping in continuity may help for the better management of croplands and to improve food security of south Asia by adopting better policies, fertilizer application, irrigation, pest control, accurate yield estimation etc. Due to small land holding capacity in South Asian region using the high spatial resolution satellite images of 10m e.g., Sentinel 1–2, or <10 m2 for cropland or land cover mapping in continuity will help to accurately match the size of paddy/rice croplands for accurately estimation of yield or acreage in the relevant agriculture of the south Asian region. Assessing the impacts of climate change on croplands, food production, and environments, as well as the provision of other ecosystem services, and making appropriate decisions for the overall improvement of the agricultural sector, supported by joint public and private investment, will make a substantial contribution to improving food security in the south Asian region.
Author Contributions
P.P. has collected the literatures and wrote the first version of manuscript; M.K.G. has guided in collection of literatures and in writing and editing the manuscript and both the authors jointly improved the manuscript based on joint discussion.
Funding
This work was undertaken as part of the CGIAR Research Programs on Water, Land and Ecosystems (WLE) led by International Water Management Institute (IWMI) and CGIAR Research Programs on Grain Legumes and Dryland Cereals (GLDC).
Acknowledgments
The authors thank Anthony Whitbread, Program leader, ISD, ICRISAT, and Ms Smitha Sitaraman, Science Editor, ICRISAT, for editing this article. Authors are thankful to anonymous reviewers for their valuable comments and suggestions.
Conflicts of Interest
The authors declare no conflict of interest.
References
- Agriculture Development Bank Report on South Asia. 2013. Available online: https://www.adb.org/documents/adb-annual-report-2013 (accessed on 17 January 2017).
- FAO. FAOSTAT Agricultural Data. 2005. Available online: http://www.fao.org/faostat/en/#data/QC (accessed on 9 February 2017).
- FAO. How to Feed the World in 2050. Report from the High-Level Expert Forum. 2009. Available online: http://www.fao.org/faostat/en/#data/QC (accessed on 3 January 2017).
- FAO. 2008. Available online: http://www.fao.org/faostat/en/#data/QC (accessed on 21 December 2016).
- FAO. FAOSTAT Agricultural Data. 2010. Available online: http://www.fao.org/faostat/en/#data/QC (accessed on 21 November 2016).
- Roberts, L. 9 Billion? Science 2011, 333, 540–543. [Google Scholar] [CrossRef] [PubMed]
- Alexandratos, N.; Bruinsma, J. World Agriculture towards 2030/2050 in Proceedings of the 2012 Revision; ESA Working Paper No 12-03 2012; Food and Agriculture Organization of the United Nations: Rome, Italy, 2012. [Google Scholar]
- FAO. FAOSTAT. 2012. Available online: http://www.fao.org/faostat/en/#data/QC (accessed on 17 February 2017).
- Wu, B.; Gommes, R.; Zhang, M.; Zeng, H.; Yan, N.; Zou, W.; Zheng, Y.; Zhang, N.; Chang, S.; Xing, Q.; et al. Global crop monitoring: A satellite-based hierarchical approach. Remote Sens. 2015, 7, 3907–3933. [Google Scholar] [CrossRef]
- Hannerz, F.; Lotsch, A. Assessment of remotely sensed and statistical inventories of African agricultural fields. Int. J. Remote Sens. 2008, 29, 3787–3804. [Google Scholar] [CrossRef]
- Vancutsem, C.; Marinho, E.; Kayitakire, F.; See, L.; Fritz, S. Harmonizing and Combining Existing Land Cover/Land Use Datasets for Cropland Area Monitoring at the African Continental Scale. Remote Sens. 2013, 5, 19–41. [Google Scholar] [CrossRef] [Green Version]
- Parihar, J.S.; Markand, O.P. Agriculture and hydrology applications of remote sensing. Proc. SPIE Int. Soc. Opt. Eng. 2006, 6411, 641101–641102. [Google Scholar]
- Lobell, D.; Bala, G.; Duffy, P. Biogeophysical impacts of cropland management changes on climate. Geophys. Res. Lett. 2006, 33, 1–4. [Google Scholar] [CrossRef]
- Foley, J.A.; Ramankutty, N.; Brauman, K.A.; Cassidy, E.S.; Gerber, J.S.; Johnston, M.; Mueller, N.D.; O’Connell, C.; Ray, D.K.; West, P.C.; et al. Solutions for a cultivated planet. Nature 2011, 478, 337–342. [Google Scholar] [CrossRef] [PubMed] [Green Version]
- Gordon, L.J.; Steffen, W.; Jonsson, B.F.; Folke, C.; Falkenmark, M.; Johansen, A. Human Modification of Global Water Vapor Flows from the Land Surface. Proc. Natl. Acad. Sci. USA 2005, 102, 7612–7617. [Google Scholar] [CrossRef] [PubMed]
- Gong, P. China needs no foreign help to feed itself. Nature 2011, 474, 7. [Google Scholar] [CrossRef] [PubMed]
- Thenkabail, P.S.; Hanjra, M.A.; Dheeravath, V.; Gumma, M. A holistic view of global croplands and their water use for ensuring global food security in the 21st century through advanced remote sensing and non-remote sensing approaches. Remote Sens. 2010, 2, 211–261. [Google Scholar] [CrossRef] [Green Version]
- Yu, L.; Wang, J.; Clinton, N.; Xin, Q.; Zhong, L.; Chen, Y.; Gong, P. FROM-GC: 30 m global cropland extent derived through multisource data integration. Int. J. Digit. Earth 2013, 6, 521–533. [Google Scholar] [CrossRef]
- Funk, C.C.; Brown, M.E. Declining global per capita agricultural production and warming oceans threaten food security. Food Secur. 2009, 1, 271–289. [Google Scholar] [CrossRef] [Green Version]
- Linda, S.; Steffen, F.; Liangzhi, Y.; Ramankutty, N.; Herrero, M.; Justice, C.; Becker-Reshef, I.; Thornton, P.; Erb, K.; Gong, P.; et al. Improved global cropland data as an essential ingredient for food security. Glob. Food Sec. 2015, 4, 37–45. [Google Scholar] [CrossRef] [Green Version]
- Tilman, D.; Balzer, C.; Hill, J.; Befort, B.L. Global Food Demand and the Sustainable Intensification of Agriculture. Proc. Natl. Acad. Sci. USA 2011, 108, 20260–20264. [Google Scholar] [CrossRef] [PubMed]
- Van Wart, J.; Kersebaum, K.C.; Peng, S.; Milner, M.; Cassman, K.G. Estimating crop yield potential at regional to national scales. Field Crops Res. 2013, 143, 34–43. [Google Scholar] [CrossRef]
- Grassini, P.; van Bussel, L.G.J.; Van Wart, J.; Wolf, J.; Claessens, L.; Yang, H.; Boogaard, H.; de Groot, H.; van Ittersum, M.K.; Cassman, K.G. How good is good enough? Data requirements for reliable crop yield simulations and yield-gap analysis. Field Crops Res. 2015, 177, 49–63. [Google Scholar] [CrossRef] [Green Version]
- Van Bussel, L.G.J.; Grassini, P.; van Wart, J.; Wolf, J.; Claessens, L.; Yang, H.; Boogaard, H.; de Groot, H.; Saito, K.; Cassman, K.G.; et al. From field to atlas: Upscaling of location-specific yield gap estimates. Field Crops Res. 2015, 177, 98–108. [Google Scholar] [CrossRef] [Green Version]
- Thenkabail, P.S.; Biradar, C.M.; Noojipady, P.; Dheeravath, V.; Li, Y.; Velpuri, M.; Gumma, M.; Gangalakunta, O.R.P.; Turral, H.; Cai, X.; et al. Global irrigated area map (GIAM), derived from remote sensing, for the end of the last millennium. Int. J. Remote Sens. 2009, 30, 3679–3733. [Google Scholar] [CrossRef]
- Tilman, D.; Cassman, K.G.; Matson, P.A.; Naylor, R.; Polasky, S. Agricultural Sustainability and Intensive Production Practices. Nature 2002, 418, 671–677. [Google Scholar] [CrossRef] [PubMed]
- Smith, P.; Gregory, P.J.; van Vuuren, D.; Obersteiner, M.; Havlik, P.; Rounsevell, M.; Woods, J.; Stehfest, E.; Bellarby, J. Competition for Land. Philos. Trans. R. Soc. Lond. B, Biol. Sci. 2010, 365, 2941–2957. [Google Scholar] [CrossRef] [PubMed]
- Linard, C.; Gilbert, M.; Tatem, A.J. Assessing the use of global land cover data for guiding large area population distribution modelling. GeoJournal 2010, 76, 525–538. [Google Scholar] [CrossRef] [PubMed] [Green Version]
- Quaife, T.; Quegan, S.; Disney, M.; Lewis, P.; Lomas, M.; Woodward, F.I. Impact of land cover uncertainties on estimates of biospheric carbon fluxes. Glob. Biogeochem. Cycles 2008, 22, 1–12. [Google Scholar] [CrossRef]
- Fritz, S.; You, L.; Bun, A.; See, L.; McCallum, I.; Schill, C.; Perger, C.; Liu, J.; Hansen, M.; Obersteiner, M. Cropland for sub-Saharan Africa: A synergistic approach using five land cover data sets. Geophys. Res. Lett. 2011, 38, L04404. [Google Scholar] [CrossRef]
- Arino, O.; Bicheron, P.; Achard, F.; Latham, J.; Witt, R.; Weber, J.L. The most detailed portrait of Earth. Eur. Space Agency 2008, 136, 25–31. [Google Scholar]
- Bontemps, S.; Defourny, P.; van Bogaert, E.; Arino, O.; Kalogirou, V.; Perez, J.R. GLOBCOVER 2009: Products description and validation report. UCL Eur. Space Agency 2011, 2, 53. Available online: http://doi.pangaea.de/10013/epic.39884.d016 (accessed on 14 April 2017).
- Foley, J.A.; DeFries, R.; Asner, G.P.; Barford, C.; Bonan, G.; Carpenter, S.R.; Chapin, F.S.; Coe, M.T.; Daily, G.C.; Gibbs, H.K.; et al. Global consequences of land use. Science 2005, 309, 570–574. [Google Scholar] [CrossRef] [PubMed]
- Ramankutty, N.; Evan, A.T.; Monfreda, C.; Foley, J.A. Farming the Planet: 1. Geographic Distribution of Global Agricultural Lands in the Year 2000. Glob. Biogeochem. Cycles 2008, 22, 1–19. [Google Scholar] [CrossRef]
- Tateishi, R.; Uriyangqai, B.; Al-Bilbisi, H.; Ghar, A.; Tsend-Ayush, J.; Kobayashi, T.; Kasimu, A.; Hoan, N.T.; Shalaby, A.; Alsaaideh, B.; et al. Production of global land cover data GLCNMO. Int. J. Digit. Earth 2011, 4, 2249. [Google Scholar] [CrossRef]
- Wulder, M.A.; Masek, J.G.; Cohen, W.B.; Loveland, T.R.; Woodcock, C.E. Opening the Archive: How Free Data Has Enabled the Science and Monitoring Promise of Landsat. Remote Sens. Environ. 2012, 122, 2–10. [Google Scholar] [CrossRef]
- Loveland, T.R.; Reed, B.C.; Brown, J.F.; Ohlen, D.O.; Zhu, Z.; Yang, L.; Merchant, J.W. Development of a Global Land Cover Characteristics Database and IGBP DIS Cover from 1 km AVHRR Data. Int. J. Remote Sens. 2000, 21, 1303–1330. [Google Scholar] [CrossRef]
- Hansen, M.; DeFries, R.; Townshend, J.R.G.; Sohlberg, R. Global land cover classification at 1km resolution using a decision tree classifier. Int. J. Remote Sens. 2000, 21, 1331–1365. [Google Scholar] [CrossRef]
- Latham, J.; Cumani, R.; Rosati, I.; Bloise, M. Global Land Cover SHARE (GLC-SHARE) Database Beta-Release Version 1.0; FAO: Rome, Italy, 2014. [Google Scholar]
- Bartholomé, E.; Belward, A. GLC2000: A new approach to global land cover mapping from Earth observation data. Int. J. Remote Sens. 2005, 26, 1959–1977. [Google Scholar] [CrossRef]
- Friedl, M.A.; McIver, D.K.; Hodges, J.C.F.; Zhang, X.Y.; Muchoney, D.; Strahler, A.H.; Woodcock, C.E.; Gopal, S.; Schneider, A.; Cooper, A.; et al. Global land cover mapping from MODIS: Algorithms and early results. Remote Sens. Environ. 2002, 83, 287–302. [Google Scholar] [CrossRef]
- Leff, B.; Ramankutty, N.; Foley, J.A. Geographic distribution of major crops across the world. Glob. Biogeochem. Cycles 2004, 18, GB1009. [Google Scholar] [CrossRef]
- Monfreda, C.; Ramankutty, N.; Foley, J.A. Farming the Planet: 2. Geographic Distribution of Crop Areas, Yields, Physiological Types, and Net Primary Production in the Year 2000. Glob. Food Sec. 2008, 22, 567–568. [Google Scholar] [CrossRef]
- Friedl, M.A.; Sulla-Menashe, D.; Tan, B.; Schneider, A.; Ramankutty, N.; Sibley, A.; Huang, X. MODIS Collection 5 global land cover: Algorithm refinements and characterization of new datasets. Remote Sens. Environ. 2010, 114, 168–182. [Google Scholar] [CrossRef]
- Goldewijk, K.K.; Beusen, A.; van Drecht, G.; de Vos, M. The HYDE 3.1 Spatially Explicit Database of Human-induced Global Land-use Change over the Past 12,000 Years. Glob. Ecol. Biogeogr. 2010, 20, 73–86. [Google Scholar] [CrossRef]
- Biradar, C.M.; Thenkabail, P.S.; Noojipady, P.; Li, Y.; Dheeravath, V.; Turral, H.; Velpuri, M.; Gumma, M.K.; Gangalakunta, O.R.P.; Cai, X.L.; et al. A global map of rainfed cropland areas (GMRCA) at the end of last millennium using remote sensing. Int. J. Appl. Earth Obs. Geoinf. 2009, 11, 114–129. [Google Scholar] [CrossRef]
- Fritz, S.; See, L.; McCallum, I.; You, L.; Bun, A.; Moltchanova, E.; Duerauer, M.; Albrecht, F.; Schill, C.; Perger, C.; et al. Mapping global cropland and field size. Glob. Chang. Biol. 2015, 21, 1980–1992. [Google Scholar] [CrossRef] [PubMed] [Green Version]
- Portmann, F.; Siebert, S.; Doll, P. MIRCA2000—Global monthly irrigated and rainfed crop areas around the year 2000: A new high-resolution data set for agricultural and hydrological modelling. Glob. Biogeochem. Cycles 2010, 24, GB1011. [Google Scholar] [CrossRef]
- Pittman, K.; Hansen, M.C.; Becker-Reshef, I.; Potapov, P.V.; Justice, C.O. Estimating Global Cropland Extent with Multi-Year MODIS Data. Rem. Sens. 2010, 2, 1844–1863. [Google Scholar] [CrossRef]
- Waldner, F.S.; Fritz, A.; Gregorio, D.; Defourny, P. Mapping priorities to focus cropland mapping activities: Fitness assessment of existing global, regional and national cropland maps. Remote Sens. 2015, 7, 7959–7986. [Google Scholar] [CrossRef] [Green Version]
- Gong, P.; Wang, J.; Yu, L.; Zhao, Y.C.; Zhao, Y.Y.; Liang, L.; Niu, Z.G.; Huang, X.M.; Fu, H.H.; Liu, S.; et al. Finer resolution observation and monitoring of global land cover: First mapping results with Landsat TM and ETM+ data. Int. J. Remote Sens. 2013, 34, 2607–2654. [Google Scholar] [CrossRef]
- Yu, L.; Wang, J.; Gong, P. Improving 30 m global land-cover map FROM-GLC with time series MODIS and auxiliary data sets: A segmentation-based approach. Int. J. Remote Sens. 2013, 34, 5851–5867. [Google Scholar] [CrossRef]
- Chen, J.; Chen, J.; Liao, A.; Cao, X.; Chen, L.; Chen, X.; He, C.; Han, G.; Peng, S.; Lu, M.; et al. Global land cover mapping at 30m resolution: A POK-based operational approach. ISPRS J. Photogramm. Remote Sens. 2015, 103, 7–27. [Google Scholar] [CrossRef]
- Fritz, S.; See, L.; McCallum, I.; Schill, C.; Obersteiner, M.; Velde, M.; van der Boettcher, H.; Havlík, P.; Achard, F. Highlighting continued uncertainty in global land cover maps for the user community. Environ. Res. Lett. 2011, 6, 044005. [Google Scholar] [CrossRef]
- Ozdogan, M.; Woodcock, C.E. Resolution dependent errors in remote sensing of cultivated areas. Remote Sens. Environ. 2006, 103, 203–217. [Google Scholar] [CrossRef]
- Gumma, M.K.; Nelson, A.; Thenkabail, P.S.; Singh, A.N. Mapping rice areas of South Asia using MODIS multitemporal data. J. Appl. Remote Sens. 2011, 5, 053547. [Google Scholar] [CrossRef] [Green Version]
- Gumma, M.K.; Thenkabail, P.S.; Teluguntla, P.; Rao, M.N.; Mohammed, A.I.; Whitbread, A.M. Mapping rice-fallow cropland areas for short-season grain legumes intensification in South Asia using MODIS 250 m time-series data. Int. J. Digit. Earth 2016, 9, 981–1003. [Google Scholar] [CrossRef] [Green Version]
- Huke, R.E.; Huke, E.H. Rice Area by Type of Culture: South, Southeast and East Asia; A Revised and Updated Data Base; IRRI: Manila, Philippines, 1997. [Google Scholar]
- Xiao, X.; Boles, S.; Frolking, S.; Li, C.; Babu, J.Y.; Salas, W.; Moore, B. Mapping paddy rice agriculture in South and Southeast Asia using multi-temporal MODIS images. Remote Sens. Environ. 2006, 100, 95–113. [Google Scholar] [CrossRef]
- FAO Global Cropland Definition. Available online: http://www.fao.org/docrep/005/Y4171E/Y4171E20.htm (accessed on 2 June 2018).
- Afghanistan Land Cover Mapping (ALCM). Strengthening Agricultural Economics, Market Information and Statistics Services in Afghanistan. Available online: http://www.glcn.org/activities/afg_lc_en.jsp (accessed on 3 January 2017).
- Sushil, P. Regional Land Cover Mapping of the Hindu Kush-Himalayan Using Satellite image: An Approach to Understand the Dynamics of Land Use and Land Cover Change. AARS 2002. Available online: http://a-a-r-s.org/aars/proceeding/ACRS2002/Papers/LU02-1.htm (accessed on 9 February 2017).
- Gumma, M.K.; Thenkabail, P.S.; Maunahan, A.; Islam, S.; Nelson, A. Mapping seasonal rice cropland extent and area in the high cropping intensity environment of Bangladesh using MODIS 500 m data for the year 2010. ISPRS J. Photogramm.Remote Sens. 2014, 9, 98–113. [Google Scholar] [CrossRef]
- Sreenivas, K.; Sekhar, N.S.; Saxena, M.; Paliwal, R.; Pathak, S.; Porwal, M.; Fyzee, M.; Kameswara Rao, S.V.C.; Wadodkar, M.; Anasuya, T.; et al. Estimating Inter-Annual Diversity of Seasonal Agricultural Area using Multi-Temporal Resourcesat Data. J. Environ. Manag. 2015, 161, 433–442. [Google Scholar] [CrossRef] [PubMed]
- Gumma, M.K.; Pyla, K.; Thenkabail, P.; Reddi, V.; Naresh, G.; Mohammed, I.; Rafi, I. Crop dominance mapping with IRS-P6 and MODIS 250-m time series data. Agriculture 2014, 4, 113–131. [Google Scholar] [CrossRef] [Green Version]
- Roy, P.S.; Behera, M.D.; Murthy, M.S.R.; Roy, A.; Singh, S.; Kushwaha, S.P.S.; Jha, C.S.; Sudhakar, S.; Joshi, P.K. New vegetation type map of India prepared using satellite remote sensing: Comparison with global vegetation maps and utilities. Int. J. Appl. Earth Obs. Geoinf. 2015, 39, 142–159. [Google Scholar] [CrossRef]
- Gumma, M.K.; Gauchan, D.; Nelson, A.D.; Pandey, S.; Rala, A. Temporal changes in rice-growing area and their impact on livelihood over a decade: A case study of Nepal. Agric. Ecosyst. Environ. 2011, 142, 382–392. [Google Scholar] [CrossRef]
- PAK-SCMS. Satellite Based Crop Monitoring System; Serial No 50; PAK-SCMS: Karachi, Pakistan, 2015; Volume 5.
- Lynch, J.; Maslin, M.; Balzter, H.; Sweeting, M. Sustainability: Choose satellites to monitor deforestation. Nature 2013, 496, 293–294. [Google Scholar] [CrossRef] [PubMed] [Green Version]
Figure 1.
Map showing the south Asian countries (Afghanistan, Bangladesh, Bhutan, India, Sri Lanka, Maldives, Nepal and Pakistan).
Figure 1.
Map showing the south Asian countries (Afghanistan, Bangladesh, Bhutan, India, Sri Lanka, Maldives, Nepal and Pakistan).


Table 1.
Trends in different classes of agriculture land area (1000 ha) in south Asian countries from 1962 to 2012.
Table 1.
Trends in different classes of agriculture land area (1000 ha) in south Asian countries from 1962 to 2012.
| Countries | Classes | 1962 | 1972 | 1982 | 1992 | 2002 | 2012 |
|---|---|---|---|---|---|---|---|
| India | Arable land | 156,700 | 160,186 | 163,246 | 162,706 | 160,432 | 156,542 |
| Permanent crops | 5700 | 4800 | 5500 | 7300 | 9600 | 12,800 | |
| Permanent meadows and pasture | 14,082 | 12,960 | 12,025 | 11,299 | 10,528 | 10,296 | |
| Agriculture land | 176,482 | 177,946 | 180,771 | 181,305 | 180,560 | 179,642 | |
| Afghanistan | Arable land | 7700 | 7910 | 7910 | 7910 | 7678 | 7785 |
| Permanent crops | 60 | 136 | 144 | 120 | 75 | 125 | |
| Permanent meadows and pasture | 30,000 | 30,000 | 30,000 | 30,000 | 30,000 | 30,000 | |
| Agriculture land | 37,760 | 38,046 | 38,054 | 38,030 | 37,753 | 37,910 | |
| Sri Lanka | Arable land | 577 | 822 | 857 | 905 | 936 | 1300 |
| Permanent crops | 945 | 1084 | 1000 | 1000 | 980 | 1000 | |
| Permanent meadows and pasture | 185 | 439 | 439 | 439 | 440 | 440 | |
| Agriculture land | 1707 | 2345 | 2296 | 2344 | 2356 | 2690 | |
| Bangladesh | Arable land | 8597 | 9133 | 9104 | 8609 | 8253 | 7678 |
| Permanent crops | 280 | 258 | 274 | 340 | 500 | 830 | |
| Permanent meadows and pasture | 600 | 600 | 600 | 600 | 600 | 600 | |
| Agriculture land | 9477 | 9991 | 9978 | 9549 | 9353 | 9120 | |
| Pakistan | Arable land | 30,690 | 30,340 | 33,140 | 29,920 | 31,220 | 30,240 |
| Permanent crops | 150 | 165 | 369 | 460 | 664 | 823 | |
| Permanent meadows and pasture | 5000 | 5000 | 5000 | 5000 | 5000 | 5000 | |
| Agriculture land | 35,840 | 35,505 | 38,509 | 35,380 | 35,884 | 36,063 | |
| Nepal | Arable land | 1806 | 2055 | 2291.60 | 2327.30 | 2335 | 2118 |
| Permanent crops | 25 | 27 | 29 | 37.9 | 120 | 208 | |
| Permanent meadows and pasture | 1722 | 1740 | 1786 | 1793 | 1786 | 1795 | |
| Agriculture land | 3553 | 3822 | 4106.60 | 4158.20 | 4241 | 4121 | |
| Bhutan | Arable land | 100 | 110 | 135 | 135 | 111 | 100.2 |
| Permanent crops | 13 | 16 | 18 | 19 | 19 | 12.4 | |
| Permanent meadows and pasture | 250 | 259 | 265 | 350 | 405 | 407 | |
| Agriculture land | 363 | 385 | 418 | 504 | 535 | 519.6 | |
| Maldives | Arable land | 2 | 3 | 3 | 3 | 3 | 3.9 |
| Permanent crops | 2 | 2 | 4 | 4 | 8 | 3 | |
| Permanent meadows and pasture | 1 | 1 | 1 | 1 | 1 | 1 | |
| Agriculture land | 5 | 6 | 8 | 8 | 12 | 7.9 |
Source: [8]
Table 2.
Summary of the available global land cover and cropland maps.
| Sl No | Product | Spatial Resolution | Year | Satellite Data | Classification Method | Overall Accuracy | Reference |
|---|---|---|---|---|---|---|---|
| 1 | International Geosphere Biosphere Programme Data and Information Systems (IGBP-DIS) | 1 km | 1992–1993 | Advanced Very High-resolution Radiometer (AVHRR) | Unsupervised | 71.60% | [37] doi:10.1080/014311600210191 |
| 2 | University of Maryland Global Land Cover (UMd-GLC) | 1 km | 1992–1993 | Advanced Very High-resolution Radiometer (AVHRR) | Decision tree | 65% to 82% | [38] doi:10.1080/014311600210209 |
| 3 | Global Land Cover SHARE (GLC-SHARE) | 1 km | 2000–2014 | Globcover 2009, MODIS VCF 2010 andCropland database 2012 | Single harmonized database usinginternational standards | 80% | [39] http://www.fao.org/uploads/media/glc-share-doc.pdf |
| 4 | Global Land Cover Map for the Year 2000 (GLC2000) | 1 km | 2000 | SPOT-4 | Unsupervised | 68.60% | [40] doi:10.1080/01431160412331291297 |
| 5 | MODIS-Based MCD12Q1 | 1 km | 2002 | MODIS | Supervised (C4.5 algorithm) | 75% to 79% | [41] http://doi.org/10.1016/S0034-4257(02)00078-0 |
| 6 | Collection 5 MODIS Global Land Cover Type Product | 500 m | 2000 | MODIS | Decision tree | 75% | [44] http://dx.doi.org/10.1016/j.rse.2009.08.016 |
| 7 | Global Land Cover by National Mapping Organizations (GLCNMO) | 1 km | 2003 | MODIS | Supervised | 76.50% | [35] doi:10.1080/17538941003777521 |
| 8 | The Centre for Sustainability and the Global Environment (SAGE) | 10 km | 2000 | Boston University’s MODIS-derived land cover product (BU-MODIS) and the GLC2000 dataset | Merging | 90% | [34] doi:10.1029/2007GB002952 |
| 9 | IIASA-IFPRI Cropland Percentage Map | 1 km | 2005 | GlobCover 2005, MODIS v.5, regional maps, such as AFRICOVER, and national maps | Combining | 82.40% | [47] doi:10.1111/gcb.12838 |
| 10 | GlobCover Global Land Cover Map | 300 m | 2009 | MEdium Resolution Imaging Spectrometer (MERIS) | Supervised and Unsupervised | 67.50% | [32] http://doi.pangaea.de/10013/epic.39884.d016 |
| 11 | Global Cropland Extent Map | 250 m | 2000–2008 | MODIS | Supervised | 63% | [49] doi:10.3390/rs2071844 |
| 12 | A Unified Global Cropland Layer | 250 m | 2014 | National, Regional and Global land cover maps | Multi criteria approach | 82% | [50] doi:10.3390/rs70607959 |
| 13 | Finer Resolution Observation and Monitoring of Global Land Cover (FROM-GLC) | 30 m | 2010 | Landsat TM and ETM+ | Supervised | 64.90% | [51] https://doi.org/10.1080/01431161.2012.748992 |
| 14 | Fine Resolution Observation and Monitoring of Global Land Cover (FROM-GLC-seg) | 30 m | 2013 | Landsat TM, ETM+ and MODIS | Supervised (Image Segmentation) | 67.08% | [52] http://dx.doi.org/10.1080/01431161.2013.798055 |
| 15 | Global Land Cover (GLC) | 30 m | 2000–2010 | Landsat TM and ETM+ | Supervised | 80% | [53] doi:10.1016/j.isprsjprs.2014.09.002 |
Table 3.
Summary of the available regional land cover and cropland maps.
| Sl No | Product | Spatial Resolution | Year | Satellite Data | Classification Method | Overall Accuracy | Reference |
|---|---|---|---|---|---|---|---|
| 1 | Rice map of South Asia of the year 2010 | 500 m | 2010 | MODIS | Supervised | 80% | [56] doi:10.1117/1.3619838 |
| 2 | Rainfed and irrigated rice-fallow cropland areas map of South Asia | 250 m | 2010–2011 | MODIS | Spectral matching technique | 82% | [57] doi:10.1080/17538947.2016.1168489 |
| 3 | Rice map of South Asia of the year 2002 | 500 m | 2002 | MODIS | Supervised | 85% | [60] doi:10.1016/j.rse.2005.10.004 |
Table 4.
Summary of the available national level land cover and cropland maps.
| Sl No | Product | Spatial Resolution | Year | Satellite Data | Classification Method | Overall Accuracy | Reference |
|---|---|---|---|---|---|---|---|
| 1 | Land use/land cover map of Bhutan | 180 m | 1996–1999 | WiFs | Supervised | 83.10% | [62] http://a-a-r-s.org/aars/proceeding/ACRS2002/Papers/LU02-1.htm |
| 2 | Seasonal paddy rice map of Bangladesh | 500 m | 2000 | MODIS | Unsupervised | 78–90% | [63] doi:10.1016/j.isprsjprs.2014.02.007 |
| 3 | National-level agriculture land cover-type map of India | 56 m | 2005-2006 and 2011–2012 | AWiFS | Supervised | 87–96% | [64] doi:10.1016/j.jenvman.2014.10.031 |
| 4 | Crop dominance map in Krishna basin | 23.5 m and 250 m | 2005 | IRS-P6 and MODIS | Supervised | 67–100% | [65] https://doi.org/10.3390/agriculture4020113 |
| 5 | Land use/land cover map of Nepal | 180 m | 1996–1999 | WiFs | Supervised | 88% | [62] http://a-a-r-s.org/aars/proceeding/ACRS2002/Papers/LU02-1.htm |
© 2018 by the authors. Licensee MDPI, Basel, Switzerland. This article is an open access article distributed under the terms and conditions of the Creative Commons Attribution (CC BY) license (http://creativecommons.org/licenses/by/4.0/).
Share and Cite
MDPI and ACS Style
Patil, P.; Gumma, M.K. A Review of the Available Land Cover and Cropland Maps for South Asia. Agriculture 2018, 8, 111. https://doi.org/10.3390/agriculture8070111
AMA Style
Patil P, Gumma MK. A Review of the Available Land Cover and Cropland Maps for South Asia. Agriculture. 2018; 8(7):111. https://doi.org/10.3390/agriculture8070111
Chicago/Turabian StylePatil, Prashant, and Murali Krishna Gumma. 2018. "A Review of the Available Land Cover and Cropland Maps for South Asia" Agriculture 8, no. 7: 111. https://doi.org/10.3390/agriculture8070111
Note that from the first issue of 2016, this journal uses article numbers instead of page numbers. See further details here.