Identification of Marbling Gene Loci in Commercial Pigs in Canadian Herds


Agri-Food & Agriculture Canada, Lacombe Research Centre, 6000 C & E Trail, Lacombe, AB T4L 1W1, Canada
*
Author to whom correspondence should be addressed.
Agriculture 2018, 8(8), 122; https://doi.org/10.3390/agriculture8080122
Submission received: 20 June 2018
/
Revised: 27 July 2018
/
Accepted: 31 July 2018
/
Published: 3 August 2018
(This article belongs to the Special Issue Animal Breeding and Genetics)
Abstract
:A genome-wide association study (GWAS) was performed on the intramuscular fat percentage in pork chops in commercially available swine in Canada. The Duroc, Iberian, Lacombe, Berkshire, and Pietrain breeds were crossed with Large White sows, and their F1 offspring were ranked according to the intramuscular fat percentage (IMF %) obtained in their longissimus dorsi (LD) muscle loin chops. The ideal IMF % is considered to be >3%, whereas the average is ~1.5% in North American pork. The genetics of the top 10% and bottom 10% from our sample population were analysed by using 80,000 single nucleotide polymorphism (SNP) microarrays in the GWAS. Our sample population had an average IMF % of 2.5 ± 0.7%, but some pork achieved >7% IMF. GWAS analysis revealed SNP markers which were associated with the highest marbled pork chops on chromosomes 5, 7, and 16. Using the Sus scrofa/ susScr 11.1 map, we determined that the nearest genes were sarcospan (SSPN), Rh-associated glycoprotein (RHAG), and EGF-like fibronectin and laminin G (EGFLAM), which can be linked with muscular dystrophy disorders. We tested a subpopulation of Duroc-sired animals and found a different set of markers close to glycine receptor beta (GRLB) and potassium channel 3 (KCNJ3) on chromosomes 8 and 15. Based on our results, we could achieve pork with a good IMF of >4% from animals commercially bred and raised to standard market weights of 110 kg. The choice of obtaining a good marbling line of pigs is not necessarily breed-specific, but it is line-specific.
1. Introduction
A genome-wide association study (GWAS) was performed on commercial boars and sows and their offspring to find the quantitative trait loci (QTLs) that best matched up with the degree of intramuscular fat percentage (IMF %) found in the longissimus dorsi (LD) muscle at the time of slaughter. The IMF % is also called marbling, and is associated with better palatability of the cooked pork chops. Marbling or IMF % is the fat in the muscle fibres of loin pork chops that gives flavour, texture, moisture, and some tenderness to the cooked meat. Marbling is visually assessed subjectively as small white fat deposit, as well as by spectral analysis, ultrasound, or chemical analysis [1]. The chemical analysis of intramuscular fat can be objectively scored as the percentage of fat obtained from a unit of lean muscle and measured by petroleum ether extraction (Soxtec) or by NMR [2] with a Smart Trac analyser. Most pork produced in Canada contains on average 1.5% IMF in lean longissimus muscle. Sensory taste panels have determined that the ideal minimal amount of fat should be 3% [3,4]. Low IMF % pork has problems with a lack of taste, moisture, and tenderness. The beef industry has set their minimal amount of marbling fat at 7% IMF in a fresh loin steak [5] to attain a premium grade of AAA or prime. In recognition of the value of IMF in pork loin muscle, the USDA (Docket no. AMS-LPS-17-0046) now proposes that a grade system be set for rewarding pork which contains >3% IMF [6].
The amount of IMF is determined by the animal’s genetics and environment. Heritability of IMF % has been estimated between 0.39 and 0.65, and is co-dependent upon other measures, such as back fat, sex, age, diet [7], and final slaughter weight [8]. The correlation between IMF and other fat deposit is varied, the correlation between subcutaneous back fat is moderate (r = 0.53, P < 0.01), and the correlation between IMF and belly seam fat (r = 0.18, P < 0.01) is weak [9,10]. Pigs are graded solely on their lean meat yield and minimal back fat, which has a negative correlation with IMF (r = −0.55, P < 0.01) [11]. This has adversely led to the loss of IMF in typical pork carcasses [12]. Selection for pigs with good marbling are being developed as a meat quality line, but the current overly simplified grading system needs to be updated. IMF % is measured mainly post-mortem and subjectively [1], and may be difficult to place in an in-line processing system. The use of GWAS and genetic markers for marbling will assist the pork industry’s efforts to maintain a minimal level of IMF. There have been many articles comparing the amount of marbling with GWAS in swine [13,14,15] of various breeds. We have chosen to address the problem by selecting only the breeds that are commercially available. Our goal is to find pigs with superior levels of IMF and to identify the specific genes involved.
2. Materials and Methods
2.1. Animals and Phenotypic Analysis
The selection of various genotypes of commercial pigs was performed at the Lacombe piggery. For the first round of breeding, sires labelled as Duroc, Berskshire, Pietrain, Iberian, and Lacombe were selected from commercial artificial insemination stock from Magnum Swine Genetics (Fort Macleod, AB, Canada) or Ontario Swine Improvement (Innerkip, ON, Canada), and bred to in-house Large White sows. The F1 offspring were raised to a market weight of 110 kg. Animals were fed standard diets and finished on a grower ration from 70 kg to slaughter market weight, which contained 16% crude protein in barley, wheat, and soybean meal blend, according to the National Research Council requirements [16]. The pigs were cared for according to the Canadian Council on Animal Care guidelines [17]. Upon reaching the market weight of ~110 kg in ~180 days, the animals were slaughtered at the Lacombe station abattoir, and their carcasses were processed with a 24 h post-slaughter chilling at +4 °C. The 24 h chilled carcass longissimus dorsi muscle was cut into 4-cm-thick chops and the 12th to 13th rib site chop [18] was saved for further processing by visual assessment of marbling and colour grading [19]. The intramuscular fat % assessment was performed by the collection of 50 g of a lean LD meat sample, which was then ground and prepared for the analysis of moisture by microwave analysis and IMF % by NMR using the Smart Trac 2 Moisture and Fat Analyser 2 (CEM Corp, Matthews, NC, USA) [2].
2.2. Genotyping
The pork samples (n = 616) with IMF % values were screened to select 96 barrows, representing the top 10% and bottom 10% of IMF %. The genomic DNA from the pigs was collected from the blood or from the muscle tissue and purified with genomic GenElute Mammalian DNA kits (MilliporeSigma, Oakville, ON, Canada) or the NaI-based Mag-Bind Total Pure kit (Omega Bio-tek, Norcross, GA, USA). The selected genotypes were run on the Illumina Neogen, GeneSeek Genomic Profiler (GGP) porcine array (Illumina, Markham, ON, Canada) which contains ~80,000 single-nucleotide polymorphism (SNP) sites with an average marker spacing of ~42 kb. The GGP porcine microarrays were carried out by Delta Genomics DNA (Edmonton, AB, Canada). The results from the GGP porcine microarrays were filtered by Illumina Genome Studio v.2 to remove the SNP markers with low minor allele frequency (MAF < 0.05) and significant deviations from the Hardy–Weinberg equilibrium.
2.3. Genome-Wide Association Study
The phenotypic IMF % was standardized according to the results obtained from three samplings, and the average mean was used as the main determination. Individual genotypes were loaded into file using R-code (General Public License [GNU] v.3.4.4) and the matching IMF % values were assigned to the database, which were then analysed using SNP & Variation Suite (SVS) v8.x (Golden Helix, Inc., Bozeman, MT, USA, www.goldenhelix.com). The individual genotypes were then screened with the Illumina GGP porcine 80 K SNP microarray and the SNPs were used to generate a physical map location. The map position allowed us to establish quantitative trait loci (QTLs) and create Manhattan plots in the map position using a GWAS of the marbling. The chromosomal locations of the SNP markers were also used in the SVS variation suite program to give a proximity to nearby genes. We used the University of California Santa Clara (UCSC) genome browser [21] of the Pig Genome susScr11 assembly to help identify by map the position of the nearby genes and to link it to known SNPs of the nearby genes, by using the National Center for Biotechnology Information (NCBI) Gene of the RefSeq [22]. The IMF % and the GWAS were also subdivided into the various sire breeds to see if the markers were universal or breed-specific.
2.4. Single SNP Association Analysis
The SNPs that showed a higher genome-wide significance (P < 4 × 10⁻⁸) location of markers were placed onto the Sus scrofa 11.1/susScr11 map [23].The 80,000 SNPs were tested for the degree of IMF % measured on the animals’ LD muscle and compared across the population of animals. The SVS variation suite was used to generate Manhattan and QQ plots of the P-values of the single-nucleotide polymorphism (SNP)-based associated with IMF % and was set at a threshold of (P < 4 × 10⁻⁸) to clearly identify the markers for genome-wide significance. The markers’ position on the susScr11 map and the nearest genes were identified according to the position. Most of the markers were found in the repeat masker elements, but were close to nearby genes. Many of the proximate genes contained additional SNPs that were identified by the reference dbSNP databank. The refSNPs of the nearest genes were extrapolated by their Gene and GenBank number within the NCBI data banks [24] (Table 1 and Table 2).
3. Results and Discussion
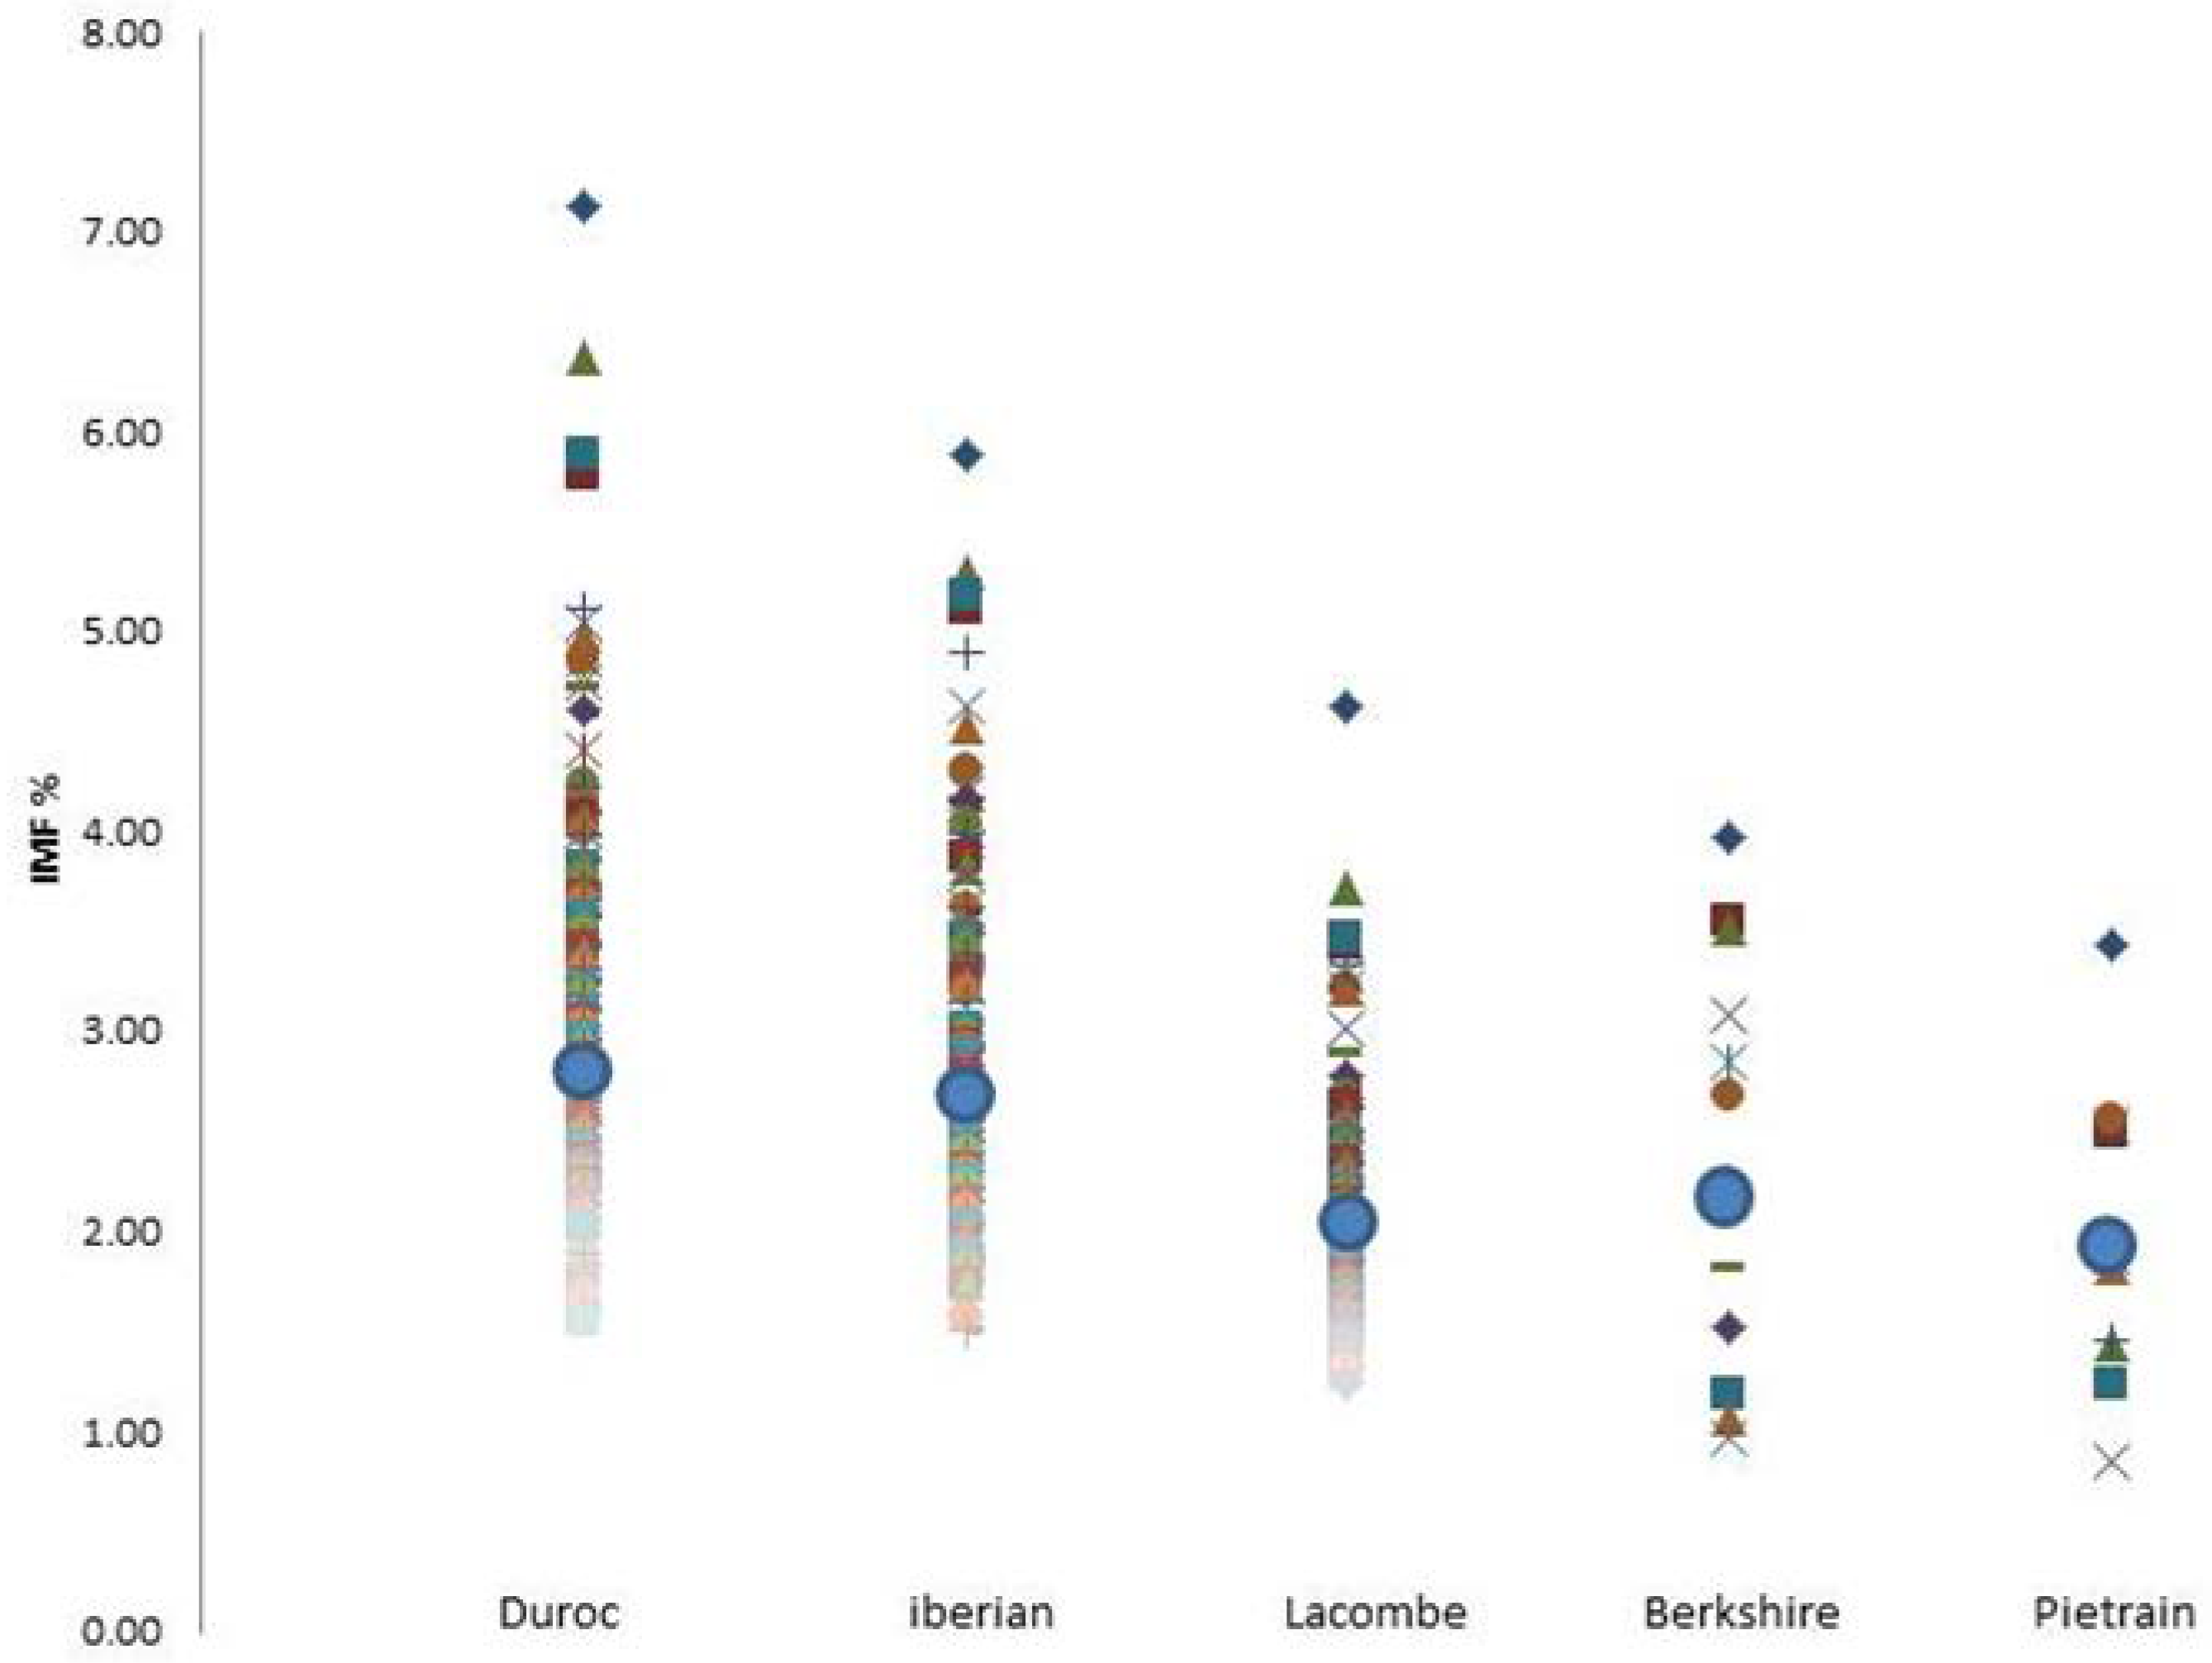
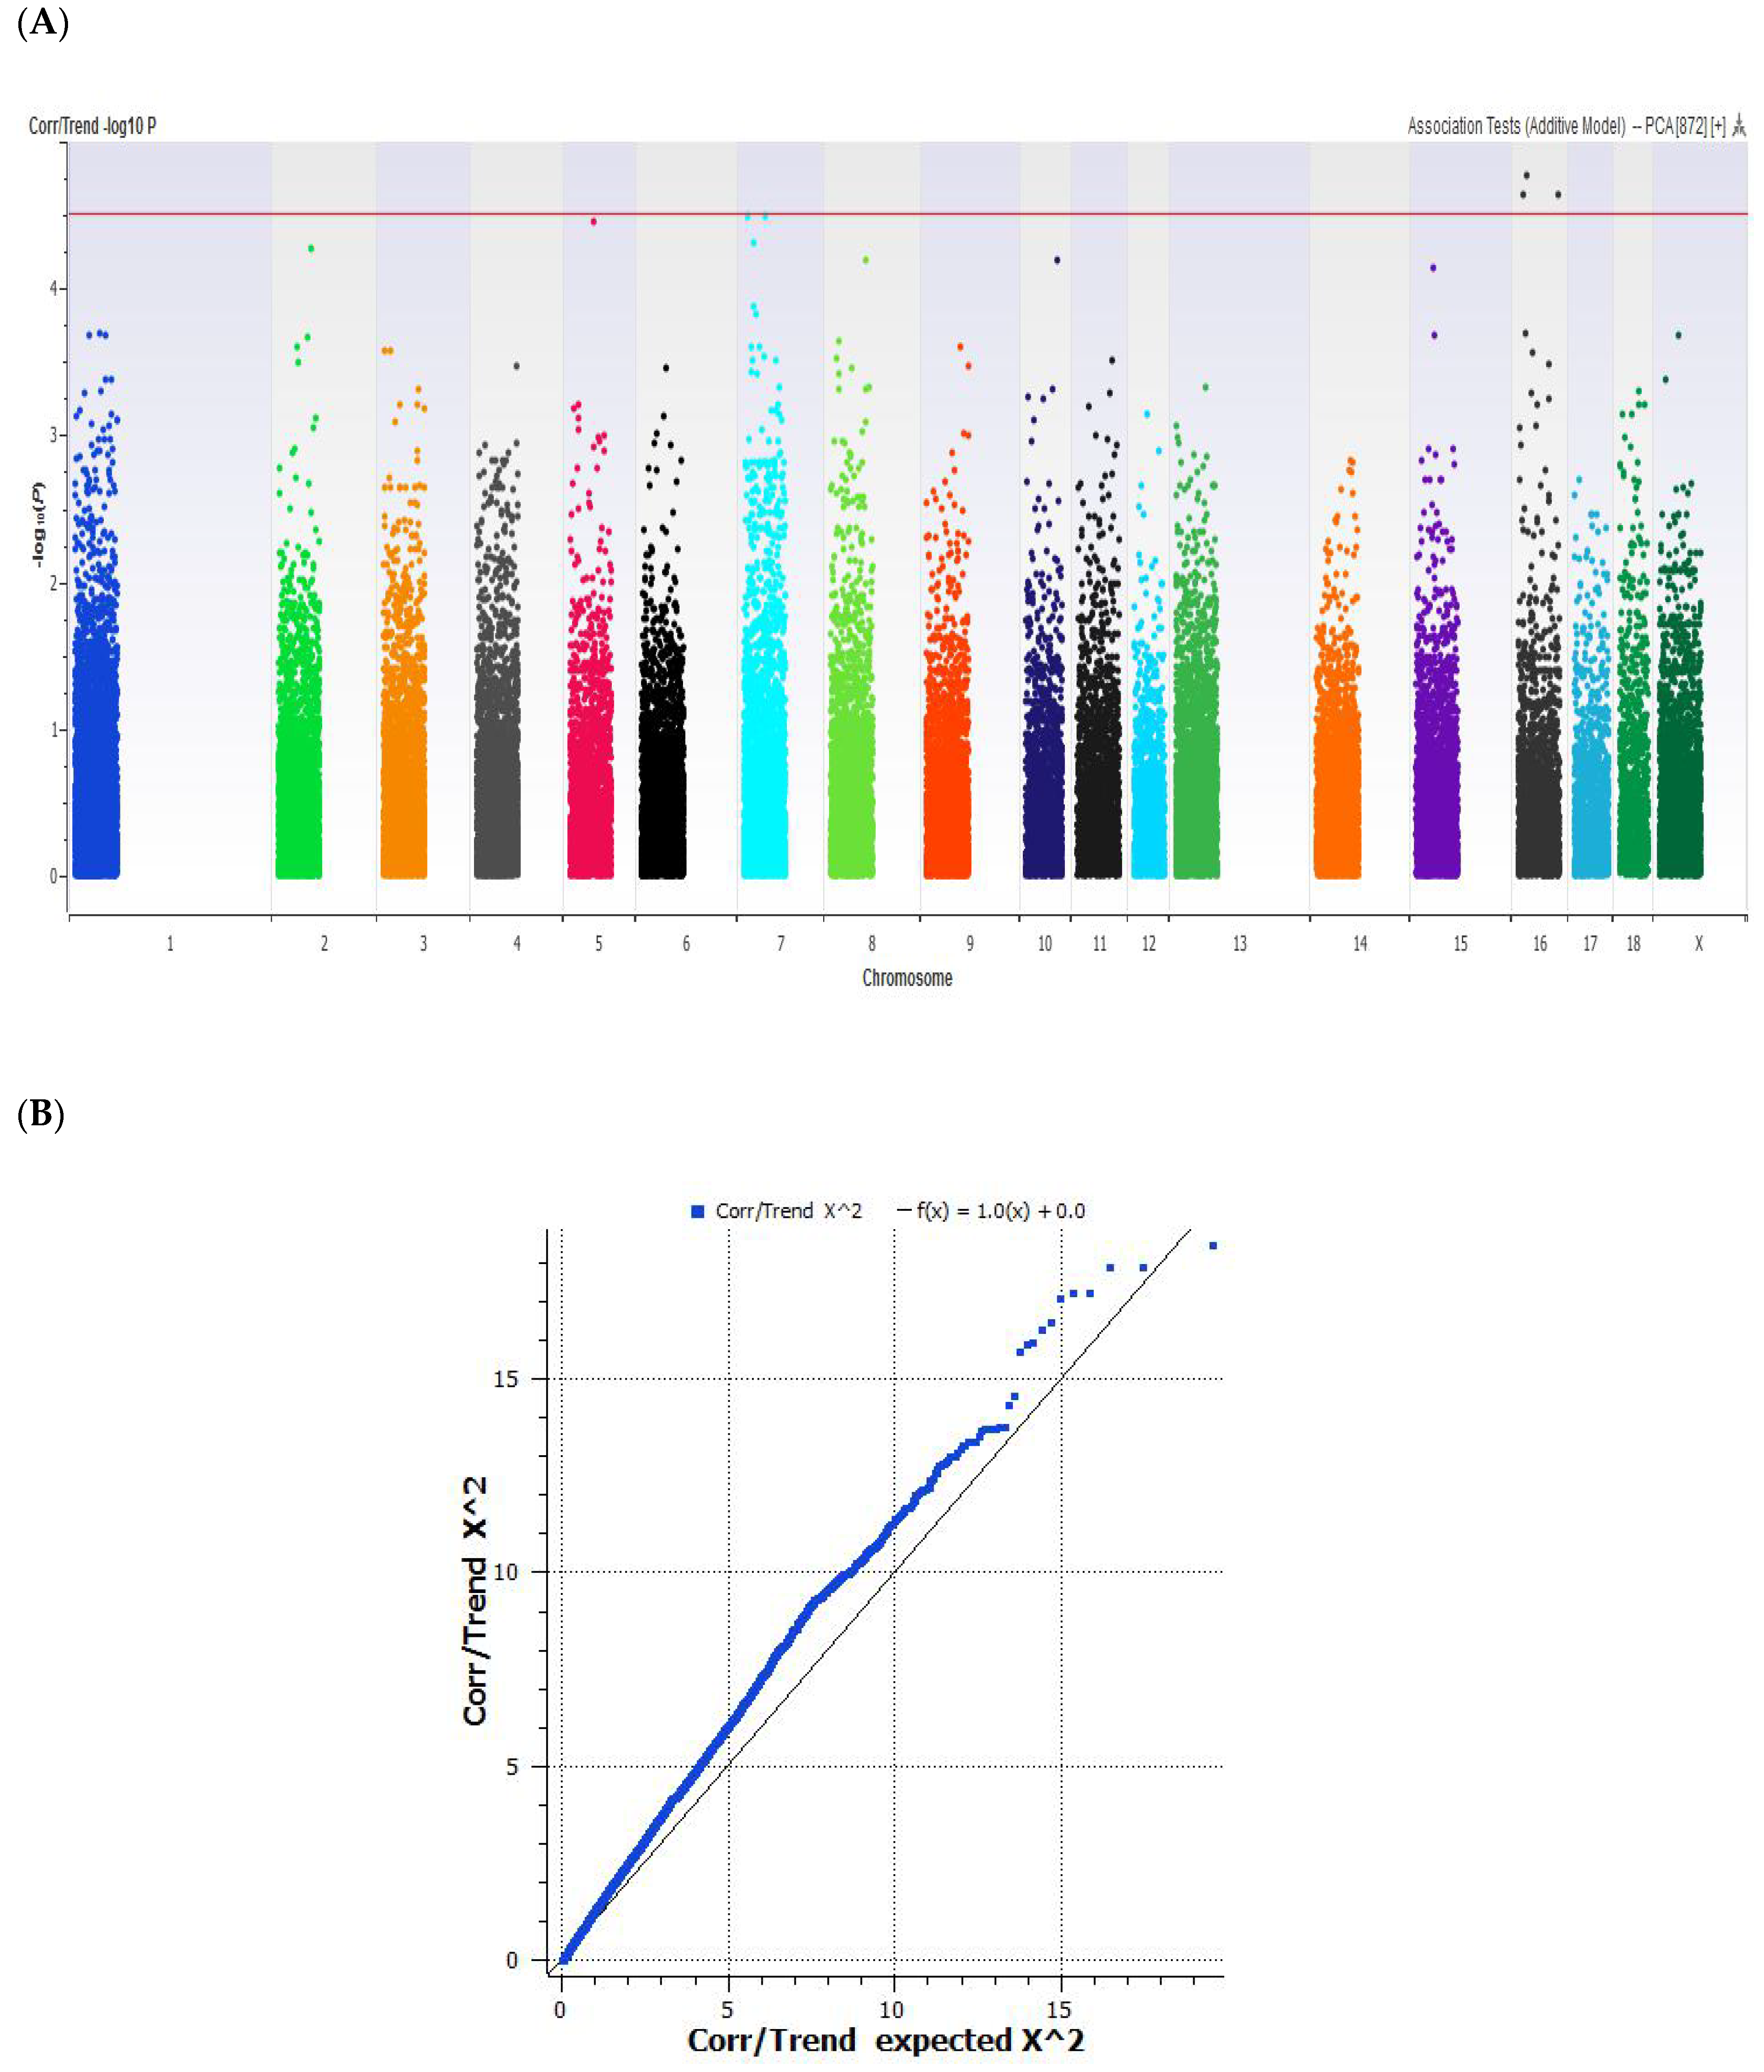
A GWAS analysis was performed on the intramuscular fat percentage (IMF %) of the longissimus dorsi muscle in pigs. Pig sires were selected from commercial breeding companies and represented the five major breeds available in Canada. The LD muscle was selected because it represents the major meat found in a typical pork loin chop cut. The IMF %, commonly referred to as marbling, was performed on the LD muscle. The average marbling IMF % across all breeds was 2.5 ± 0.7%. Breed samples were represented by Duroc (n = 208) with an average IMF of 2.9 ± 0.7%, Iberian (n = 169) with an average IMF of 2.8 ± 0.6%, Berkshire (n = 16) with an average IMF of 2.8 ± 0.8%, Lacombe (n = 207) with an average IMF of 2.0 ± 0.4%, and Pietrain (n = 16) with an average IMF of 2.0 ± 0.6%. In the five sired breeds, only the Duroc and Iberian sires had multiple F1 offspring that gave >4% IMF in the 616 samples (Figure 1). The ideal marbling has been determined to be >3%, according to past taste panel reviews [3,25]. We selected the top 10% and bottom 10% of IMF % from LD muscle of the five breeds, and selected 96 animals for further genotypic investigation. This was done to determine if certain genes could be associated with superior marbling in a meta-analysis of commercial swine. The genomic microarray investigation revealed a set of single-nucleotide polymorphic markers that significantly correlated with the appearance of IMF % (Figure 2). These SNPs were located on chromosomes 5, 7, and 16 in the meta-analysis of IMF % in the loin muscle of pigs. The markers were located near the porcine genes sarcospan (SSPN) (GenBank# AK349478) on chromosome 5, Rh-associated glycoprotein (RHAG) (GenBank# XM_003128440) on chromosome 7, and EGF-like fibronectin and laminin G domain protein (EGFLAM) (GenBank# AK396237) on chromosome 16, which also have their unique SNPs listed accordingly in the refSNP report (Table 1). Sarcospan is a member of the dystrophin-associated protein complex present in skeletal muscle, and has been linked to muscular dystrophy in humans [26]. The ammonia-specific transporter RHAG is a glycoprotein associated with the excretion of ions in exhausted muscle tissue [27]. EGFLAM has also been associated with congenital muscle dystrophies [28]. Taken together, they suggest a muscle abnormality or dystrophy [29] that may exist in heavily marbled loins.
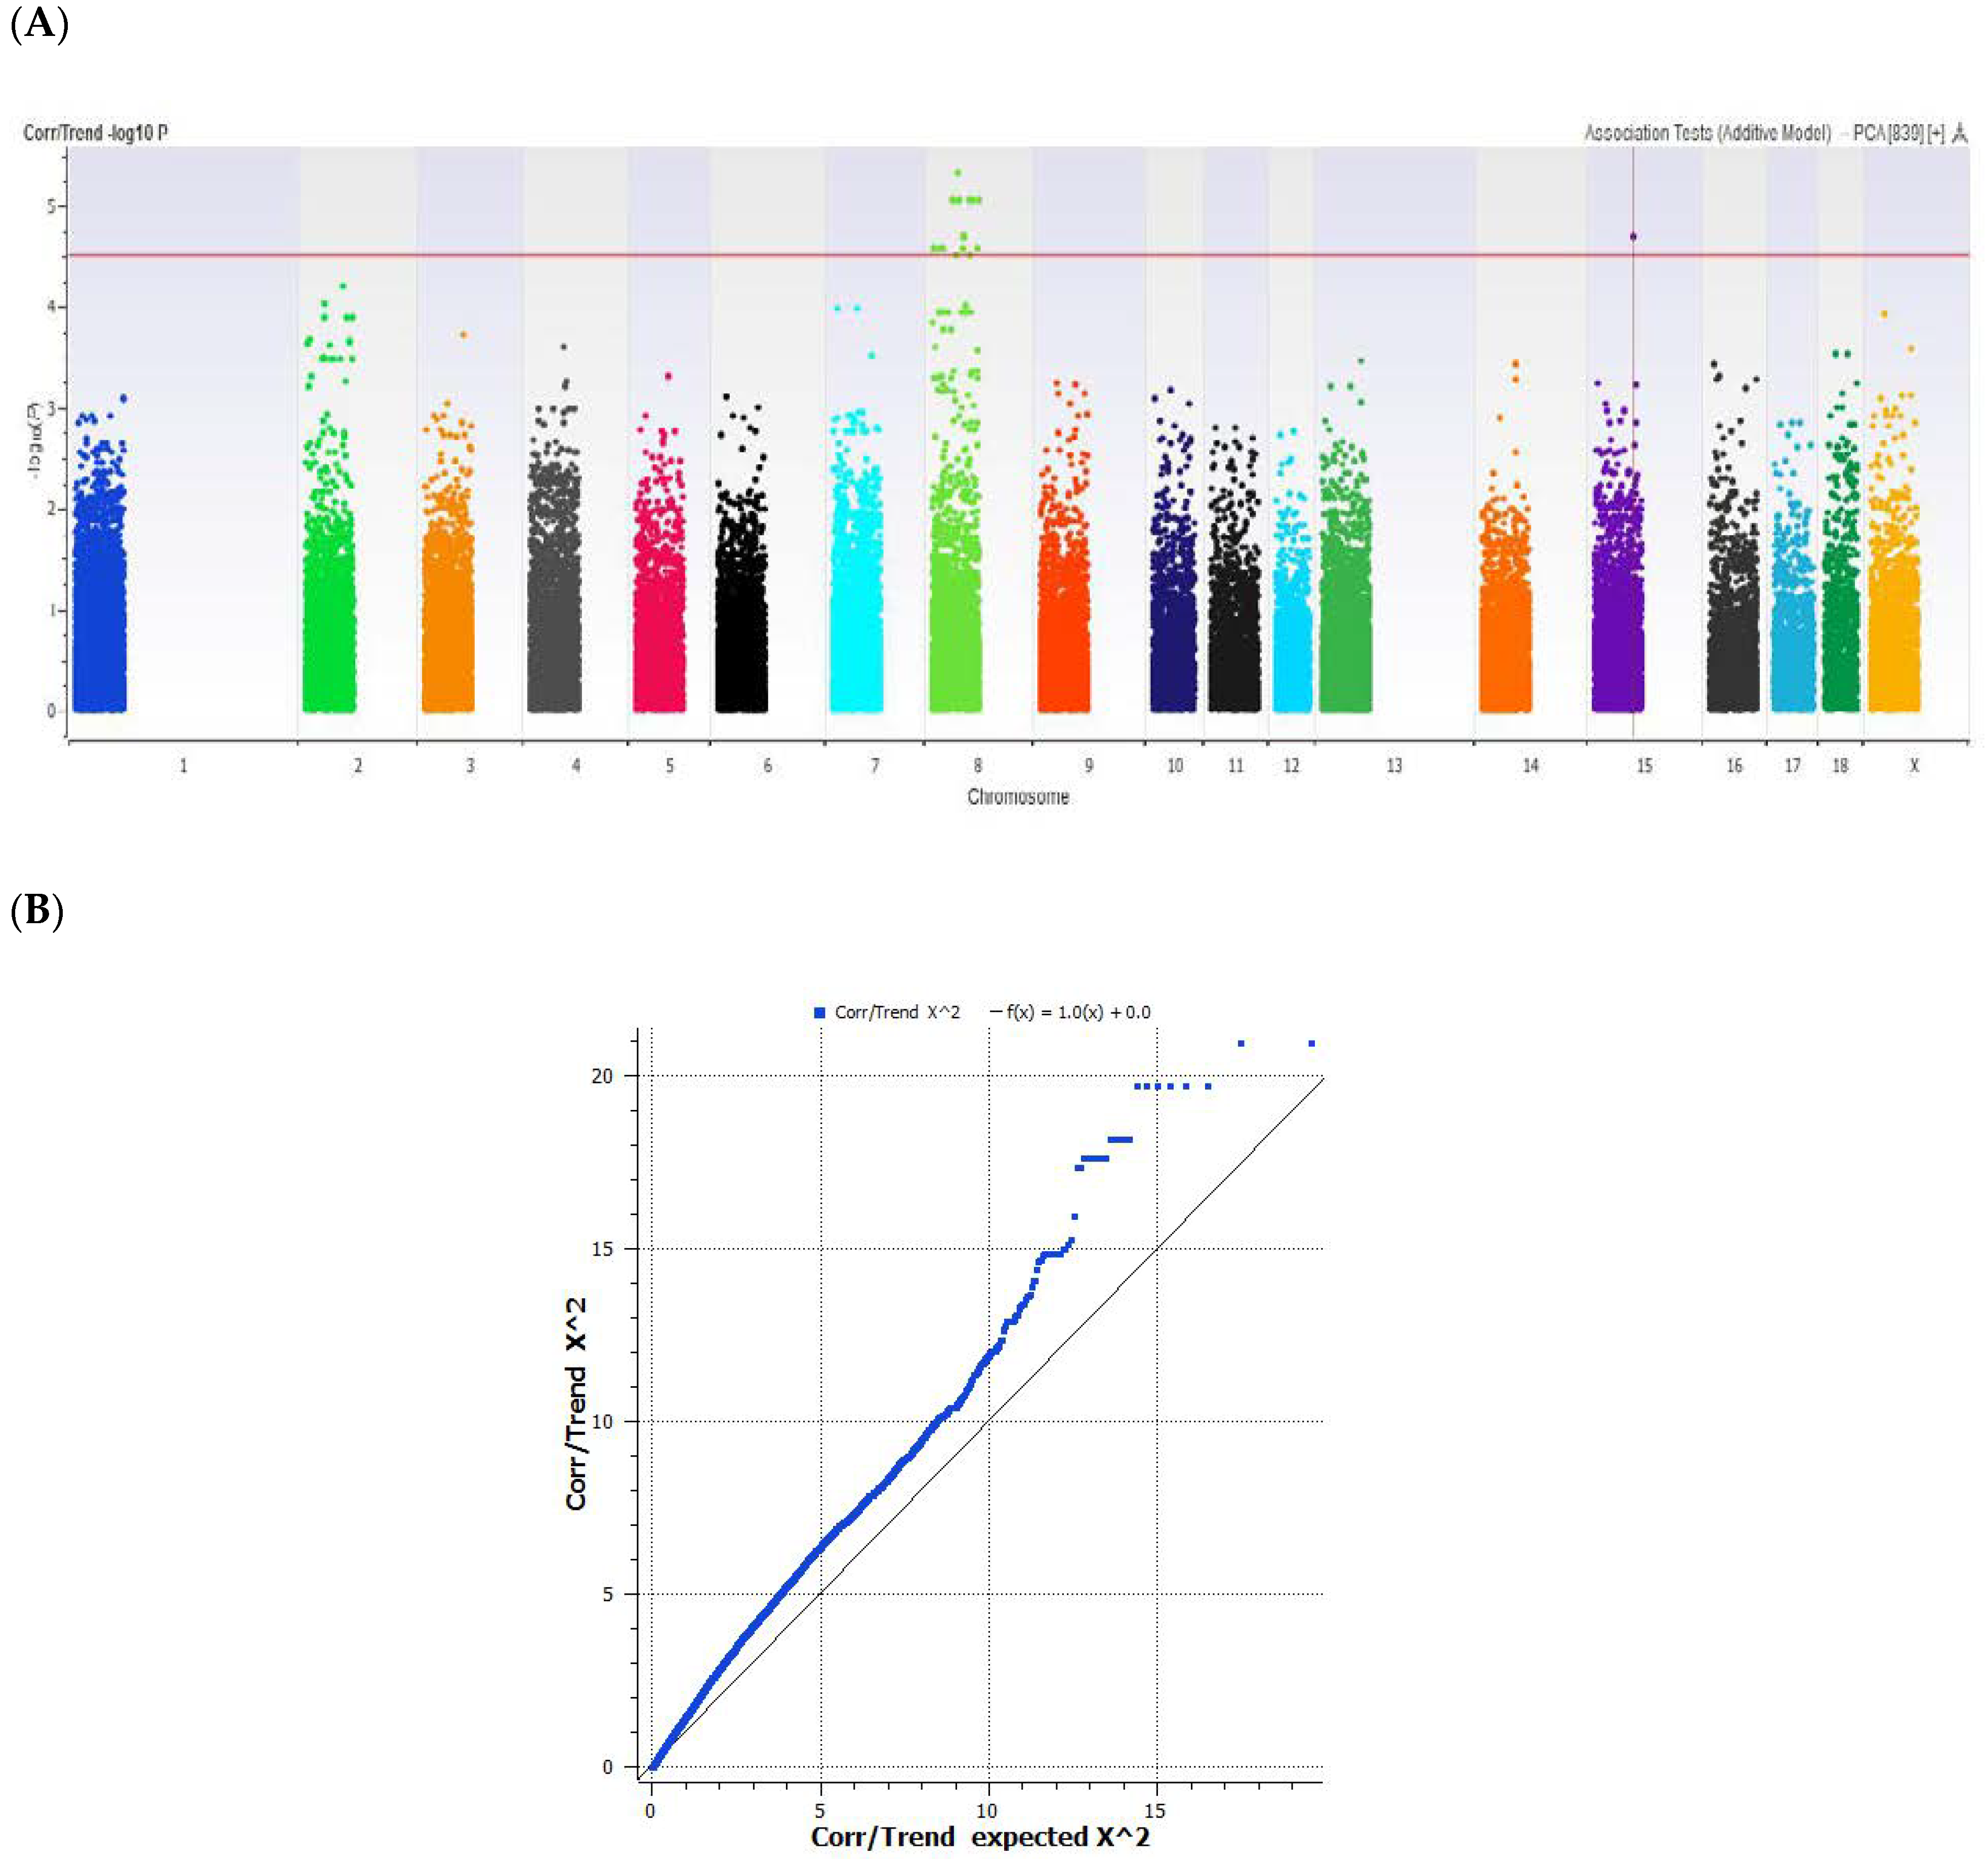
We also tried a GWAS analysis on only the Duroc-sired pigs, since many of their F1 offspring (n = 208) had IMF % values above 4%. The number of Duroc-genotyped animals (n = 40) was also enough to get a significant correlation between the IMF % and markers, as seen in the Manhattan plot and QQ plot data (Figure 3). A significant correlation with genetic markers was found to be unique in the Duroc-sired pigs, as opposed to the meta-analysis of all the pig breeds. The best markers were found on chromosomes 8 and 15, which were mapped close to the genes glycine receptor beta (GLRB) (GenBank# AJ715855) and prostate expressed FAM198B (GenBank# AK396463) on chromosome 8 and potassium inwardly-rectifying channel 1 (KCNJ3) (GenBank# AF540391) on chromosome 15 (Table 2). Mutations in the GLRB gene are a cause of the “startle” and hyperekplexia response in dogs’ muscles [30], the Prader–Willi obesity syndrome in humans [31], and myoclonus in bovines [32]. Polymorphism in the KCNJ3 potassium channels has been linked to salt absorption diseases in humans [33]. The SNPs of the KCNJ3 have been tested in pigs for ovulation rates, but no significant effect was found [34].
The unique map identification of separate gene loci in the Duroc subpopulation compared to the overall GWAS in IMF % study was partially due to the reduced phenotypic number of IMF % samples and to the fact that the different sires each had their own unique marbling genes. The Duroc subpopulation had individuals with high IMF % values approaching 5% to 7.1%, and this skewed the data comparison according to the QQ plot in Figure 3B. Part of this study was intended to see if a genetic line with extreme marbling existed in Canada, similar to the Bono Brown pigs reported in Japan [35]. The Bono Brown are a Duroc line that can achieve an average IMF of 6.3 ± 1.9% in barrows with a 2 cm average back fat, on a special diet. They were loosely mapped, by 125 microsatellite markers, to regions on chromosome SSC7 and SSC14. A similar study of Japanese Durocs [36] also identified SNP markers on chromosome 7, near the METTL3 gene, which had an effect on meat fat deposition. In our project, we had approximately 20 Canadian Duroc sires with IMF % values above 5.0%. Some the 80,000 markers used in our meta-analysis of IMF % GWAS were identified as uniquely significant towards QTLs on chromosome 7 (Figure 1) but not in the Duroc subpopulation study (Figure 2). It will be interesting to see if the Duroc sires with >5% IMF can be maintained as “extremely marbled” in Canada.
4. Conclusions
This research objective was part of larger goal to find a simple genetic test that would guarantee adequate marbling in pork. The use of GWAS and microarrays is a useful method to check genotypes, but it is still rather expensive and labour-intensive. There are many claims of superior marbling in various genetic lines, but these claims must be backed up with verifiable genetic tests that can be performed by a third party. The ideal form would be a simple DNA genetic test, similar to the RYR1 DNA test for swine halothane susceptibility [37] or the PRKAG3 DNA test [38] for the Rendement Napole (RN) defect in pork quality. Unfortunately, the genes that control marbling in pigs appear to be polygenic [15,36,39]. There are a number of publications that report of QTLs or expressed genes [40] that are linked to IMF % and marbling but the studies are dependent on the breed and the environmental effects of raising the animals [41,42]. The next step will be a correlation of the SNPs close to the loci, in the population we studied, using next generation sequencing.
On a final note, although the Duroc-sired pigs were among the best marbled, some offspring from Duroc(e.g., the Pietrain) gave poor marbling with IMF % of >2% but still gave good meat yield according to their carcass index based on subcutaneous back fat and loin eye muscle depth at the 13th rib site (data not shown). Under our current system, these Duroc pigs would have a high carcass value, but the meat would be considered of lower quality.
Author Contributions
Conceptualization, W.J.M.; Methodology, W.J.M.; Formal Analysis, J.C.R. and J.L.Z.; Data Curation, P.D., M.J., J.C.R. and J.L.Z.; Writing-Original Draft Preparation, W.J.M.
Acknowledgments
This work was supported by Agri-Food & Agriculture Canada under project grant J-0001307. We wish to thank the help of students Emily Fair and Hailey Plohman in the preparation of DNA and Sheri Nelson, Angela Gamble and Randy Wildeboer in the raising of the pigs. The IMF % assays were performed by Ivy Larsen supervised by Jennifer Aalhus and Manuel Juarez.
Conflicts of Interest
The funders had no role in the design of the study; in the collection, analyses, or interpretation of data; in the writing of the manuscript, and in the decision to publish the results.
References
- Cheng, W.; Cheng, J.; Sun, D.; Pu, H. Marbling analysis for evaluating meat quality: Methods and techniques. Compr. Rev. Food Sci. Food Saf. 2015, 14, 523–535. [Google Scholar] [CrossRef]
- Keeton, J.T.; Hafley, B.S.; Eddy, S.M.; Moser, C.R.; McManus, B.J.; Leffler, T.P. Rapid determination of moisture and fat in meats by microwave and nuclear magnetic resonance analysis—PVM 1:2003. J. AOAC Int. 2003, 86, 1193–1202. [Google Scholar] [PubMed]
- Eikelenboom, G.; Hoving-Bolink, A.H.; Van der Wal, P.G. The eating quality of pork. 2. The influence of intramuscular fat. Fleischwirtschaft 1996, 76, 517–518. [Google Scholar]
- Fortin, A.; Robertson, W.M.; Tong, A.K. The eating quality of Canadian pork and its relationship with intramuscular fat. Meat Sci. 2005, 69, 297–305. [Google Scholar] [CrossRef] [PubMed]
- Cameron, P.J.; Zembayashi, M.; Lunt, D.K.; Mitsuhashi, T.; Mitsumoto, M.; Ozawa, S.; Smith, S.B. Relationship between Japanese beef marbling standard and intramuscular lipid in the m. Longissimus thoracis of Japanese black and American wagyu cattle. Meat Sci. 1994, 38, 361–364. [Google Scholar] [CrossRef]
- USDA. United States standards for grades of pork carcasses. Fed. Regist. Docket 2017, 82, 48971–48976. [Google Scholar]
- Apple, J.K. Nutritional effects on pork quality in swine production. In National Swine Nutrition Guide; Factsheet PIG 12-02-02; U.S. Pork Center of Excellence: Clive, IA, USA, 2015. [Google Scholar]
- Schwab, C.R.; Baas, T.J.; Stalder, K.J. Results from six generations of selection for intramuscular fat in Duroc swine using real-time ultrasound. Ii. Genetic parameters and trends. J. Anim. Sci. 2010, 88, 69–79. [Google Scholar] [CrossRef] [PubMed]
- Solanes, F.X.; Reixach, J.; Tor, M.; Tibau, J.; Estany, J. Genetic correlations and expected response for intramuscular fat content in a Duroc pig line. Livest. Sci. 2009, 123, 63–69. [Google Scholar] [CrossRef]
- Eusebi, P.G.; Gonzalez-Prendes, R.; Quintanilla, R.; Tibau, J.; Cardoso, T.F.; Clop, A.; Amills, M. A genome-wide association analysis for carcass traits in a commercial Duroc pig population. Anim. Genet. 2017, 48, 466–469. [Google Scholar] [CrossRef] [PubMed]
- Sellier, P.; Maignel, L.; Bidanel, J.P. Genetic parameters for tissue and fatty acid composition of backfat, perirenal fat and muscle in large white and landrace pigs. Anim. Int. J. Anim. Biosci. 2010, 4, 497–504. [Google Scholar] [CrossRef] [PubMed]
- Knapp, P.; William, A.; Solkner, J. Genetic parameters for lean meat content and meat quality traits in different pig breeds. Livest. Prod. Sci. 1997, 52, 69–73. [Google Scholar] [CrossRef]
- Liu, X.; Xiong, X.; Yang, J.; Zhou, L.; Yang, B.; Ai, H.; Ma, H.; Xie, X.; Huang, Y.; Fang, S.; et al. Genome-wide association analyses for meat quality traits in Chinese Erhualian pigs and a western Duroc × (landrace × Yorkshire) commercial population. Genet. Sel. Evol. GSE 2015, 47, 44. [Google Scholar] [CrossRef] [PubMed]
- Verardo, L.L.; Sevon-Aimonen, M.L.; Serenius, T.; Hietakangas, V.; Uimari, P. Whole-genome association analysis of pork meat pH revealed three significant regions and several potential genes in Finnish Yorkshire pigs. BMC Genet. 2017, 18, 13. [Google Scholar] [CrossRef] [PubMed]
- Won, S.; Jung, J.; Park, E.; Kim, H. Identification of genes related to intramuscular fat content of pigs using genome-wide association study. Asian Australas. J. Anim. Sci. 2018, 31, 157–162. [Google Scholar] [CrossRef] [PubMed] [Green Version]
- NRC. National Research Council: Nutrient Requirements of Swine; National Academy of Sciences: Washington, DC, USA, 2012; Volume 11, p. 405.
- Canadian Council on Animal Care (CCAC). The CCAC Guideline on: The Care and Use of Farm Animals in Research, Teaching and Testing; CCAC: Ottawa, ON, Canada, 2009; p. 168. [Google Scholar]
- NPPC. National Pork Producers Council: Nutrient Requirements of Swine, 10th ed.; National Academy of Sciences: Washington, DC, USA, 1998. [Google Scholar]
- Juarez, M.; Dugan, M.E.R.; Lopez-Campos, O.; Prieto, N.; Uttaro, B.; Gariepy, C.; Aalhus, J.L. Relative contribution of breed, slaughter weight, sex, and diet to the fatty acid composition of differentiated pork. Can. J. Anim. Sci. 2017, 97, 395–405. [Google Scholar] [CrossRef]
- Faucitano, L.; Rivest, J.; Daigle, J.P.; Levesque, J.; Gariepy, C. Distribution of intramuscular fat content and marbling within the longissimus muscle of pigs. Can. J. Anim. Sci. 2004, 84, 57–61. [Google Scholar] [CrossRef] [Green Version]
- The Pig Genome SusScr11 Assembly. Available online: https://genome.ucsc.edu/ (accessed on 20 February 2018).
- Kent, W.J.; Sugnet, C.W.; Furey, T.S.; Roskin, K.M.; Pringle, T.H.; Zahler, A.M.; Haussler, D. The human genome browser at UCSC. Genet. Res. 2002, 12, 996–1006. [Google Scholar] [CrossRef] [PubMed]
- The Sus Scrofa 11.1/SusScr11 Map. Available online: https://genome.ucsc.edu/ (accessed on 20 November 2017).
- NCBI Data Banks. Available online: https://www.ncbi.nlm.nih.gov (accessed on 20 January 2018).
- Brewer, M.S.; Zhu, L.G.; McKeith, F.K. Marbling effects on quality characteristics of pork loin chops: Consumer purchase intent, visual and sensory characteristics. Meat Sci. 2001, 59, 153–163. [Google Scholar] [CrossRef]
- O’Brien, K.F.; Engle, E.C.; Kunkel, L.M. Analysis of human sarcospan as a candidate gene for CFEOM1. BMC Genet. 2001, 2, 3. [Google Scholar]
- Takeda, K.; Takemasa, T. Expression of ammonia transporters RHBG and RHCG in mouse skeletal muscle and the effect of 6-week training on these proteins. Physiol. Rep. 2015, 3, e12596. [Google Scholar] [CrossRef] [PubMed]
- Bertini, E.; D’Amico, A.; Gualandi, F.; Petrini, S. Congenital muscular dystrophies: A brief review. Semin. Pediatr. Neurol. 2011, 18, 277–288. [Google Scholar] [CrossRef] [PubMed]
- Rahimov, F.; Kunkel, L.M. The cell biology of disease: Cellular and molecular mechanisms underlying muscular dystrophy. J. Cell Biol. 2013, 201, 499–510. [Google Scholar] [CrossRef] [PubMed] [Green Version]
- James, V.M.; Bode, A.; Chung, S.K.; Gill, J.L.; Nielsen, M.; Cowan, F.M.; Vujic, M.; Thomas, R.H.; Rees, M.I.; Harvey, K.; et al. Novel missense mutations in the glycine receptor beta subunit gene (GLRB) in startle disease. Neurobiol. Dis. 2013, 52, 137–149. [Google Scholar] [CrossRef] [PubMed] [Green Version]
- Bittel, D.C.; Kibiryeva, N.; McNulty, S.G.; Driscoll, D.J.; Butler, M.G.; White, R.A. Whole genome microarray analysis of gene expression in an imprinting center deletion mouse model of prader-willi syndrome. Am. J. Med. Genet. 2007, 143A, 422–429. [Google Scholar] [CrossRef] [PubMed]
- Pierce, K.D.; Handford, C.A.; Morris, R.; Vafa, B.; Dennis, J.A.; Healy, P.J.; Schofield, P.R. A nonsense mutation in the alpha1 subunit of the inhibitory glycine receptor associated with bovine myoclonus. Mol. Cell. Neurosci. 2001, 17, 354–363. [Google Scholar] [CrossRef] [PubMed]
- Pattnaik, B.R.; Asuma, M.P.; Spott, R.; Pillers, D.A. Genetic defects in the hotspot of inwardly rectifying k(+) (kir) channels and their metabolic consequences: A review. Mol. Genet. Metab. 2012, 105, 64–72. [Google Scholar] [CrossRef] [PubMed]
- Du, H.; Chen, J.; Cui, J.; Wang, X.; Zhang, X. Polymorphisms on ssc15q21–q26 containing QTL for reproduction in swine and its association with litter size. Genet. Mol. Biol. 2009, 32, 69–74. [Google Scholar] [CrossRef] [PubMed]
- Mikawa, S.; Yoshioka, G. Development of Marbling Pork with Marker-Assisted Selection. Available online: http://www.angrin.tlri.gov.tw/%5C/English/2014Swine/p18-27.pdf (accessed on 20 January 2018).
- Sato, S.; Uemoto, Y.; Kikuchi, T.; Egawa, S.; Kohira, K.; Saito, T.; Sakuma, H.; Miyashita, S.; Arata, S.; Kojima, T.; et al. Snp- and haplotype-based genome-wide association studies for growth, carcass, and meat quality traits in a duroc multigenerational population. BMC Genet. 2016, 17, 60. [Google Scholar] [CrossRef] [PubMed]
- Brenig, B.; Brem, G. Genomic organization and analysis of the 5’ end of the porcine ryanodine receptor gene (RYR1). FEBS Lett. 1992, 298, 277–279. [Google Scholar] [CrossRef]
- Meadus, W.J.; MacInnis, R.; Dugan, M.E.R.; Aalhus, J.L. A PCR-RFLP method to identify the gene in retailed pork chops. Can. J. Anim. Sci. 2002, 82, 449–451. [Google Scholar] [CrossRef]
- Hausman, G.J.; Basu, U.; Du, M.; Fernyhough-Culver, M.; Dodson, M.V. Intermuscular and intramuscular adipose tissues: Bad vs. good adipose tissues. Adipocyte 2014, 3, 242–255. [Google Scholar] [CrossRef] [PubMed] [Green Version]
- Puig-Oliveras, A.; Revilla, M.; Castello, A.; Fernandez, A.I.; Folch, J.M.; Ballester, M. Expression-based GWAS identifies variants, gene interactions and key regulators affecting intramuscular fatty acid content and composition in porcine meat. Sci. Rep. 2016, 6, 31803. [Google Scholar] [CrossRef] [PubMed] [Green Version]
- Hu, Z.L.; Park, C.A.; Reecy, J.M. Developmental progress and current status of the animal QTLDB. Nucleic Acids Res. 2016, 44, D827–D833. [Google Scholar] [CrossRef] [PubMed]
- This Pig Quantitative Trait Locus (QTL) Database. Available online: https://www.animalgenome.org/cgi-bin/QTLdb/SS/index (accessed on 20 January 2018).
Figure 1.
The average intramuscular fat percentage (IMF %) in the longissimus dorsi muscle of the five cross breeds. The IMF % was calculated on the lean muscle using an NMR analyser. The overall average IMF mean percentage (µ ± std dev) is represented by the blue dot within each breed sire subgroup: Duroc 2.9 ± 0.7%, Iberian 2.8 ± 0.6%, Lacombe 2.0 ± 0.4%, Berkshire 2.4 ± 0.8%, and Pietrain 2.0 ± 0.6%.

Figure 2.
(A) Manhattan plot and (B) QQ plot of P-values of the SNP-based association meta-analysis against the intramuscular fat content percentage (IMF %) in pigs. The red line indicates the threshold for genome-wide significance (P < 4.5 × 10⁻⁸) for 68,529 SNPs adjusted for sex and a minor allele frequency (MAF) of <0.01. The QQ plot shows that the samples where normally distributed according to their IMF % value relative to the SNPs scored in their genotype.

Figure 3.
(A) Manhattan and (B) QQ plot of the GWAS analysis of IMF % in Duroc-sired pigs (n = 40). The red line indicates the threshold for genome-wide significance (P < 4.5 × 10⁻⁸) for 68,529 SNPs adjusted for sex and MAF < 0.01. The QQ plot shows a distribution of expected IMF % values that are skewed when their SNPs are correlated on the extreme end of the data for the Duroc samples.

Table 1.
Location of significant markers and the nearest genes, identified by meta-analysis of the genome-wide association study (GWAS) related to the IMF % in commercial pig sires.
Table 1.
Location of significant markers and the nearest genes, identified by meta-analysis of the genome-wide association study (GWAS) related to the IMF % in commercial pig sires.
| Chromosome | Position | Marker | Base | Nearest Gene | Gene | refSNP | SNP |
|---|---|---|---|---|---|---|---|
| 5 | 47606484 | WU_10.2_5_64313075 | A/G | AK349478 | SSPN | rs322211582 | 8 |
| 7 | 16758370 | ALGA0044073 | A/G | XR_002346095 | ncRNA | n/a | n/a |
| 7 | 43707458 | ASGA0035629 | T/C | XM_003128440 | RhGlycoprotein | rs698040624 | 25 |
| 16 | 18742425 | ALGA0116333 | T/C | AK343791 | Alveolar macrophage | n/a | n/a |
| 16 | 23611505 | ALGA0092214 | T/C | AK396237 | EGFLAM | rs690289509 | 54 |
| 16 | 73722502 | ASGA0097252 | A/G | AK240470 | Uterus | n/a | n/a |
The chromosome and the position of the markers were generated by Manhattan plot, and the nearest gene with the GenBank number and their reference single-nucleotide polymorphism (SNP) cluster report (refSNP) were extrapolated by mapping them onto the Sus scrofa /susScr map 11.1. The refSNP was chosen out of the existing SNP databank based on the position from the multiple targets of (c) individual SNPs, when available or n/a; not available.
Table 2.
Location of significant markers and nearest genes for the Duroc GWAS related to the IMF %.
| Position | Marker | Base | Nearest Gene | Gene | refSNP | SNP | |
|---|---|---|---|---|---|---|---|
| 8 | 46622432 | H3GA0025835 | A/G | AJ715855 | GLRB | n/a | n/a |
| 8 | 46677501 | MARC0004983 | T/C | AK396463 | FAM198B | rs705641356 | 24 |
| 15 | 62778504 | CASI0009038 | A/C | AF540391 | KCNJ3 | rs711844269 | 6 |
The chromosome and the position of the markers were generated by the Manhattan plot, and the nearest gene with the GenBank number and their reference SNP cluster report (refSNP) were extrapolated by mapping them onto the Sus scrofa /susScr map 11.1. The refSNP was chosen out of the existing SNP databank based on the position from the multiple targets of (c) individual SNPs, when available or n/a; not available.
© 2018 by the authors. Licensee MDPI, Basel, Switzerland. This article is an open access article distributed under the terms and conditions of the Creative Commons Attribution (CC BY) license (http://creativecommons.org/licenses/by/4.0/).
Share and Cite
MDPI and ACS Style
Meadus, W.J.; Duff, P.; Juarez, M.; Roberts, J.C.; Zantinge, J.L. Identification of Marbling Gene Loci in Commercial Pigs in Canadian Herds. Agriculture 2018, 8, 122. https://doi.org/10.3390/agriculture8080122
AMA Style
Meadus WJ, Duff P, Juarez M, Roberts JC, Zantinge JL. Identification of Marbling Gene Loci in Commercial Pigs in Canadian Herds. Agriculture. 2018; 8(8):122. https://doi.org/10.3390/agriculture8080122
Chicago/Turabian StyleMeadus, William Jon, Pascale Duff, Manuel Juarez, Jordan C. Roberts, and Jennifer L. Zantinge. 2018. "Identification of Marbling Gene Loci in Commercial Pigs in Canadian Herds" Agriculture 8, no. 8: 122. https://doi.org/10.3390/agriculture8080122
Note that from the first issue of 2016, this journal uses article numbers instead of page numbers. See further details here.