Pesticide Use in Northern Ireland’s Arable Crops from 1992–2016 and Implications for Future Policy Development


Sustainable Agri-Food Sciences Division, Agri-Food and Biosciences Institute, 18a Newforge Lane, Belfast BT9 5PX, UK
*
Author to whom correspondence should be addressed.
Agriculture 2018, 8(8), 123; https://doi.org/10.3390/agriculture8080123
Submission received: 4 July 2018
/
Revised: 30 July 2018
/
Accepted: 31 July 2018
/
Published: 8 August 2018
(This article belongs to the Special Issue Pesticides in Agriculture System)
Abstract
:Since the 1960s, the objective for the United Kingdom (UK) government policy and legislation on crop protection practices has been to minimise the impact of pesticide use in agriculture and horticulture to the wider environment. Subsequent European Union (EU) policy and legislation have also targeted this objective through a demanding approvals process, competency tests for users, maximum residue limits, regular post-registration monitoring and the promotion of integrated pest and disease management techniques. However, none of this substantive regulation refers to target reduction levels for pesticide use. Since 1992, the number of arable farms in Northern Ireland has decreased by 61% with a consequent reduction of 34% in the area of arable crops grown. Despite this reduction in area of arable crops grown, the area treated by the major pesticide groups increased by 49% due to intensification, but the weight of major pesticides applied to arable crops decreased by 37%. However, the intensity of application measured by the total quantity of all pesticides applied to the basic area of arable crops treated remained relatively constant at approximately 3.2 kg/ha. Pesticide usage trends and reduction policies in other geographic regions are also discussed for comparative purposes.
1. Introduction
In response to concerns regarding the widespread use of organochlorine insecticides during the late 1950′s and early 1960′s, regular monitoring of pesticide usage, within agriculture and horticulture, in England and Wales was initiated in 1966 by the Ministry of Agriculture Fisheries and Food [1]. Pesticide usage monitoring in Scotland began in 1974 with a survey of arable crops conducted by the Department of Agriculture and Fisheries for Scotland [2]. Following the implementation of the Food and Environment Act 1985 and the Control of Pesticides Regulations 1986 (amended 1997), which provided a statutory obligation for post-registration monitoring of pesticide use within the United Kingdom, Northern Ireland initiated pesticide usage monitoring within its region with a survey of grassland in 1989 [3]. Subsequently, the survey groups within the United Kingdom have operated formally within the committee structure of the Advisory Committee on Pesticides, referred to as the UK Expert Committee on Pesticides, to provide both regional and overall UK pesticide usage data. A cyclical programme of surveys is agreed and approved through a working party of the Chemicals Regulation Division of the Health and Safety Executive.
In Europe, Directive 2009/128/EC superseded previous pesticide legislation with the objective of establishing a framework for Community action to achieve the sustainable use of pesticides. In conjunction with Council Regulation 1107/2009/EC, concerning the introduction of plant protection products on the market, this legislation aims at reducing the risk linked to the use of pesticides by improving the quality and efficacy of pesticide application equipment, ensuring better training and education of users and developing integrated pest management schemes. In addition, regulations associated with water quality (Water Framework Directive 2000/60/EC and Drinking Water Directive 1998/83/EC may also have the potential to restrict pesticide use immediately, as concerns regarding public health and economic costs associated with removal of pesticides from water increase [4]. Council Regulation 1185/2009 provides rules for collection of pesticide usage statistics, but the level at which this is undertaken among Member States remains variable.
Within Northern Ireland, pesticide usage monitoring is undertaken by the Agri-Food and Biosciences Institute on behalf of the Department of Agriculture, Environment and Rural Affairs (DAERA). These annual surveys form an integral part of the government’s pesticide safety control arrangements, in providing quantitative and qualitative data on the usage of pesticides in agriculture, horticulture, food storage and associated industries. They provide the only post-registration monitor of current trends in usage of commercially available pesticides approved for use. Variation in geographical distribution of pesticide usage requires monitoring to be conducted at a regional level to facilitate subsequent environmental studies. In Northern Ireland, arable crops account for approximately 4% of agricultural land use, much less than other UK regions, but nevertheless, 61% of total annual pesticide usage. In addition, since 1992, the number of arable farms in Northern Ireland has declined by 61%, while the area of arable crops grown has also reduced by 34%. Primarily, this decline has occurred in the smaller farm size groups in which farmers are known to make fewer pesticide applications to arable crops [5]. Nonetheless, as the principal component of total pesticide usage on agricultural and horticultural crops in Northern Ireland, arable crops are monitored biennially. Trends in the use of foliar and seed treatment applications of the major pesticide groups (fungicides, herbicides and insecticides) within the Northern Ireland arable crop industry between 1992 and 2016 are examined and discussed.
2. Materials and Methods
The rationale for and methods applied to pesticide usage monitoring in the United Kingdom have been described by Thomas [1,6]. These methods have also formed the guidelines during the preparation for the adoption of the EC Regulation 1185/2009 concerning statistics on pesticides [7].
Within Northern Ireland, pesticide usage surveys of arable crops were conducted biennially from 1992 to 2016. However, due to restrictions imposed by the local foot and mouth outbreak of February 2001 and the inability to complete farm visits, the sample size of the 2000 survey was reduced by over one third. Consequently, the data from the 2000 survey of arable crops have not been included in the analyses. For each arable survey, the sample of holdings to be surveyed was selected from each of the six counties on the basis of the total area of arable crops grown, using data from the Northern Ireland Agricultural Census, annually published in June and also single farm payment data (unpublished). However, due to sampling procedures and the distribution of arable crops in Northern Ireland, no holdings were visited in County Fermanagh. The arable crops grown comprised the following: barley; wheat; oats; spring and winter oilseed rape; peas, beans and potatoes.
For each survey, the sample was stratified into six size groups, according to the total area of cereal crops grown in each region. Holdings were selected at random within each of the size groups, the number of holdings being proportional to the total area of arable crops grown. In addition, ware and seed potato crops were selected from their own defined size-groups province wide. A typical sampling frame for arable farms is illustrated in Table 1.
The purpose of the survey was explained to the occupiers of selected holdings in preliminary correspondence. Growers within the selected sample of holdings were contacted during November to April. Most data were collected by personal interview and the remainder by telephone interview. The data collected included: the area of crops grown; area treated; target crop; pesticides used and number of treatments applied. In addition to quantitative data, qualitative data including the growers’ reasons for pesticide use were also included but may not always seem appropriate as the growers may have perceived treatment effects. Holdings selected in the original sample that were unable to provide data were replaced with those from the same county and size group held on a reserve list. During analysis, the sample data were raised (extrapolated) to the national crop area using raising factors calculated from the ratio of the number of farms sampled (B) to the number of farms in the population (A) within each region and size group (Table 1). A further adjustment factor corrected the data in accordance with the areas of arable crops published in the Northern Ireland Agricultural Census [8]. Definitions for terms used in the presentation of the results are provided in Table 2.
3. Results
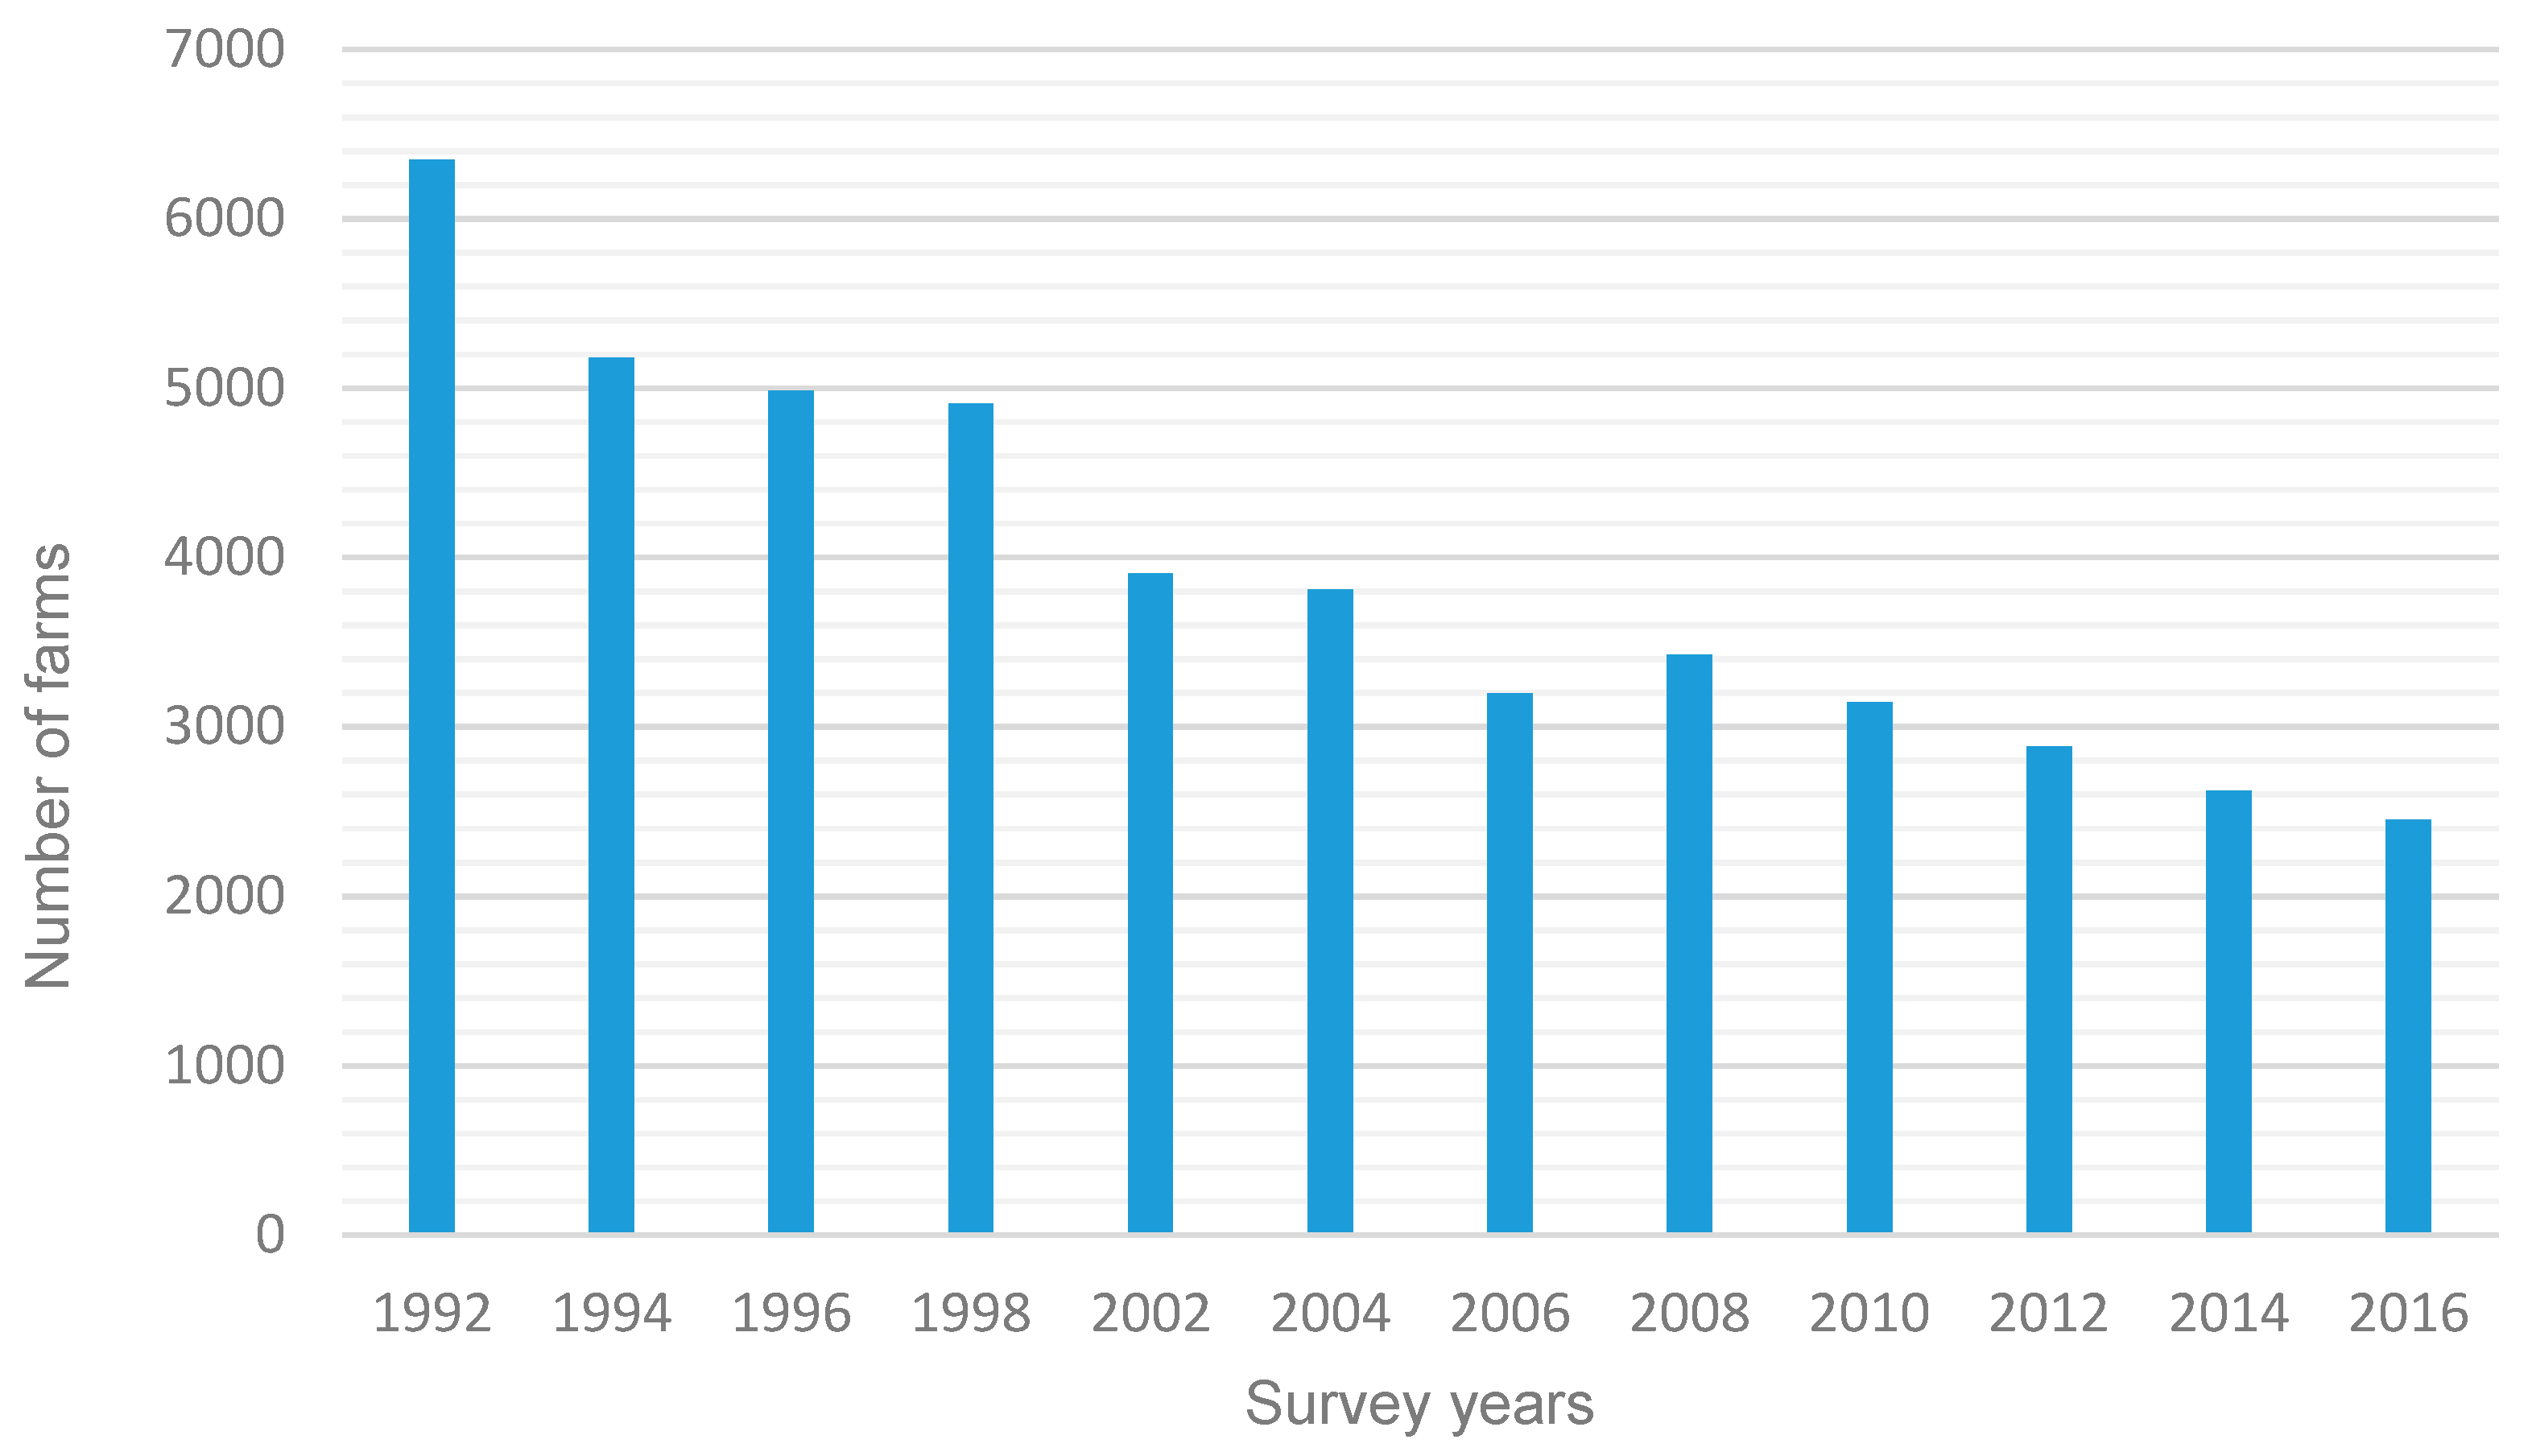
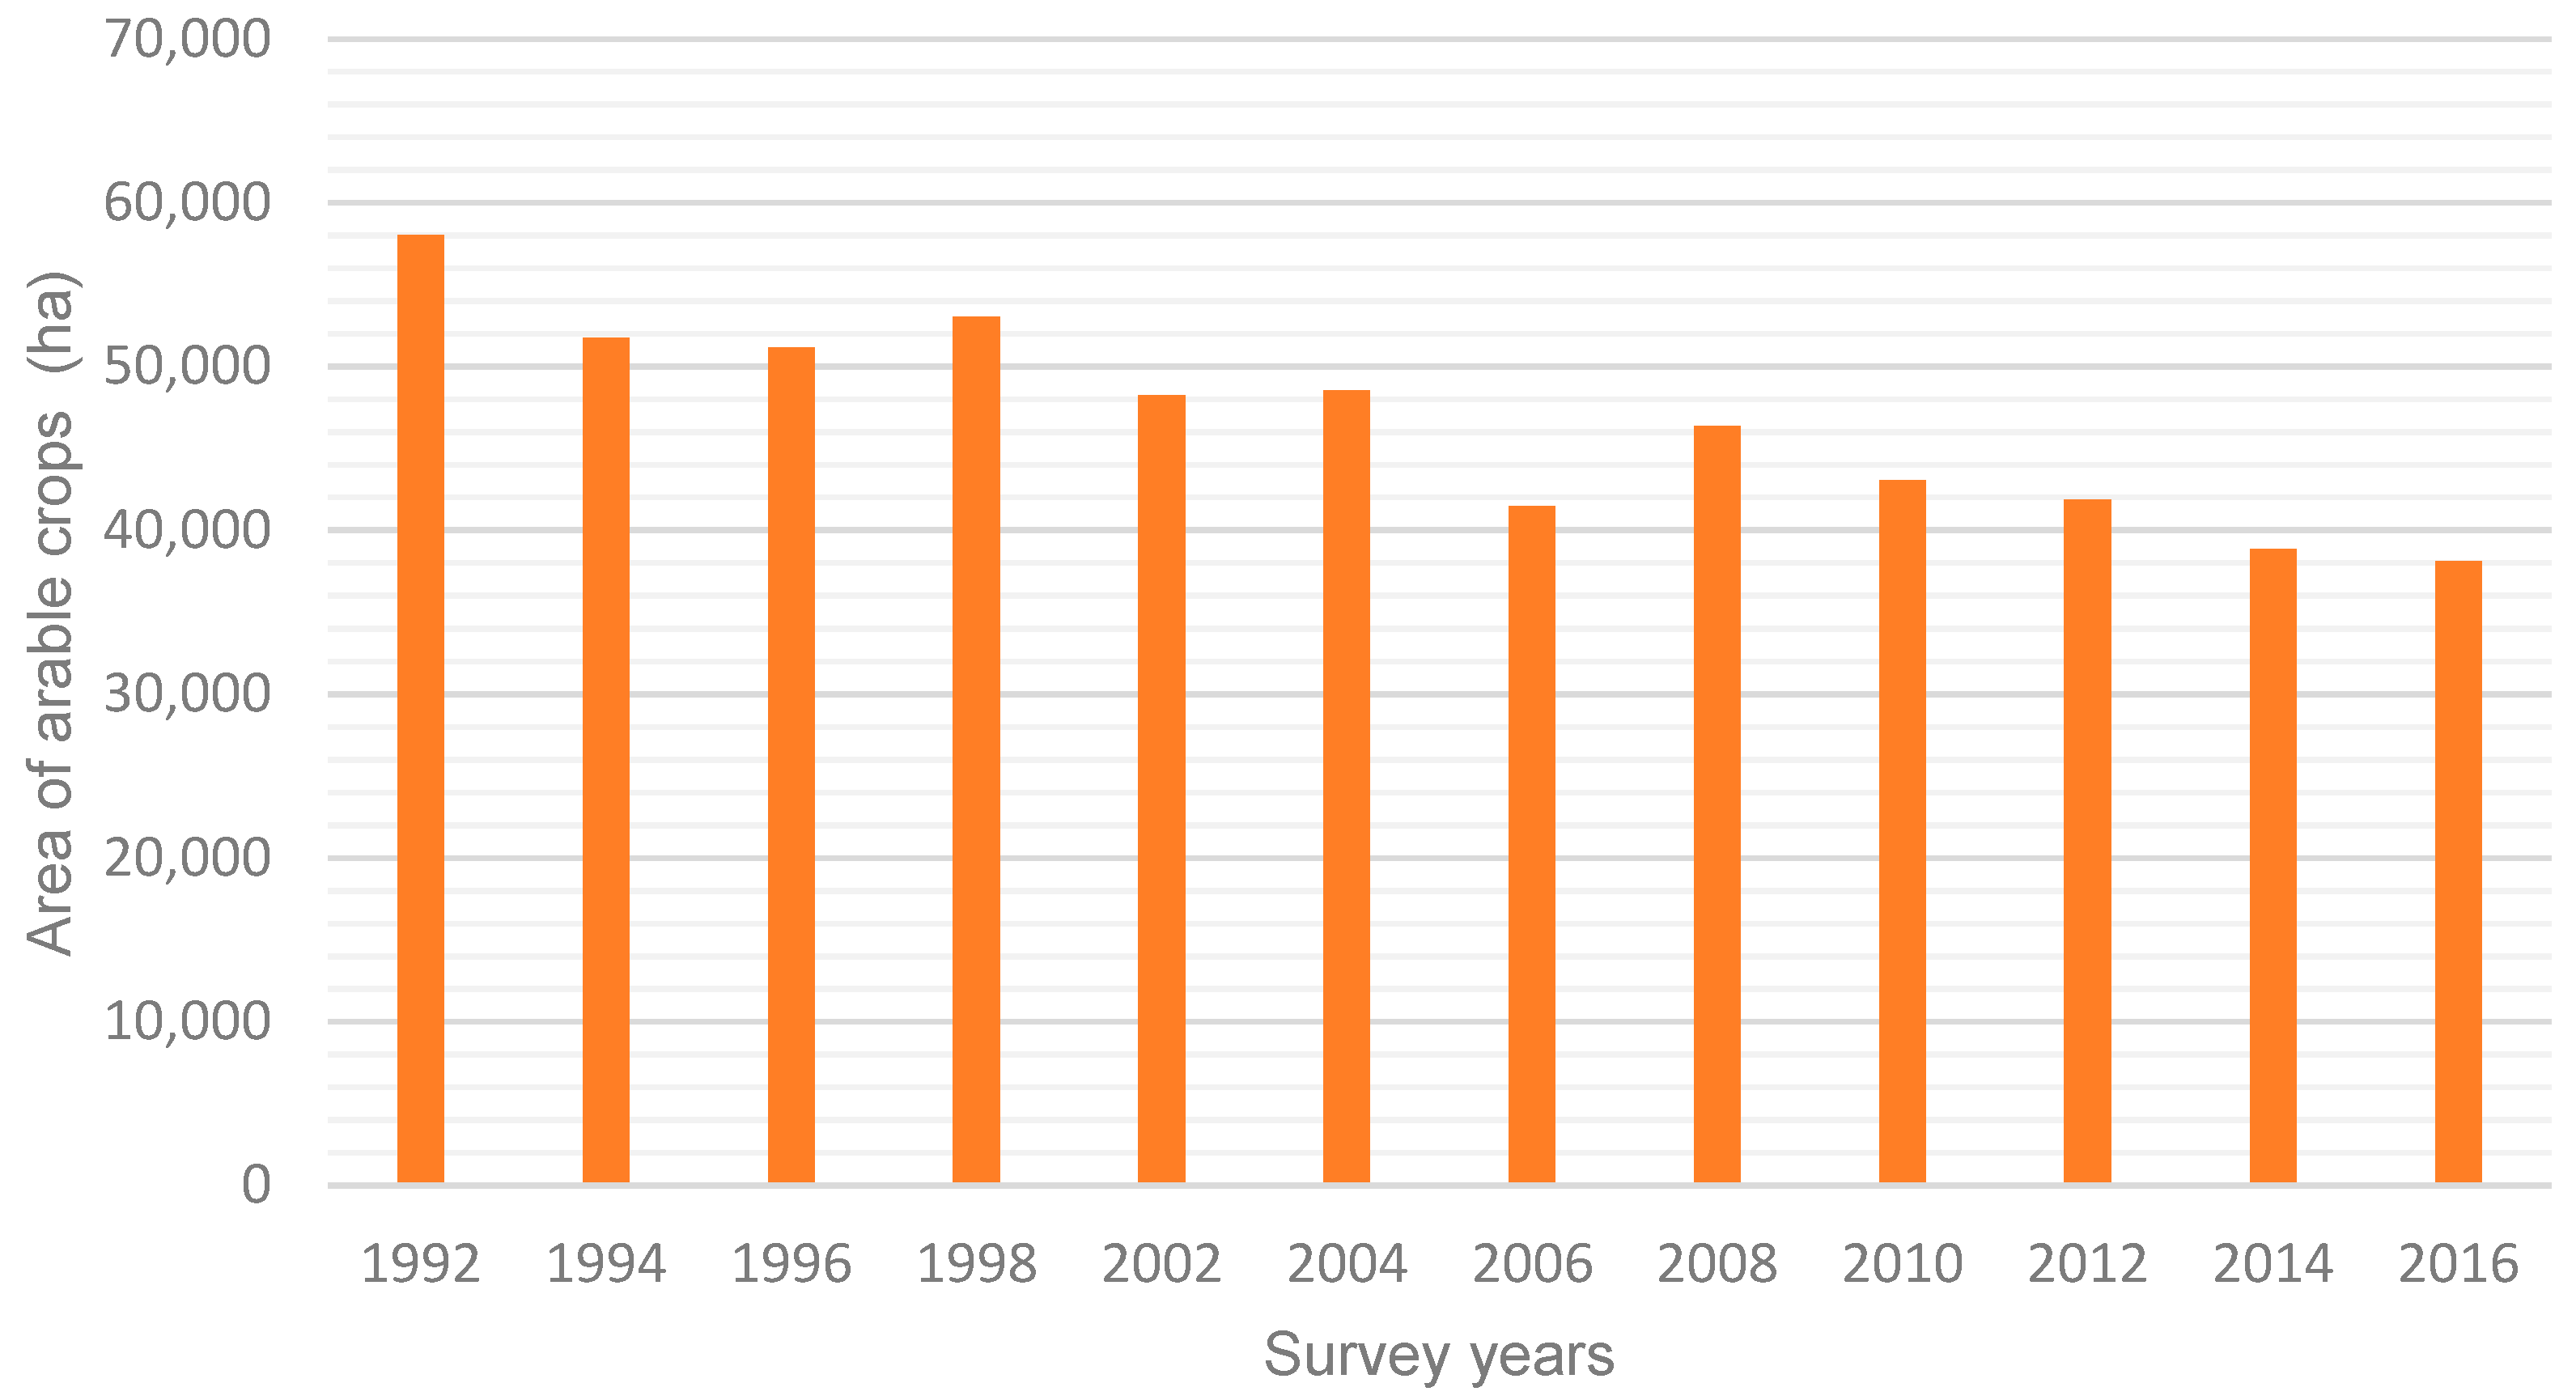
The number of arable farms in Northern Ireland declined during the study period by 61% (Figure 1), with the largest decrease recorded within the smaller size groups. The total area of arable crops grown in Northern Ireland in 2016 was 38,082 ha; the lowest cropping area recorded, representing a 34% reduction compared to that recorded in 1992 (Figure 2). The area of potato crops grown declined from 11,124 ha in 1992 to 3737 ha in 2016, representing a 66% reduction, while the decline in total cereal crops grown was less from 47,750 ha to 33,439 ha, but still significant at 30% reduction.
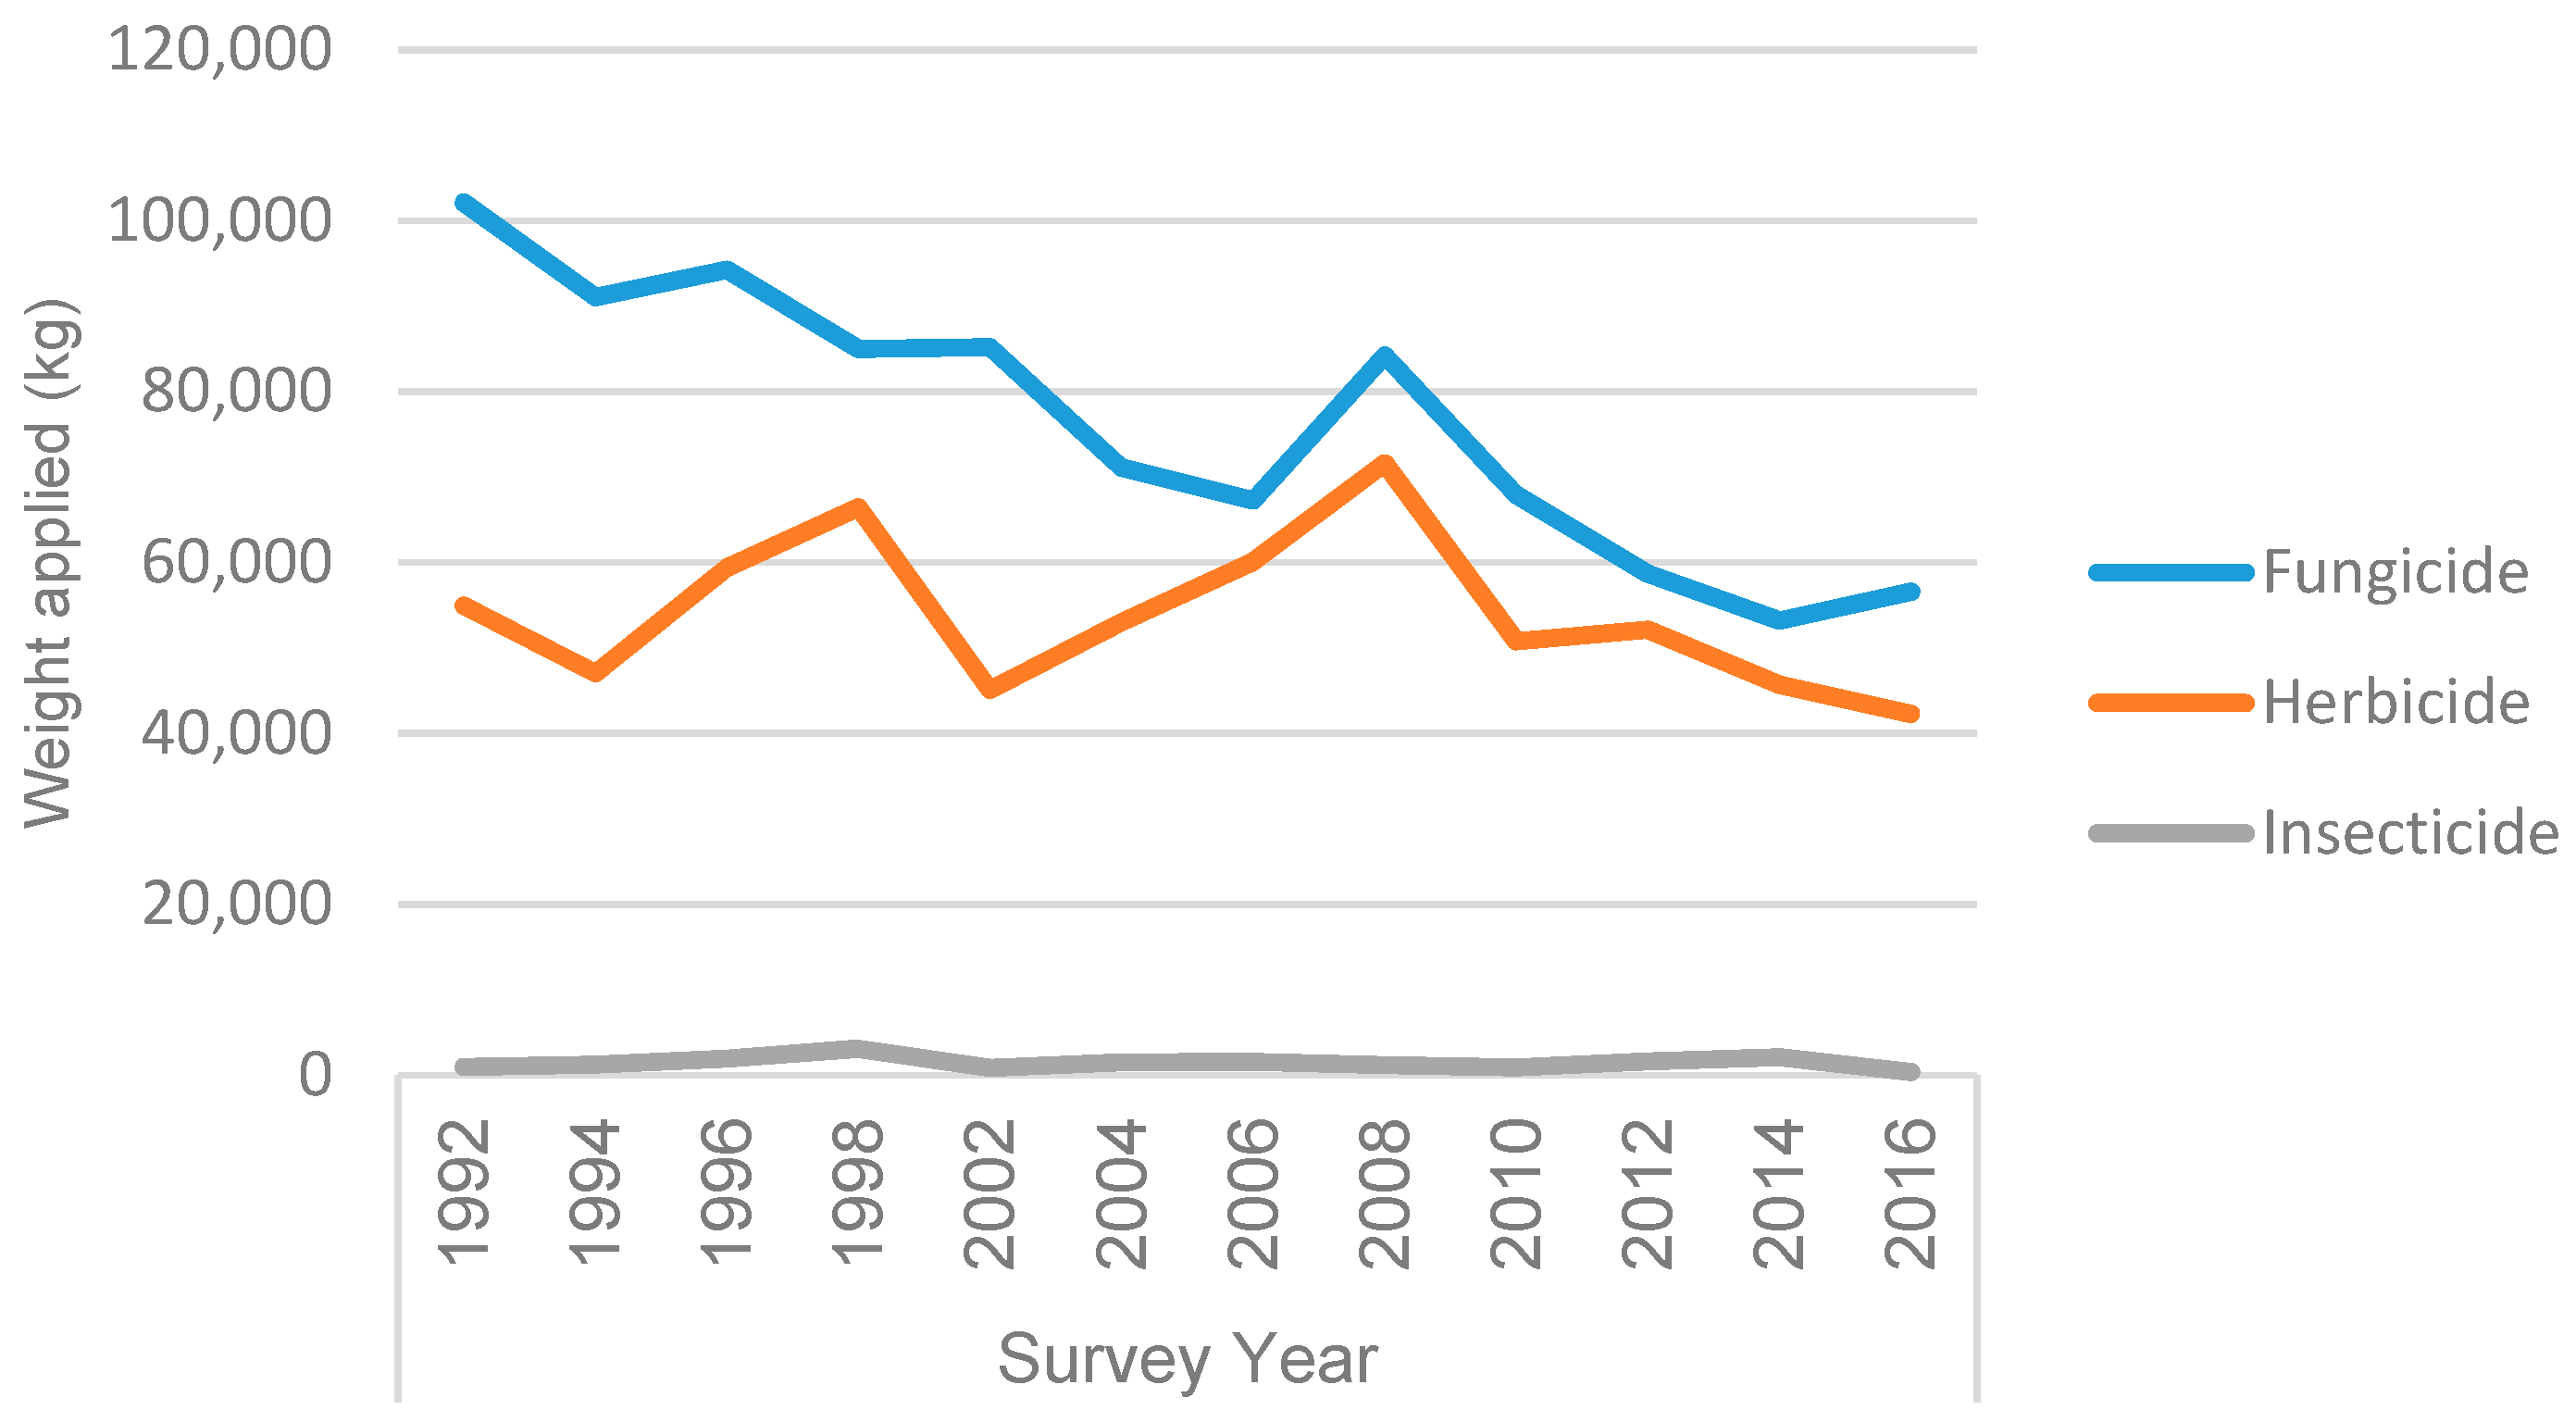
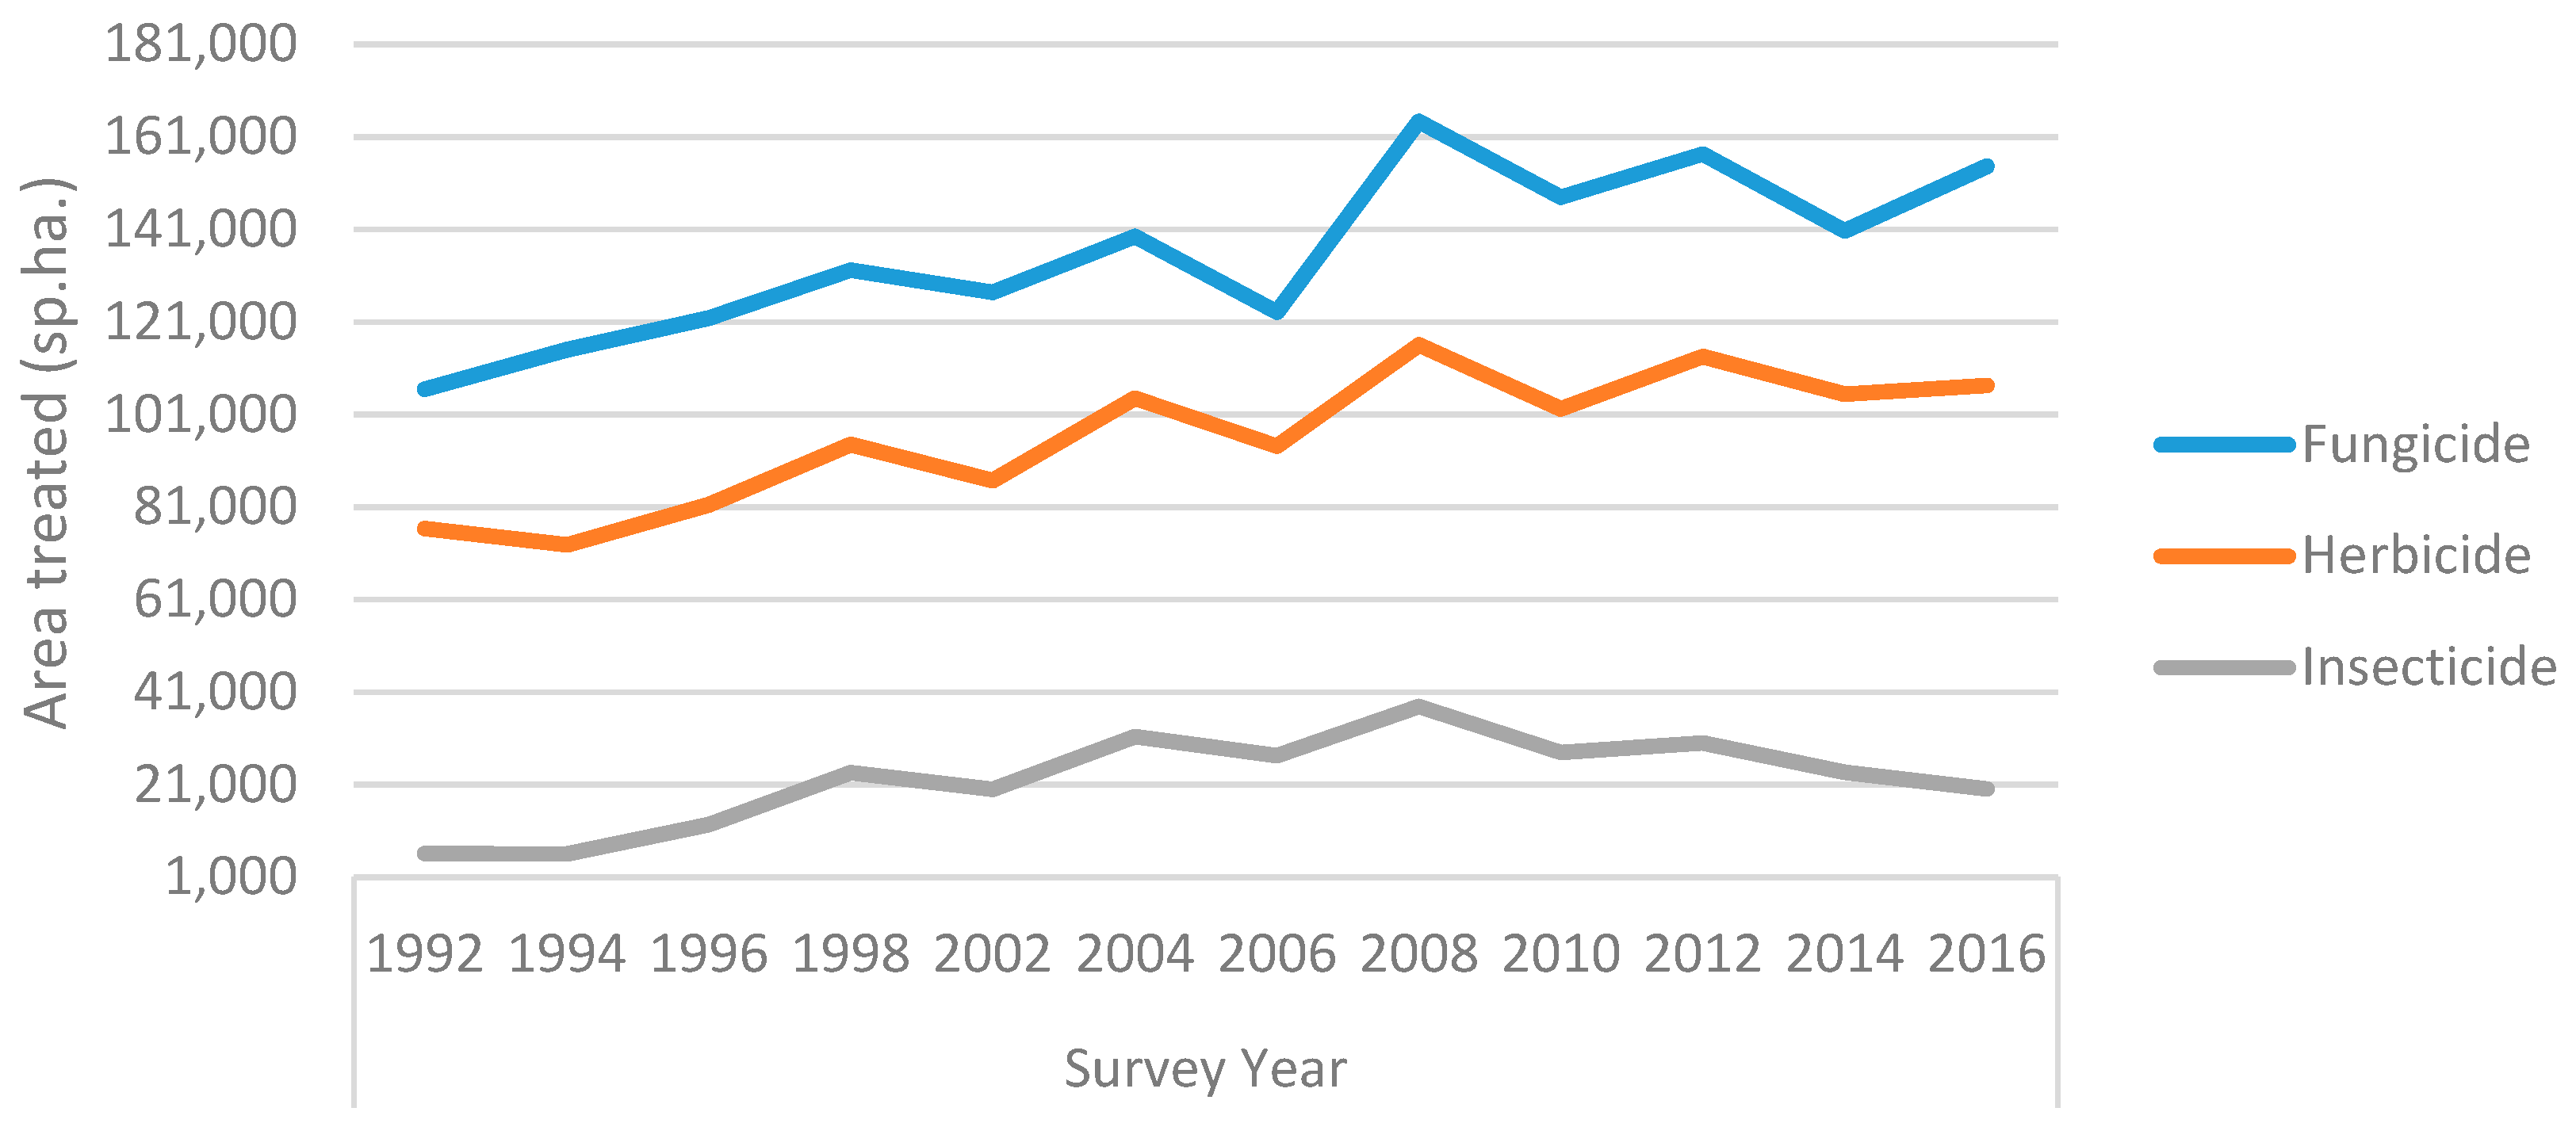
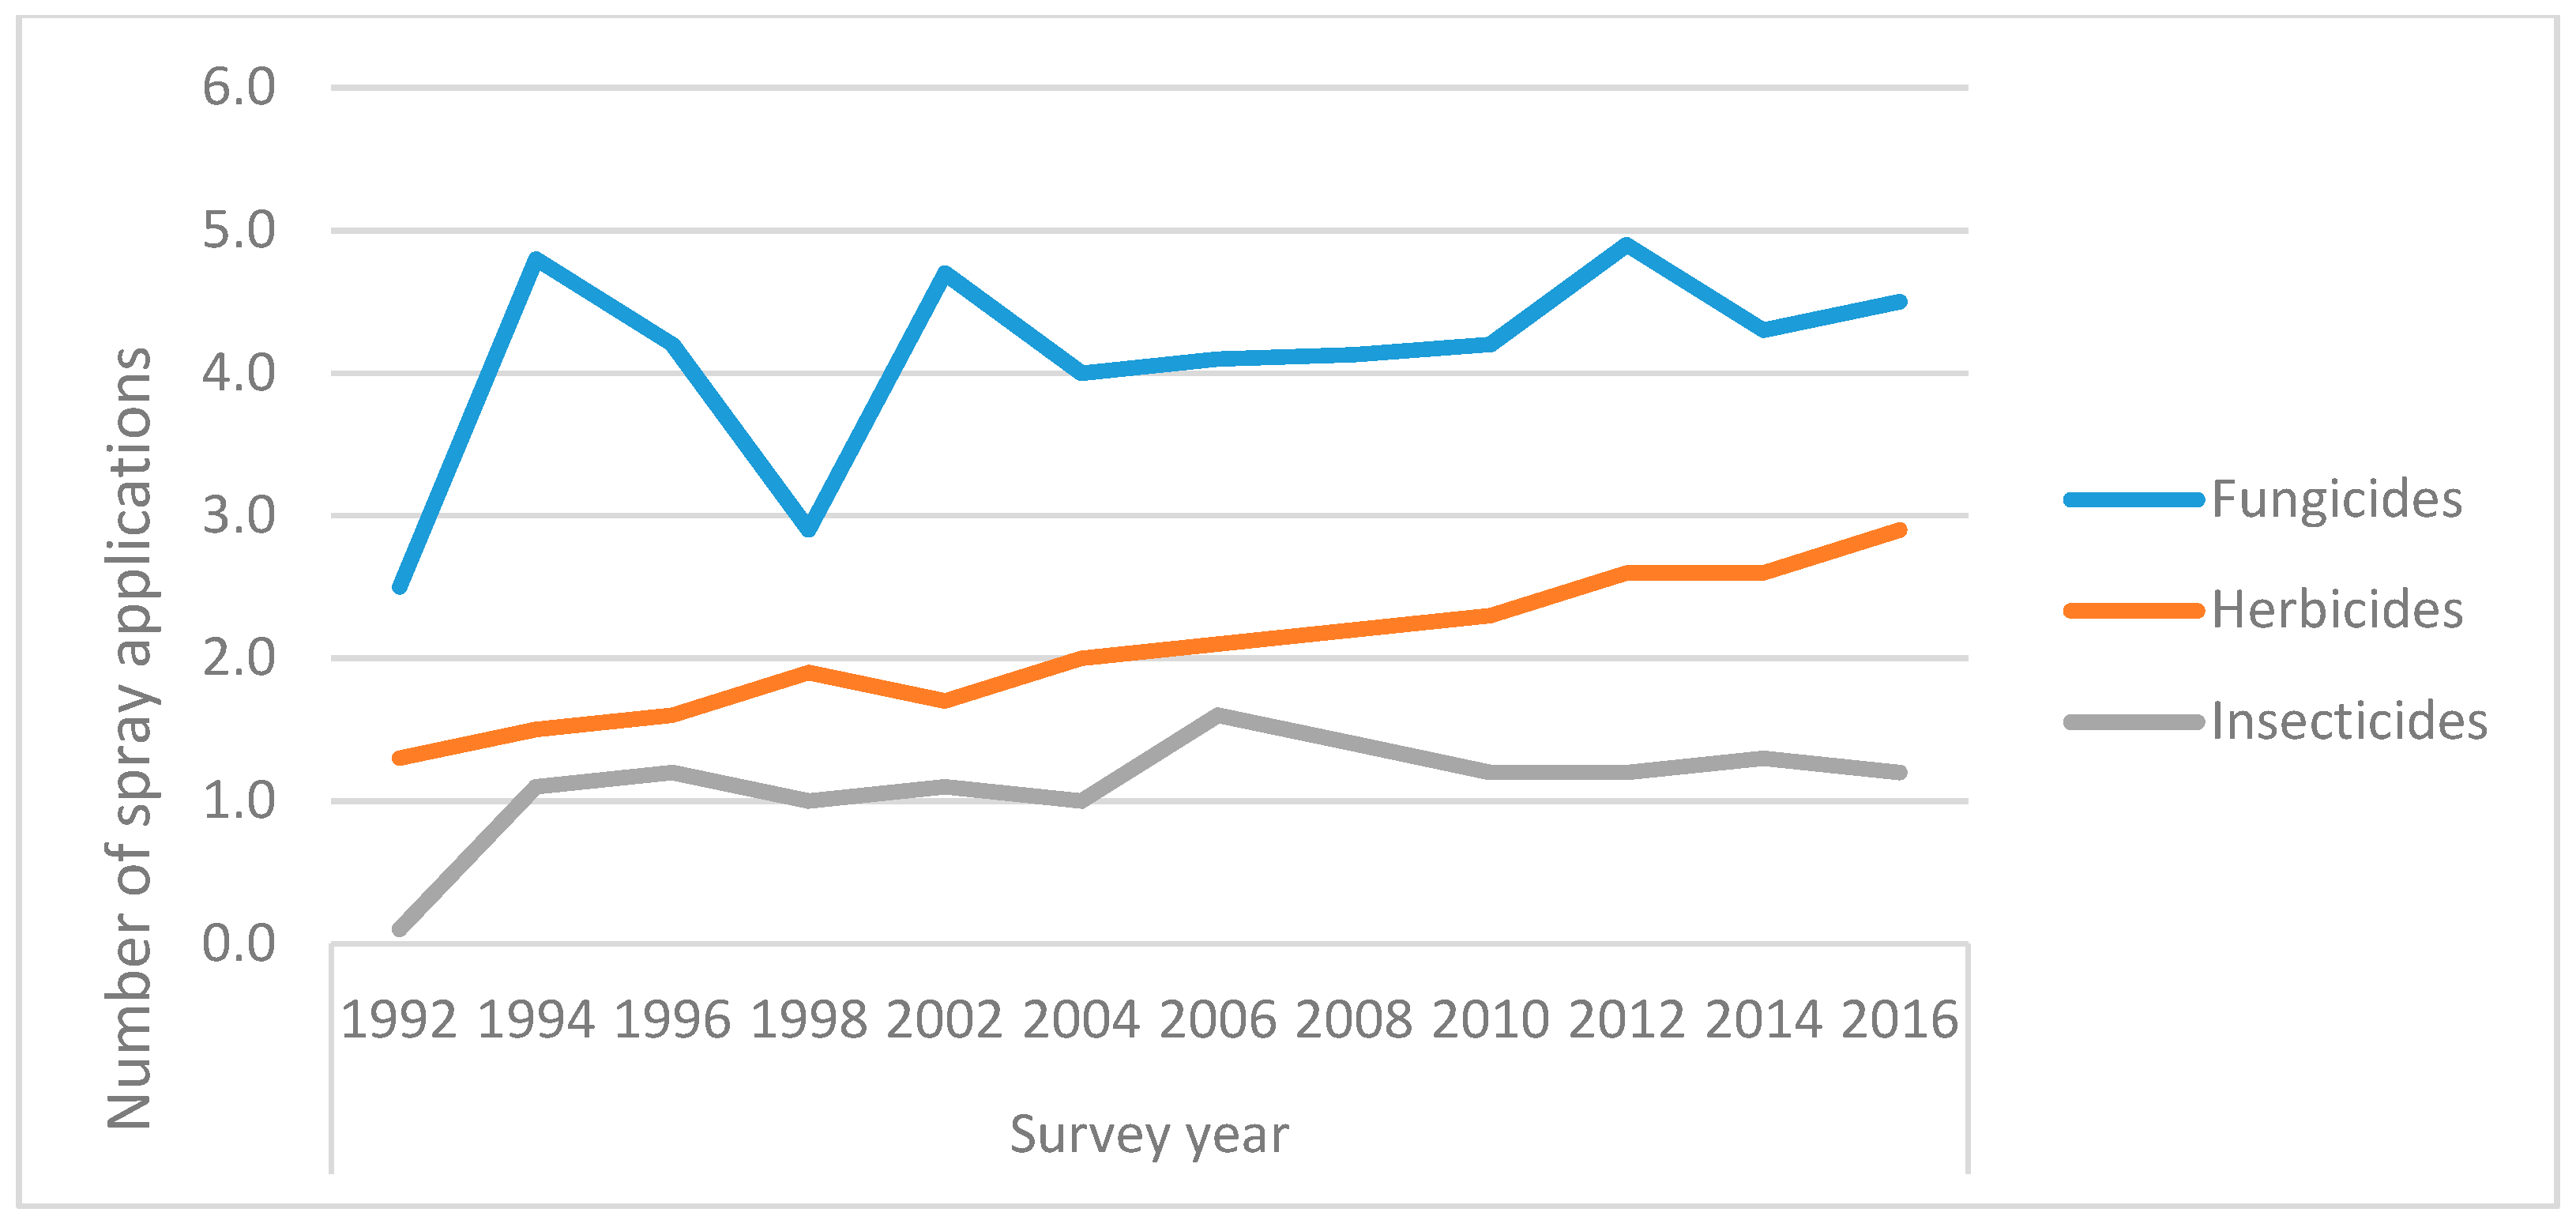
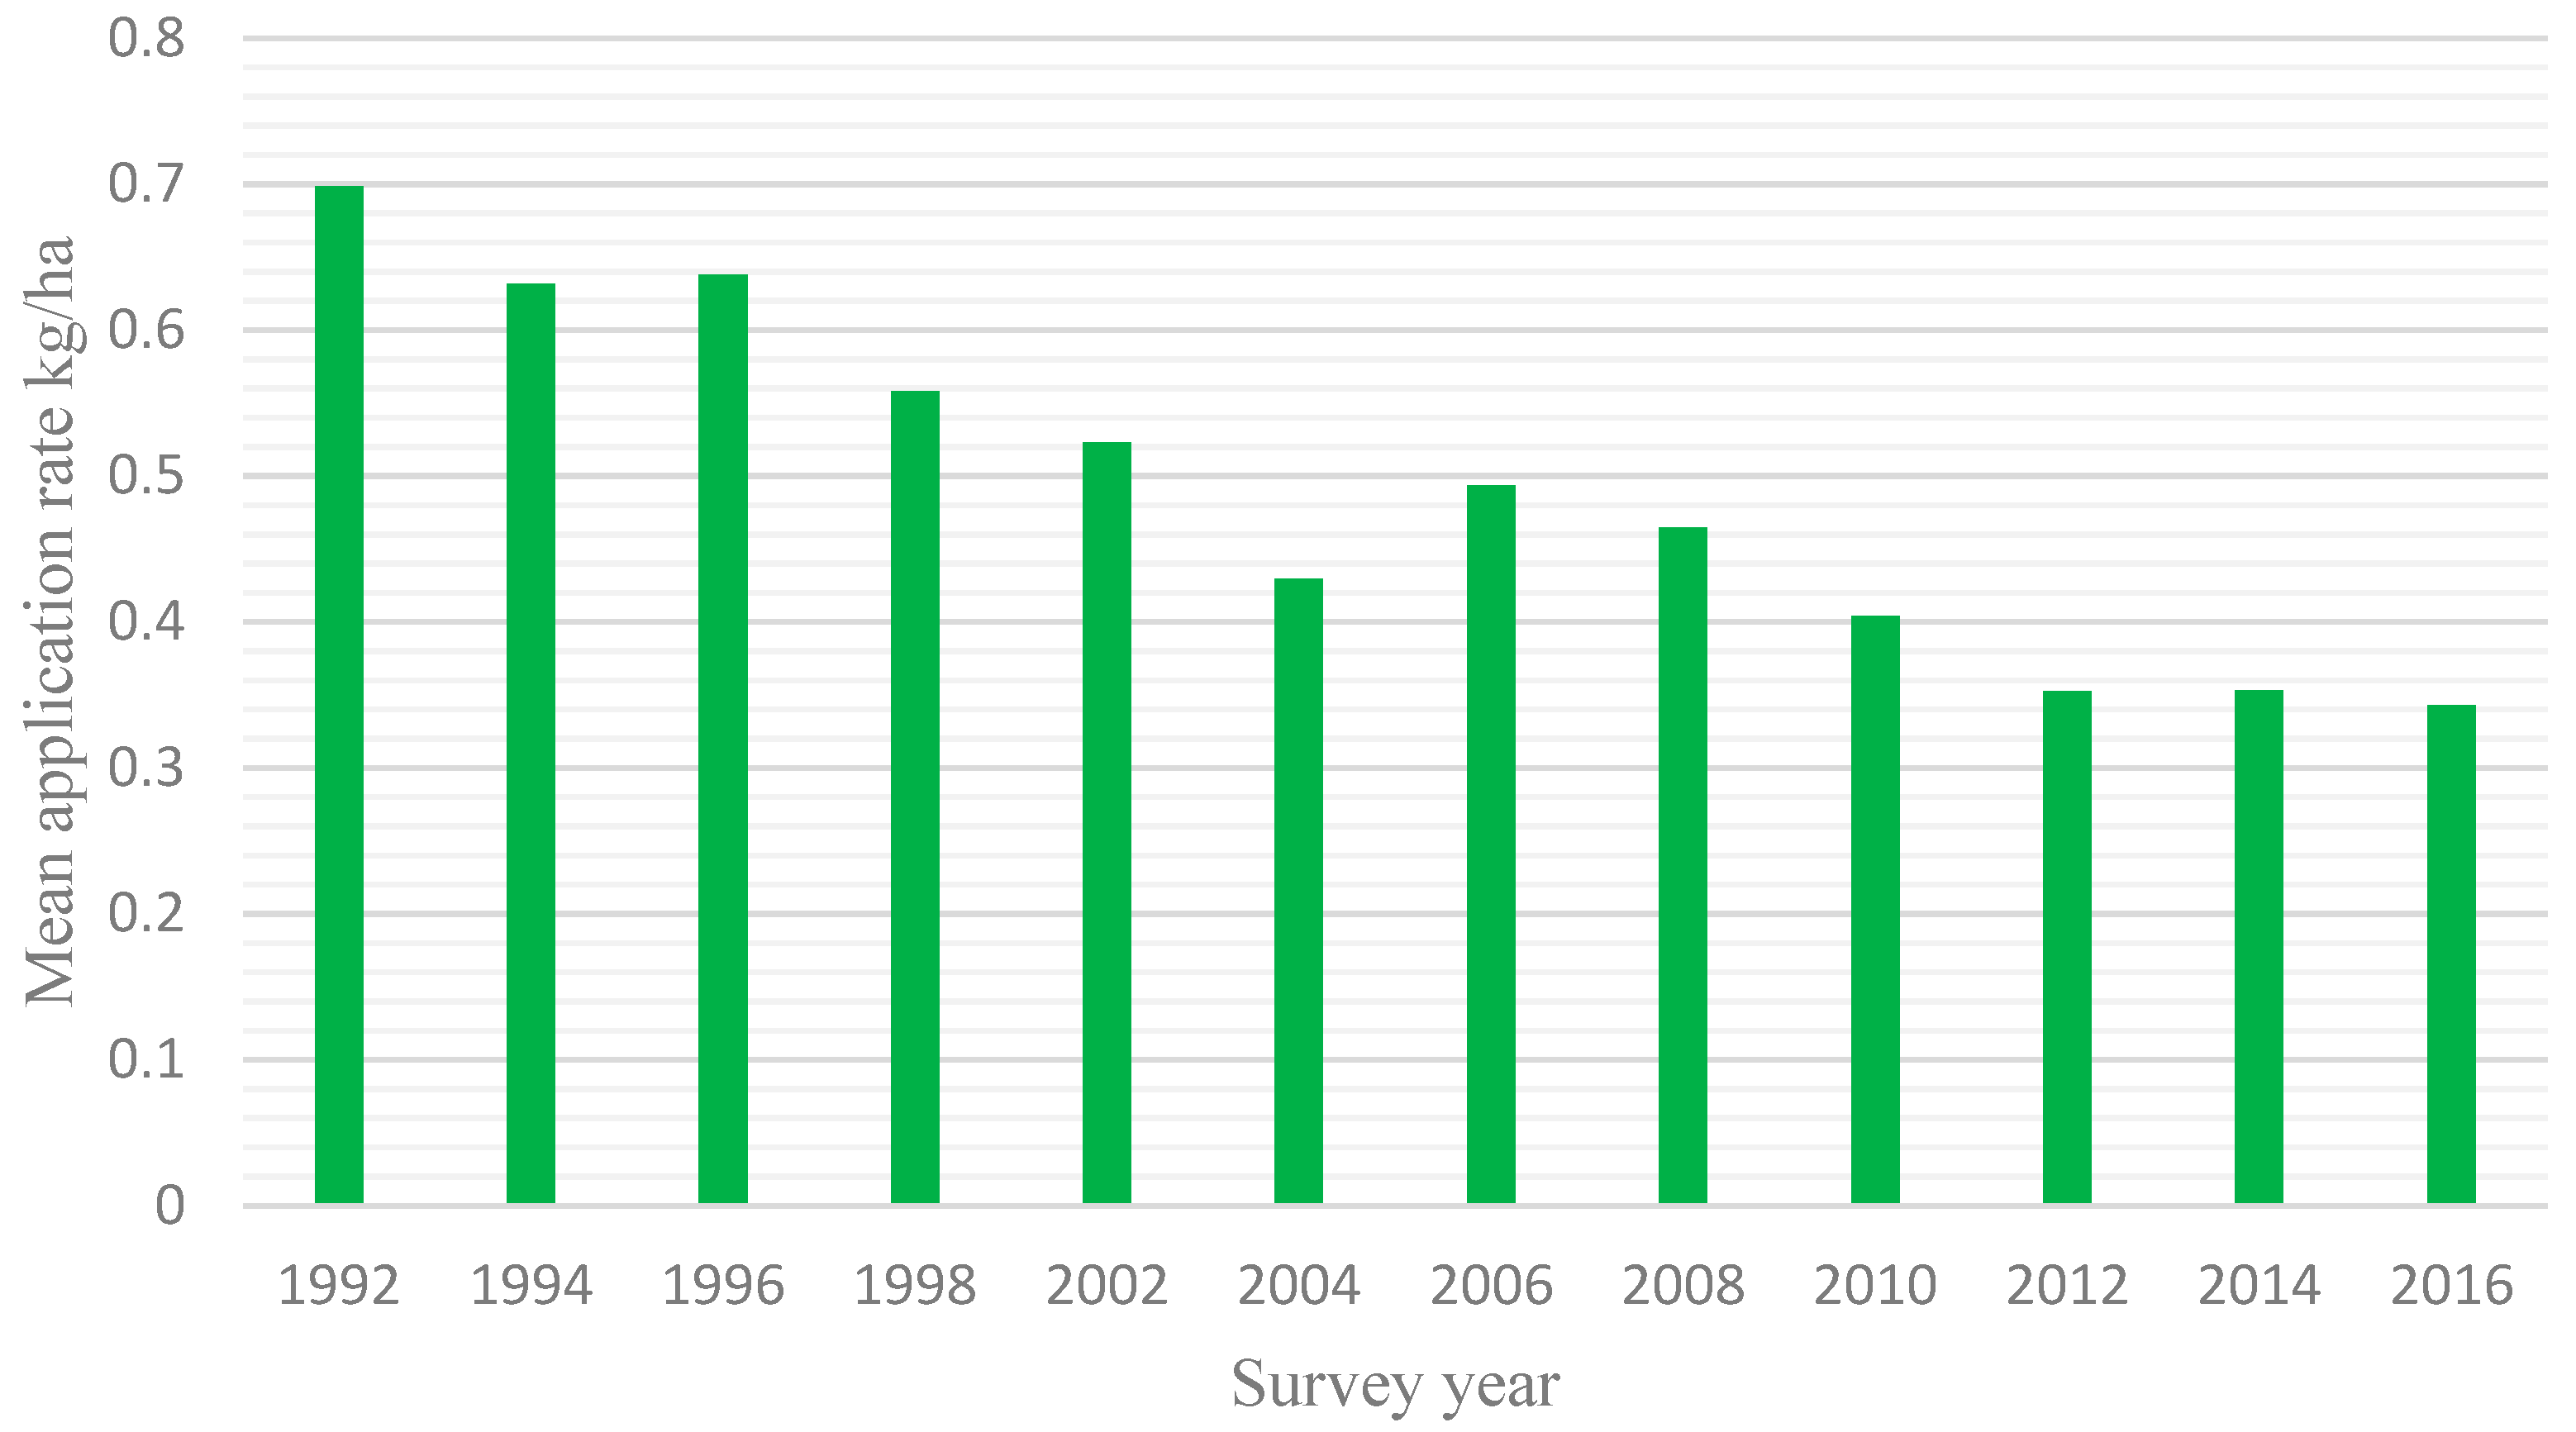
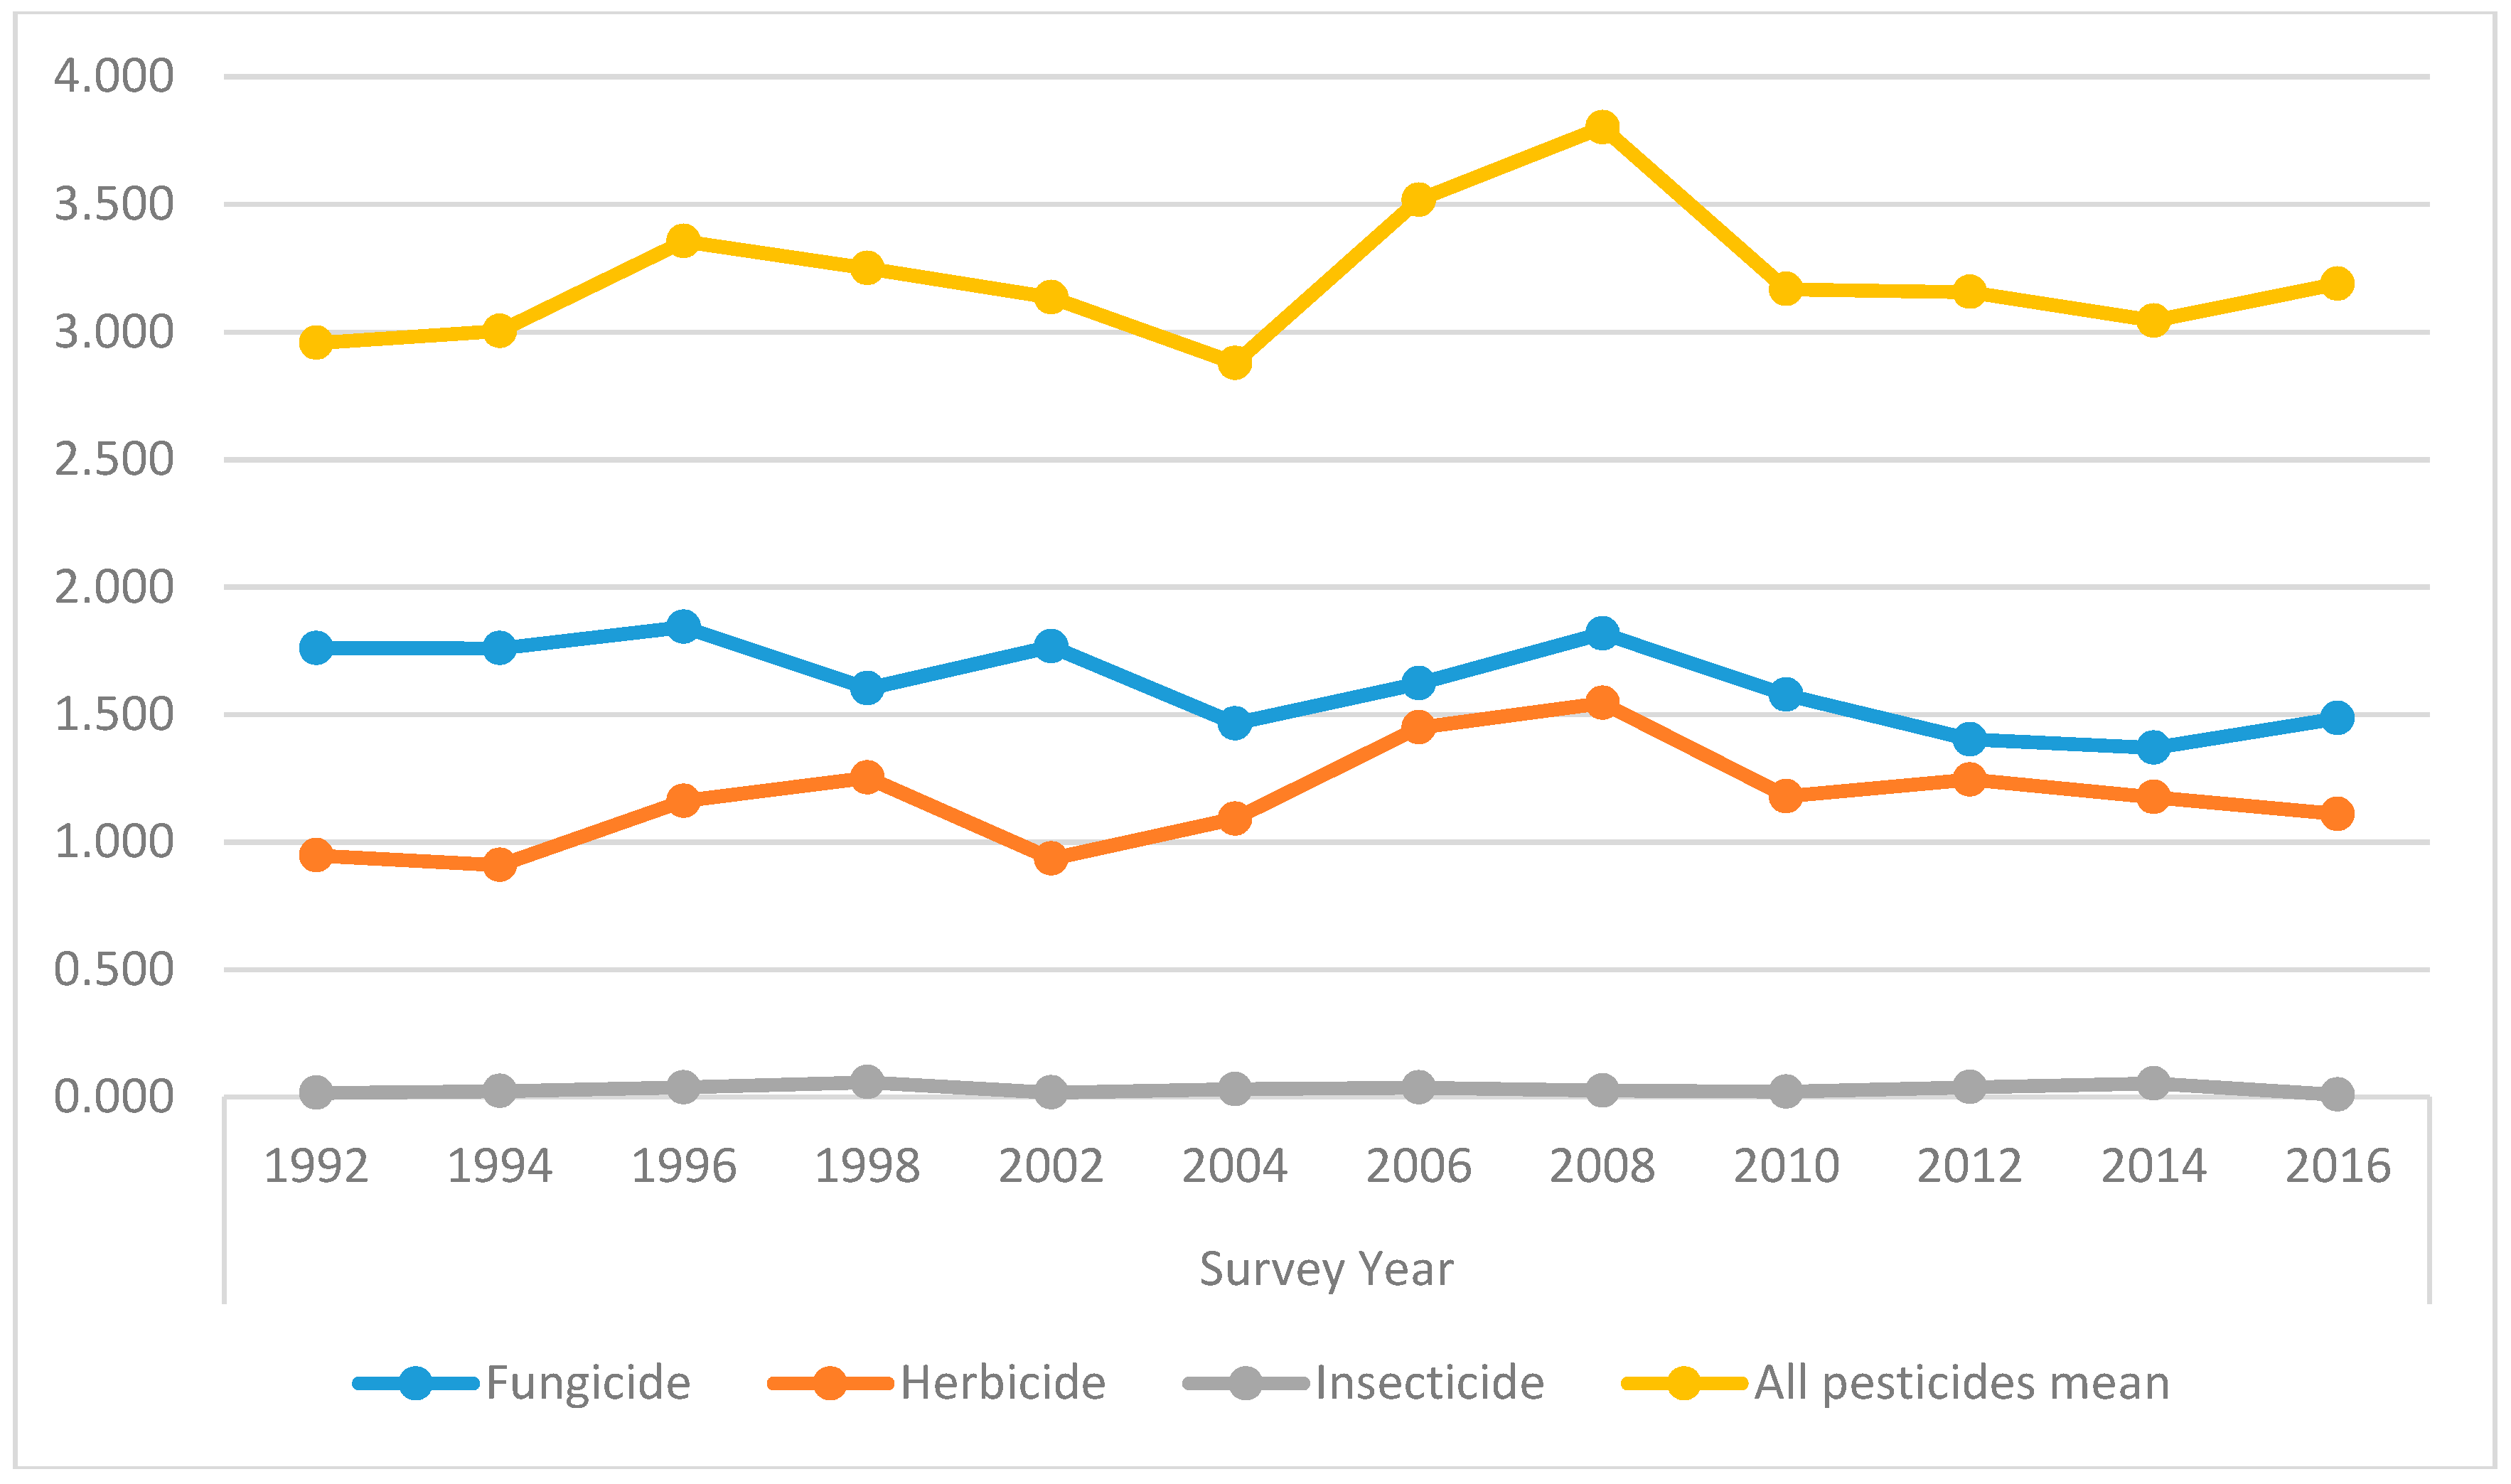
Since 1992, there has been a trend for a reduction in the weight applied of all the major pesticide groups, including fungicides, herbicides and insecticides (Table 3, Figure 3). By contrast, and despite the reduction in crop area, throughout this period, the area treated with these major pesticide groups increased, indicating that the number of pesticide applications has increased (Table 4, Figure 4 and Figure 5). The treated area includes repeated applications of all pesticide groups to the same crop area during the season and the units are expressed as spray hectares (sp.ha). Overall, application rates (kg/sp.ha.) for the major pesticide groups declined during the period by a mean of 51% (Figure 6). However, the intensity of pesticide application, that is, the quantity of pesticide applied to the basic area treated, remained relatively constant throughout the period, maintaining at a mean of 3.2 kg/ha across the major pesticide groups (Table 5, Figure 7).
Overall, occurrence of the principal active substances within the major pesticide groups that were applied throughout the study period has remained relatively consistent (Table 6). In general, their frequency of use, recorded by area of application (sp.ha.) increased unless they were superseded by a new active substance or discontinued due to regulation. The weight of these active substances applied during the study period also generally increased.
3.1. Fungicides
The damp, mild climatic conditions in Northern Ireland are conducive to the occurrence and development of microbial diseases that affect arable crops. Consequently, throughout the study period, the application of fungicide active substances predominated. Overall, the weight of fungicide active substances applied to arable crops during the study period decreased from 102 tonnes in 1992 to 56 tonnes in 2016, representing a 45% reduction (Table 3, Figure 3). However, throughout this period the area treated with fungicides increased by 45%, from 106,462 to 154,623 sp.ha. (Table 4, Figure 4). Application rates for fungicides during the study period decreased significantly from 0.96 to 0.37 kg/ha. However, the intensity of application measured by quantity of fungicide active substances applied to the basic treated area decreased from only 1.8 to 1.5 kg/ha (Table 5, Figure 7).
From 1992–2006, the dithiocarbamate fungicide mancozeb, used to control potato late blight (Phytopthora infestans (Mont.) de Bary) was the most common active substance applied to arable crops in Northern Ireland (Table 6). During this period, the area of potatoes grown in Northern Ireland declined by 57% from 11,124 ha to 4748 ha and the use of this active decreased in recent years. Nonetheless, to avoid resistance in local P. infestans populations, mancozeb was used in a control programme with other commonly used fungicide active substances including the dinitroaline, fluazinam, the cyanoacetamide oxime, cymoxanil, and the carbamate, propamocarb hydrochloride. Consequently, despite the significant reduction in the area of potatoes grown in Northern Ireland, these actives constitute a considerable proportion of the overall use of fungicides in arable crops in Northern Ireland.
More recently, application of the chlorophenyl fungicide chlorothalonil to control Rhynchosporium commune Zaffarano, B.A. McDonald & A. Linde on spring and winter barley and Zymoseptoria tritici (Roberge ex Desm.) Quaedvl. & Crous in spring and winter wheat has predominated. In addition, cereal disease control programmes are also reliant on the use of triazoles, including propiconazole, tebuconazole and increasingly, epoxiconazole and prothioconazole. These disease control programmes are designed to avoid resistance to any single or group of active substances.
3.2. Herbicides
In general, the total quantity of herbicide active substances applied during the study period decreased from 55 tonnes in 1992 to 42 tonnes in 2016, representing a 31% reduction in weight applied (Table 3, Figure 3). However, during this period, the area treated with herbicides increased by 40% from 76,347 to 107,240 sp.ha. (Table 4, Figure 4). While application rates for herbicide active substances decreased during the study period from 0.7 to 0.4 kg/sp.ha., mainly due to the increased use of sulphonylurea herbicides, the intensity of application increased marginally from 0.9 to 1.1 kg/ha (Table 5, Figure 7).
The most commonly used herbicide to control annual and perennial weeds before planting arable crops is the glycine derivative glyphosate. Owing to its broad spectrum and translocation activity, glyphosate superseded the bipyridilium herbicide paraquat in the late 1990′s. In addition, concerns regarding the relatively high mammalian toxicity of paraquat also contributed to increased use of glyphosate before the eventual withdrawal of approval for paraquat in 2008. The bipyridal herbicide diquat was also used for broad spectrum weed control in arable crops, but more specifically as a dessicant on potato crops, particularly before the introduction of sulphuric acid in 1991 and subsequent to its withdrawal in 2010.
Sulfonylurea metsulfuron-methyl remained one of the most commonly used selective herbicides, primarily in spring cereals, throughout the study period. The use of two other active substances from this group, thifensulfuron-methyl and tribenuron-methyl on cereals has also increased. Increases in the area of winter cereals grown throughout the study period also provided an increase in the use of the pyridine carboxamide herbicide diflufenican. The residual urea herbicide isoproturon was also commonly used on cereals until its withdrawal in 2009. Increased use of the pryridinecarboxylic acid herbicide fluroxypyr and the phenoxycarboxylic acid herbicide mecoprop-P was also observed. Use of the phenoxycarboxylic acid herbicide MCPA, in both cereal crops and grassland, declined from 1992.
3.3. Insecticides
Throughout 1992–1998, the use of insecticides, by weight applied, increased significantly from 0.9 to 3.1 tonnes. Subsequently, following a reduction to 0.8 tonnes in 2002, the weight of insecticide active substances applied generally increased to 2.1 tonnes in 2014 (Table 3, Figure 3). During the study period, 1992–2016, the area treated with insecticide increased significantly from 6,138 to 20,058 sp.ha (Table 4, Figure 4). Insecticide application rates remained relatively constant from 1992–1998 but decreased in 2002, remaining relatively low with the lowest rate recorded (0.02 kg/sp.ha.) in 2016. The intensity of application for insecticide active substances increased from 0.02 kg/ha in 1992 to 0.06 kg/ha in 1998 following which there was a notable decline between 2002 and 2016 (Table 5, Figure 7).
In general, the trend within insecticide application to arable crops indicated an increased use of pyrethroid insecticides, including the active substances esfenvalerate, lambda-cyhalothrin. The use of deltamethrin initially increased, but has declined in recent years while the use of alphacypermethrin was limited throughout the study period. The use of bifenthrin was sporadic until its withdrawal in 2013.
Chlorpyrifos was the principal organophosphate used, although the systemic organophosphates dimethoate and oxydemeton-methyl were used as aphicides in the early years, before the increased use of pyrethroids. Pirimicarb was the only carbamate active substance, which was also systemic and used principally for aphid control in arable crops.
3.4. Seed Treatments
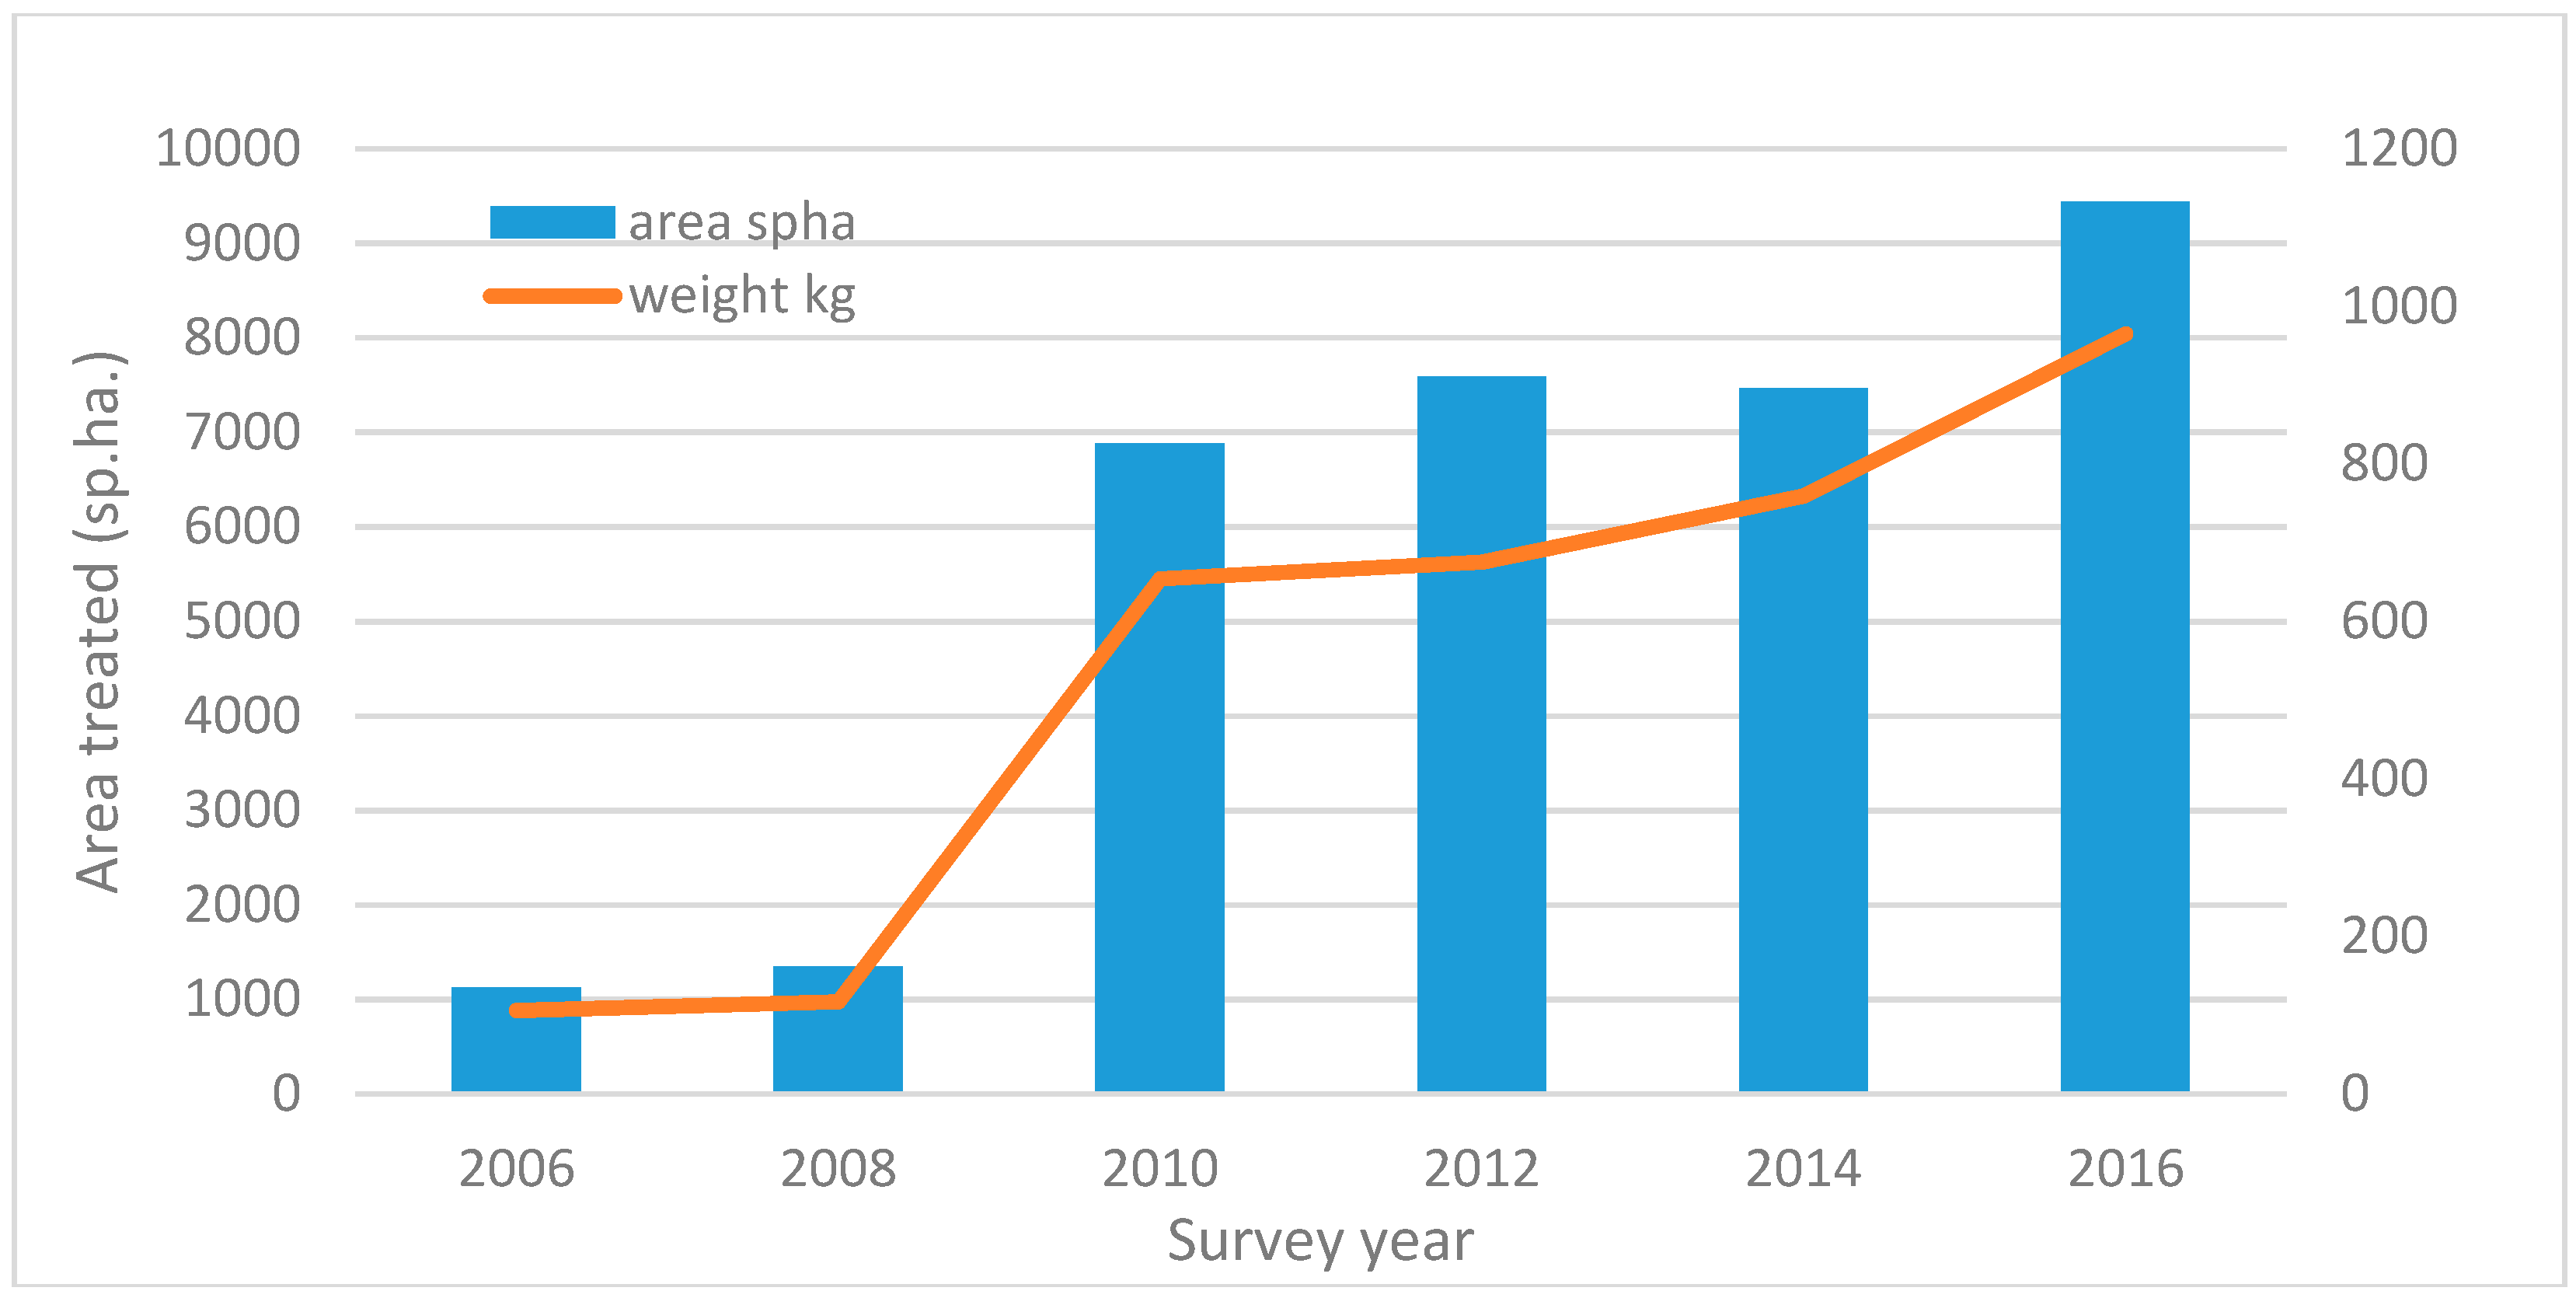
Overall, throughout the study period, seed treatments contributed relatively little to the total quantity of pesticides applied to arable crops in Northern Ireland (Table 3 and Table 4). Nonetheless, treated seed was sown across significant proportion of cereal crop areas and consequently, accounted for a more significant contribution the total pesticide-treated area of arable crops. Seed treatments were predominantly applied to spring and winter cereals and comprised mainly fungicide active substances and in 1992, before the revocation of mercury-based compounds, phenylmercury acetate was the most commonly applied active substance accounting for 63% of all seed treatments to arable crops. The only insecticide active substances in seed treatments at this time were the organochlorine HCH and the carbamate bendiocarb applied to 2% of seed-treated area. Subsequently, seed treatments comprised a range of fungicide active substances including the anilide carboxin, the conazole imazalil and the benzimidazole thiabendazole. The triazole tebuconazole and benzotriazine triazoxide were also used in formulation as were the guanidine guazatine and the conazole imazalil. After 1994, no insecticide active substances were included in seed treatments until 2006, when the pyrethroid betacyfluthrin and neonicotinoid imidacloprid were applied to oilseed rape and a formulation of the neonicotionoid clothianidin/ and triazole prothioconazole. Use of the latter formulation increased steadily to represent 28% of seed treatment applications by 2016 (Figure 8). Seed treatments containing fungicide active substances primarily comprised formulations of the conazoles prochloraz and triticonazole and the cyanopyrrole single active substance fludioxonil.
4. Discussion
Within Northern Ireland, data on pesticide usage from crop protection within agriculture have been recorded for almost three decades. In general, these data demonstrate that despite considerable legislation relating to pesticide use and subsequent regulation, both at EU and regional level that the number of pesticide applications to crop area has increased. In this particular study, this trend has occurred despite the reduction in area of arable crops grown. While an overall decrease in weights of pesticides applied was observed, the frequency of application and the area treated with pesticides has increased. The reasons for increased applications are likely to be due to a combination of factors. Europe-wide there has been a general trend towards greater farm specialization and, with it, more intensive production methods. For example, in Northern Ireland the proportion of larger size arable farms has increased from 11% to 19% (1992–2016), whilst the smaller more traditional mixed family farms, which tend to use less pesticide [6], have declined from 55% to 39%.
The apparent contradiction between the reduction in weight of pesticide applied and the increase in area sprayed may, in part, be explained by growers, throughout the study period, choosing to use lower pesticide application rates than those recommended by the pesticide manufacturers. This practice was particularly associated with active substances from what may be referred to as the older chemistry in all of the major pesticide groups. More pertinently, for more modern active substances, there was a trend for lower recommended application rates, reflecting the increased efficacy of novel active substances. For example, comparing test LD50s, the pyrethroid insecticide esfenvalerate is approximately 700 times more toxic to non-target honeybees (the standard ecological test species) compared to DDT, and the recommended application rate for insect pests is only 3.9 g per ha. This trend continued with the introduction of the neonicotinoids, pyridine and oxadiazone insecticides (all active below 0.1 kg/ha). Similarly, for herbicides there was a trend for reduced application rates with the transition from ureas and acid herbicides to the sulfonylureas and the acetolactate synthase (ALS) inhibiting herbicides. Also, for fungicides, the more novel active substances, including succinate dehydrogenase inhibitors (SDHI), the quinone outside inhibitors (QoI strobilurons) and the demethylation inhibitor (DMI) fungicides, including azoles are all applied at lower dose rates than the carbamate/dithocarbamate, morpholine and methyl benzimidazole carbamates that dominated in earlier decades. The average dose rates of this older chemistry also decreased, as they were applied below full rate alongside the new chemistry as it was introduced. In terms of environmental impact, what therefore needs to be considered is more the activity of the pesticidal ingredients, rather than the quantities applied per se. This point has recently been made by Goulson et al. [9] with respect to the environmental impact of insecticides. Although for other pesticide applications, the trade-off between multiple applications at a lower dose or fewer higher dose applications remain largely un-researched from an environmental perspective.
Active substances used for seed treatment were also largely fungicidal, and again, the developments in chemistry were similar to those for foliar applied fungicides, albeit from mercury-based compounds, through urea-based compounds the carbamate/dithocarbamate, morpholine and methyl benzimidazole carbamates to the azoles. The introduction of neonicotinoid seed treatments, imidacloprid and clothianidin in 2006 to oilseed rape and winter cereals was the first record of insecticide seed treatment following the withdrawal of approval for HCH seed treatments in 1992. While the concept of seed treatment provides efficient, economic and relatively effective pesticide use by application of limited quantities of pesticide to the total crop area, the prophylactic nature of these treatments does not conform to current integrated pest management methods and may lead to continual usage irrespective of pest densities and economic injury levels. In addition, seed treatments may pose a serious risk to non-target birds and mammals [10,11,12]. Moreover, the potential side-effects of the introduction of seed treatments with neonicotinoid active substances on vertebrates and invertebrates, particularly bees, are contentious [13,14,15,16,17,18] The rapid increase in the use of neonicotinoid seed treatments in Northern Ireland arable crops, particularly on winter wheat, following their introduction in 2006, was similar to that recorded by Douglas and Tooker [19] in the United States where these seed treatments were driving increased pre-emptive pest management in that region. In 2013, the EU severely restricted the use of plant protection products and treated seeds containing three of these neonicotinoids (clothianidin, imidacloprid and thiamethoxam) to protect honeybees. This restriction, which applied to flowering crops will now be extended, so that these insecticides may only be used on protected crops.
A notable statistic from this study is that the intensity of pesticide application, the quantity of pesticide applied to the basic treated crop area, has changed little over almost a quarter of a century despite considerable legislative regulation. Other regions in the UK have also established considerable pesticide usage databases throughout an even longer period. Pesticide usage monitoring in agriculture within Great Britain demonstrates a trend for increased pesticide application to arable crops from 1990–2016 [20] and overall agricultural and horticultural crops from 1990–2015 [9]. It is also notable during this period that certain active substances within each of the major pesticide groups have maintained their position within the list of most commonly used pesticides. Occasionally, throughout this period, use of active substances was limited or discontinued by regulatory action. Typically, this was in response to environmental or human health concerns that usually related to specific chemical groups. This was particularly relevant to insecticides as organochlorine compounds were superseded by organophosphates, which were subsequently replaced by synthetic pyrethroids and latterly the introduction of neonicotinoids.
European Union (EU) legislation relating to pesticide use has been in place for more than 40 years. In addition, within the UK, the Food and Environment Protection Act 1985 and the associated Control of Pesticides Regulations are intended to protect human, animal and environmental health from potential adverse effects of pesticides. These regulations also ensured that pesticides provided a consistent level of efficacy. However, in general, these regulations focused on the safe use of pesticides, requiring training and certification for users, which provided a more professional approach to crop protection. Subsequently, in 2006, the EU adopted a thematic strategy on the sustainable use of pesticides with the principal aim to promote sustainable use of pesticides within all member states. This strategy effectively comprised Regulation (EC) 1107/2009 relating to placing plant protection products on the market, Directive 2009/128/EC on the sustainable use of pesticides and Regulation (EC) 1185/2009 on the collection of pesticide usage data. It is also considered that Directive 2000/60/EC, which established a framework for Community action on water policy would also impact on the use of pesticides long-term [4]. In 2009, the EU adopted a “hazard-based” approach to the approval of active substances under Regulation 1107/2009. Hazard-based “cut-offs” for certain categories of substances, including carcinogens, mutagens, or reproductive toxicants and substances that are persistent in the environment were established. In addition, active substances with endocrine disrupting properties will be identified and subject to a hazard-based cut-off from marketing.
The principal objective of the revised European legislation on pesticides is to maintain and improve agricultural production while protecting human health and the environment by reducing the need for pesticide application. The fundamental change in EU policy on pesticides is the emphasis on the intrinsic hazard a pesticide poses rather than risk associated with its use in practice. Consequently, a considerable number of active substances have been scrutinised with regard to their inherent hazards, particularly with reference to their potential for endocrine disruption. As a consequence, the range of approved pesticides available for crop protection is diminishing leading to over-use of the remaining approved suite of active substances, which could result in increased pest and disease resistance. Furthermore, development of novel active substances by agro-chemical companies may be adversely affected if there is increased risk of commercial failure; although this may be offset in part by increasing investment in development of biopesticides. A study within the United Kingdom indicated that agri-environmental policy does not appear to have promoted the adoption of innovative, alternative and integrated pest management (IPM) strategies [21]. The study indicated that UK arable farmers were already using a range of techniques to control pest, disease and weed problems on their farms. In addition, very few farmers were reliant solely on chemical control strategies. More recently, a survey of UK arable farms indicated that, despite the implementation of national action plans required by EU legislation, a substantial proportion (30%) of arable growers are not familiar with the term integrated pest management (IPM), despite them being aware of, and adopting, various IPM practices on their farms [22].
In Europe, a number of pesticide use reduction strategies have been developed and tested by a number of member states. In 1986, Denmark introduced the first in a series of action plans for pesticide use reduction [23,24]. The first plan proposed that total pesticide consumption was to be reduced by 25% by 1992 and by 50% by 1997, and the use of less harmful products was to be encouraged. The reduction in pesticide use was to be achieved partly through advisory activities for farmers and intensified research on pesticide reduction methods. However, during the initial years of this plan, the use of pesticides continued to increase, as farmers failed to adopt advisory recommendations. In 1996, an ad valorem pesticide tax was introduced and while the tax increased in 1998, pesticide retailers reduced prices to mitigate the effects of the tax. Subsequent action plans introduced in 1997 and 2003 provided more specific targets, including treatment frequency indices for pesticides (mean number of times an agricultural plot may be treated annually) and the establishment of pesticide-free buffer zones adjacent watercourses. Initially, the treatment frequency index (TFI) was used as an indicator. Treatment frequency indicates the number times, on average, a conventionally utilised agricultural area can be sprayed with the amount of pesticides sold, and applied in standard dosages. Overall, in Denmark pesticide use has been reduced from a treatment frequency of 3.1 in 1990–1993 to 2.1 in 2001–2003. The quantities of pesticide sold have decreased by 50% since 1985, but this may also be a result of new low dose pesticides, particularly the sulphonylurea herbicides. Other countries in Europe that have introduced pesticide taxes as part of a pesticide reduction plan include France, Norway and Sweden. However, an analysis of experiences and developments of these schemes has demonstrated that overall, the effectiveness of pesticide taxes is limited, but if tax on a specific pesticide is sufficiently high, application and associated risks are reduced significantly [25]. Additionally, in all of these countries, the stockpiling of pesticides in advance of tax introduction or increases was observed. Consequently, short-term effects of tax introductions are smaller than long-term effects. The analysis also concluded that differentiated pesticide taxes that penalised the use of more hazardous substances were generally more effective, but could lead to increased application of less hazardous substances, which still posed an environmental risk, particularly with reference to occurrences in water.
Other European countries, including the Netherlands, Belgium, Switzerland and Italy have more recently been developing pesticide-reduction strategies, but without precise pesticide usage monitoring data, it is difficult to critically assess the effect of these strategies. In France, it has been demonstrated that reduced pesticide use rarely decreased productivity and profitably in arable farms [26]. Analysis of data from 946 non-organic arable farms with contrasting levels of pesticide use and a wide range of production systems failed to detect any conflict between low pesticide use and both high productivity and profitability in 77% of farms. It was estimated that pesticide use could be reduced by 42% without negative impact on production or profitability in 59% of farms. This was equivalent to an average reduction of 37, 47, and 60% of herbicide, fungicide and insecticide use respectively.
In the USA, a study of pesticide use on 21 selected major crops between 1960–2008 demonstrated considerable changes throughout almost five decades [27]. Overall, total pesticide use tripled between 1960 and 1981. This early increase was primarily driven by herbicide use on all major crops, which increased more than ten-fold. By contrast, insecticide use declined marginally with only slight increases in fungicide application. By 1980, the increase in herbicide use stabilised largely due to the fact that the major crops, corn, cotton and soybean were all treated with herbicide. In addition to wheat and potatoes, these crops, accounted for 89% of herbicide use and 83% of total pesticide use in 2008. Earlier studies by Pimental et al. [28,29,30] concluded that US overuse of pesticides caused serious public health problems and considerable damage to agricultural and natural ecosystems. These studies also suggested that pesticide use could feasibly be reduced by 50%. However, introduction of genetically modified, herbicide-tolerant (HT) characteristics in the mid-1990s were rapidly incorporated into all the major crops and by 2008, over 90% of soybean crops, 60% of corn crops and 70% of cotton crops were HT. Consequently, the use of glyphosate, at the expense of other herbicides and novel herbicide techniques, in this geographic region is unlikely to decline in the near future [31]. Furthermore, the rapid and widespread adoption of glyphosate-resistant crops has also led to the glyphosate resistance in weed populations and increased herbicide use in HT crops.
In recognition of the growing need for sustainable intensification in the USA, defined as increasing production while meeting high standards for sustainability in environmental, economic, and social terms, Ref. [32] considered that the pace of integration of organic and conventional production systems was proceeding slowly. Consequently, they proposed “middle-way” strategies that employ transdisciplinary research and development with the objective of agroecosystem aggradation to resolve the complex challenges within agricultural crop protection. These strategies deserve further serious consideration and assessment to evaluate their potential to provide sustainable intensification. Within this framework, there is also a need to educate both producers and consumers to accept less than complete control of pests and diseases during crop production, which consequently may mean cosmetically imperfect produce.
Data from pesticide usage monitoring in agriculture should provide governments with information to assist the formulation of policy on pesticide use in support of pesticide risk reduction and management within sustainable agricultural production. Pesticides are valuable and often essential tools in crop protection (e.g., it is doubtful whether potatoes and apple production in Northern Ireland would be commercially viable without fungicides). However, to avoid adverse environmental impacts, as well as prevent the development of pest and disease resistance, requires that they are used judiciously within the current regulatory framework. Baseline pesticide usage data should be used to analyse trends in crop protection, but more importantly to assist policy makers in evaluating the potential non-target impacts, including resistance, of pesticide use. The principal objective of this policy is to ensure the safety of operators, consumers, wildlife and the overall environment, both terrestrial and aquatic. Globally, food security is a primary concern in agriculture wherein sustainable crop protection and production are key elements. There is evidence that reduction targets for pesticide use have their place in the overall pesticide strategy, in which financial incentives and or penalties may also be incorporated. How this can be achieved without stifling the competitiveness of the agro-chemical industries and their capacity to develop new products is a major challenge. Nonetheless, this must also be accompanied by increased provision of independent agronomic advice that is underpinned by independent research and development on novel crop protection techniques.
Author Contribution
S.J. and D.I.M. conceived and designed the annual surveys and data catchment techniques used. M.K.L. conducted the fieldwork, including data catchment and computer input. D.I.M. provided data analyses. S.J. and A.K.M. wrote the paper.
Acknowledgments
We: the authors, wish to thank all of the growers who participated in annual surveys without whose co-operation completion of the research would not have been possible. We are also grateful for the invaluable assistance of Sally Kidd, Alan Withers and David Williams for their contribution to data collection and analyses. The manuscript was significantly improved subsequent to the revision and critical comments provided by Jackie Hughes, Science and Advice for Scottish Agriculture and Dave Garthwaite, FERA Science Ltd. We also acknowledge our funding providers, the Department of Agriculture, Environment and Rural Affairs, Northern Ireland and the Department of Environment, Food and Rural Affairs, Great Britain.
Conflicts of Interest
The authors declare no conflict of interest.
References
- Thomas, M.R. Pesticide usage monitoring in the United Kingdom. Ann. Occup. Hyg. 2001, 45, S87–S93. [Google Scholar] [CrossRef]
- Cutler, J.R. Review of Pesticide Usage in Agriculture, Horticulture and Animal Husbandry 1975–1979; Department of Agriculture and Fisheries (DAF) for Scotland: Edinburgh, UK, 1991.
- Jess, S.; McCallion, T.; Kidd, S.B.L. Pesticide Usage in Northern Ireland Survery Report 99 Grassland and Fodder Crops 1989; HMSO: London, UK, 1992.
- Jess, S.; Kildea, S.; Moody, A.; Rennick, G.; Murchie, A.K.; Cooke, L.R. European Union policy on pesticides: Implications for agriculture in Ireland. Pest Manag. Sci. 2014, 70, 1646–1654. [Google Scholar] [CrossRef] [PubMed]
- Turner, J.A.; Thomas, M.R. Analyses of fungicide optimisation potential in England and Wales through exploitation of wheat cultivar disease resistance. In Proceedings of the 7th International Congress on Plant Pathology, Edinburgh, UK, 10–14 September 1998. [Google Scholar]
- Thomas, M.R. Guidelines for The Collection of Statistics on the Usage of Plant Protection Products within Agriculture & Horticulture; Ministry of Agriculture, Fisheries & Food, Central Science Laboratory: Sand Hutton York, UK, YO4 1LZ; On behalf of The Eurostat Pesticide Statistics Task Force, OECD: Paris, France, 1999. [Google Scholar]
- Anon. Regulation (EC) No 1185/2009 of the European Parliament and of the Council of 25 November 2009 concerning statistics on pesticides. Available online: https://eur-lex.europa.eu/legal-content/EN/TXT/?uri=CELEX%3A32009R1185 (accessed on 9 May 2018).
- Anon. The Agricultural Census in Northern Ireland; Results for June 2016; HMSO: London, UK, 2017.
- Goulson, D.; Thompson, J.; Croombs, A. Rapid rise in toxic load for bees revealed by analysis of pesticide use in Great Britain. PeerJ Prepr. 2018, 6, e26856. [Google Scholar] [CrossRef] [PubMed]
- Wheeler, W.B.; Jouvenaz, D.P.; Wojcik, D.P.; Banks, W.A.; Vanmiddelem, C.H.; Lofgren, C.S.; Nesbitt, S.; Williams, L.; Brown, R. Mirex residues in nontarget organisms after application of 10–5 bait for fire ant control, northeast Florida—1972–74. Pest. Monit. J. 1977, 11, 146–156. [Google Scholar]
- Elliott, J.E.; Wilson, L.K.; Langelier, K.M.; Mineau, P.; Sinclair, P.H. Secondary poisoning of birds of prey by the organophosphorus insecticide, phorate. Ecotoxicology 1997, 6, 219–231. [Google Scholar] [CrossRef]
- Sánchez-Bayo, F. Impacts of Agricultural Pesticides on Terrestrial Ecosystems. Ecological Impacts of Toxic Chemicals; Bentham Science: Dubai, UAE, 2011. [Google Scholar]
- Goulson, D. An overview of the environmental risks posed by neonicotinoid insecticides. J. Appl. Ecol. 2013, 50, 977–987. [Google Scholar] [CrossRef]
- Gibbons, D.; Morrissey, C.; Mineau, P. A review of the direct and indirect effects of neonicotinoids and fipronil on vertebrate wildlife. Environ. Sci. Pollut. Res. 2015, 22, 103–118. [Google Scholar] [CrossRef] [PubMed]
- Henry, M.; Cerrutti, N.; Aupinel, P.; Decourtye, A.; Gayrard, M.; Odoux, J.-F.; Pissard, A.; Rüger, C.; Bretagnolle, V. Reconciling laboratory and field assessments of neonicotinoid toxicity to honeybees. Proc. Biol. Sci. 2015, 282, 1819. [Google Scholar] [CrossRef] [PubMed]
- Pisa, L.W.; Amaral-Rogers, V.; Belzunces, L.P.; Bonmatin, J.M.; Downs, C.A.; Goulson, D.; Kreutzweiser, D.P.; Krupke, C.; Liess, M.; McField, M.; et al. Effects of neonicotinoids and fipronil on non-target invertebrates. Environ. Sci. Pollut. Res. 2015, 22, 68–102. [Google Scholar] [CrossRef] [PubMed] [Green Version]
- Woodcock, B.A.; Isaac, N.J.B.; Bullock, J.M.; Roy, D.B.; Garthwaite, D.G.; Crowe, A.; Pywell, R.F. Impacts of neonicotinoid use on long-term population changes in wild bees in England. Nat. Commun. 2016, 12459. [Google Scholar] [CrossRef] [PubMed]
- Woodcock, B.A.; Bullock, J.M.; Shore, R.F.; Heard, M.S.; Pereira, M.G.; Redhead, J.; Ridding, L.; Dean, H.; Sleep, D.; Henrys, P.; et al. Country-specific effects of neonicotinoid pesticides on honey bees and wild bees. Science 2017, 356, 1393–1395. [Google Scholar] [CrossRef] [PubMed] [Green Version]
- Douglas, M.R.; Tooker, J.F. Large-scale deployment of seed treatments has driven rapid increase in use of neonicotinoid insecticides and pre-emptive pest management in U.S. field crops. Environ. Sci. Technol. 2015, 49, 5088–5097. [Google Scholar] [CrossRef] [PubMed]
- Anon. Pesticide Usage Survey Report. 271. 2018. Available online: https://secure.fera.defra.gov.uk/pusstats/ (accessed on 6 June 2018).
- Bailey, A.S.; Bertaglia, M.; Fraser, I.M.; Sharma, A.; Douarin, E. Integrated pest management portfolios in UK arable farming: Results of a farmer survey. Pest Manag. Sci. 2009, 65, 1030–1039. [Google Scholar] [CrossRef] [PubMed] [Green Version]
- Creissen, H.; Tranter, R.; Jones, P.; Burnett1, F.; Jess, S.; Girling, R.; Gaffney, M.; Thorne, F.; Kildea, S. IPM practices on arable farms in the UK and Ireland. In Proceedings of the Crop Production in Northern Britain, Dundee, Scotland, 27–28 February 2018. [Google Scholar]
- Nielsen, H. Danish Pesticide Use Reduction Programme: To Benefit the Environment and Health; Pesticide Action Network-Europe c/o PAN UK: London, UK, 2005 June. [Google Scholar]
- Neumeister, L. Pesticide Use Reduction: Strategies in Europe Six Case Studies; Pesticide Action Network Europe, PAN Europe: London, UK, 2007. [Google Scholar]
- Böcker, T.; Finger, R. European pesticide tax schemes in comparison: An analysis of experiences and developments. Sustainability 2016, 8, 378. [Google Scholar] [CrossRef]
- Lechenet, M.; Dessaint, F.; Py, G.; Makowski, D.; Munier-Jolain, N. Reducing pesticide use while preserving crop productivity and profitability on arable farms. Nat. Plants. 2017, 3, 1–6. [Google Scholar] [CrossRef] [PubMed]
- Fernandez-Cornejo, J.; Nehring, R.; Osteen, C.; Wechsler, S.; Martin, A.; Vialou, A. US Department of Agriculture, Economic Research Service. In Pesticide Use in US Agriculture: 21 Selected Crops 1960–2008; USDA Economic Research Service, Economic Information Bulletin 124; USDA: Washington, DC, USA, May 2014. [Google Scholar]
- Pimental, D.; Krummel, J.; Gallahan, D.; Hough, J.; Merrill, A.; Schreiner, I.; Vittum, P.; Koziol, F.; Back, E.; Yen, D.; et al. Benefits and costs of pesticide use in US food production. Bioscience 1978, 28, 772–784. [Google Scholar] [CrossRef]
- Pimental, D.; McLaughlin, L.; Zepp, A.; Lakitan, B.; Kraus, T.; Kleinman, P.; Vancini, F.; Roach, W.J.; Graap, E.; Keeton, W.S.; et al. Environmental and economic effects of reducing pesticide use. Bioscience 1991, 41, 402–409. [Google Scholar] [CrossRef]
- Pimental, D.; Acquay, H.; Biltonen, M.; Rice, P.; Silva, M.; Nelson, J.; Lipner, V.; Giordano, S.; Horowitz, A.; D’Amore, M. Environmental and economic cost of pesticide use. Bioscience 1992, 42, 750–760. [Google Scholar] [CrossRef]
- Beckie, H.J.; Hall, L.M. Genetically-modified herbicide-resistant (GMHR) crops a two-edged sword? An Americas perspective on development and effect on weed management. Crop. Prot. 2014, 66, 40–45. [Google Scholar] [CrossRef]
- Jordan, N.R.; Davis, A.S. Middle-way strategies for sustainable intensification of agriculture. Bioscience 2015, 65, 513–519. [Google Scholar] [CrossRef]
Figure 1.
The total number of arable farms in Northern Ireland 1992–2016.

Figure 2.
Total area of arable crops in Northern Ireland 1992–2016.

Figure 3.
The weight of the major pesticide groups applied to arable crops in Northern Ireland.

Figure 4.
The application area (sp.ha.) of arable crops in Northern Ireland treated with the major pesticide groups 1992–2016.
Figure 4.
The application area (sp.ha.) of arable crops in Northern Ireland treated with the major pesticide groups 1992–2016.

Figure 5.
The application frequency of the major pesticide groups to arable crops in Northern Ireland 1992–2016.
Figure 5.
The application frequency of the major pesticide groups to arable crops in Northern Ireland 1992–2016.

Figure 6.
The mean application rate (kg/ha) of the major pesticide groups to arable crops in Northern Ireland 1992–2016.
Figure 6.
The mean application rate (kg/ha) of the major pesticide groups to arable crops in Northern Ireland 1992–2016.

Figure 7.
Application intensity (kg/ha) of the major pesticide groups to arable crops in Northern.

Figure 8.
The application area treated (sp.ha.) and weight (kg) of neonicotinoid active substances applied as seed treatment to arable crops in Northern Ireland between 2006 and 2016.
Figure 8.
The application area treated (sp.ha.) and weight (kg) of neonicotinoid active substances applied as seed treatment to arable crops in Northern Ireland between 2006 and 2016.


Table 1.
A typical sampling frame for monitoring pesticide use in arable crops in Northern Ireland.
| Area of Arable Crops Grown (ha) | |||||||
|---|---|---|---|---|---|---|---|
| County | |||||||
| Size group | <2 | 2 < 5 | 5 < 10 | 10 < 20 | 20 < 40 | 40+ | Total |
| Antrim | A 51 | 146 | 130 | 85 | 57 | 27 | 496 |
| B 0 | 4 | 7 | 9 | 13 | 17 | 50 | |
| Armagh | A 18 | 63 | 76 | 46 | 29 | 29 | 261 |
| B 1 | 2 | 4 | 5 | 6 | 18 | 36 | |
| Down | A 98 | 242 | 224 | 176 | 112 | 100 | 952 |
| B 2 | 6 | 12 | 18 | 25 | 64 | 127 | |
| Fermanagh | A 1 | 3 | 1 | 1 | 1 | 1 | 8 |
| B 0 | 0 | 0 | 0 | 0 | 1 | 1 | |
| Londonderry | A 54 | 126 | 125 | 96 | 58 | 53 | 512 |
| B 2 | 3 | 7 | 10 | 13 | 33 | 68 | |
| Tyrone | A 16 | 71 | 58 | 51 | 25 | 13 | 234 |
| B 1 | 2 | 3 | 5 | 6 | 8 | 25 | |
| All counties | A 238 | 651 | 614 | 455 | 282 | 223 | 2463 |
| B 6 | 17 | 33 | 47 | 63 | 141 | 307 | |
A: Total number of farms in size category; B: Total number of farms sampled.
Table 2.
Definition of terms used in the presentation of pesticide usage data.
| Term | Definition | Units |
|---|---|---|
| Pesticide quantity applied | Total weight of all pesticide active substances applied to total treated crop area | kilograms or tonnes (kg or t) |
| Basic area treated | Crop area treated at least once with pesticide | hectares (ha) |
| Application area treated | Cumulative crop area treated with all pesticide active substances, including tank mixes and formulations | spray hectares (sp.ha.) |
| Application frequency | Ratio of application area treated: basic area treated | numeric |
| Application intensity | Total weight of all pesticide active substances applied to basic area treated | kg/ha or t/ha |
| Application rate | Weight of individual pesticide active substance applied to basic crop area | kg/ha |
Table 3.
The weight (kg) of the major pesticide groups applied to arable crops in Northern Ireland 1992–2016.
Table 3.
The weight (kg) of the major pesticide groups applied to arable crops in Northern Ireland 1992–2016.
| Survey Year | ||||||||||||
|---|---|---|---|---|---|---|---|---|---|---|---|---|
| 1992 | 1994 | 1996 | 1998 | 2002 | 2004 | 2006 | 2008 | 2010 | 2012 | 2014 | 2016 | |
| Fungicide | 102,115 | 91,034 | 94,225 | 84,970 | 85,205 | 71,128 | 67,256 | 84,238 | 67,880 | 58,699 | 53,195 | 56,576 |
| Herbicide | 54,954 | 47,046 | 59,371 | 66,454 | 45,071 | 53,004 | 60,101 | 71,596 | 50,754 | 52,122 | 45,693 | 42,275 |
| Insecticide | 957 | 1230 | 1954 | 3095 | 854 | 1513 | 1569 | 1176 | 931 | 1630 | 2088 | 358 |
| Molluscicide | 271 | 118 | 89 | 136 | 337 | 55 | 284 | 169 | 118 | 297 | 134 | 365 |
| Growth Regulator | 9354 | 10,859 | 12,844 | 13,185 | 16,818 | 11,704 | 12,629 | 17,001 | 14,330 | 16,585 | 14,758 | 18,230 |
| Other | 806 | 80 | 176 | 179 | 244 | 351 | 225 | |||||
| Seed treatment | 3771 | 5060.4 | 3034 | 3708 | 2820 | 2277 | 4028 | 1820 | 2091 | 2522 | 2018 | 3405 |
| Total | 171,481 | 155,348 | 171,517 | 172,354 | 151,185 | 139,681 | 145,868 | 176,177 | 136,283 | 132,100 | 118,237 | 121,434 |
Table 4.
The area of arable crops treated (sp.ha.) with the major pesticide groups in Northern Ireland 1992–2016.
Table 4.
The area of arable crops treated (sp.ha.) with the major pesticide groups in Northern Ireland 1992–2016.
| Survey Year | ||||||||||||
|---|---|---|---|---|---|---|---|---|---|---|---|---|
| 1992 | 1994 | 1996 | 1998 | 2002 | 2004 | 2006 | 2008 | 2010 | 2012 | 2014 | 2016 | |
| Fungicide | 106,462 | 115,000 | 121,833 | 132,212 | 127,435 | 139,474 | 123,125 | 164,339 | 147,957 | 157,255 | 140,704 | 154,623 |
| Herbicide | 76,347 | 72,831 | 81,472 | 94,511 | 86,682 | 104,539 | 94,148 | 116,029 | 102,211 | 113,487 | 105,371 | 107,240 |
| Insecticide | 6138 | 6036 | 12,348 | 23,588 | 20,023 | 31,421 | 27,255 | 37,910 | 27,974 | 30,030 | 23,689 | 20,058 |
| Molluscicide | 871 | 243 | 434 | 1061 | 1926 | 337 | 1237 | 1277 | 816 | 3642 | 1387 | 2712 |
| Growth Regulator | 10,594 | 12,836 | 13,953 | 16,298 | 17,445 | 16,559 | 19,572 | 22,408 | 23,983 | 31,670 | 31,265 | 36,271 |
| Other | 5128 | 828 | 103 | 322 | 210 | 664 | 633 | 315 | ||||
| Seed treatment | 44961 | 39026 | 38979 | 36083 | 34,836 | 32,968 | 30,298 | 36,756 | 34,184 | 38,098 | 32,167 | 32,997 |
| Total | 245,484 | 245,971 | 269,018 | 308,882 | 289,177 | 325,299 | 295,738 | 379,041 | 337,336 | 374,845 | 335,215 | 354,216 |
Table 5.
Application intensity (kg/ha) for the major pesticide groups applied to arable crops in Northern Ireland 1992–2016.
Table 5.
Application intensity (kg/ha) for the major pesticide groups applied to arable crops in Northern Ireland 1992–2016.
| 1992 | 1994 | 1996 | 1998 | 2002 | 2004 | 2006 | 2008 | 2010 | 2012 | 2014 | 2016 | |
|---|---|---|---|---|---|---|---|---|---|---|---|---|
| Pesticide group | ||||||||||||
| Fungicides | 1.76 | 1.76 | 1.84 | 1.60 | 1.76 | 1.46 | 1.62 | 1.82 | 1.58 | 1.40 | 1.37 | 1.48 |
| Herbicides | 0.94 | 0.90 | 1.16 | 1.25 | 0.93 | 1.09 | 1.44 | 1.54 | 1.18 | 1.24 | 1.18 | 1.11 |
| Insecticides | 0.02 | 0.02 | 0.03 | 0.05 | 0.01 | 0.03 | 0.03 | 0.02 | 0.02 | 0.04 | 0.05 | 0.01 |
Table 6.
The most commonly used active substances from the major pesticide groups 1992-2016, prioritised by treated area (sp.ha.).
Table 6.
The most commonly used active substances from the major pesticide groups 1992-2016, prioritised by treated area (sp.ha.).
| 1992 | 1994 | 1996 | 1998 | 2002 | 2004 | 2006 | 2008 | 2010 | 2012 | 2014 | 2016 | |||
|---|---|---|---|---|---|---|---|---|---|---|---|---|---|---|
| Fungicides | Chlorothalonil | 5482 | 6211 | 6030 | 4677 | 3001 | 14,906 | 16,542 | 32,170 | 27,696 | 29,413 | 30,356 | 34,026 | Increase |
| Prothioconazole | 12,775 | 20,030 | 19,475 | 30,026 | 28,531 | 30,184 | Increase | |||||||
| Epoxiconazole | 1113 | 4135 | 14,088 | 20,341 | 11,943 | 19,364 | 19,607 | 16,699 | 17,622 | 17,923 | Increase | |||
| Fluazinam | 2567 | 5137 | 16,161 | 12,797 | 16,733 | 13,894 | 19,560 | 17,109 | 16,106 | 10,637 | 11,747 | Increase | ||
| Propamocarb hydrochloride | 379 | 1150 | 2143 | 3904 | 6629 | 4616 | 14,759 | 15,818 | 9693 | 6135 | 11,335 | Increase | ||
| Tebuconazole | 3453 | 6804 | ,423 | 2999 | 5537 | 11,240 | 10,217 | 5465 | 11,707 | 9163 | 9627 | Increase | ||
| Mancozeb | 54,379 | 50,304 | 44,562 | 36,021 | 41,921 | 29,136 | 25,030 | 18,680 | 13,225 | 8291 | 8304 | 7757 | Decrease | |
| Fenpropimorph | 2895 | 2433 | 6259 | 6936 | 7875 | 11,902 | 8269 | 15,600 | 9612 | 7162 | 9178 | 7300 | Increase | |
| Cymoxanil | 1081 | 1631 | 3334 | 4591 | 15,108 | 9192 | 9438 | 10,186 | 7600 | 7285 | 3921 | 5184 | Increase | |
| Propiconazole | 14,655 | 15,532 | 12,628 | 11,259 | ,760 | 5148 | 9468 | 7556 | 4193 | 1671 | 1378 | 2129 | Decrease | |
| Fentin hydroxide | 12,663 | 17,589 | 10,787 | 19,353 | 9893 | ,075 | 856 | 0 | Decrease | |||||
| Herbicides | Glyphosate | 3520 | 4235 | 6489 | 12,588 | 12,396 | 21,879 | 22,073 | 25,919 | 21,459 | 29,261 | 24,150 | 22,619 | Increase |
| Diflufenican | 3811 | ,210 | 3775 | 3730 | ,513 | 2482 | 3441 | 5349 | 9882 | 11,033 | 13,656 | 14,777 | Increase | |
| Metsulfuron-methyl | 21,115 | 22,273 | 22,973 | 24,770 | 22,002 | 23,399 | 17,756 | 19,836 | 17,033 | 16,732 | 13,125 | 13,810 | Decrease | |
| Fluroxypyr | 1575 | 1633 | 2336 | 2236 | 2781 | 4792 | 3325 | 8230 | 9000 | 12,448 | 14,613 | 13,507 | Increase | |
| Mecoprop-P | 500 | 919 | 1312 | 2977 | 9028 | 6803 | 11,517 | 9079 | 9271 | 11,880 | 7762 | 8401 | Increase | |
| Tribenuron-methyl | 1071 | 1075 | 2280 | 3970 | 9157 | 14,136 | 12,105 | 11,113 | 9032 | 7926 | Increase | |||
| Diquat | 9008 | 5186 | 4998 | 5012 | 4404 | 7276 | 7552 | 11,056 | 9451 | 7541 | 6048 | 7584 | Decrease | |
| Thifensulfuron-methyl | 1207 | 2366 | 1823 | 2009 | 2276 | 2894 | 2993 | 4268 | 4742 | 5806 | 5854 | 4364 | Increase | |
| MCPA | 10,120 | 9755 | 7697 | 8938 | 5781 | 4079 | 2214 | 2725 | 1804 | 843 | 804 | 1348 | Decrease | |
| Isoproturon | 8151 | 8310 | 11,572 | 13,117 | 9230 | 11,791 | 12,679 | 15,209 | 939 | 166 | 235 | 179 | Decrease | |
| Paraquat | 10,381 | 7360 | 8298 | 6405 | 4859 | 5419 | 4918 | 1153 | 236 | 51 | 0 | Decrease | ||
| Insecticides | Esfenvalerate | 1097 | 2567 | 5070 | 8671 | 10,101 | 16,919 | 12,962 | 14,225 | 12,081 | 9561 | |||
| Lambda-cyhalothrin | 618 | 7446 | 8955 | 11,527 | 10,973 | 12,266 | 8903 | 8460 | 7476 | 8318 | ||||
| Chlorpyrifos | 275 | 446 | 1132 | 367 | 1140 | 2058 | 1763 | 1164 | 1163 | ,073 | 2445 | 335 | ||
| Deltamethrin | 256 | 433 | 549 | 763 | 1873 | 4864 | 702 | 1069 | 2178 | 737 | 452 | 289 | ||
| Dimethoate | 512 | 239 | 1627 | 1841 | 79 | 365 | 332 | 291 | 287 | |||||
| Pirimicarb | 111 | 167 | 520 | 488 | 594 | 1173 | 126 | 558 | 188 | 112 | 140 | 221 | ||
| Cypermethrin | 1497 | 2584 | 5286 | 4022 | 1418 | 1818 | 1545 | 4966 | 2254 | 2631 | 275 | 206 | ||
| Alpha-cypermethrin | 244 | 102 | 156 | 95 | 117 | 69 | 70 | 630 | 427 | 34 | ||||
| Unknown insecticide | 694 | 207 | 815 | 1238 | 180 | 89 | 74 | #N/A | ||||||
| Oxydemeton-methyl | 1391 | 858 | 138 | 0 | ||||||||||
| Bifenthrin | 778 | 148 | 599 | 151 | 1788 | 529 | 209 | 0 | ||||||
© 2018 by the authors. Licensee MDPI, Basel, Switzerland. This article is an open access article distributed under the terms and conditions of the Creative Commons Attribution (CC BY) license (http://creativecommons.org/licenses/by/4.0/).
Share and Cite
MDPI and ACS Style
Jess, S.; Matthews, D.I.; Murchie, A.K.; Lavery, M.K. Pesticide Use in Northern Ireland’s Arable Crops from 1992–2016 and Implications for Future Policy Development. Agriculture 2018, 8, 123. https://doi.org/10.3390/agriculture8080123
AMA Style
Jess S, Matthews DI, Murchie AK, Lavery MK. Pesticide Use in Northern Ireland’s Arable Crops from 1992–2016 and Implications for Future Policy Development. Agriculture. 2018; 8(8):123. https://doi.org/10.3390/agriculture8080123
Chicago/Turabian StyleJess, Stephen, David I. Matthews, Archie K. Murchie, and Michael K. Lavery. 2018. "Pesticide Use in Northern Ireland’s Arable Crops from 1992–2016 and Implications for Future Policy Development" Agriculture 8, no. 8: 123. https://doi.org/10.3390/agriculture8080123
Note that from the first issue of 2016, this journal uses article numbers instead of page numbers. See further details here.